Research on Spatial Correlation in Regional Innovation Spillover in China Based on Patents


School of economics and management, Shanxi University, Taiyuan 030006, China
*
Author to whom correspondence should be addressed.
Sustainability 2018, 10(9), 3090; https://doi.org/10.3390/su10093090
Submission received: 31 July 2018
/
Revised: 27 August 2018
/
Accepted: 27 August 2018
/
Published: 30 August 2018
(This article belongs to the Special Issue Economic Geography: Location, Innovation and Sustainable Development)
Abstract
:Regional innovation is very important for the sustainable development of regional economies. Innovation development between regions is not independent, and there is spatial correlation in innovation spillover. This paper uses the total amount of regional patent authorization as the measure of regional innovation and uses network analysis to study the spatial relationships among different regions. An unstructured vector autoregressive model is established to determine whether there is an association between any two regions, the causal relationship between which is tested by a Granger causality test. Having established the spatial network relationship, network analysis is used to further analyze the overall characteristics of the network, the individual characteristics of the network, and the block model of the network. We find that the provinces are closely related regarding regional innovation spillovers. However, the spatial correlation between the provinces differs greatly. Also, there is an obvious hierarchy between blocks that have different orientations and functions. Finally, the relationship between the interior of each block differs greatly in closeness degree.
1. Introduction
Regional sustainable development refers to the sustainable development within a certain region, which is the concrete reflection of general sustainable development in the region. In the process of regional sustainable development, we should consider not only the internal development of the region, but also the development among regions. Innovation is widely recognized as the key driver of social welfare and sustainable growth in regions and countries by which various problems in development can be solved, so as to achieve the goal of sustainable development [1,2]. Regional economy is the basic condition of regional sustainable development. Therefore, regional sustainable development will be considered from the perspective of regional economy in this paper. Nowadays, China′s economic development has entered a new stage wherein high-speed economic growth has changed into steady growth, and regional innovation has become an important driving factor for the sustainable development of regional economies. Innovation can create new industries and invigorate traditional industries to develop regional economies sustainably. It can also provide strong guarantees for the sustainable development of regional economies and can realize all the various technologies needed by new and traditional industries. In 2016, the Chinese government made a clear demand for the country to change its economic growth model; that is, it is necessary to create a new engine of economic development and cultivate a new economic growth point which is innovation driven [3]. As a result, during the past 20 years, the number of authorized patent applications in China increased from 45,064 in 1995 to 1,753,763 in 2016, an increase of more than 38 times [4]. There are two main reasons for this rapid development of the number of patents. One is large-scale research and development (R&D) investment. Research and development investment intensity in China reached 2.11% in 2016, 0.05% higher than in the previous year and exceeding 2% for three consecutive years, thereby surpassing the average level of 2.08% of the 15 EU countries [5]. The other reason is government support. The Chinese government has promulgated a series of policies and measures for patent protection and development, and provinces and municipalities also have corresponding subsidization policies for patents. All these measures have contributed greatly to the rapid growth of the number of patents in China. However, although the total number of patents has grown rapidly, this growth is not balanced among regions. The proportion among three regions—one eastern, one central, and one western one—changed from 4.52:0.93:1 in 1995 to 5.79:1.06:1 in 2016. Rather than narrowing, the gap between eastern and western regions has increased, which reflects differing regional innovation to a large extent. Does this mean that regional innovation accumulates and develops independently in each region, with no interrelations? Kauffeld-Monz used the method of network analysis to study the process of knowledge transfer between regions, which proved that regional innovation had spatial connection [6]. In fact, the Chinese government has long been aware of the problem of regional innovation differences, and has tried to narrow those differences through various measures including talent exchanges, technology outputs, and co-construction R&D platforms. The government has simply enhanced regional cooperation to help develop regional innovation. Such exchange opportunities or platforms connect each province to all manner of resources related to innovation, including personnel, capital, and technology. Therefore, regional innovation is believed to involve spatial correlation and influence among provinces. Our aim herein is to establish the spatial relationship between them through the method of network analysis.
As discussed in Section 2, the existing related literature contains two problems. First, previous research on spatial correlations among regional innovation spillovers was based on traditional spatial measurement methods, mainly involving geographical proximity; however, actual innovation spillovers cross geographical boundaries in various ways and cannot be measured by traditional methods. Second, in regional innovation spillover, government intervention makes the spatial network (SN) complicated and multithreaded, something not considered previously. In view of the shortcomings of previous research, we use herein a new method—network analysis to study the network characteristics of spatial correlation in Chinese regional innovation. Network analysis is an interdisciplinary method for analyzing relational data and is widely used in many disciplines [7,8,9,10,11,12]. This method is used to reveal the overall characteristics of the spatial structure of regional innovation spillovers among Chinese provinces and to analyze the location and influence of the provinces on the network based on the overall characteristics. The index of regional innovation output used herein is the number of authorized regional patents as obtained from the China Statistical Yearbook on Science and Technology. The research period is 2000–2016.
In summary, using the data for the 2000–2016, we contribute to the literature by providing the following empirical evidence. First, spatial correlation in regional innovation in China is measured using the vector autoregressive (VAR) Granger causality method. The results show close relationships among individual provinces in regional innovation spillovers. Second, block analysis is used to partition the regions. We find an obvious hierarchy among the blocks, and the relationship among the block interiors affects the closeness degree appreciably. Finally, we offer meaningful explanations for the results and highlight important policy implications.
The remainder of this paper is structured as follows. Section 2 reviews the literature on spatial correlation in regional innovation. Section 3 introduces the research aims and the method of network analysis. Section 4 reports and analyzes the results of spatial correlation in three parts, namely (i) the general characteristics of the SN, (ii) the individual characteristics of the SN, and (iii) block analysis. Section 5 presents conclusions, implications, and policy implications.
2. Literature Review
The research on regional innovation is currently carried out and its perspectives and methods are expanding. The role of regional innovation in regional economic development is already well known, but there is no consensus on how to measure regional innovation [13]. There are three main measurement approaches in the current empirical literature. The first and most widely used approach is to use a single indicator to measure regional innovation. The index of the number of patents and its related indexes are widely used, their advantage being that they directly reflect the total output of innovation in a region [14]. The second approach is to use a set of evaluation index systems to evaluate regional innovation capability according to the characteristics of different regions. The main advantage of this method is that it reflects the innovation characteristics of the region according to different indicators, and is therefore more objective and suitable for regional assessment of large regional differences [15,16]. The third approach is the comprehensive index evaluation method, which is widely used by countries and regions, for example, the Global Innovation Index and the StatsAmerica Innovation Index. Herein, we adopt the first approach and use the number of patents as the single indicator of regional innovation.
Previous studies have considered each region as an independent system without considering the possible correlation effects between systems. If regional innovation is indeed spatially correlated in China, then neglecting such spatial effects in economic models will result in biased or inconsistent parameter estimates [17]. Therefore, it is necessary to study spatial correlation in regional innovation. Some scholars have indeed examined the relevance of regional innovation. For example, Zhang et al. [18] used the location Gini coefficient and Moran’s I index to prove the non-random distribution of regional innovation output in China, that is, provincial regional innovation is spatially dependent. Li et al. [19] also found a clear spatial correlation in China′s regional innovation. Because the traditional econometric method cannot consider spatial factors, some scholars have introduced spatial econometrics to study the spatial effect and influencing factors of regional innovation.
Because of its influencing factors, regional innovation can generate spatial correlation and many scholars are studying those factors. Furman [20] postulated that national innovation capability depends on innovative infrastructure, a more specific innovation environment in industrial clusters, and the links between them. Wei et al. [21] improved the analysis framework of Furman, and studied the influencing factors of China’s provincial innovation ability from 1998 to 2007. The results showed that the regional innovation ability was influenced not only by the basic innovation conditions, such as the scale of R&D activities, but also by the efficiency of regional innovation. Some scholars are also studying the influencing factors of regional innovation from the perspective of regional knowledge. Schiuma [22] studied the influence of regional knowledge which was divided into four aspects: human capital, relational capital, structural capital, and social capital. Knowledge spillover is found to be an important factor for regional innovation. Through empirical studies, scholars have concluded that the spillover effect of regional innovation benefits from the spatial flow and spillover of knowledge, which help improve regional innovation performance [23]. Jaffe [24] used patent data to analyze knowledge spillover empirically in geographic space by means of a knowledge-production function. Empirical analysis of spillover diffusion has highlighted a strong distance-decay effect in knowledge spillovers [25,26,27]. In China, Sun et al. [28] used the knowledge-production function to study the spatial distance of regional knowledge spillover based on patent data for 1998–2008; they argued for obvious knowledge spillover in the regional knowledge of China, with the overflow appearing to go far beyond the boundaries of administrative geography.
Some scholars have also conducted exploratory research on the spillover mechanism of regional innovation. Sleuwacgen [29] revealed the four types of mechanisms that result in spillovers of regional innovation in general, they drew their conclusions based on survey data and a questionnaire analysis. Song [30] extended their study and explored possible channels for innovation spillover by focusing on an empirical analysis with a solid foundation in economics. We reason that regional innovation produces spillover between regions in the following three ways: (i) Innovation spillover due to talents flows. Because knowledge depends on individuals, knowledge is spillover in space in the process of space flow, whereupon innovation spillover occurs. The studies by Audretsch and Feldman [31] and Almeid and Kogut [32] confirmed that the exchange and interaction of knowledge-based talent among different groups and regions promoted knowledge spillover. The social networks that form during knowledge accumulation also affect knowledge spillover. Stuart and Sorensen [33] found that such social networks help the efficiency of knowledge spillover. (ii) Innovation spillover due to cooperative platforms: Breschi et al. [34] reasoned that exchanges and cooperation among industries, universities, and research institutes provide possibilities for innovation spillover. University research institutions in developed regions have abundant innovation resources, as do enterprise R&D departments, but these institutions must establish contact with other regions in the process of commercialization for the innovative resources. Zhao et al. [35] reasoned that university scientific research institutions establish relationships with institutions or enterprises in other regions when integrating production, learning, and research, thereby creating the possibility of innovation spillover through communication and cooperation. As ever larger enterprises choose the development form of the headquarters economy, so the management headquarters and the manufacturing base become separate. This gives regions with abundant labor resources the chance to establish connections with large enterprises, thereby innovation spillover. (iii) Innovation spillover due to entrepreneurship: By studying the relationship between the location distribution of biotech enterprises and that of star entrepreneurs, Audretsch [36] found that star entrepreneurs can use the innovative resources they own in the process of starting a new business to produce innovation spillover effects. The Chinese government is providing increasing support for entrepreneurship, and all manner of entrepreneurs are emerging in China. These entrepreneurs are good at not only finding opportunities but also giving full play to the value of innovation spillovers. Entrepreneurs with good ideas or patents realize innovation spillover by interacting and communicating with different regions. Therefore, entrepreneurship plays an important role in innovation spillover, while interregional communication plays an important role in entrepreneurship [37].
3. Aim and Methodology
3.1. Aim
To solve the aforementioned problems with the research status quo, the present aims are as follows: (i) To seek a new perspective that explains spatial correlation in regional innovation. The method of network analysis is sufficient for that purpose. (ii) To determine the spatial relationship among provinces. We use the VAR Granger causality method to measure spatial correlation in regional innovation in China. This is done to reveal whether there are spatial relationships among different provinces. (iii) To analyze the network structure characteristics of regional innovation. We consider three aspects, namely, the general characteristics of SN, individual characteristics of SN and a block-model analysis of the SN. (iv) To make some suggestions for regional innovation. We make four suggestions after analyzing the network characteristics of regional innovation.
3.2. Network Analysis of Spatial Correlation in Regional Innovation Spillover
To establish a SN of regional innovation, we must first determine whether there is any correlation among the provinces. There are two problems to be solved here. One is which index to use to measure regional innovation. The number of patents is an important index of regional innovation output and should reflect any regional innovation spillover. Therefore, we use the authorized patent data of 31 provinces in China for 2000–2016 as the basic data for analyzing spatial correlations in regional innovation spillovers. The other problem is how to construct and identify the SNs. For that, we use the VAR Granger causality method. During SN construction, each province is a point in the network, and a relationship between two provinces constitutes a network line. We discuss the reception and spillover effects of regional innovation among different regions by means of the SN comprising these points and lines. During identification, a relationship between two regions is realized by establishing an unstructured vector autoregressive model, and a causal relationship between two regions is realized through a Granger causality test. We establish the following two VAR models [38]:
where xt and yt are the numbers of patent outputs of provinces x and y, respectively, during period t, x−i and yt−i are the numbers of patent outputs of provinces x and y, respectively, during period t − i, αj, βj, and γj (j = 1, 2) are the parameters to be estimated, εj,t (j = 1, 2) are residual terms that obey a standard normal distribution, and m, n, p, and q are the lagging orders of the autoregressive terms.
This paper is based on the data of patents granted in each province between 2000–2016 as the basic analysis data of regional innovation output to establish the SN. First, we determined the optimal lag period in the Granger causality test among the provinces, where the five standards of Hannan-quinn Criterion (HQ), Schwarz Criterion (SC), Akaike Information Criterion (AIC), Final Prediction Error (FPE), and Likelihood Ratio (LR) were used [39]. Second, we determined whether causality exists between two regions; if so, we drew an arrow from area A to area B in the network. Similarly, the relationship between the regions was examined in turn, and finally the SN diagram was formed. Herein, our study of regional innovation output accounts for any two-way influence between regions. Therefore, it is a directed network in which the asymmetrical accessibility between the provinces in the network is reflected by the network level. Herein, we used three methods to analyze the characteristics of the SN.
First, we considered the overall characteristics of the SN. These were measured with four indexes, namely network density, network correlation degree, network level, and network efficiency.
(i) Network density: The more connections in the network, the greater the network density. The network density Dn is expressed as
where L is the number of actual associations and N is the number of regions in the network. The range of Dn is [0, 1].
(ii) Network correlation degree: The degree of correlation C is measured by accessibility [40] and is expressed as
where V is the pair number of unreachable regions in the network. The range of C is [0, 1].
(iii) Network level: The network rank H is another index closely related to relevance and reflects the dominance of each region in the network. The calculation formula is
where K is the pair number of reachable regions in the network. The range of H is [0, 1].
(iv) Network efficiency: The network efficiency E is another indicator of network relevance. The lower the network efficiency, the more spatial spillover channels for regional innovation and the more stable the network. The calculation formula is
where M is the number of redundant lines in the network. The range of E is [0, 1].
Second, we considered the individual characteristics of the SN. These were measured by centrality analysis, which reflects the position and function of each region in the network and includes two main indexes, namely degree centrality and center centrality [41]. The degree centrality De represents the central position of a region in the network and is calculated as
where n is the number of regions directly correlation and N is the number of regions that are most likely to be directly connected.
The center centrality Cbi denotes the extent to which a region is “in the middle” of other regions in the network, that is, the size of the role of intermediary or bridge. The calculation formula is
where j ≠ k ≠ i and j < k.
Third, we considered a block-model analysis. This is a method for studying the network location model, which divides each region in a network into several discrete subsets according to a certain standard. These subsets are called “blocks.” The objective of the block-model analysis is to examine the relationship between each block. The process involves two steps. First, concordance method or hierarchical clustering is used to classify different regions. Second, the value of each block is determined to form an image matrix according to some criterion; herein, we use the α density index. The α density criterion is a widely used block method that we use herein to analyze the characteristics of the SN structure.
4. Network Structure Characteristics of Regional Innovation Spillovers in China
4.1. General Characteristics of Spatial Network
From the results of the Granger causality test, we used Equations (1) and (2) to determine that the actual number of relationships among the 31 provinces is 511; the SN diagram drawn according to this result is shown in Figure 1. According to Equation (3), the theoretical maximum number of relationships among the provinces is 930, thus the network density is 0.549. According to Equation (4), the degree of network association among the provinces is unity, which indicates that the network has strong accessibility, the provinces are related, and no province is isolated. According to Equation (5), the network level is zero, indicating that there is no direct connection between any two provinces in the network but that the corresponding connections can be established through other nodes. According to Equation (6), the network efficiency is 0.237, which shows that the interrelationships among the provinces in the network space are overlapped and added, making the network very stable.
4.2. Individual Characteristics of the Spatial Network
The individual characteristics of the SN were analyzed from the proportion of spillovers, the number of spillovers, the number of benefit relationships, the degree centrality, and the closeness centrality; the specific data are given in Table 1. From the spillover ratio, the top five are Shanghai (1), Beijing (0.938), Hainan (0.833), Jilin (0.778), and Sichuan (0.733). A higher spillover ratio indicates that the effect of influencing the innovation output of other areas is greater than the effect of receiving from other regions. Here, Shanghai has only the spillover relationship but no benefit relationship, which indicates that the innovation output in the region depends more on itself. The total relevance number of Hainan is six including five spillovers, leading to the highest proportion of spillovers. The five provinces counting backwards are Tibet (0), Xinjiang (0.1), Ningxia (0.167), Guangxi (0.188), and Inner Mongolia (0.214), which are mainly benefited areas in the network; the regional innovation output in these areas is weak and must be supported and driven more by other regions.
Figure 2 shows the characteristics of the spillover benefit of the 31 provinces in the spatial correlation network of regional innovation output. According to the sequencing of the spillover relationship, the top five provinces are Anhui (21), Jiangsu (20), Beijing (15), Shaanxi (15), and Heilongjiang (15) in turn; the number of spillovers in these regions is between 15 and 21, that is, more than half of the provinces have spillover relationships. The five provinces counting backwards are Tibet (0), Ningxia (1), Qinghai (2), Guizhou (2), and Xinjiang (2); the number of spillovers in these five regions is between zero and two. These regions are all western ones, and their ability to accept is far greater than the capacity of spillovers. According to the degree centrality and center centrality, Jiangsu, Anhui, Xinjiang, Jiangxi, Heilongjiang, Chongqing, Yunnan, Shandong, Shaanxi, and Inner Mongolia are in the top place, which shows that the central and western regions have more connections with other regions in the whole network and are at the center of the whole network. Although these areas are not the main producing areas of regional innovation, they are important areas for spreading and receiving regional innovation.
4.3. Block Model Analysis of the Spatial Linkage Network of Regional Innovation Output
Given the SN graph shown in Figure 1, we can further analyze the relationships among the 31 provinces in China. Herein, we take the maximum segmentation depth as two and the convergence standard as 0.2. We obtained the following results by using the UCINET software, leading ultimately to four regional innovation output blocks (see Table 2). The first regional innovation output block comprises seven provinces, namely Guangdong, Liaoning, Shanghai, Fujian, Zhejiang, Shanxi, and Tianjin. Other than Shanxi, these are basically coastal economically developed provinces in China. The second regional innovation output block also comprises seven provinces, namely Beijing, Anhui, Jiangsu, Shaanxi, Shandong, Hebei, and Jiangxi, which are mainly in eastern and central China. The third regional innovation output block comprises eight provinces, namely Guangxi, Chongqing, Jilin, Hubei, Henan, Sichuan, Heilongjiang, and Yunnan, which are mainly the more developed provinces in western in China. The fourth regional innovation output block comprises nine provinces, namely, Guizhou, Xinjiang, Ningxia, Gansu, Hainan, Hunan, Qinghai, Inner Mongolia, and Tibet, all of which are western provinces except for Hainan and Hunan.
Among the four blocks, the correlation for the second block reaches 224, indicating that the relationship between that block and the other blocks is most closely related. Regarding the total amount of spillover, that the second block is the largest, indicates that it has the greatest ability to affect the other blocks. However, the amount for the fourth block is the largest regarding reception, indicating that that region’s innovation output depends more on the influence of the other regions. Because the number of provinces included in each block differs, the characteristics of each block can be explained further by relative indexes after comparing the absolute number. From the spillover intensity, the number for the second block (the highest one) is more than three times that of the fourth block (the lowest one), indicating that the ability of each plate to affect the other plates is very different. From the receiving intensity, the differences between the blocks are not prominent, indicating that each block will be affected by the other blocks while regional innovation is being generated. From the spillover intensity/receiving intensity, the first block to the fourth block becomes weaker in turn, from 1.313 to 0.519, indicating that each block has a greater difference in regional innovation output capacity.
The network density is 0.549 as mentioned in Section 4.1. However, there is a corresponding density of each block. If the density of a block exceeds the average density of the whole network, that block has a concentrated trend. The density matrix of each block is given in Table 3. From this density matrix, the value of the lattice is assigned to unity when the value exceeds 0.59, and the lattice assignment 0 is less than 0.549, leading to the corresponding image matrix given in Table 4.
The transfer mechanism between the blocks in the process of regional innovation output can be examined clearly from the image matrix. Figure 3 reflects the position and role of each block directly. From Figure 3, the second block is clearly the core of the whole network; not only does it have the spillover effect inside it, it also has the spillover effect for the other three blocks and can transfer the kinetic energy transmitted by the first and third blocks to the fourth block. Therefore, the second block plays two roles: it is the engine in the whole network system and serves as the “middleman.” The first and third blocks are the main beneficiary sectors because they have spillovers and reception effects simultaneously. The fourth block only receives the spillover effect of the second block and has no obvious spillover effect on other blocks, making it a net beneficial sector.
5. Conclusions and Suggestions
5.1. Conclusions
This study uses network analysis to analyze the spatial correlation of regional innovation output in China. The method of VAR Granger causality is used to measure the spatial correlation of regional innovation output in China, which is described from the aspects of the general characteristics of the spatial relationships, the positions and roles of regional blocks in the correlation, and the mechanism and transmission path of regional spatial spillover. The empirical study yields the following four conclusions.
(i) Each province is closely related to the others regarding regional innovation spillover. However, there are great differences in the spatial correlations between provinces. In some areas, such as Shanghai, there are only external spillover relationships and no acceptance of relationships, whereas Tibet accepts only relationships but no spillover. The spillover relationship between the eastern and central provinces is higher than that of the western provinces, reflecting the fact that the eastern and central provinces mainly affect western provinces by spillover. Western provinces are mainly based on the relationship of acceptance, reflecting the fact that these areas are more likely to rely on absorbing innovation from other regions to spill out innovative development.
(ii) There is an obvious hierarchy between blocks. Of the four blocks, the second block occupies the central position: not only does it have an internal relationship, it also has external relationships with the other three blocks. It occupies this central position mainly because its members include both eastern developed areas (e.g., Beijing and Jiangsu) and central regions (e.g., Anhui and Jiangxi). Taking into account the spatial distance factors in regional innovation spillovers, the first block (mainly comprising eastern provinces) spills over to the eastern and central regions more, namely the second and third blocks. The second block offers the advantage of connecting eastern and western China, which is the most active in the whole block system. Although the third and fourth blocks comprise mainly western provinces, the third block (comprising most of the relatively developed western provinces) should be significantly higher than the fourth block regarding spillover. The fourth block mainly accepts the overflow of the other blocks in the whole block system. Therefore, each block has different positioning and functions.
(iii) The relationship between the interiors of pairs of blocks differs greatly regarding the closeness degree. The internal correlation of the second block is higher than the average network density, whereas the internal relationships of the other three blocks are not prominent.
(iv) It can be seen that regional innovation in China can spill over among regions, leading to the development of links between regions have been greatly strengthened. To achieve sustainable development in China, we must make effective use of the spatial relationship of innovation. As regional innovation has its own characteristics in China, in the process of regional sustainable development, we should also consider the difference of innovation spillover effect among the regional blocks. At the same time, the innovation spillover effect of regional blocks with the same characteristics is also very different, which requires that the internal development of regional blocks should be treated differently in the process of regional sustainable development.
5.2. Implications and Limitations
In traditional spatial econometric research on regional innovation, most work has been carried out from the perspective of adjacent or close regions of economic geography. Recent research was conducted mostly to verify the existence of spatial correlations in regional innovation, but the complex association network comprising different regions has not been depicted clearly [28]. In addition, Moran’s I index, the location Gini coefficient, and the variation coefficient can only give the correlation degree of the whole region, but cannot separately reflect the status and role of each region in the innovative association network [16,17,18]. None of those studies were conducted from the perspective of overall spatial characteristics. The present study solves those problems through network analysis. From the overall characteristics of the innovation SN, the position and function of each block, the correlation mechanism, and the transmission path among the blocks were constructed and analyzed. Meanwhile, while traditional methods cannot establish the relationships among individual regions, the present study can analyze the individual characteristics, thereby making up for the deficiency of spatial relationship analysis in the process of regional innovation to a certain extent.
The implication is clearly that regional innovation has spatial relevance, meaning that the development of interregional collaborative innovation should be encouraged. From a macroscopic perspective, the government must treat the spatial linkage of regional innovation as an important decision variable in policy formulation and make full use of and play the role of this relationship. From a microscopic perspective, all innovation organizations, including scientific research institutions and enterprises, should be active in and promote innovation cooperation among different regions.
Our research also has some limitations. First and most notably, our results are based on data for China. We reason that the results are correct based on the empirical test above and are in line with China’s national condition. However, they are not widely applicable to other regions because of the different situation of each region. Therefore, we could expand the scope of the research by conducting a comparative study of regional innovation in another country, in which we would study the spatial correlation and spillover effects according to the innovation characteristics of different regions. The VAR Granger causality method is a better way to determine the spatial relationship of regional innovation. However, some comprehensive indicators can be considered to replace the existing single patent indicators in the future comparative study, which can more comprehensively reflect the actual situation of regional innovation.
5.3. Suggestions
We make the following policy suggestions in accordance with the present analytical conclusions to promote China’s regional innovation development.
(i) Government departments should take into account the impact of the regional innovation spillover SN relationship on innovation when formulating regional innovation policy. Because regional innovation shows an obvious SN relationship, the transmission relationship of this network structure should be taken into account when making policies, and conditions should be created for the “channel” of regional innovation in interregional spillovers. Promoting regional innovation spillovers is an important policy objective.
(ii) In the process of coordinated development of planning the SN, we should not only combine the characteristics of the individual provinces in the network, but also consider the different functions of each block to formulate corresponding policies. The spillover functions of the provinces in the regional innovation networks should be strengthened in the process of policy making so that they can become the “engine” to promote the innovation and development of other regions. For regions that mainly receive spillovers, their autonomous development capacity should be strengthened when making policies, the purpose being to reduce foreign dependence. We should further strengthen the function of the second block in connecting eastern and western China and design a channel and platform that can produce spillover from the first and third blocks to the fourth block.
(iii) The influence of regional similarity on regional innovation spillovers should be taken into account in the SN relationship. Regional innovation spillovers are more likely to involve relationships among adjacent areas and those with similar development conditions. Therefore, we should consider both adjacency convenience and similar conditions when making policies. Only by taking these factors into consideration can the policies be more operable.
(iv) Full play should be given to the synergy of all kinds of policies to enhance the ability of regional innovation output in the western region. The western regions are clearly those that receive the most overflow in the whole regional-innovation spillover network system, therefore they should be the focus of government departments. We should integrate the policies and forces of various departments to establish various forms of support and channels to promote the development of regional innovation.
Author Contributions
X.T. wrote the paper; J.W. contributed the collection of data and the idea.
Funding
This research was funded by Soft Science Research Project in Shanxi Province of China, No. 2016041003-1.
Acknowledgments
We gratefully acknowledge the support of Soft Science Research Project in Shanxi Province of China. The authors also wish to express their sincere thanks to the editors for their work on the paper.
Conflicts of Interest
The authors declare no conflicts of interest.
References
- Crescenzi, R.; Rodriguez, P.; Storper, M. The territorial dynamics of innovation in China and India. J. Econ. Geogr. 2012, 12, 1055–1085. [Google Scholar] [CrossRef] [Green Version]
- Dahlman, C. Innovation strategies of three of the BIRCS: Brazil, India and China-what can we learn from three different approaches. In The Rise of Tech. Power in the South; Palgrave MacMillan: Basingstoke, UK, 2008. [Google Scholar]
- Xinhua News Agency. National innovation driven development strategy outline. E-Government 2016, 6, 79. [Google Scholar]
- Hong, M.; Zhang, T.; Zhang, K.X. Research on the current situation and motivation of Chinese patent growth. Mod. Manag. Sci. 2018, 2, 24–26. [Google Scholar]
- National Bureau of Statistics of China. Statistics Bulletin of National Science and Technology Expenditure in 2016; National Bureau of Statistics of China: Beijing, China, 2017.
- Kauffeld-Monz, M.; Fritsch, M. Who are the knowledge brokers in regional systems of innovation? A multi-actor network analysis. Reg. Stud. 2013, 47, 669–685. [Google Scholar] [CrossRef]
- Oliveira, M.; Gama, J. An overview of social network analysis. Data Min Knowl. Discov. 2012, 2, 99–115. [Google Scholar] [CrossRef]
- Snyder, D.; Kick, E.L. Structural position in the world system and economic growth, 1955–1970: A multiple-network analysis of transitional interactions. Am. J. Soc. 1976, 84, 1096–1126. [Google Scholar] [CrossRef]
- Smith, D.A.; White, D.R. Structure and dynamics of the global economy: Network analysis of international trade. Soc. Forces 1992, 70, 857–893. [Google Scholar] [CrossRef]
- Chase-Dunn, C.; Grimes, P. World system analysis. Annu. Rev. Soc. 1995, 21, 387–417. [Google Scholar] [CrossRef]
- Schiavo, S.; Reyea, J.; Fagiolo, G. Inernational trade and financial integration: A weighted network analysis. Quant. Finance 2010, 10, 389–399. [Google Scholar] [CrossRef]
- Cassi, L.; Morrison, A. The evolution of trade and scientific collaboration networks in the global wine sector: A longitudinal study using network analysis. J. Econ. Geogr. 2012, 88, 311–334. [Google Scholar] [CrossRef]
- Christiph, H.; Matthias, S. Measuring regional innovation: A critical inspection of the ability of single indicators to shape technological change. Technol. Forecast. Soc. Chang. 2018, 129, 43–55. [Google Scholar]
- Di Cagno, D.; Fabrizi, A.; Meliciani, V.; Wanzenböck, I. The impact of relational spillovers from joint research projects on knowledge creation across European regions. Technol. Forecast. Soc. Chang. 2016, 108, 83–94. [Google Scholar] [CrossRef]
- Capello, R.; Lenzi, C. Territorial patterns of innovation: A taxonomy of innovative regions in Europe. Ann. Reg. Sci. 2013, 51, 119–154. [Google Scholar] [CrossRef]
- Navarro, M.; Gibaja, J.; Bilbao, B.; Aguado, R. Patterns of innovation in EU-25 regions: A typology and policy recommendations. Eviron. Plan. C Gov. Policy 2009, 27, 815–840. [Google Scholar] [CrossRef]
- Maggioni, M.; Uberti, T.; Nosvelli, M. Does intentional mean hierarchical? Knowledge flows and innovative performance of European regions. Ann. Reg. Sci. 2014, 53, 453–485. [Google Scholar] [CrossRef] [Green Version]
- Zhang, Y.M.; Li, K. Research on spatial correlation of inter provincial innovation output. Stud. Sci. Sci. 2008, 3, 659–666. [Google Scholar]
- Li, J.; Tan, M.Q.; Bai, J.H. Spatial econometric analysis of regional innovative production in China: An Empirical Study Based on static and dynamic spatial panel models. Manag. World 2010, 7, 43–55. [Google Scholar]
- Furman, J.; Porter, M.; Stern, S. The determinants of national innovative capacity. Res. Policy 2002, 31, 899–933. [Google Scholar] [CrossRef] [Green Version]
- Wei, S.H.; Wu, G.S.; Lv, X.L. The determinants of regional innovation capability: comment on the regional gap of innovation capability in China. China Soft Sci. 2010, 9, 76–85. [Google Scholar]
- Schiuma, G.; Lerro, A. Knowledge-based capital in building regional innovation capacity. J. Knowl. Manag. 2008, 5, 121–136. [Google Scholar] [CrossRef]
- Junhong, B.; Fuxin, J. Synergy innovation, spatial correlation and regional innovation performance. Econ. Res. J. 2015, 7, 174–187. [Google Scholar]
- Jaffe, A. Real effects of academic research. Am. Econ. Rev. 1989, 79, 957–970. [Google Scholar]
- Acs, Z.; Anselin, L.; Varga, A. Patents and innovation counts as measures of regional production of new knowledge. Res. Policy 2002, 31, 1069–1085. [Google Scholar] [CrossRef] [Green Version]
- Varga, A. Local academic knowledge spillovers and the concentration of economic activity. J. Reg. Sci. 2000, 40, 289–309. [Google Scholar] [CrossRef]
- Rodríguez-Pose, A.; Crescenzi, R. R&D, spillovers, innovation systems and the genesis of regional growth in Europe. Bruges Eur. Econ. Res. Pap. 2006, 42, 51–67. [Google Scholar]
- Sun, J.; Qi, J.G. A study on the spatial distance of regional knowledge spillovers in China. Stud. Sci. Sci. 2011, 11, 1643–1650. [Google Scholar]
- Sleuwaegen, L.; Boiardi, P.C. Creativity and regional innovation: Evidence from EU regions. Res. Policy 2014, 9, 1508–1522. [Google Scholar] [CrossRef]
- Song, H.S.; Zhang, M. Spatial spillovers of regional innovation: Evidence from Chinese Provinces. Emerg. Mark. Finance Trade 2017, 53, 2104–2122. [Google Scholar] [CrossRef]
- Audretsch, D.; Feldman, M. Knowledge spillovers and the geography of innovation. In Handbook of Urban and Regional Economics; North Holland Publishing: Amsterdam, The Netherlands, 2004; Volume 4, pp. 2713–2739. [Google Scholar]
- Almeida, P.; Kogut, B. Localization of knowledge and the mobility of engineers in regional networks. Manag. Sci. 1999, 45, 905–917. [Google Scholar] [CrossRef]
- Stuart, E.; Sorenson, O. Social Networks and Entrepreneurship; Springer: Berlin, Germany, 2005. [Google Scholar]
- Breschi, S.; Lissoni, F. Knowledge spillovers and local innovation systems: A critical survey. Ind. Corp. Chang. 2001, 10, 975–1005. [Google Scholar] [CrossRef]
- Zhao, Y.; Bai, Y.X. Knowledge spillover: A literature review. Econ. Res. 2009, 1, 144–156. [Google Scholar]
- Audretsch, D.B.; Feldman, M.P. R&D spillovers and the geography of innovation and production. Am. Econ. Res. 1996, 86, 630–640. [Google Scholar]
- Storper, M.; Venables, A.J. Buzz: Face-to-face contact and the urban economy. J. Econ. Geogr. 2004, 4, 351–370. [Google Scholar] [CrossRef]
- Groenewold, N.; Guoping, L.; Anping, C. Regional output spillovers in China: Estimates from a VAR model. Pap. Reg. Sci. 2007, 86, 101–122. [Google Scholar] [CrossRef]
- Wu, H.; Gu, X.M. The social network analysis of cooperative innovation performance of industry-university-research institution. Stud. Sci. Sci. 2017, 35, 1578–1586. [Google Scholar]
- Krackhardt, D. Graph theoretical dimensions of informal organizations. In Computational Organization Theory; Lawrence Erlbaum Associates: Hove, UK, 2014; pp. 107–130. [Google Scholar]
- Freeman, L.C. Centrality in social networks: Conceptual clarification. Annu. Rev. Soc. 1979, 1, 215–239. [Google Scholar] [CrossRef]
Figure 1.
Spatial correlation network of regional innovation in China.
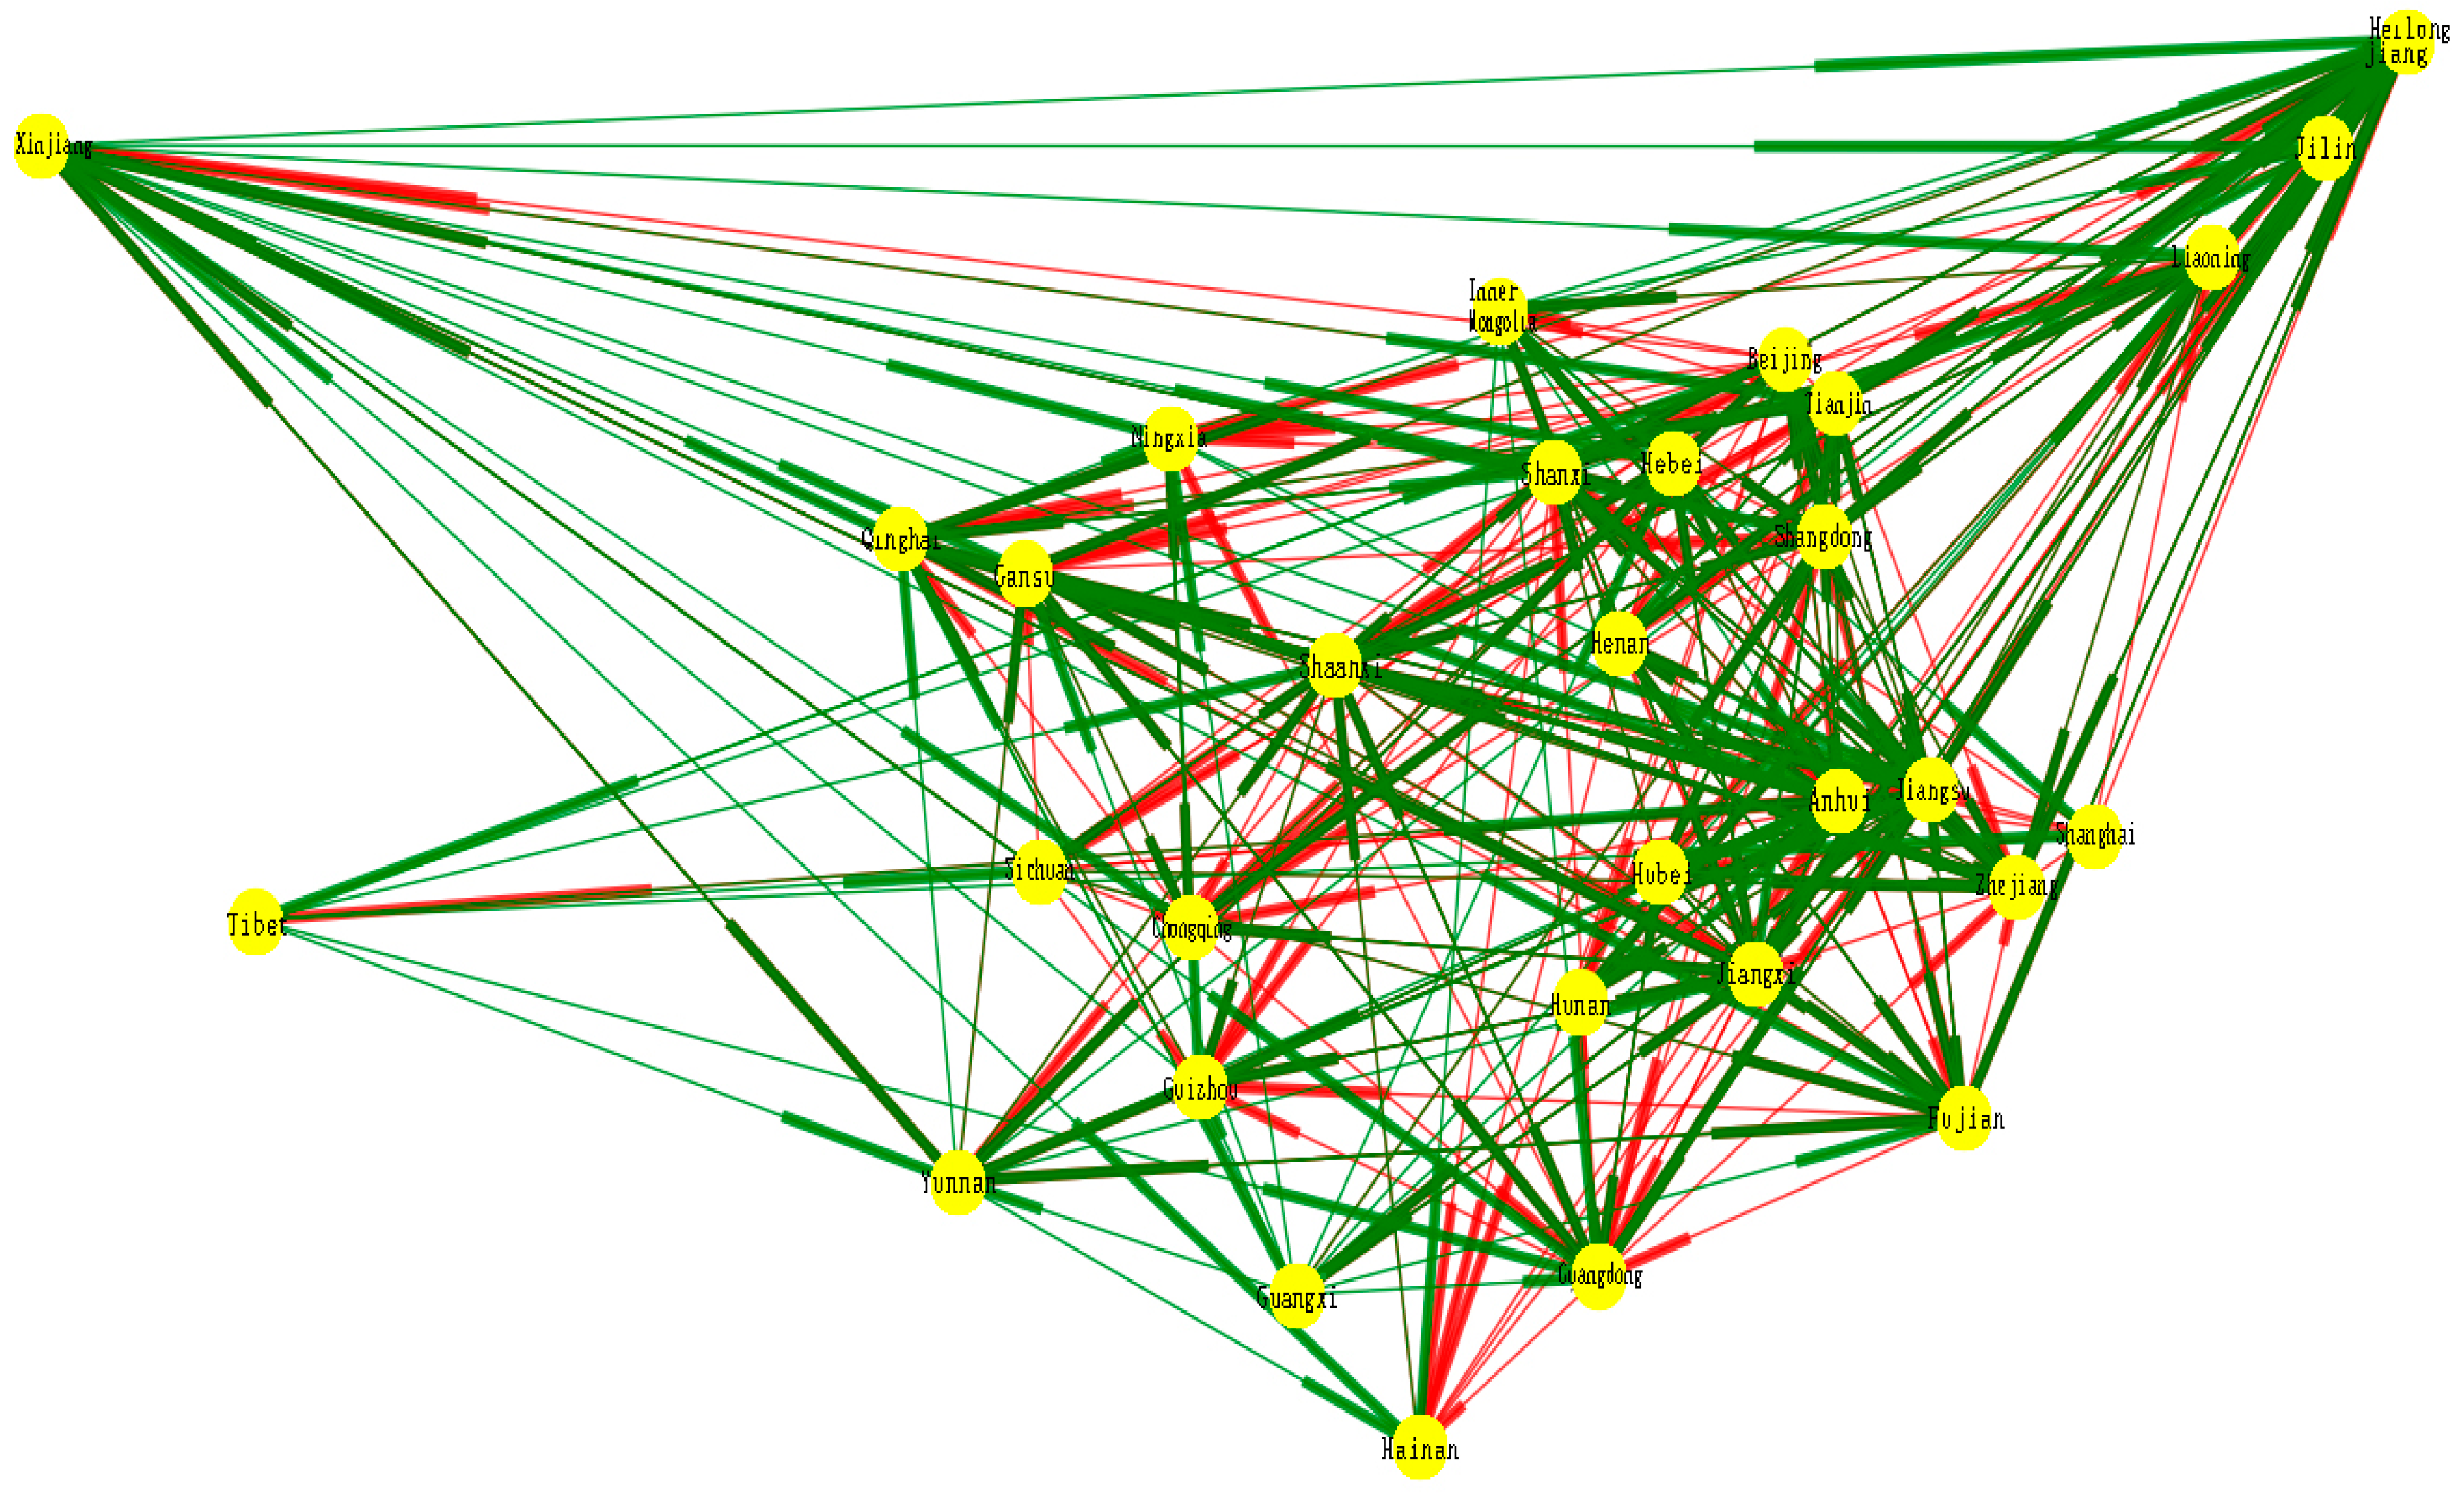
Figure 2.
Spillovers and receiving relationships in the spatial correlation network of provinces in China.
Figure 2.
Spillovers and receiving relationships in the spatial correlation network of provinces in China.
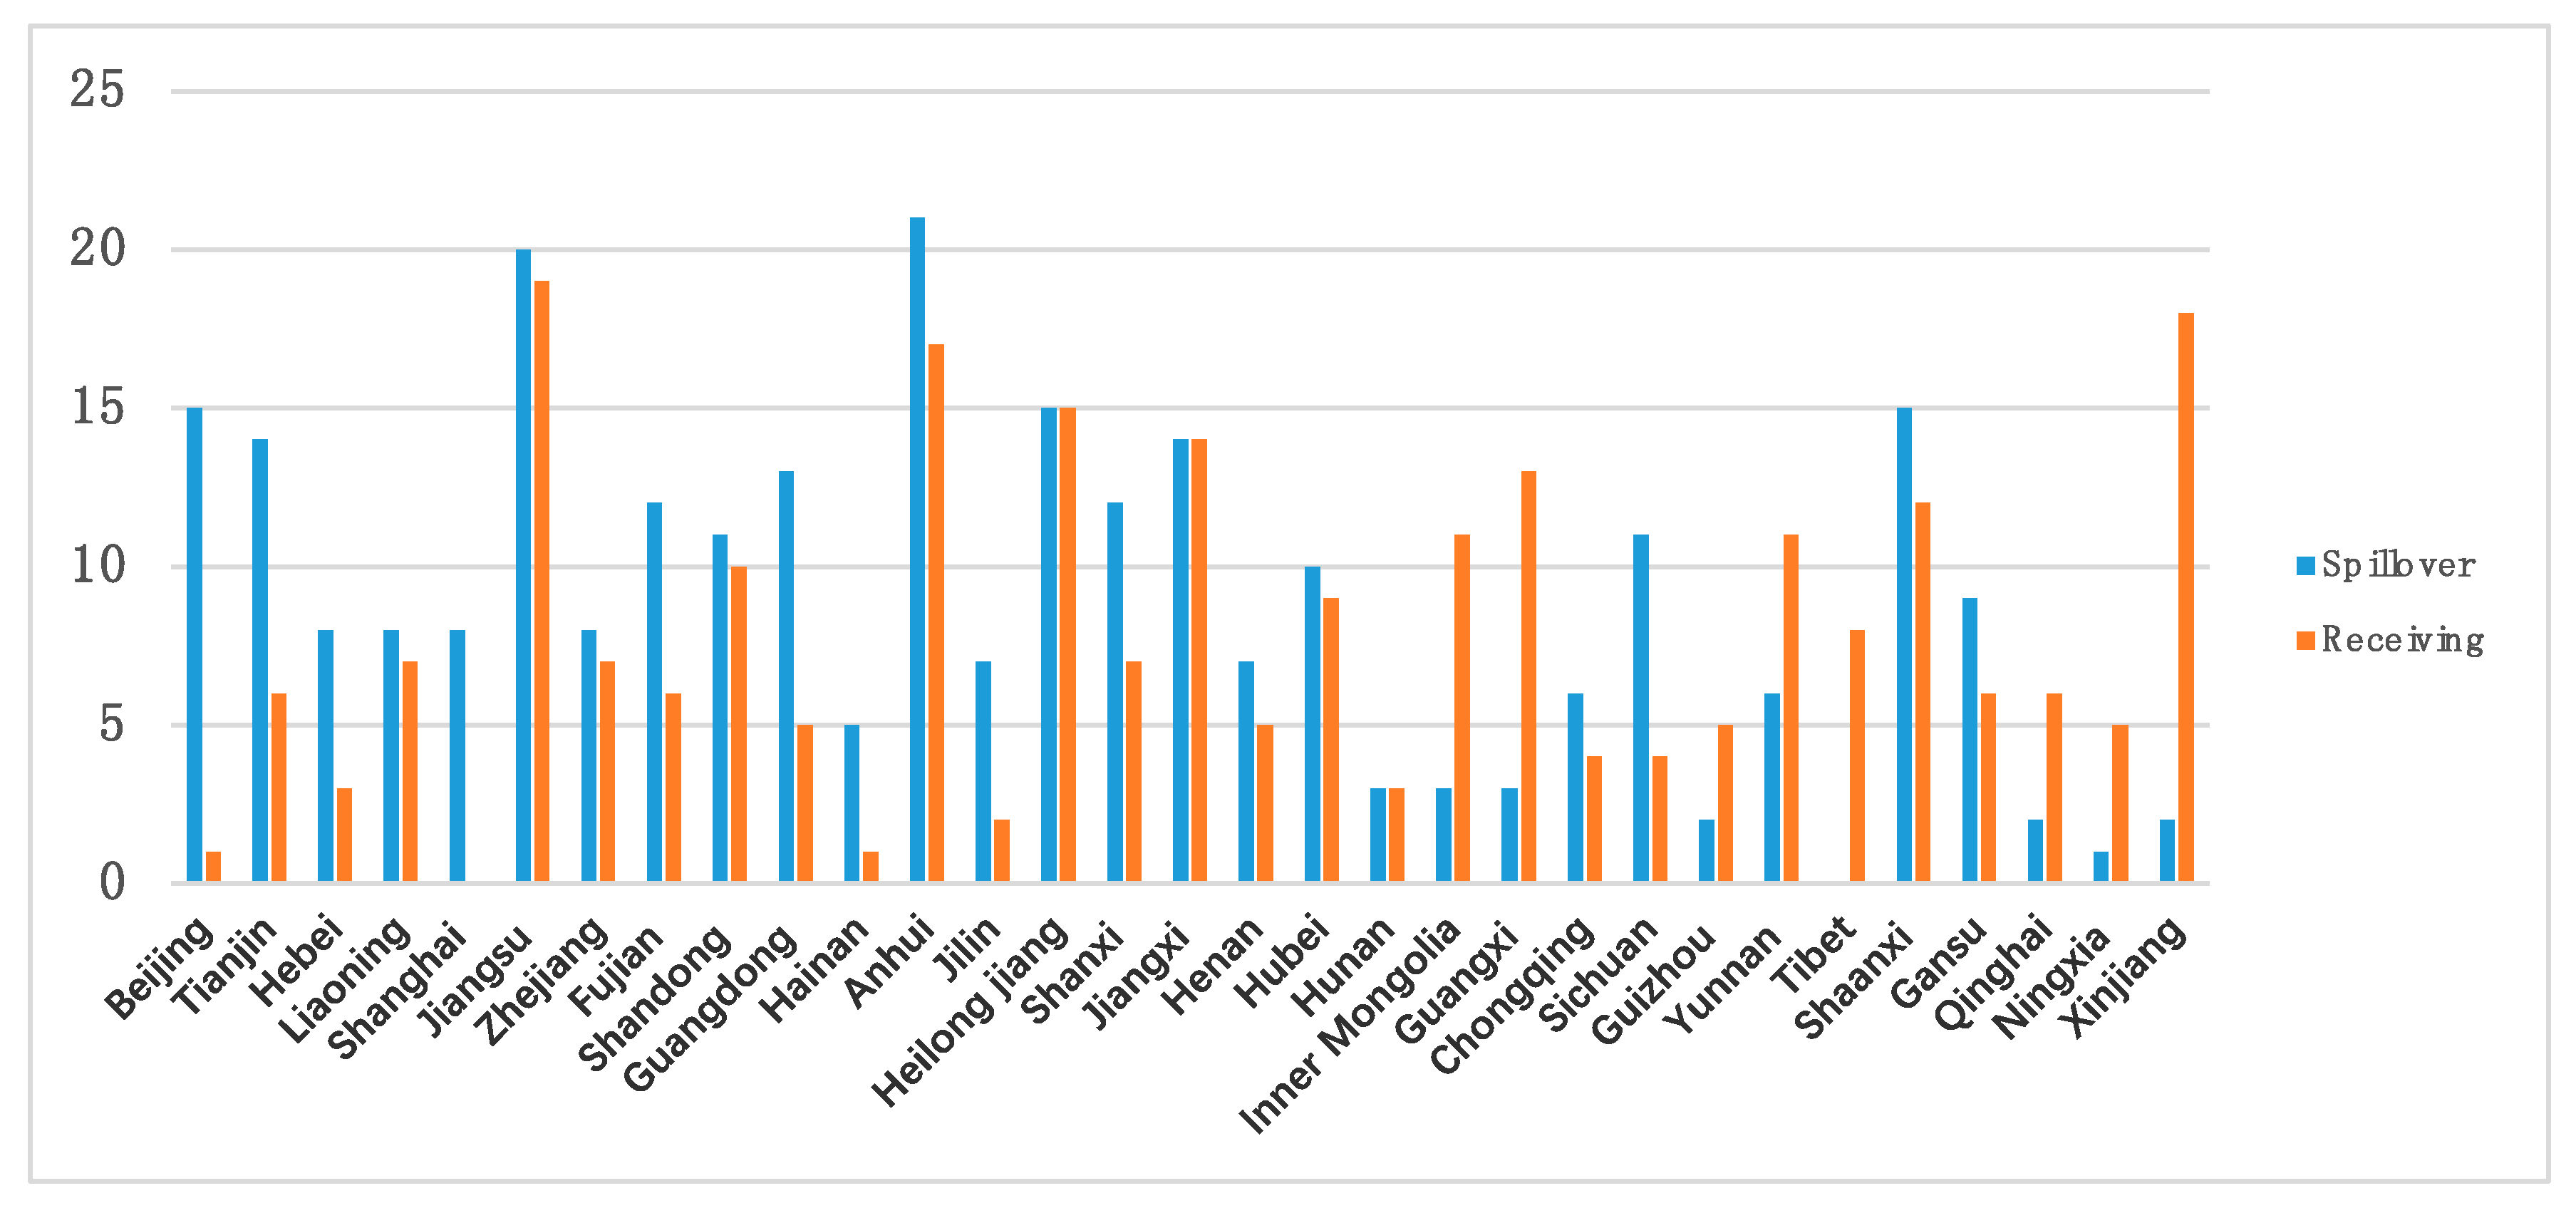
Figure 3.
Block relationships within the SN of regional innovation spillovers.


Table 1.
Spatial correlation network of regional innovation in China.
| Province | Spillover Ratio | Ranking | Spillover Relation | Ranking | Receiving Relation | Ranking | Degree Centrality | Ranking | Center Centrality | Ranking |
|---|---|---|---|---|---|---|---|---|---|---|
| Beijing | 0.938 | 2 | 15 | 3 | 1 | 29 | 0.200 | 27 | 0.357 | 30 |
| Tianjin | 0.7 | 8 | 14 | 6 | 6 | 16 | 0.467 | 18 | 0.508 | 19 |
| Hebei | 0.727 | 6 | 8 | 15 | 3 | 26 | 0.367 | 20 | 0.484 | 25 |
| Liaoning | 0.533 | 16 | 8 | 15 | 7 | 13 | 0.467 | 18 | 0.517 | 16 |
| Shanghai | 1 | 1 | 8 | 15 | 0 | 31 | 0.067 | 31 | 0.001 | 31 |
| Jiangsu | 0.513 | 20 | 20 | 2 | 19 | 1 | 1.300 | 1 | 0.732 | 1 |
| Zhejiang | 0.533 | 17 | 8 | 15 | 7 | 13 | 0.600 | 8 | 0.556 | 11 |
| Fujian | 0.667 | 9 | 12 | 9 | 6 | 16 | 0.567 | 10 | 0.526 | 15 |
| Shandong | 0.524 | 19 | 11 | 11 | 10 | 10 | 0.700 | 7 | 0.577 | 8 |
| Guangdong | 0.722 | 7 | 13 | 8 | 5 | 20 | 0.500 | 13 | 0.500 | 22 |
| Hainan | 0.833 | 3 | 5 | 23 | 1 | 29 | 0.133 | 30 | 0.380 | 29 |
| Anhui | 0.553 | 15 | 21 | 1 | 17 | 3 | 1.033 | 3 | 0.667 | 2 |
| Jilin | 0.778 | 4 | 7 | 19 | 2 | 28 | 0.233 | 26 | 0.390 | 28 |
| Heilong jiang | 0.5 | 21 | 15 | 3 | 15 | 4 | 1.133 | 2 | 0.612 | 5 |
| Shanxi | 0.632 | 10 | 12 | 9 | 7 | 13 | 0.600 | 8 | 0.536 | 13 |
| Jiangxi | 0.5 | 21 | 14 | 6 | 14 | 5 | 0.933 | 4 | 0.625 | 4 |
| Henan | 0.583 | 13 | 7 | 19 | 5 | 20 | 0.367 | 20 | 0.476 | 26 |
| Hubei | 0.526 | 17 | 10 | 13 | 9 | 11 | 0.500 | 13 | 0.536 | 13 |
| Hunan | 0.5 | 21 | 3 | 24 | 3 | 26 | 0.200 | 27 | 0.448 | 27 |
| Inner Mongolia | 0.214 | 27 | 3 | 24 | 11 | 8 | 0.500 | 13 | 0.577 | 8 |
| Guangxi | 0.188 | 28 | 3 | 24 | 13 | 6 | 0.533 | 12 | 0.600 | 6 |
| Chongqing | 0.6 | 11 | 6 | 21 | 4 | 24 | 0.300 | 23 | 0.492 | 24 |
| Sichuan | 0.733 | 5 | 11 | 11 | 4 | 24 | 0.200 | 27 | 0.500 | 22 |
| Guizhou | 0.286 | 25 | 2 | 27 | 5 | 20 | 0.333 | 22 | 0.517 | 16 |
| Yunnan | 0.353 | 24 | 6 | 21 | 11 | 8 | 0.567 | 10 | 0.588 | 7 |
| Tibet | 0 | 31 | 0 | 31 | 8 | 12 | 0.300 | 23 | 0.545 | 12 |
| Shaanxi | 0.556 | 14 | 15 | 3 | 12 | 7 | 0.800 | 5 | 0.577 | 8 |
| Gansu | 0.6 | 11 | 9 | 14 | 6 | 16 | 0.500 | 13 | 0.517 | 16 |
| Qinghai | 0.25 | 26 | 2 | 27 | 6 | 16 | 0.500 | 13 | 0.508 | 19 |
| Ningxia | 0.167 | 29 | 1 | 30 | 5 | 20 | 0.300 | 23 | 0.508 | 19 |
| Xinjiang | 0.1 | 30 | 2 | 27 | 18 | 2 | 0.800 | 5 | 0.667 | 3 |
Table 2.
Spillover effects between blocks in the spatial network (SN) of regional innovation.
| Block 1 | Block 2 | Block 3 | Block 4 | Number of Block-Member | Number of Spillovers | Number of Reception | Maximum Theory Spillover or Reception | Spillover Strength | Receiving Strength | Spillover Strength/Receiving Strength | |
|---|---|---|---|---|---|---|---|---|---|---|---|
| Block 1 | 18 | 38 | 37 | 34 | 7 | 109 | 83 | 168 | 0.65 | 0.49 | 1.313 |
| Block 2 | 36 | 52 | 41 | 50 | 7 | 127 | 97 | 168 | 0.76 | 0.58 | 1.310 |
| Block 3 | 36 | 33 | 19 | 22 | 8 | 91 | 96 | 184 | 0.49 | 0.52 | 0.948 |
| Block 4 | 11 | 26 | 18 | 12 | 9 | 55 | 106 | 198 | 0.28 | 0.54 | 0.519 |
Note: Spillover intensity = actual spillover amount/theoretical maximum spillover amount; reception intensity = actual external spillover amount /theoretical maximum acceptable spillover amount.
Table 3.
Density matrix of blocks in the SN of regional innovation.
| Block 1 | Block 2 | Block 3 | Block 4 | |
|---|---|---|---|---|
| Block 1 | 0.214 | 0.776 | 0.661 | 0.540 |
| Block 2 | 0.735 | 0.619 | 0.732 | 0.794 |
| Block 3 | 0.643 | 0.589 | 0.170 | 0.306 |
| Block 4 | 0.175 | 0.413 | 0.250 | 0.083 |
Table 4.
Image matrix of blocks in the SN of regional innovation.
| Block 1 | Block 2 | Block 3 | Block 4 | |
|---|---|---|---|---|
| Block 1 | 0 | 1 | 1 | 0 |
| Block 2 | 1 | 1 | 1 | 1 |
| Block 3 | 1 | 1 | 0 | 0 |
| Block 4 | 0 | 0 | 0 | 0 |
© 2018 by the authors. Licensee MDPI, Basel, Switzerland. This article is an open access article distributed under the terms and conditions of the Creative Commons Attribution (CC BY) license (http://creativecommons.org/licenses/by/4.0/).
Share and Cite
MDPI and ACS Style
Tian, X.; Wang, J. Research on Spatial Correlation in Regional Innovation Spillover in China Based on Patents. Sustainability 2018, 10, 3090. https://doi.org/10.3390/su10093090
AMA Style
Tian X, Wang J. Research on Spatial Correlation in Regional Innovation Spillover in China Based on Patents. Sustainability. 2018; 10(9):3090. https://doi.org/10.3390/su10093090
Chicago/Turabian StyleTian, Xinbao, and Jiguang Wang. 2018. "Research on Spatial Correlation in Regional Innovation Spillover in China Based on Patents" Sustainability 10, no. 9: 3090. https://doi.org/10.3390/su10093090
Note that from the first issue of 2016, this journal uses article numbers instead of page numbers. See further details here.