MCR-Modified CA–Markov Model for the Simulation of Urban Expansion
by
 ,
,
Xiuquan Li
1,2,3, 
Meizhen Wang
1,2,3,*,
Xuejun Liu
1,2,3,
Zhuan Chen
4,
Xiaojian Wei
4 and
Weitao Che
5 1
Key Laboratory of Virtual Geographic Environment (Nanjing Normal University), Ministry of Education, Nanjing 210023, China
2
State Key Laboratory Cultivation Base of Geographical Environment Evolution (Jiangsu Province), Nanjing 210023, China
3
Jiangsu Center for Collaborative Innovation in Geographical Information Resource Development and Application, Nanjing 210023, China
4
Faculty of Geomatics, East China University of Technology, Nanchang 330013, China
5
Guangzhou Institute of Geography, Guangzhou 510070, China
*
Author to whom correspondence should be addressed.
Sustainability 2018, 10(9), 3116; https://doi.org/10.3390/su10093116
Submission received: 6 July 2018
/
Revised: 21 August 2018
/
Accepted: 28 August 2018
/
Published: 31 August 2018
(This article belongs to the Special Issue Data Analytics on Sustainable, Resilient and Just Communities)
Abstract
:Ecosystem balance is an important factor that affects healthy and sustainable urban development. The traditional cellular automata (CA) model considers only a few ecological factors, however, the MCR model can account for ecological factors. In previous studies, few ecological factors were added to the CA model. Thus, the minimal cumulative resistance (MCR) model is combined with the CA and Markov models for the simulation of urban expansion. To verify the reliability of the method, the Wuhan metropolitan area was selected as a representative urban area, and its expansion in the past and future was simulated. Firstly, seven influential factors were selected from the perspective of location theory. The transformation rules of the comprehensive resistance surface followed by the modified CA–Markov model were constructed on the basis of the MCR model. The expansion of the Wuhan metropolitan area in 2013 was simulated on the basis of the 1996 and 2006 maps of land-use status, and the kappa coefficient was used as an index to evaluate the accuracy of the proposed method. Then, the expansion of the Wuhan metropolitan area in 2020 was simulated. Finally, the simulation results obtained with and without the MCR model were compared and analysed from the macro- and micro levels. Results show that the prediction accuracy of the two models differed for ecological regions, such as woodlands and water bodies. The similarities between the regions that were overestimated and underestimated by the MCR-modified CA–Markov model and non-MCR model may be attributed to solution of the land-use transfer matrix with the Markov model. The accuracy of the MCR-modified CA–Markov model for predicting forests, water and other ecological regions was higher than that of the Markov model. Therefore, the proposed MCR-modified CA–Markov model has potential applications in environmentally-conscious urban expansion.
1. Introduction
The expansion of existing cities has become an unavoidable problem with the acceleration of urbanisation. The latest United Nations forecast stated that urban populations will account for 60% of the total global population by 2050 [1]. The rapid increase in urban populations has led to rapid changes in land use. For example, vast acreages of fertile agricultural land have been converted to urban construction land [2,3]. In addition, urban expansion causes ecological problems, such as the greenhouse effect [4], land degradation [5], and biodiversity reduction [6]. These problems seriously affect human life by destroying the balance of the original ecosystem [7]. Several approaches towards environmental protection, such as those implemented in the United States and Canada, are worth learning and understanding [8]. It is obvious that protecting the ecological environment is of great importance. China has also introduced a series of policies for environmental protection, such as the ‘Environmental Protection Law of the People’s Republic of China’ and ecological red-line districts. Ecological red-line districts should be defined on the basis of ecological function, sensitivity and vulnerability. In addition, they must be integrated into national spaces to establish a national ecological security pattern. Therefore, urban expansion should be based on the protection of the ecological environment to enable the sustainable and healthy development of the human and natural environments. Thus, predicting the future developmental direction of cities is necessary to optimise and adjust urban space structure while protecting the environment.
Urban expansion is a complex dynamic system that is influenced by numerous uncertain factors, such as natural conditions, economic society, culture and government policies [9,10]. Many dynamic models for urban expansion have been constructed. These models include logistic regression [11,12], Markov [13], cellular automata (CA) [14], multiagent model [15,16], and the Conversion of Land Use and its Effects (CLUE) [17]. The CA model has become the mainstream method for simulating urban expansion given its advantages, such as its ability to simulate evolutionary systems in discrete and nonlinear time and space [18]. Numerous local and international studies on the application of CA in modelling urban areas exist and have provided highly positive results. For example, the constrained CA model has been used to simulate land-use change in Cincinnati [19]. The logistic regression CA model has been used to simulate urban expansion in Guangzhou [12]. Furthermore, the urban expansion of Dongguan has been studied systematically [20,21]. However, previous works have focused on the effect of traffic and terrain factors on urban expansion. These factors are weakly related to the effect of ecological factors on urban expansion. Urban development should be expanded on the basis of protecting the features of the original ecological environment, such as woodlands and water bodies.
Although the CA model can simulate urban expansion well, the MCR model can account for ecological factors. The existing research on the MCR model has focused on its use in the evaluation of ecological suitability and has not combined it with the CA model for the simulation of urban expansion. Thus, our present work aims to generate the appropriate atlas of the MCR model to modify the CA–Markov transformation rules in the simulation of urban expansion. We also verify the practicability and reliability of our proposed method by using the kappa coefficient as an index of accuracy. We select the Wuhan metropolitan area as a representative urban area and simulate its future expansion in 2020. We perform an accuracy test and compare the simulation results of the CA–Markov with those of the non-MCR model on macro- and micro levels to identify the model that provides the best simulation under the existing ecological factors. Our work provides an approach for maximising land resources to protect the environment and a reference for decision-making in government land planning.
2. Research Process
2.1. Overall Process
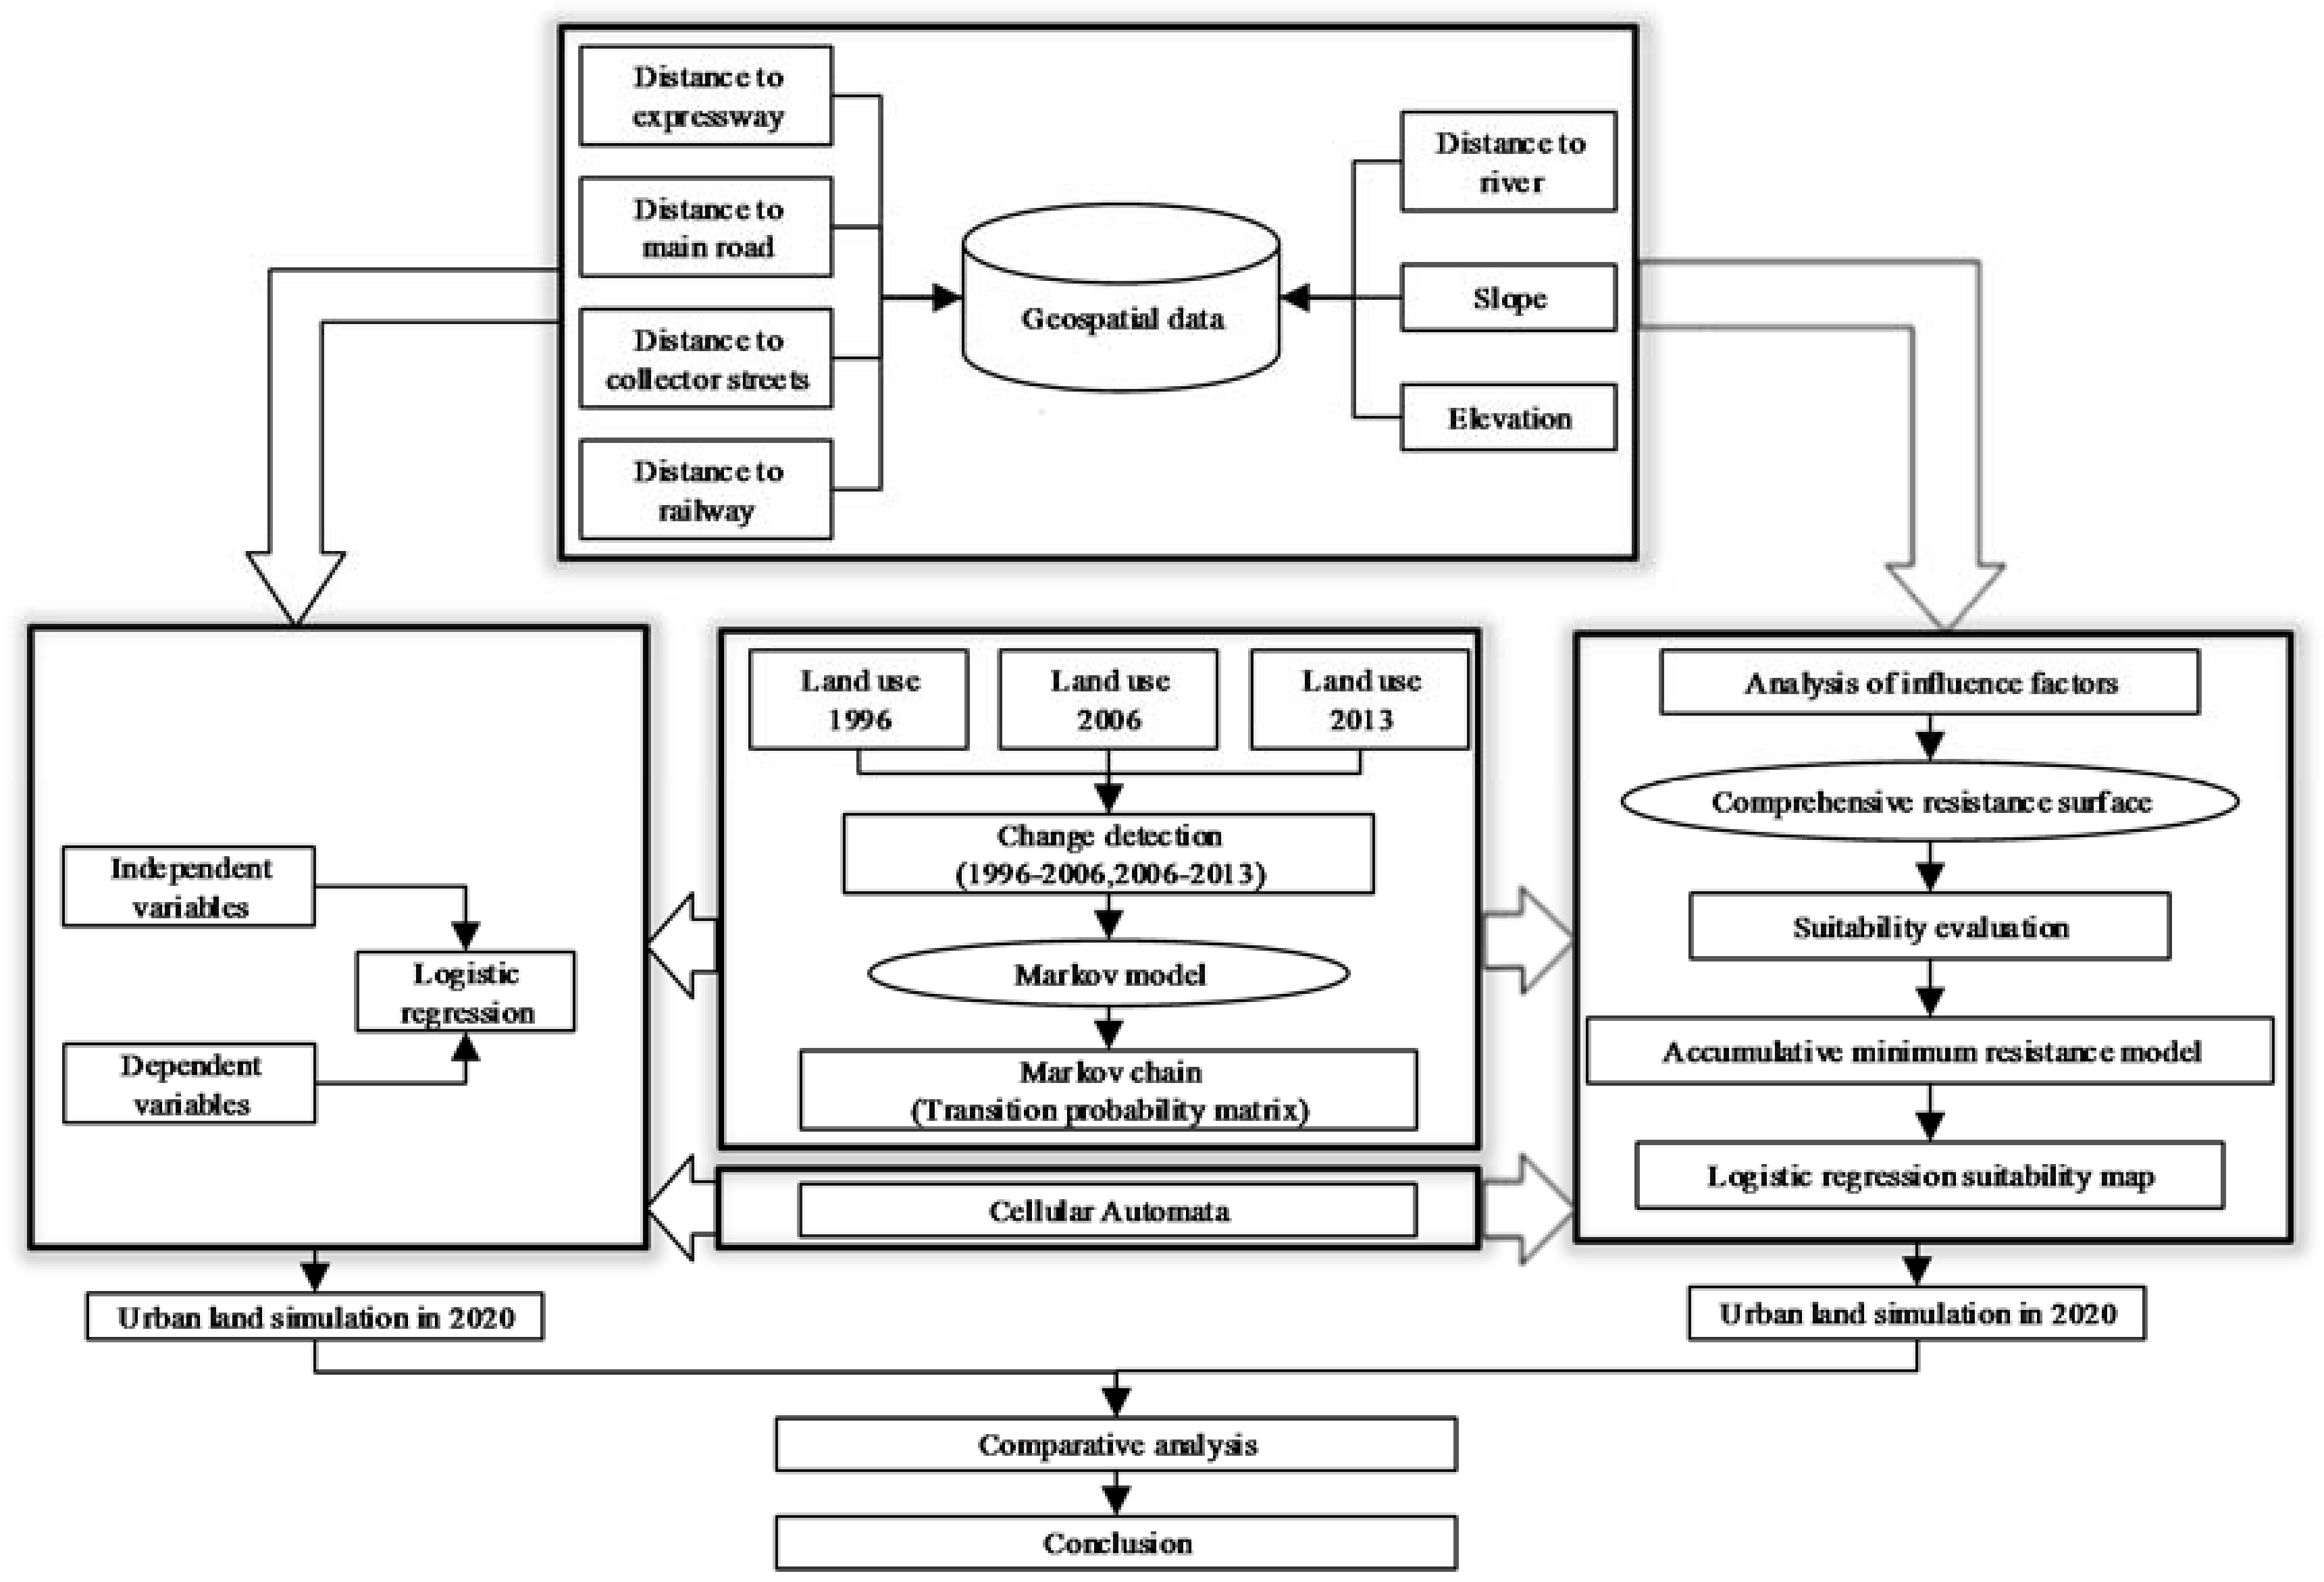
In this work, we combine the MCR and CA–Markov models. The MCR model is used to evaluate the suitability of comprehensive resistance surfaces. The results of MCR and non-MCR models for the simulation of urban expansion in 2013 are compared. Finally, urban expansion in 2020 is predicted. Figure 1 depicts the flowchart of the study.
(1) The city’s dynamic quantity and spatial pattern are analysed by using the data of land-use status in 1996, 2006 and 2013 to generate a land-use transfer matrix to depict spatiotemporal changes. This land-use transfer matrix is solved by using Markov model. (2) Factors that affect urban expansion are determined in accordance with location theory. These factors can be divided into three categories, namely, advantage, influence and restriction factors. (3) Extended source selection is performed on the basis of the MCR model. Weight resistance is determined through Delphi method analysis, and a comprehensive resistance surface is constructed. The natural breakpoint method is divided into five suitability grades in accordance with the actual situation. The area statistics are analysed, and each grade is evaluated. Finally, the suitability of the atlas is determined on the basis of the MCR model. (4) The MCR model is used to modify the transformation rules of the CA–Markov model, and urban expansion in 2013 is simulated on the basis of data derived from 1996 to 2006 land-use status maps. The kappa coefficient is used as an index of model accuracy. The results of the MCR and non-MCR models are compared on the macro- and micro levels. (5) Urban expansion in 2020 is simulated by using the MCR-modified CA–Markov model.
2.2. MCR Model
The MCR model refers to the cost of crossing a heterogeneous landscape between a source and a target and reflects spatial accessibility in a heterogeneous landscape. It was initially applied in conservation biology to model species dispersal and ecological landscapes. The MCR model was later applied to model urban spatial expansion and to evaluate land suitability for ecological applications, development and construction [22,23].
Local ecosystems comprise woodlands, water areas and local biotope and should be protected during urban construction. In previous studies, few ecological factors were added to the CA model. By contrast, the MCR model can evaluate the suitability of the original land-use type, build a comprehensive resistance surface and obtain the spatial distribution of suitable land-use types. High suitability is conducive for urban expansion. The pixel value and grid number mutation point are used to delineate urban space partitions. The pixel value corresponds to the minimum cumulative resistance value of MCR, and various zoning areas can be calculated on the basis of the number of grids. The “natural break point” category is based on natural groupings inherent in the data. The classification intervals will be identified to best group similar values and maximize differences between classes. Elements are divided into classes for which their boundaries are set at locations where data values are relatively different. In this paper, the spatial distribution is divided into five grades, the use of “natural break point” ensures that differences between classes are maximized. By using the natural breakpoint method, the spatial distribution is divided into five grades: very unsuitable, unsuitable, less suitable, suitable, and very suitable. Finally, the MCR-modified CA–Markov model is used to simulate urban expansion under the consideration of ecological factors.
2.3. Multiple-Factor Fixed Weight
Weight is used to measure the degree of influence of each influential factor on the subject. High weights indicate that the index is highly important in the whole evaluation process. Given that different decision-makers have different knowledge about and understanding of weights, the weight assignment size may vary. Weight may be influenced by human factors regardless of the weight determination method used. This interference may affect the accuracy of the simulation. Therefore, researchers attempt to determine the weight, which is a subjective measure, objectively. The dominant factors in this work include distance from the (1) expressway, (2) railway, (3) main road and (4) collector streets. The factors of influence include natural factors, such as elevation and slope. The factors of restriction include distance from the river and water body. The single-factor score and comprehensive weight of each index factor are determined through Delphi method analysis. The Delphi method is defined as a systematic method for the solicitation and aggregation of informed judgments from a group of experts on a particular subject. It enables structured communication among group of individuals allowing them, as a whole, to deal with a complex problem in an effective way [24]. Then, the resistance surface is constructed.
2.4. Logistic Regression Model Construction
Regression is a method to discover the empirical relationships between a binary dependent and several independent categorical and continuous variables.
The equation of logistic regression is shown as follow:
where represents the probability of converting non-urban land into urban land. respectively represents the regression coefficient of the independent variables. respectively refers to the independent variables [25].
Table 1 shows dependent and independent variables of urban expansion. The dependent variables represent whether other land use types will change into construction land. 0 means that there is no land use change in a certain grid during the two periods of data; 1 represents the land use in current gird has been changed from non-construction to construction land.
Considering data availability, consistency, and correlation with the land use change, we take the following independent variables into consideration, elevation and slope, distance from the (1) expressway, (2) railway, (3) main road, (4) collector streets, (5) river. Each independent variable was divided into five levels. Level 5 to level 1 respectively means very suitable, suitable, less suitable, unsuitable, and least suitable. The probability of change from other land use types to construction land in each grid is estimated based on logistic regression model. Variables, which have significant impact on land use changes from non-urban land to urban land, are screened out, and then a quantitative relationship was established among them.
To avoid spatial autocorrelation in data, 10,000 samples were selected from the uniformly distributed study area by stratified random sampling. In order to ensure the number of dependent variables (0 and 1) approximately equal, 7000 sample points were chosen to participate in the logistic regression model.
3. Experiment and Analysis
3.1. Experimental Data
3.1.1. Experimental Area
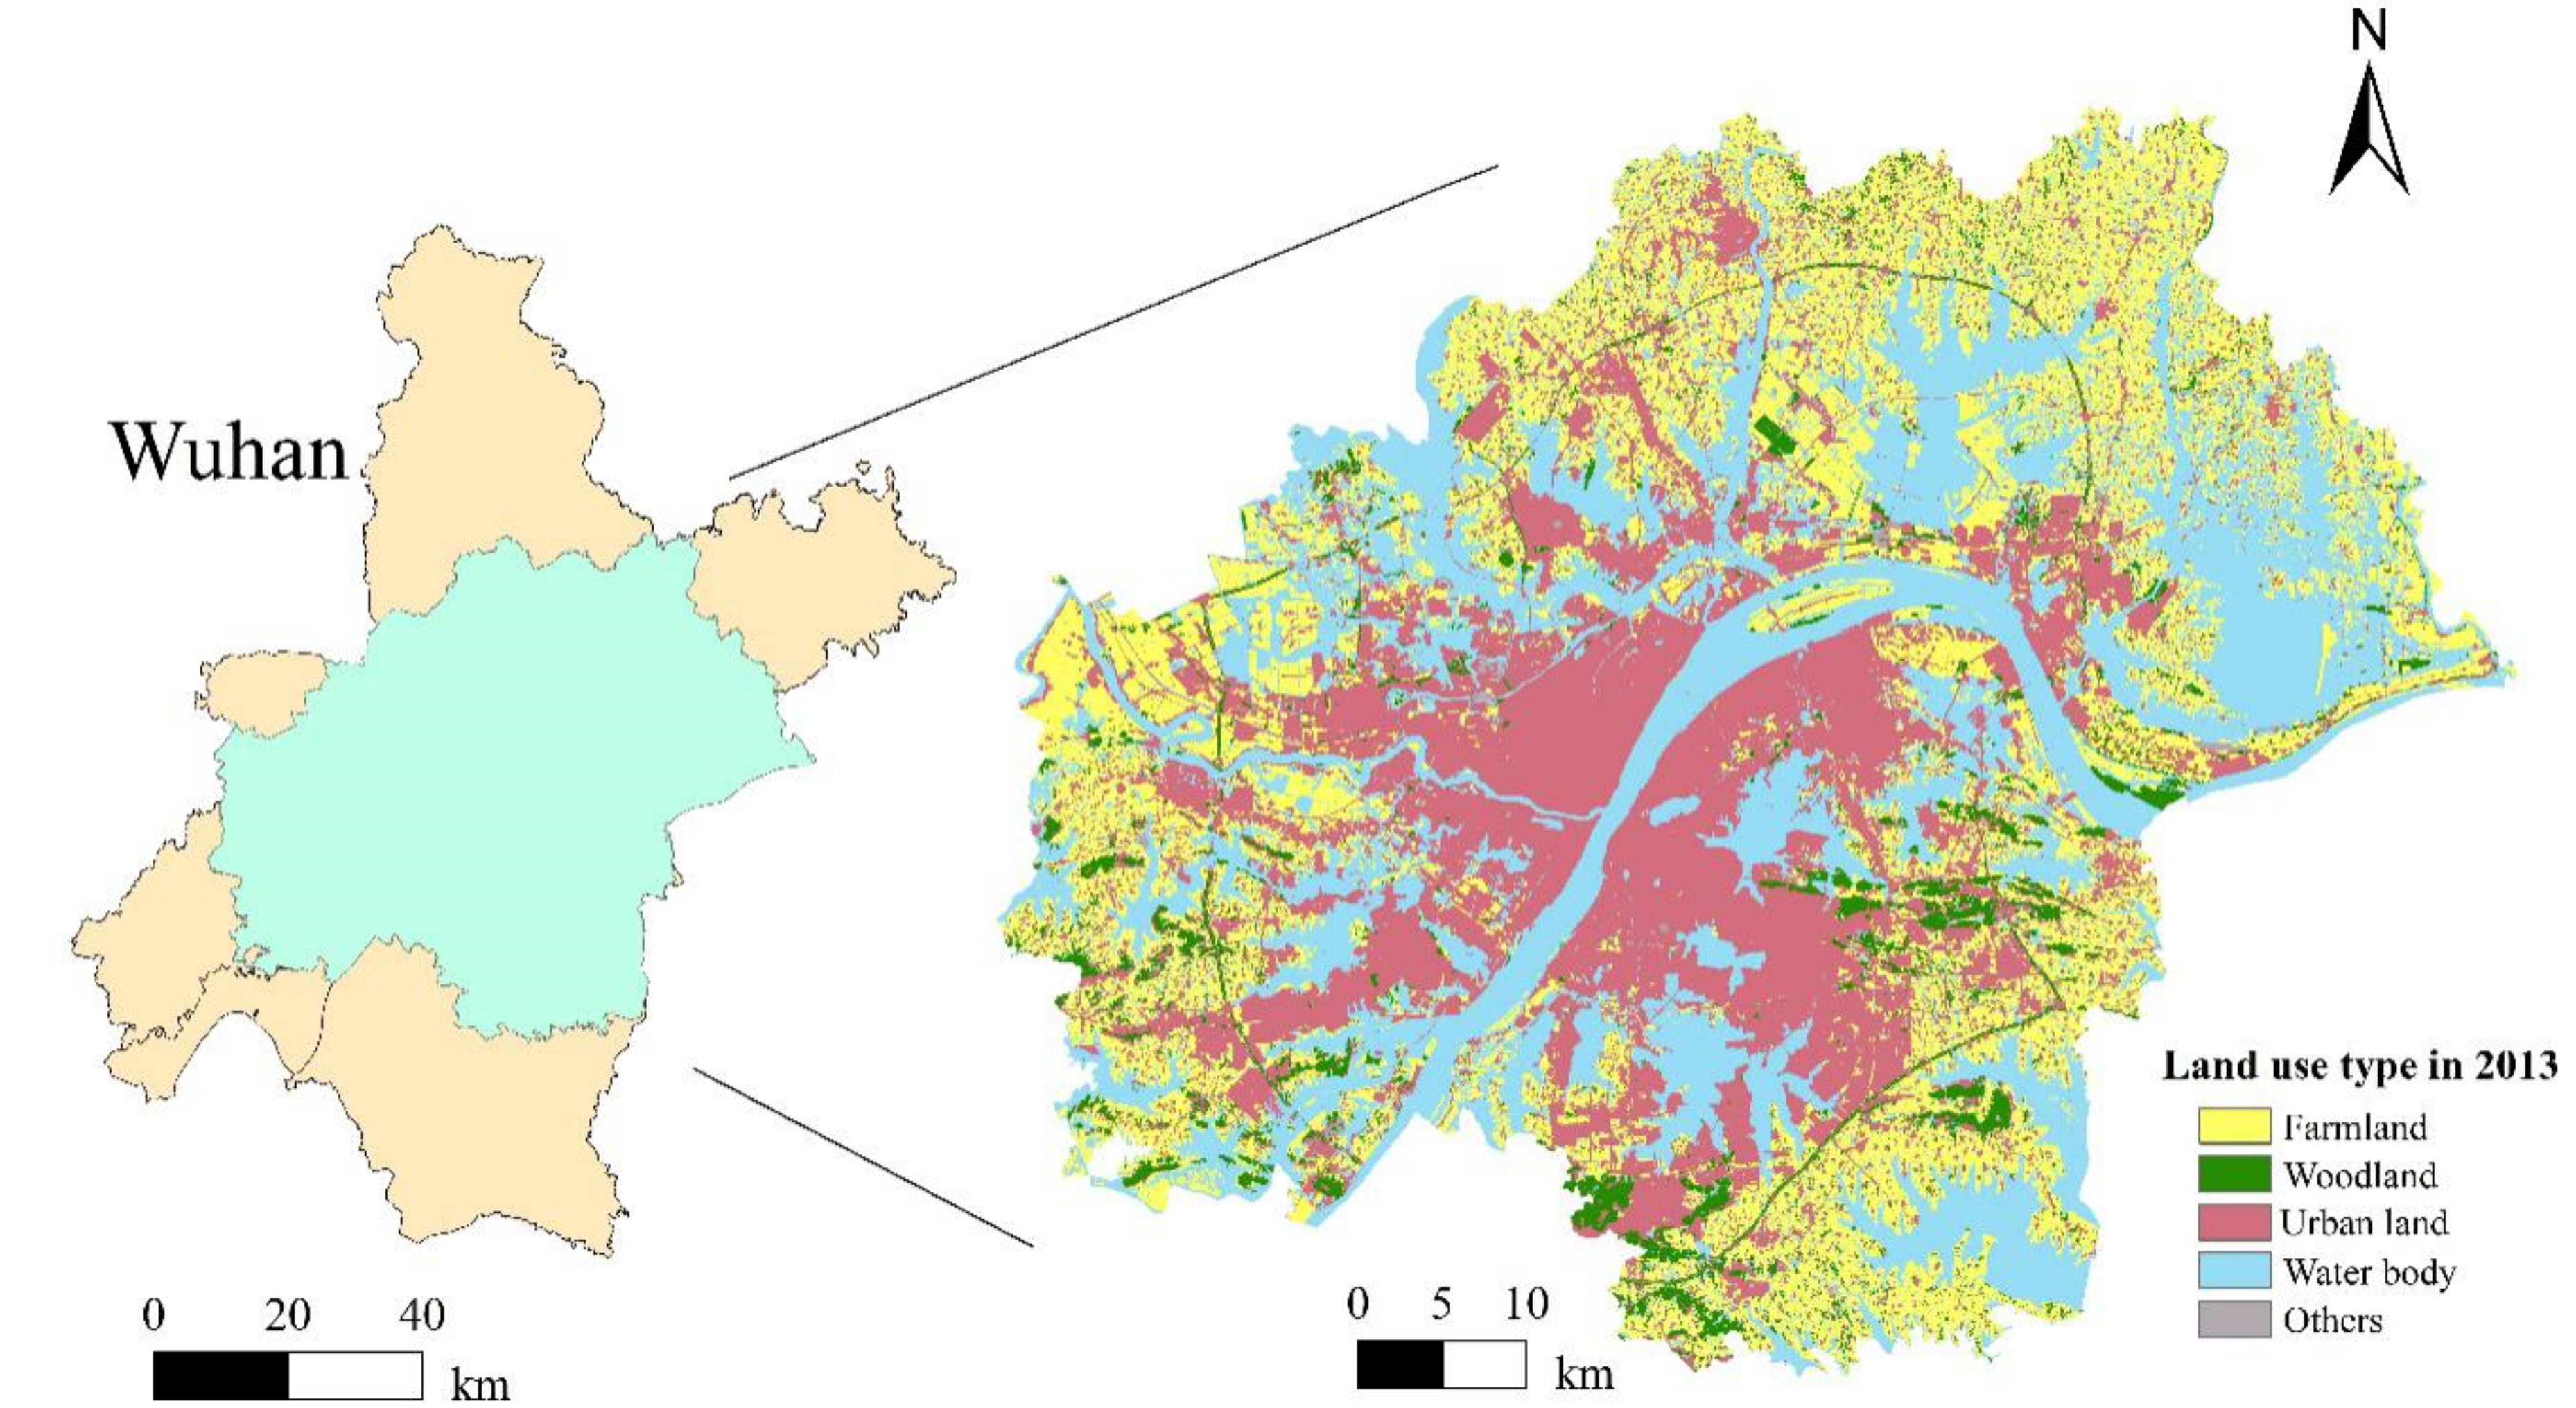
The Wuhan metropolitan area is located in the hinterlands of China and is a major city in Central China. The Yangtze River and its largest tributary, the Han Jiang River, intersect in Wuhan, which is divided into three areas. The central Wuhan metropolitan area is characterised by low and flat features with hills in the north and south. It is surrounded by hills and ridges. The entire terrain is dominated by plains. The Wuhan metropolitan area has numerous water bodies, landscapes and famous sceneries. These features constitute the local ecological environment of the area. The environment of the Wuhan metropolitan area encompasses the Yangtze River, East Lake, National Wetland Park of Dragon Island and woodlands. The local government designated a 1814 km2 urban ecological ‘red-line district’ wherein construction is prohibited. The area of forest land in Wuhan is 20,568.84 ha in 2013. This tract accounts for 5% of the total area of the Wuhan metropolitan area and should be protected during urban development. We take the Wuhan metropolitan area as a representative area and use the MCR-modified CA–Markov model to simulate the future expansion of this area. We further verify the reliability of our proposed method.
We utilise the 1996, 2006, and 2013 land-use data of the Wuhan metropolitan area. Figure 2 shows the land-use type in 2013. These data are retrieved from the Land Resources and Planning Bureau of Wuhan City. Data accuracy exceeds 85%, and high data reliability. DEM data for farmland, woodland, urban land, water bodies and other features are retrieved from ASTER GDEM with a resolution of 30 m × 30 m. The road and river networks are an artificial interpretation of the data of the 1:1 million topographic map.
3.1.2. Spatial Pattern of Land-Use Change
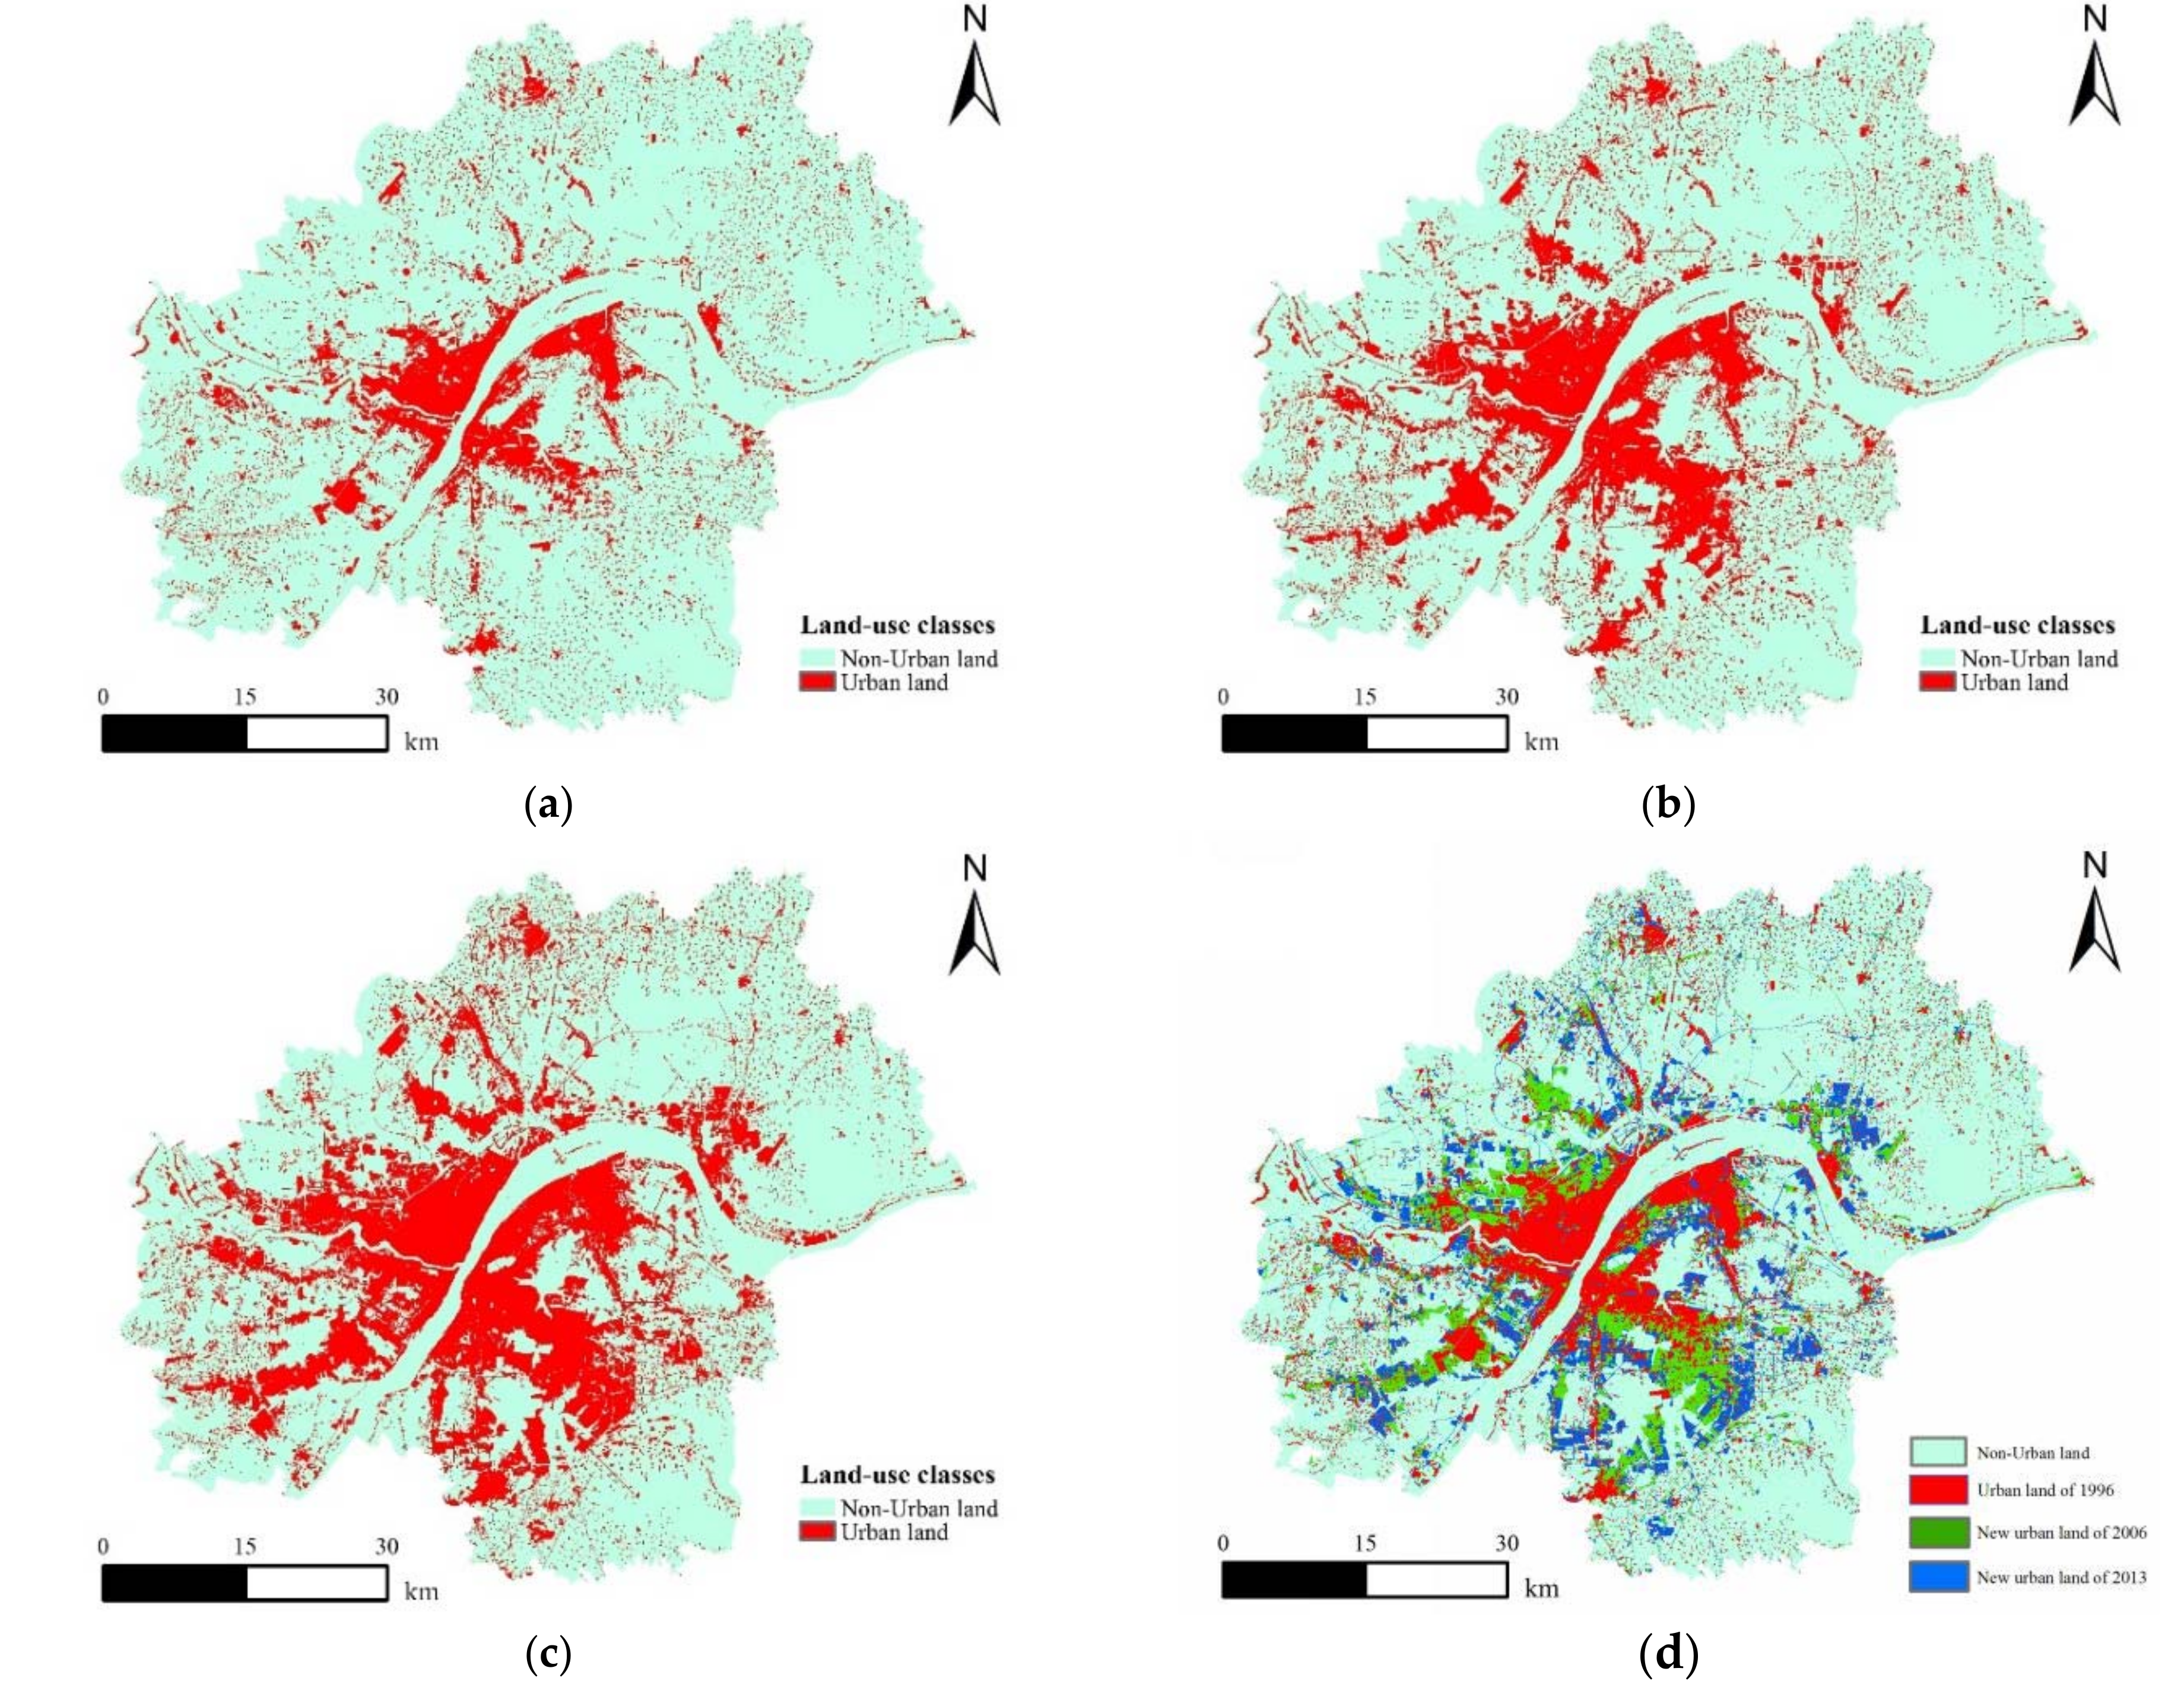
To visualise the expansion and change of urban space, urban land was extracted and analysed by using the extraction and analysis module in ArcGIS10.1. The spatial distribution of urban land in 1996, 2006, and 2013 are shown in Figure 3.
Jianghan District has undergone the most drastic expansion. The expansion of this district mainly extends along the northwest direction and gradually extends from the second ring line of the main city to Bai Bu Pavilion at Changqing Road. The expansion of Hanyang District has mainly concentrated in the west along the direction of Hanyang Avenue, which is the economic and technological development zone of Wuhan. The expansion of Hanyang District has been influenced by the government’s regulation policy, which has enlarged expansion scales and regional areas. The Hongshan District has expanded along Tang Xun Lake to the surrounding area. The built-up area, which consists of Huangpi, Jiangxia, Caidian, and Xinzhou Districts, has negligibly changed. Urban land in the Wuchang District has expanded towards the east. This area is known as the Guanshan Group and comprises the East Lake High-Tech Development Zone and the Guan Dong and Guan Nan Industrial Parks. Real-estate developers rehabilitate original city features, transform modern residential areas and business districts, as well as construct new industrial parks and development zones to expand urban areas.
3.2. Evaluation Based on Logistic Regression Model
Logistic regression was used to analyse various driving factors, and those with poor significance were removed. The regression equation was refitted and tested until the regression coefficient of variables was basically significant. The driving factors that pass the significance level test will contribute to the subsequent suitability atlas.
In this paper, the regression coefficient of the Wald statistic test model is adopted. If the probability p-values is less than the given significance level (in the paper ), the related explanatory variable will be remained. Otherwise, it will be eliminated.
By using SPSS, the logistic regression equation is established to solve the probability of certain land use types that might appear in each grid. The results are shown in Table 2 and Table 3.
As shown in Table 2 the p-value of elevation is 0.077, which indicates the elevation is not a significant variable. It is found that the terrain fluctuation of Wuhan metropolitan area is small, and most of them are between 0 and 6 degrees. Therefore, the elevation factor was eliminated.
In Table 3 the regression coefficient represents the size of the change in urban expansion caused by the change of one unit of independent variable. The evaluates the interpretation degree of each independent variable to dependent variable. The standard error S.E. is employed to verify the regression coefficient.
As shown in Table 3 the regression coefficient of distance from the expressway, railway, main road, collector streets and river are negative, which indicates that the urban expansion rate decreases with the increase of distance.
Base on , the impact factors about urban expansion from 1996 to 2006 were ranked from large to small in terms of contribution rate: distance from main road, distance from railway, distance from collector streets, distance from expressway, distance from river, and slope. The contribution rate serves as a reference for the determination of multiple-factor fixed weight.
3.3. Mapping the Suitability Atlas with the MCR Model
3.3.1. Construction of Resistance Surface with the MCR Model
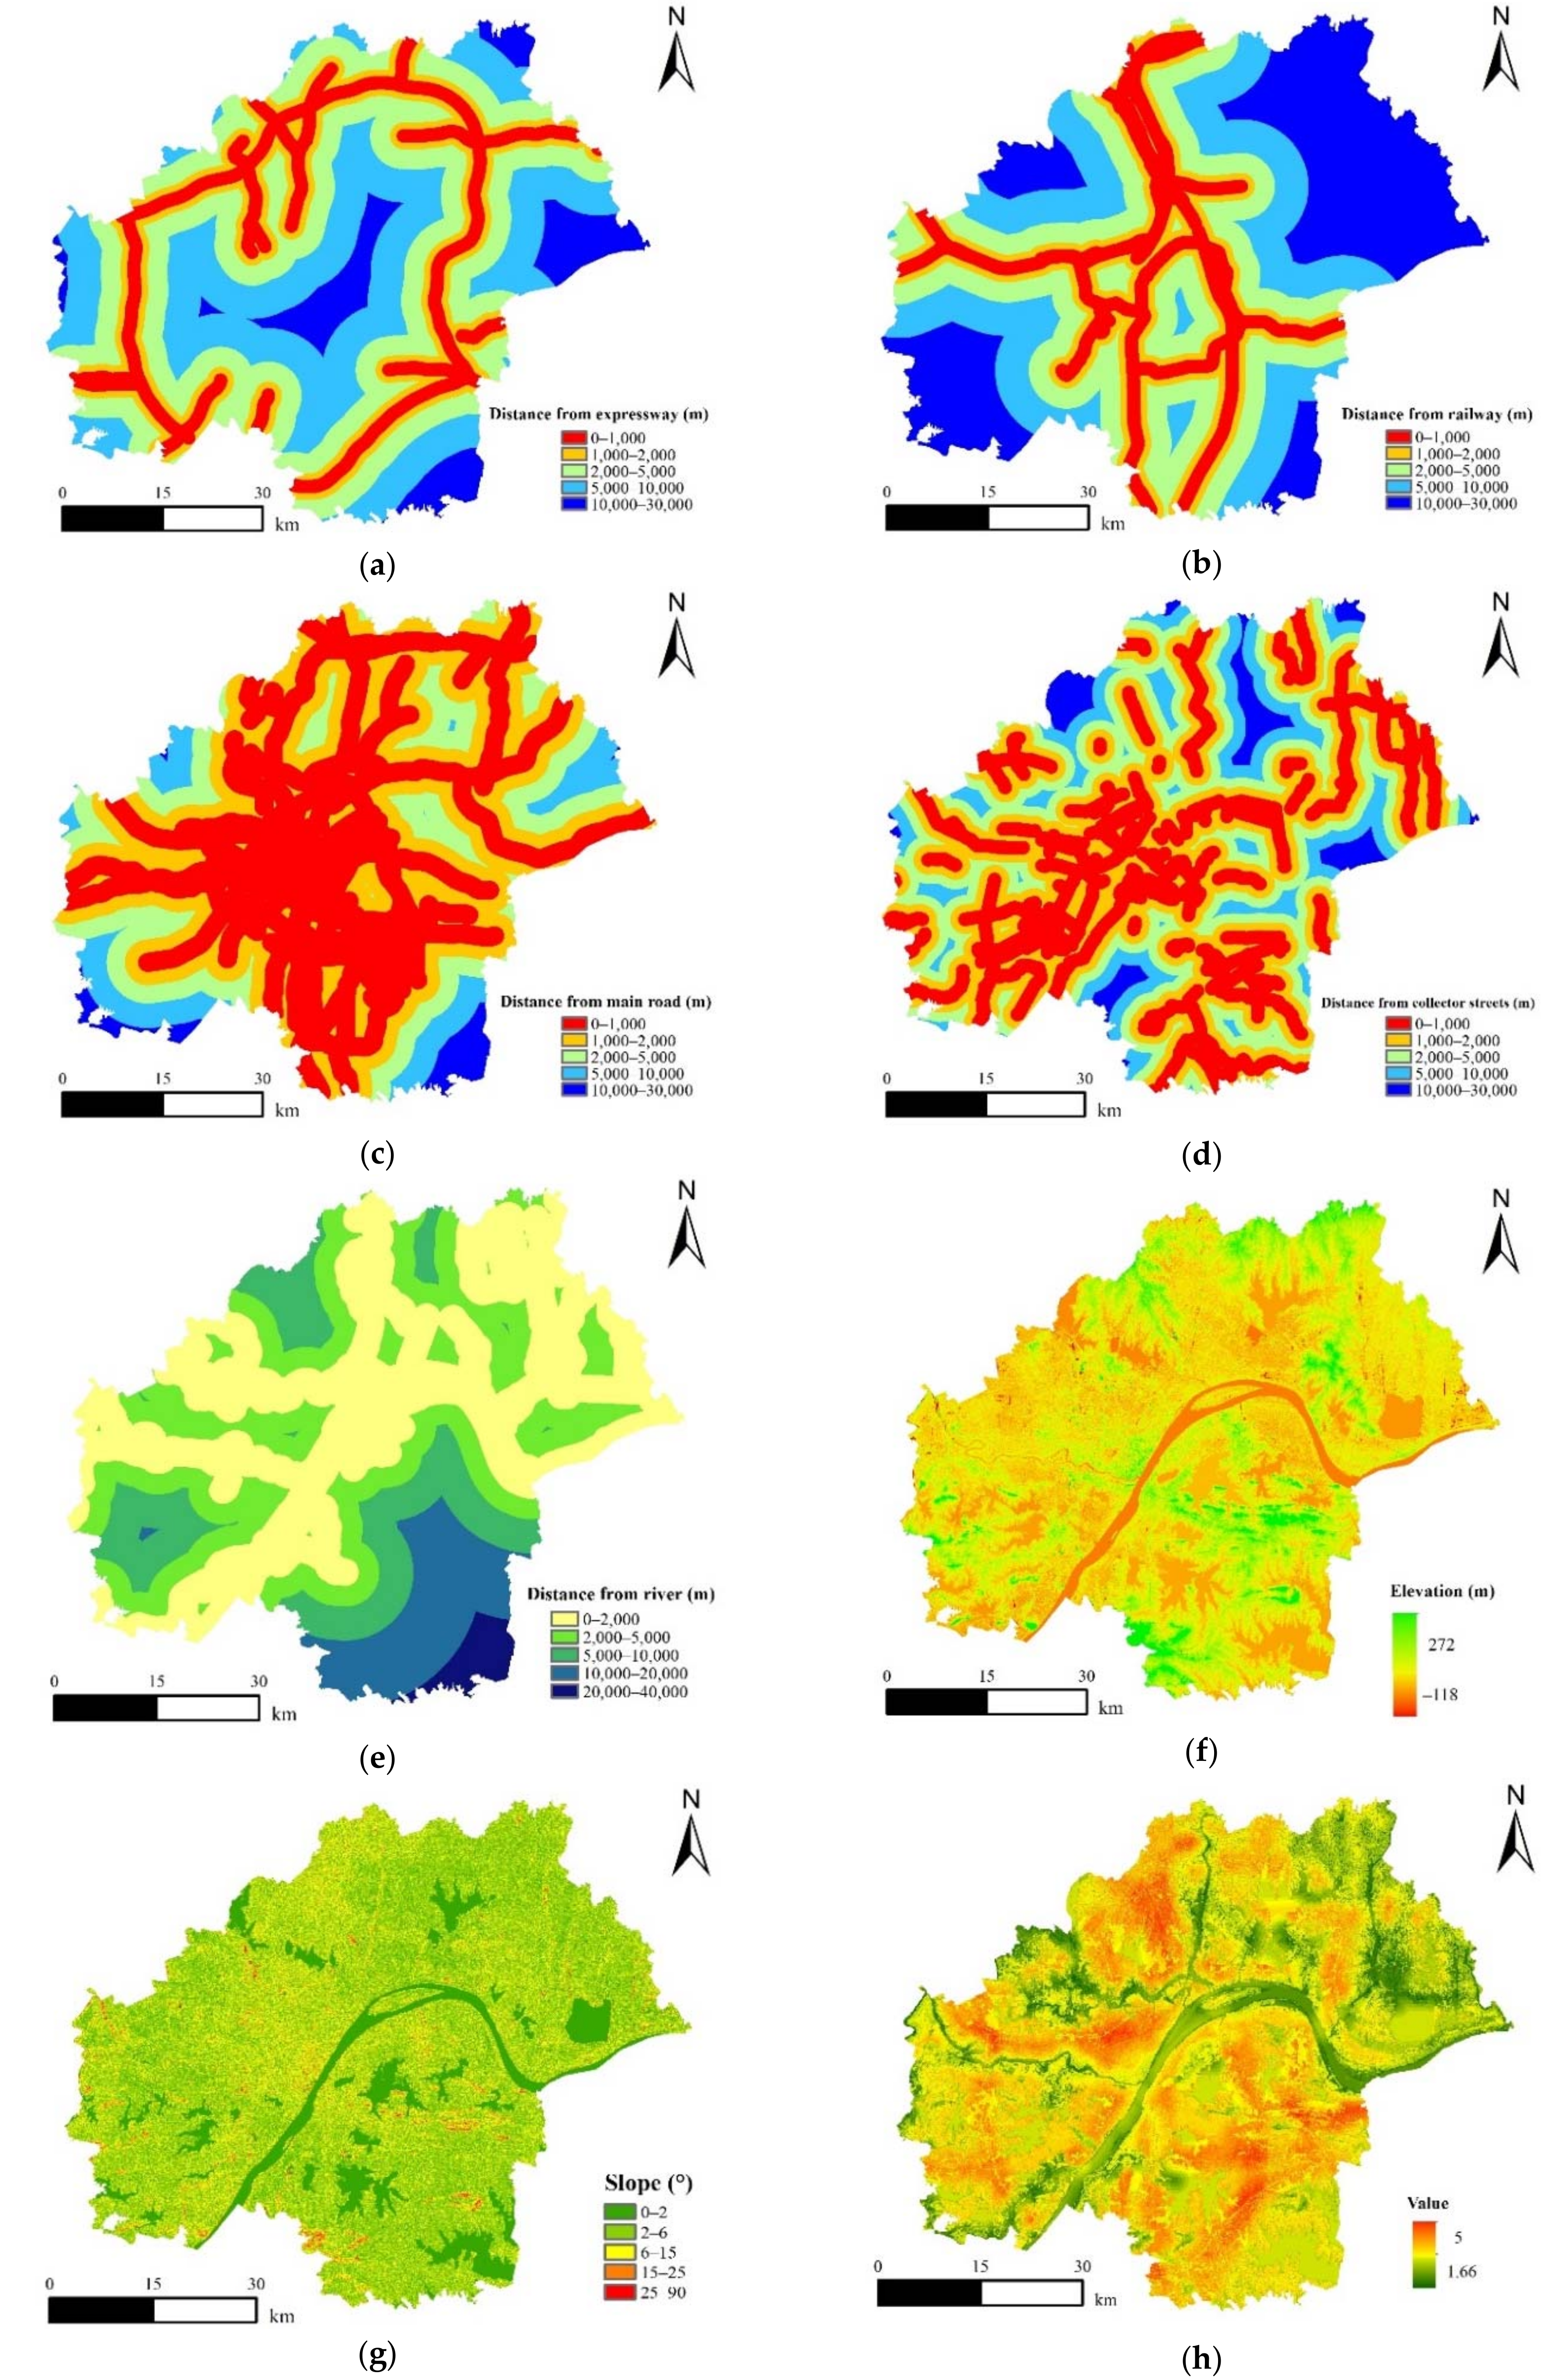
Analysis is carried out using seven indices, namely, slope and distance from the freeway, railway, main road, collector streets and river and the current situation of land use for each year. In accordance with the actual situation of the study area, distance is divided into five grades. The distance analysis module in ArcGIS software is used for Euclidean distance analysis. Figure 4 shows the results for the analysis of each factor.
Low altitude, low slope, and convenient transportation denote that urban expansion is relatively high. Otherwise, urban expansion is relatively low. The weight of each influential factor weight is determined through Delphi method analysis. The index factor of urban expansion is standardised on the basis of five-class taxonomy. Table 4 shows the standard rules of weight-grade division.
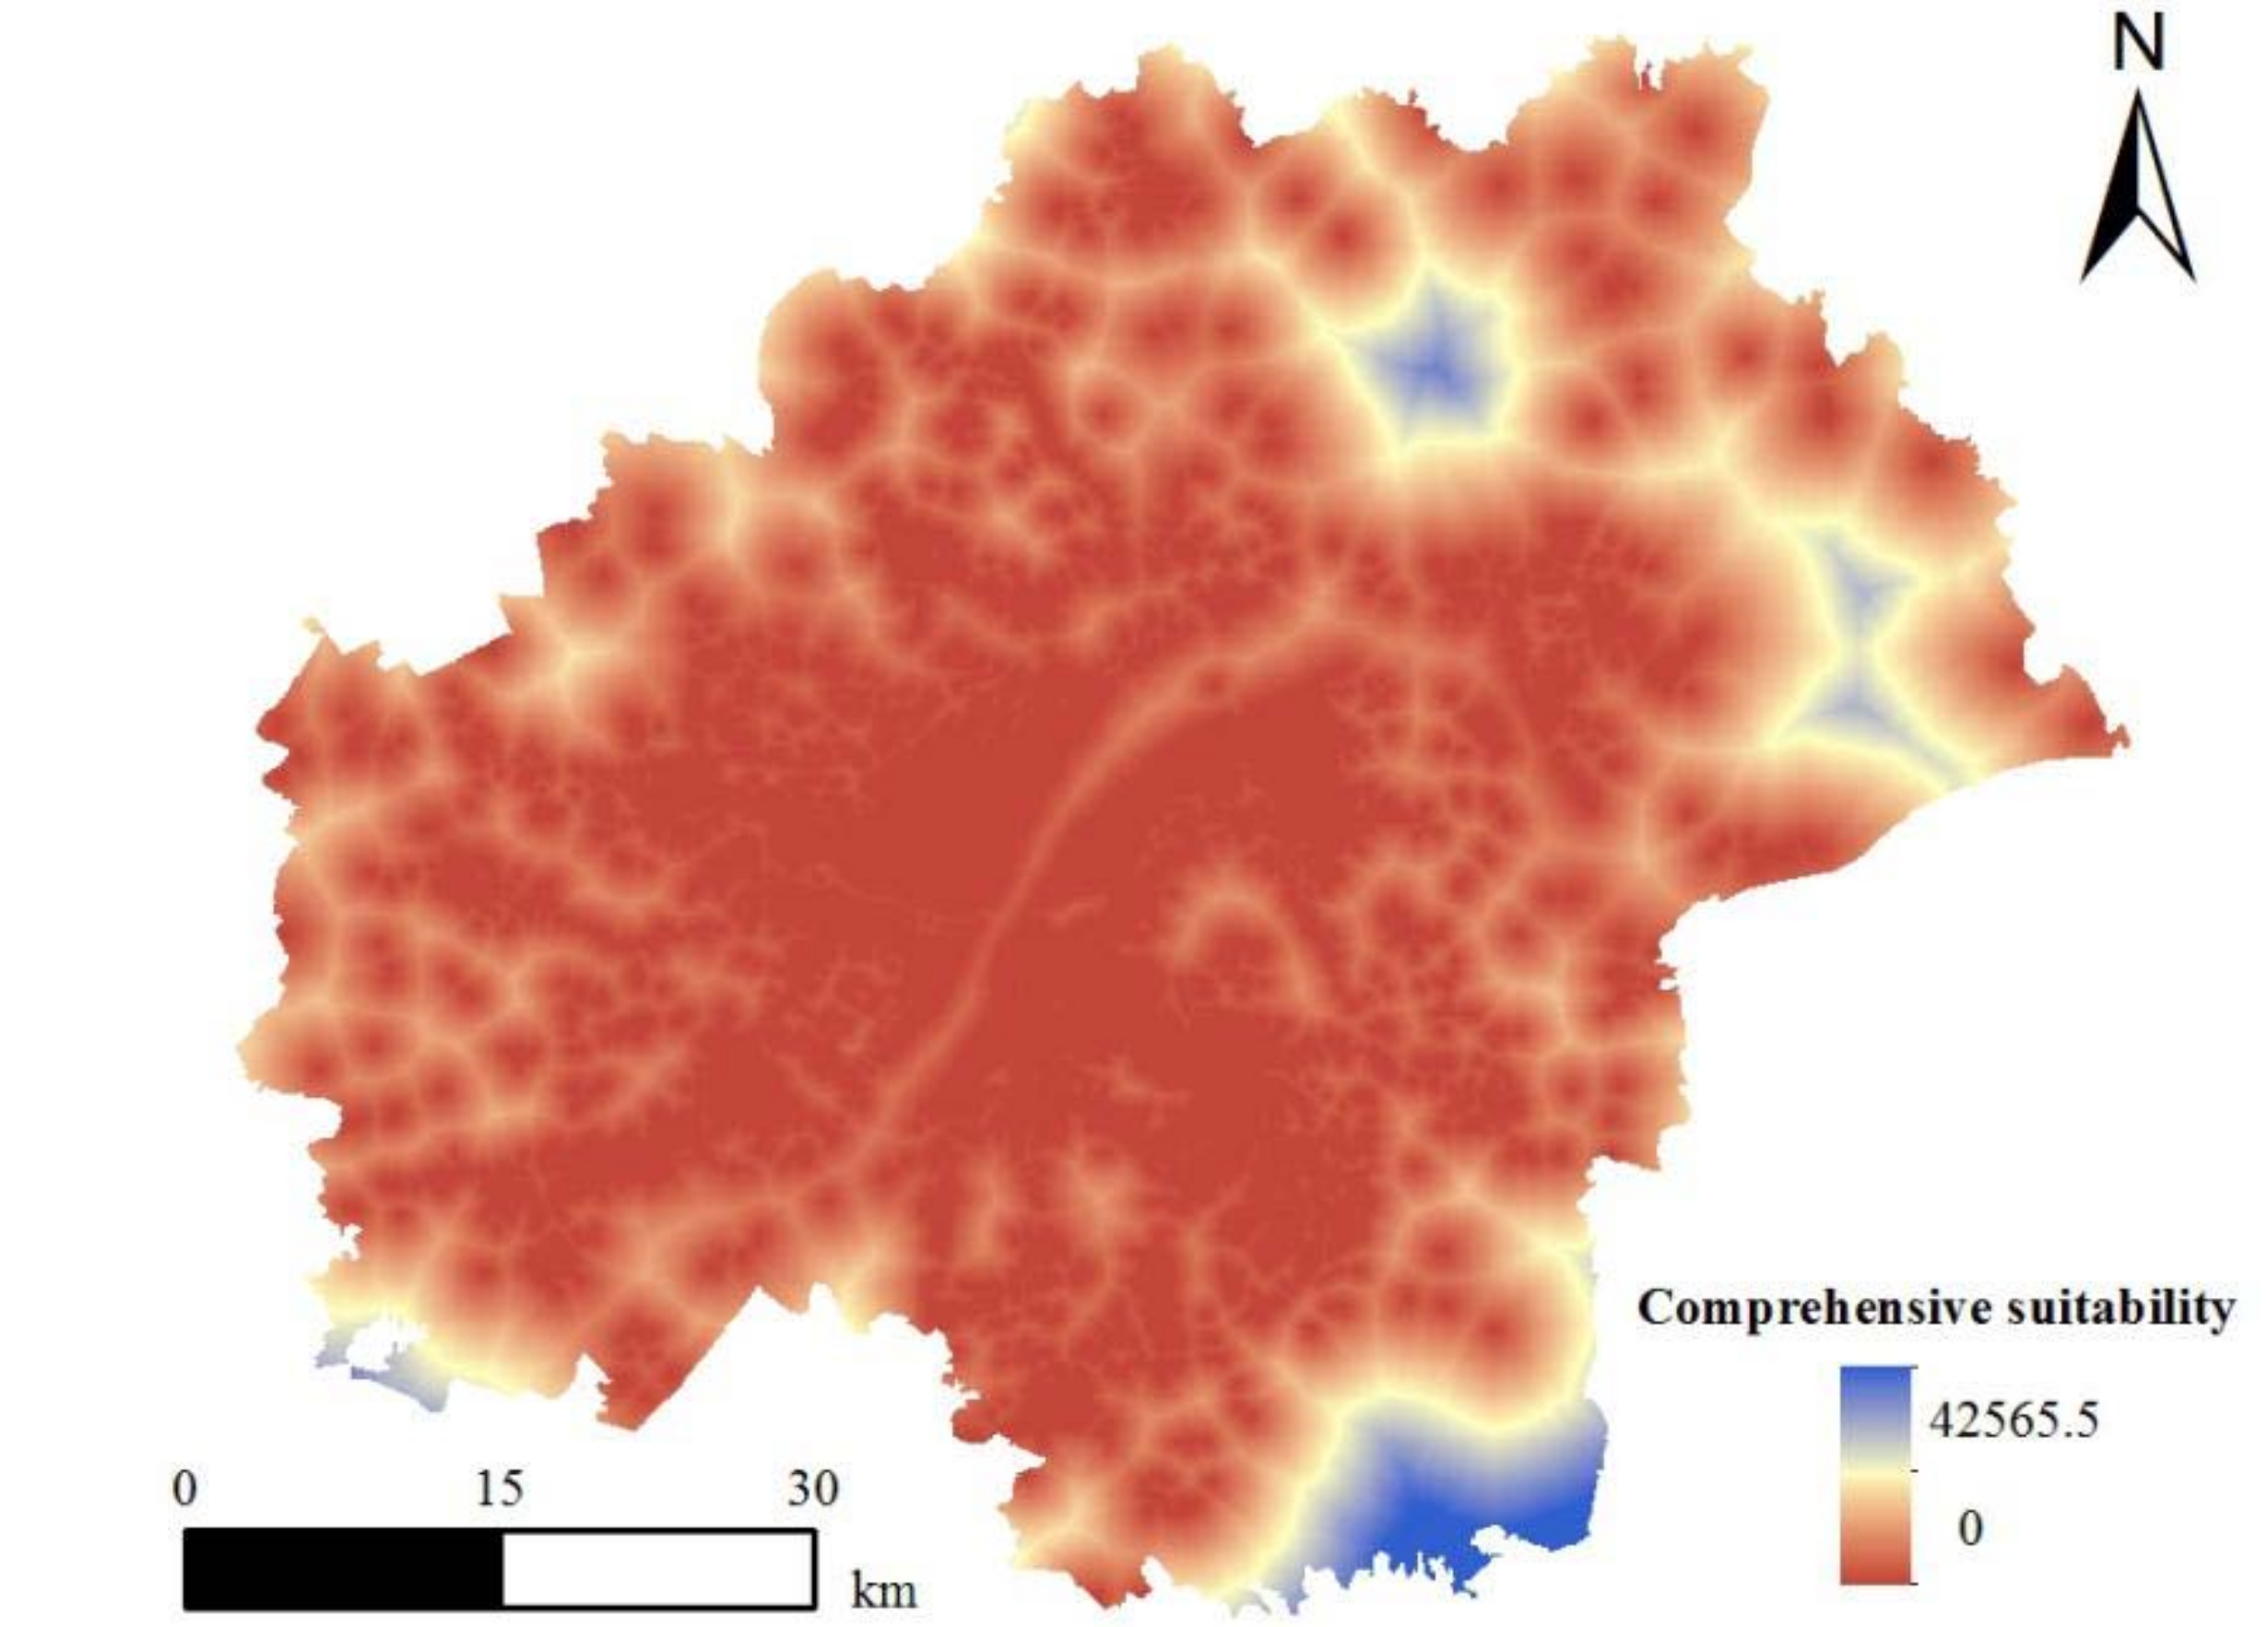
A grid calculator is used to determine the final composite suitability by weighting the spatial data level diagram of each influential factor in accordance with the weight set, as shown in Figure 4h.
In general, the spatial distribution of the comprehensive suitability of all influential factors fits the actual situation of the geographical location of Wuhan. The comprehensive suitability of the northeastern hilly area and Hanjiang River is relatively low, whereas that of other areas is high.
3.3.2. Suitability Evaluation Based on the MCR Model
After determining the expansion source (construction land) and comprehensive suitability of all influencing factors of urban expansion, the minimum cumulative cost of each grid unit to the nearest and lowest cost expansion source is calculated by the cost distance toolboxes in ArcGIS software. The grid size of the land-block evaluation unit is set to 30 m × 30 m in accordance with the actual situation of the study area. Consequently, MCR values have been calculated. The cumulative value of the calculated resistance can be considered as the suitability of construction land for expansion into the surrounding area, as shown in Figure 5.
Figure 5 shows that the spatial distribution of MCR values in the main urban area is generally characterised by a gradual decline in the values that surround the core of the Wuhu and Zhang Du Lakes, Nine Peak City Forest Park, and the Nanhu and Hanjiang Rivers. High resistance values are mainly distributed in the Nine Peak City Forest Park, Zhang du Lake and Hanjiang River. Medium resistance values are circularly stratified around high resistance values. Low-resistance areas are mainly distributed in river valleys or relatively flat platforms. Low resistance values are found near or around construction land. As a whole, the central plain has low resistance values with an average resistance value of 358.89. The highest resistance values are found near the Hanjiang River and famous scenic spots with an average resistance value of 5485.94. Therefore, urban space expansion firstly overcomes low-resistance areas and then expands to areas with lower resistance values.
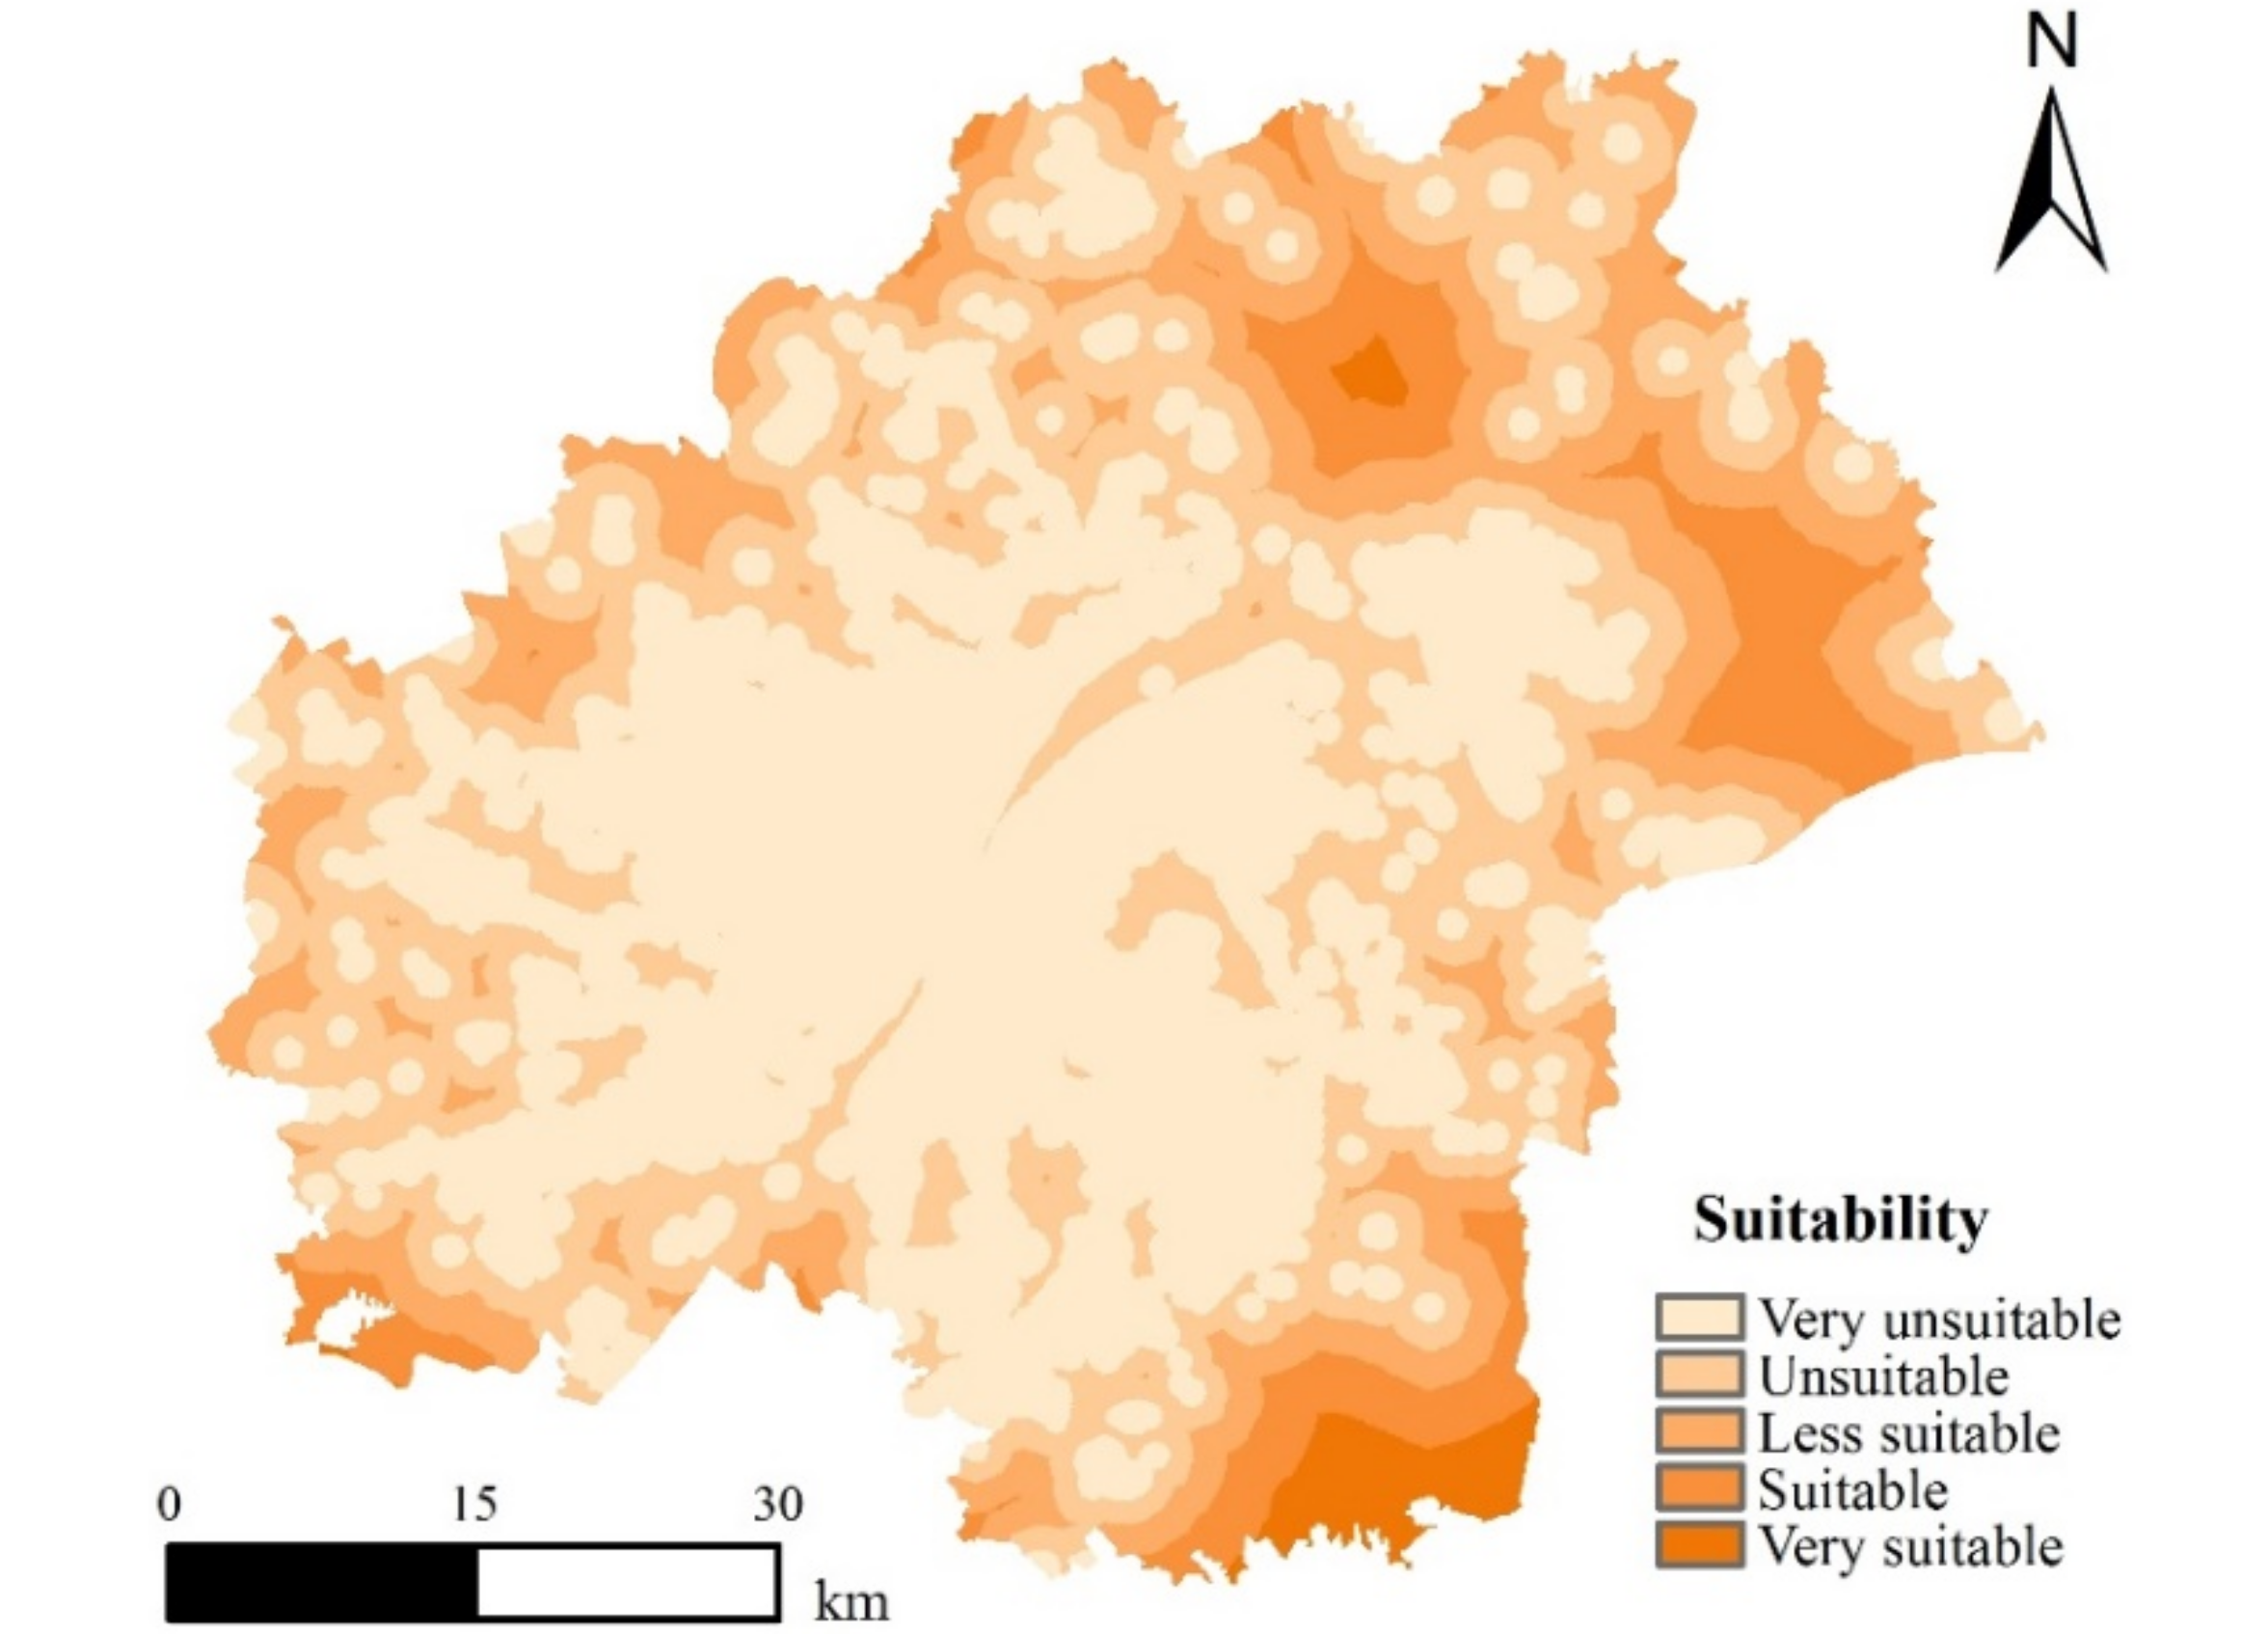
The spatial distribution of suitable zones is analysed on the basis of the spatial distribution map of the minimum accumulative resistance in the study area, as shown in Figure 6. The area and total area percentage of each area are quantified. Table 2 shows the results.
Figure 6 and Table 5 show that the areas that are very unsuitable for urban expansion are mainly distributed around water bodies, landscapes, and famous sceneries along the coasts of Wuhu and Zhang du Lake, Nine Peak City Forest Park, Nanhu Lake, and Hanjiang River, together with the ecological matrix of the Wuhan metropolitan area. We suggest that development and construction should be prohibited in 4706.38 ha or 1.15% of the total area of Wuhan. Areas that are less suitable for development and construction include cultivated land and forestland. We suggest that original cultivated lands and ecological environment, which account for 47,868.43 ha or 11.65% of the total area of Wuhan, should be protected. Suitable development and construction areas are mainly scattered around discarded and industrial lands and account for 120,458.93 ha or 29.33% of the total area of Wuhan. Areas that are highly suitable for development and construction surround urban residential and commercial areas and are mainly distributed along the old urban area. The expansion of these areas should be prioritised. We suggest using reconstruction methods to fully utilise these lands for maximum economic benefit.
3.4. Prediction and Verification of the MCR-Modified CA–Markov Model
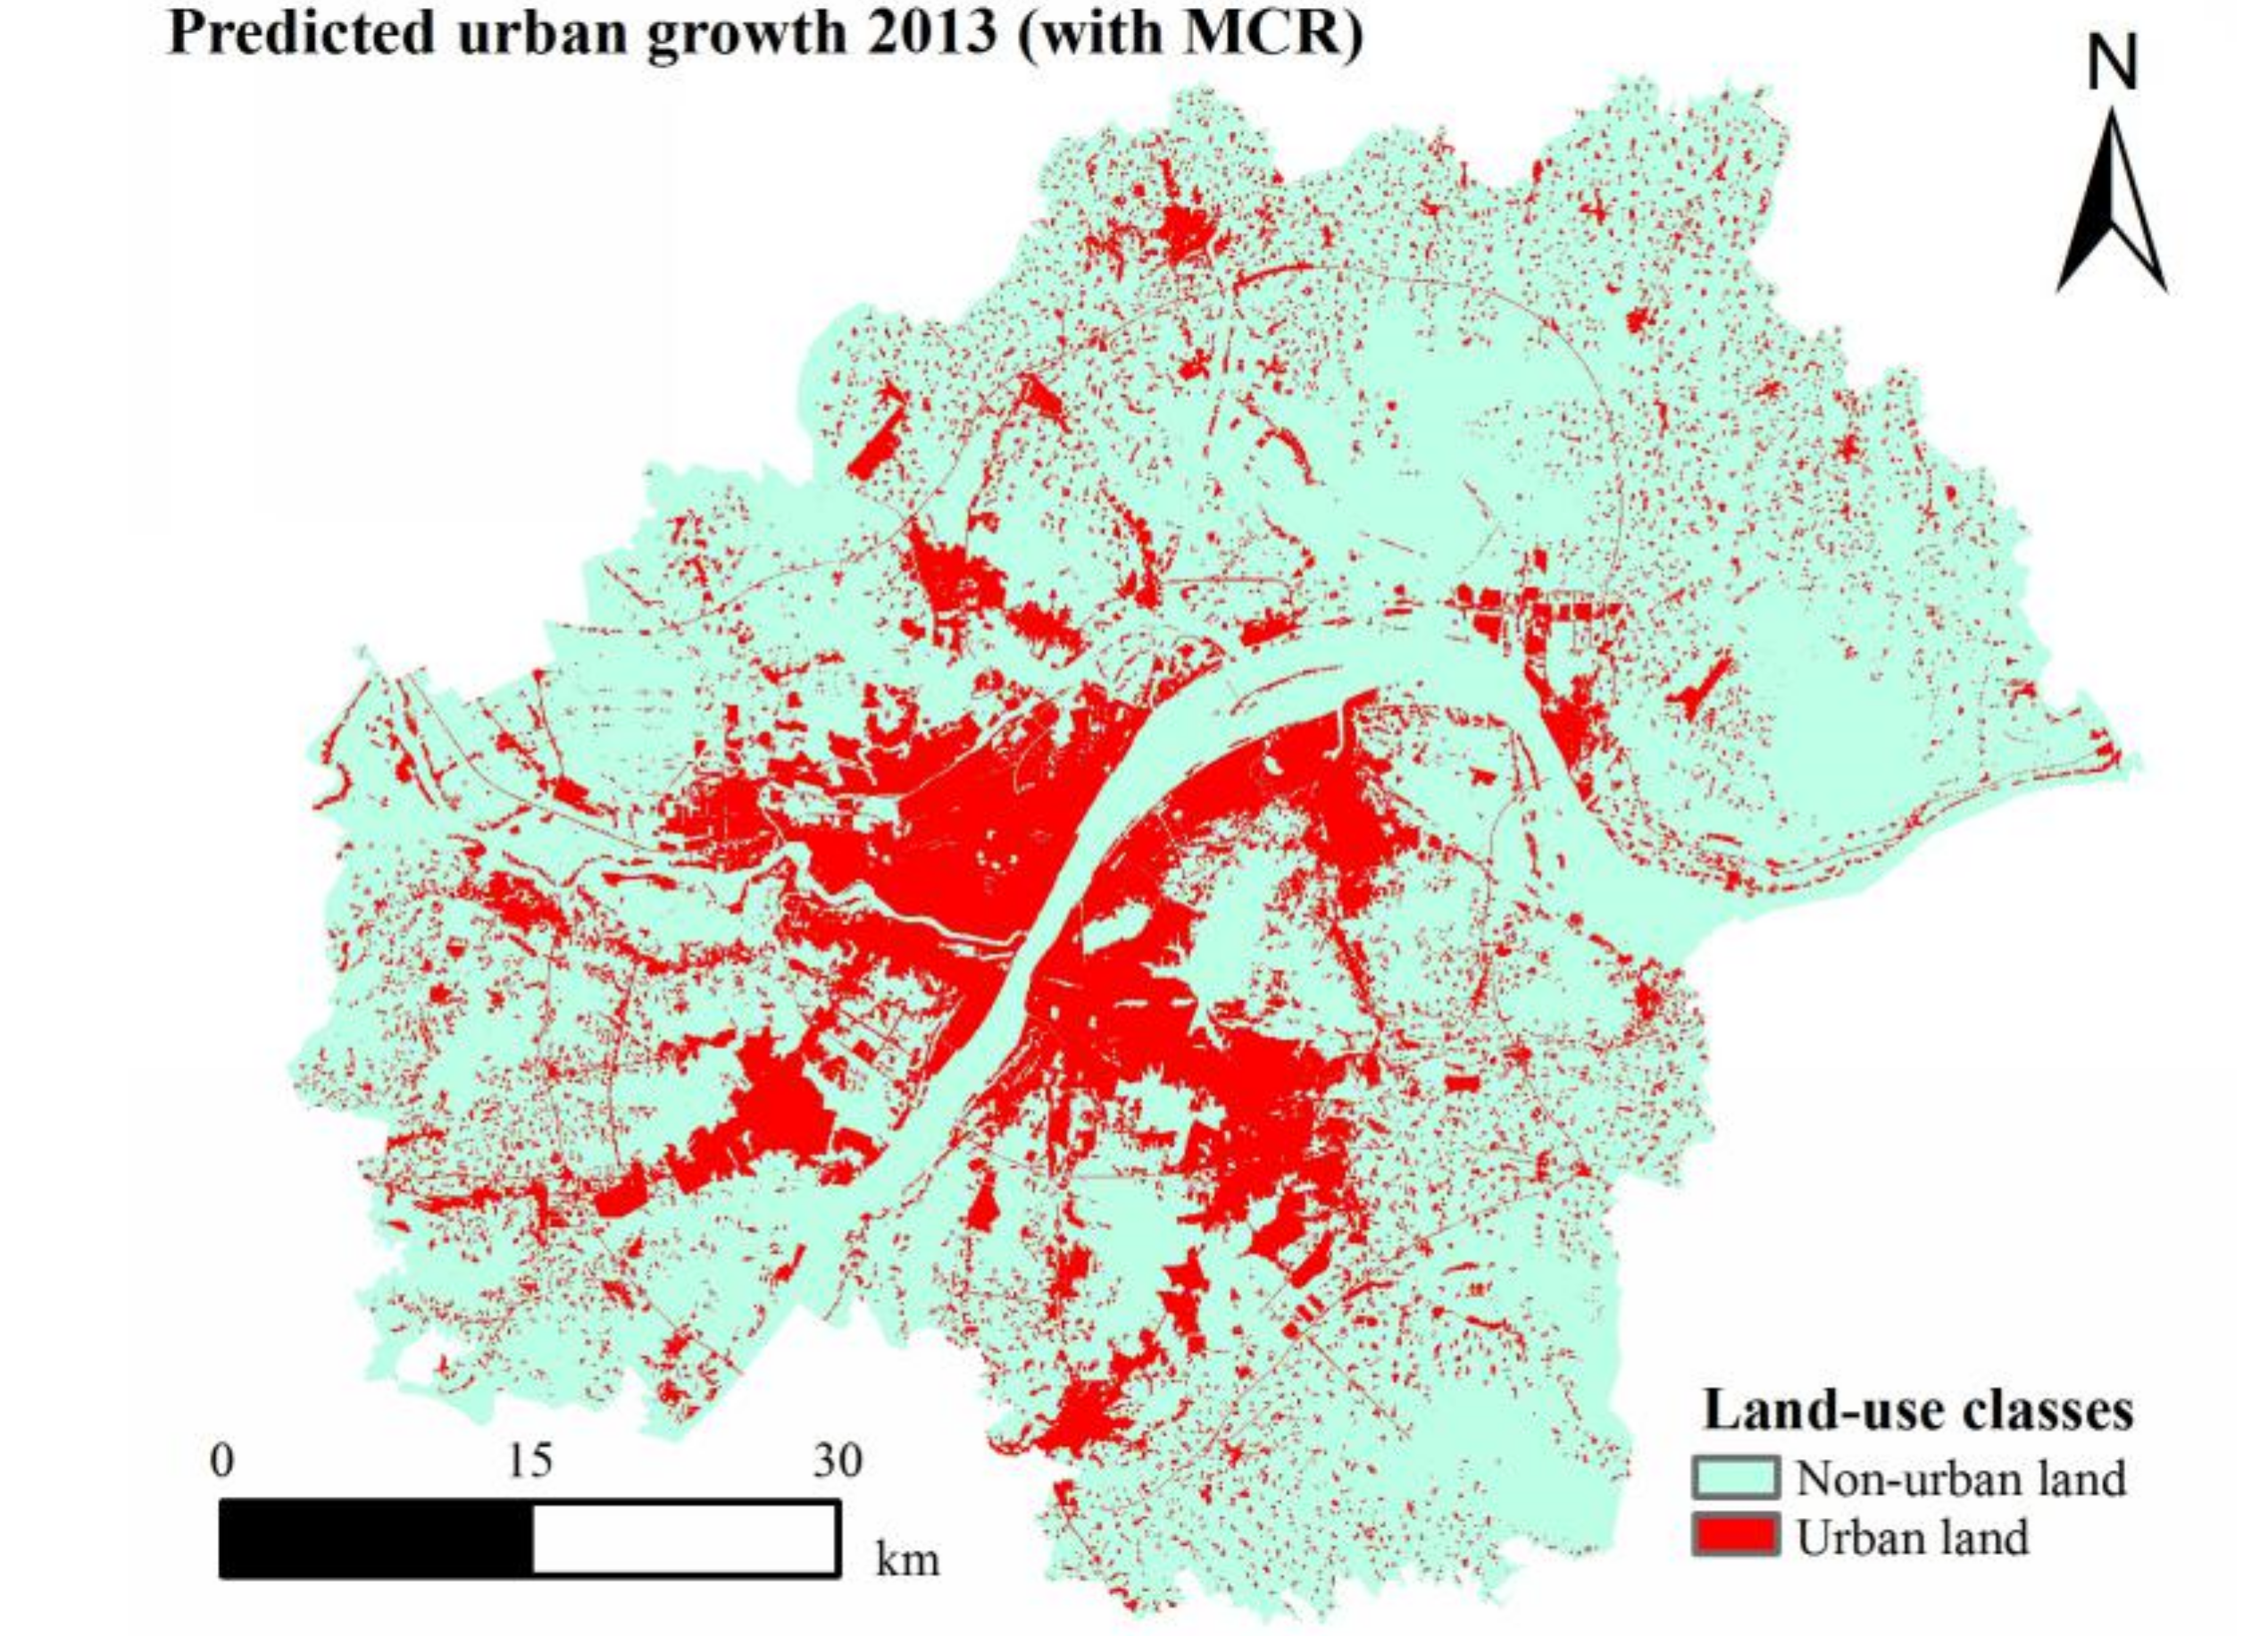
We correct the transformation rules of the CA–Markov model by using the appropriate atlas generated by the MCR model. Urban expansion in 2013 is simulated on the basis of the 1996 and 2006 land-use status maps. The implementation of CA model in this paper is through IDRISI software. The simulation results closely correspond to the real data when the number of iterations of the CA model is increased to 10. The simulation results are shown in Figure 7.
The kappa coefficient can describe the overall correlation, and it was used to evaluate the accuracy of results [26]. The kappa coefficient test method is used to calculate the correlation coefficient, which is the kappa index, by comparing and analysing the predicted results and real data of corresponding years [27]. The Kappa coefficient is given as follows:
where is the probability that the predicted result is consistent with the actual result (overall accuracy); is the probability that the predicted results are consistent with the real ones by accident.
It can reflect the degree of similarity between simulation results and real data and quantitatively analyse simulation accuracy. On the basis of map algebra theory, kappa > 0.8 denotes very high accuracy, 0.6 < kappa < 0.8 denotes good accuracy, 0.4 < kappa < 0.6 denotes poor accuracy and 0 < kappa < 0.4 denotes very poor accuracy [28]. The kappa coefficient for the MCR-modified CA–Markov model is 0.7639 and that for the original model is 0.7428. These results show that the accuracy of simulation results provided by the MCR-modified CA–Markov model is higher.
3.5. Comparative Analysis
Since the kappa coefficient is a description of the overall correlation, the simulation results may differ in detail and spatial distribution. Therefore, the kappa coefficient, the macro- and micro levels contrastive analysis are more convincing. The following are compared on the macro- and micro levels.
3.5.1. Macroanalysis
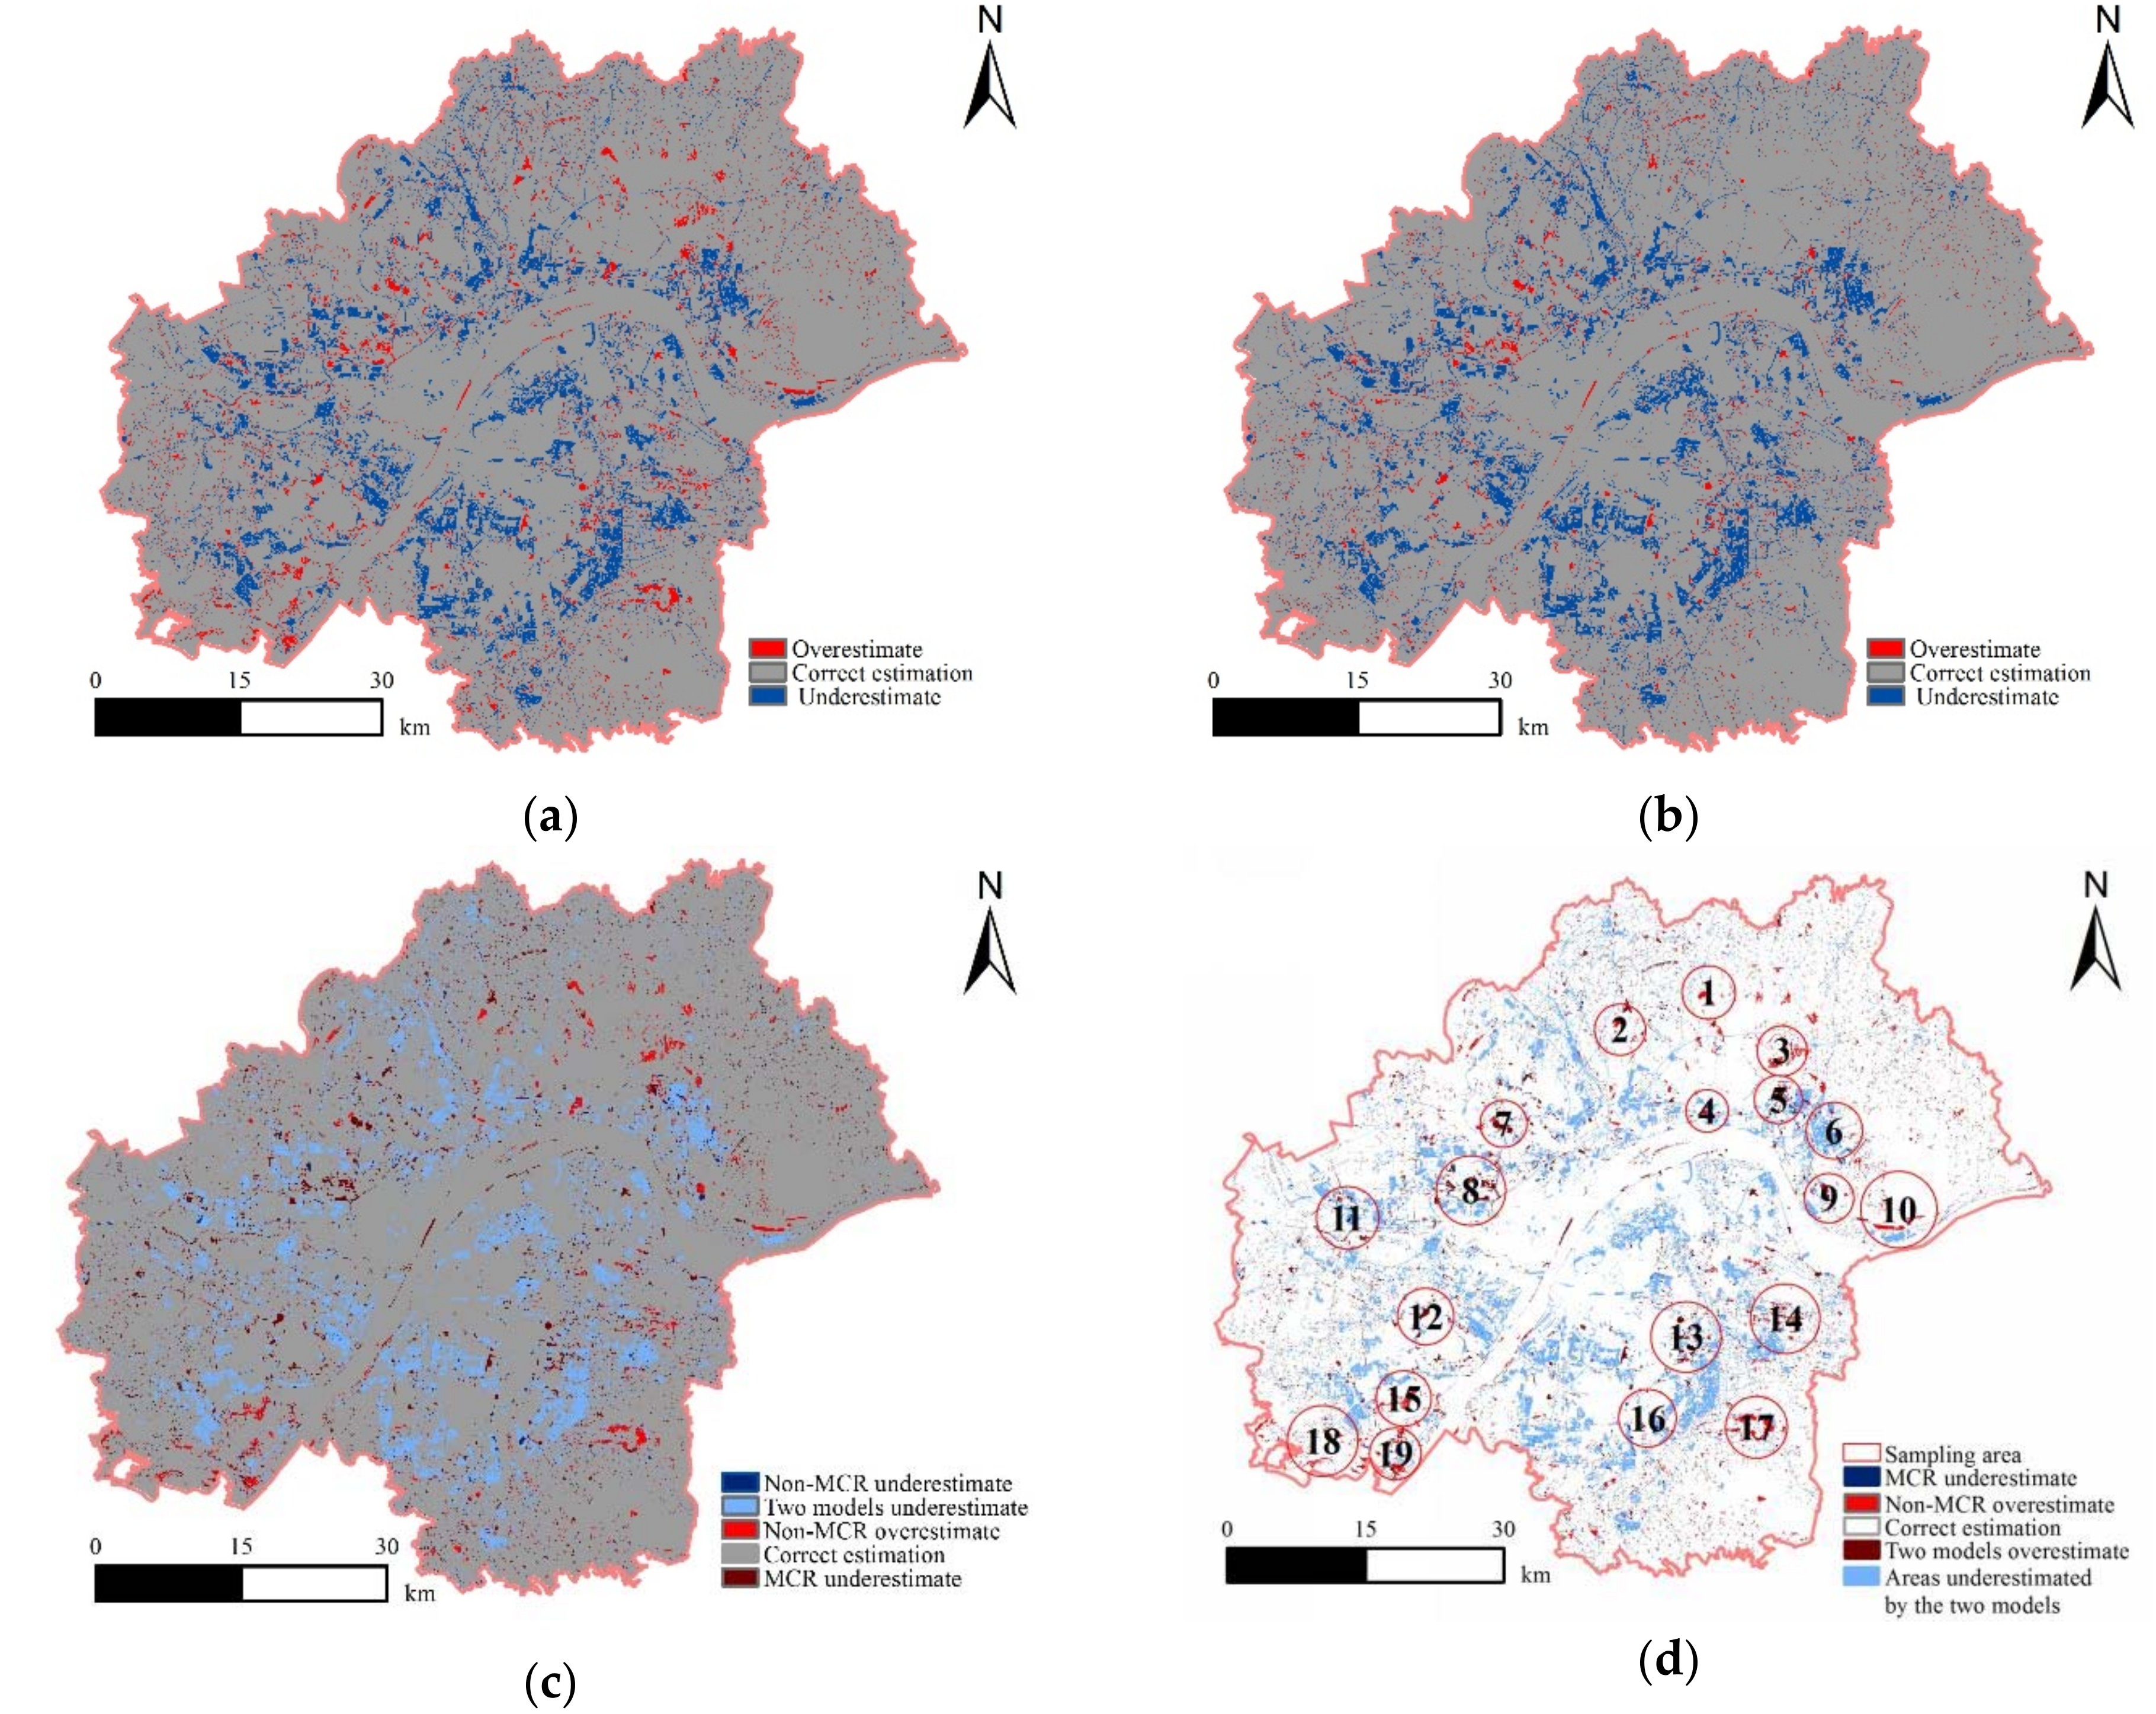
We test the accuracy of the MCR-modified CA–Markov model in the simulation of urban expansion. We compare the simulation results with real values to explore the similarities and differences between the simulation results. The results are shown in Figure 8.
In Figure 8d, patches in light blue depict areas that both models have underestimated. These areas are mainly distributed around the city given the rapid development and construction around the city. When the Markov model is used to solve the land-use transfer matrix, the transfer speed of land use around and distant from the city may is incorrectly estimated. Therefore, regions under natural conditions that surround the city are more likely to be underestimated than regions distant from the city.
The MCR model is not more likely to overestimate red regions than the non-MCR model. These red regions are mainly located in sampling areas 1–5, 9–10, 14–15, and 17–19. Sampling areas 1–4 and 10 represent water bodies; 14, 15, 17, and 19 represent woodlands and 5, 9, and 18 represent intersections between water bodies and woodlands. These regions are estimated correctly because the MCR model accounts for the influence of ecological factors on urban expansion.
Brown patches indicate areas that are overestimated by the two models and are mainly distributed in areas 7, 8, 12, and 13; other areas and around construction land. Rural residential areas close to cities are highly likely to be converted into urban construction land. The possibility of converting cultivated land around cities into construction land is also high. Overestimation by the two models may be attributed to human factors and may lead to the failure of development and construction in the region.
Dark blue areas represent underestimation by MCR-modified CA–Markov model and are mainly distributed in 6, 11, and 16. In terms of spatial distribution, areas that are underestimated by the two models are scattered. In general, differences exist between the ability of the two models to predict forest land, water area, scenic landscapes and other ecological land areas. Given that both models have inherited the characteristics of the CA–Markov model, their tendencies to overestimate and underestimate are similar.
Overestimated, correctly estimated and underestimated areas by the two models are subjected to quantitative statistical analysis. Table 6 and Figure 9 presents the results.
The area difference equals the area measured by MCR-modified CA–Markov model minus that of non-MCR method. The overestimation difference value between the two models was −4661.44 ha, the correct estimation difference value was 2431.23 ha and the underestimation difference value was 2230.21 ha. The area overestimated by the MCR-modified CA–Markov model is 29.87% less than that estimated by the non-MCR method. Compared with the MCR-modified CA–Markov model, the non-MCR method is quite possible to overestimate the actual area. The area underestimated by the MCR-modified CA–Markov model is 5.48% more than that of the non-MCR method. Limited by ecological factors, the areas underestimated by the MCR-modified CA–Markov model is slightly different from that of the non-MCR model, but the area overestimated by those two methods are quite different. Obviously, the simulation precision of MCR-modified CA–Markov model is higher than that of non-MCR model, hence, it can be concluded that the MCR-modified CA–Markov model provides advantages for urban planning by accounting for ecological factors.
3.5.2. Microanalysis
We select ecological features, such as the Longquan Mountain City Forest Park and Wuhu Lake, for microanalysis. The results of the MCR and non-MCR models are compared and analysed from the microscopic perspective. We also analyse the advantages and disadvantages of the two methods.
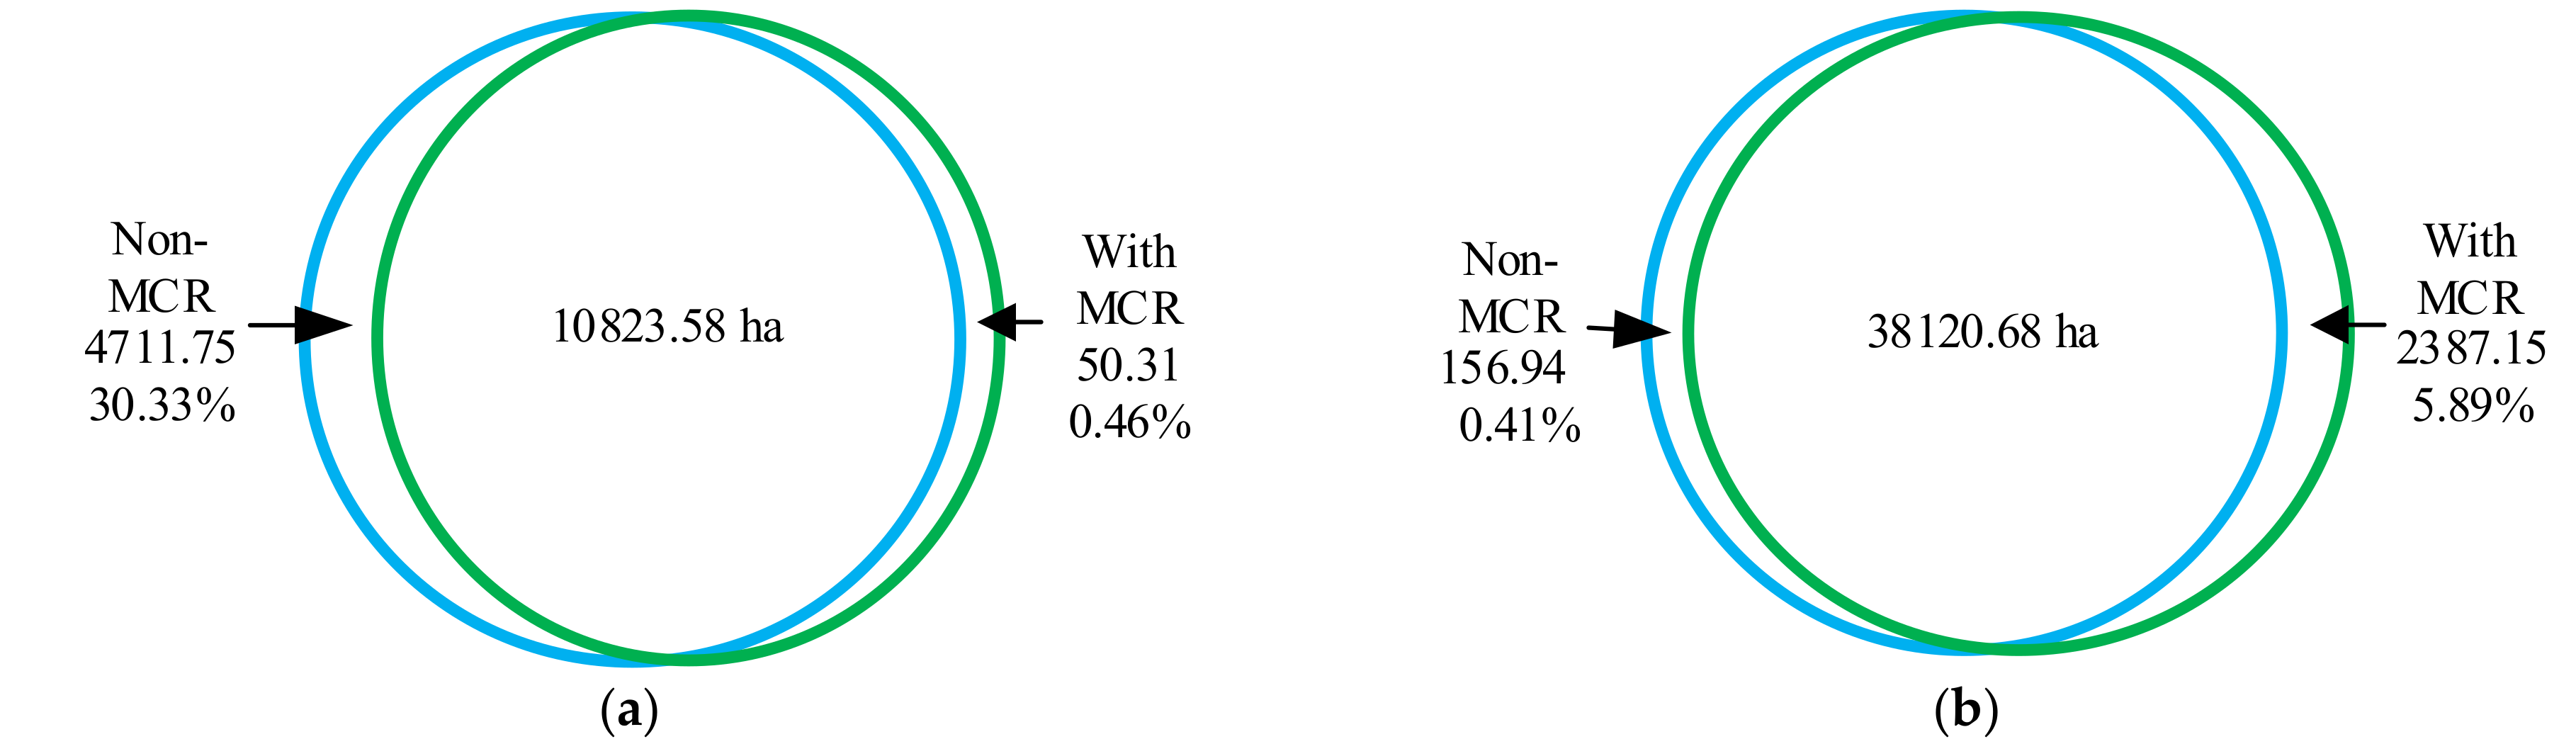
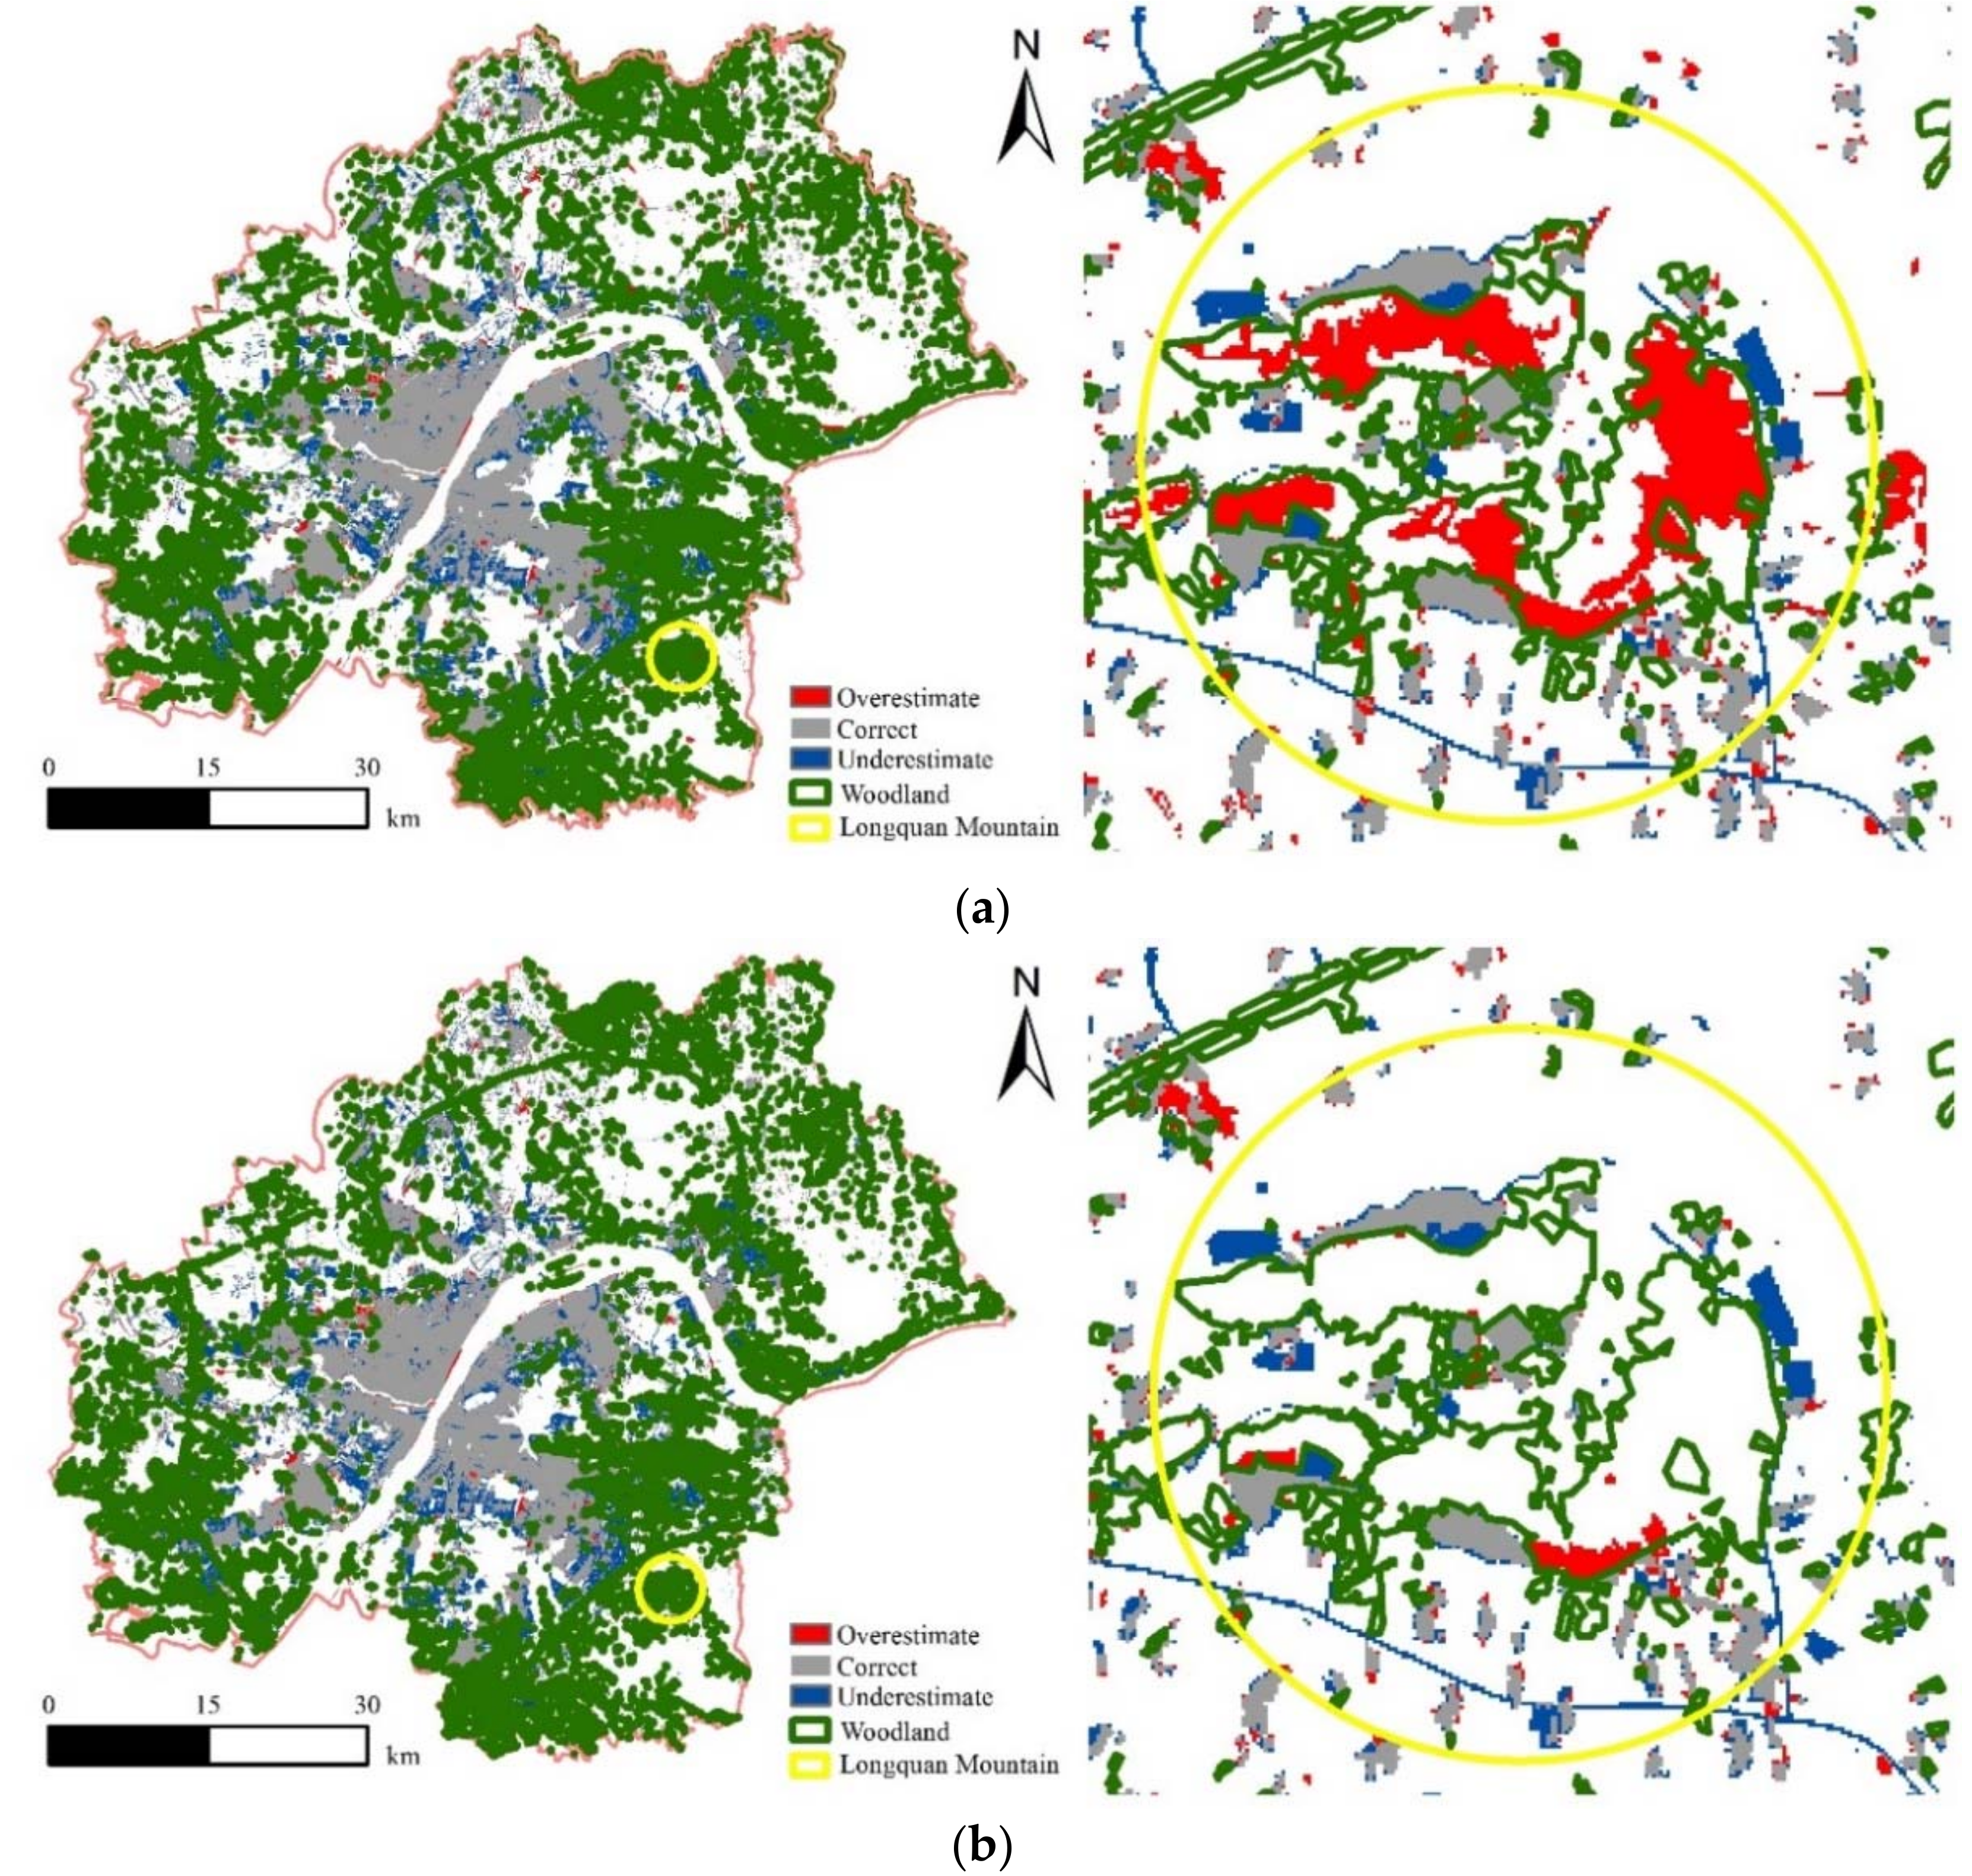
Woodland Constraint
We select the Longquan Mountain City Forest Park as the research object. Figure 10 illustrates the final analytical result.
Given that the original land type of this area is woodland, the MCR model shows that it is unsuitable for urban expansion. The original natural ecological land forms the ecological matrix of the Wuhan metropolitan area and should be protected. However, the non-MCR model simulation results ignored the ecological condition of this area, thus leading to overestimation, as shown in Figure 10a.
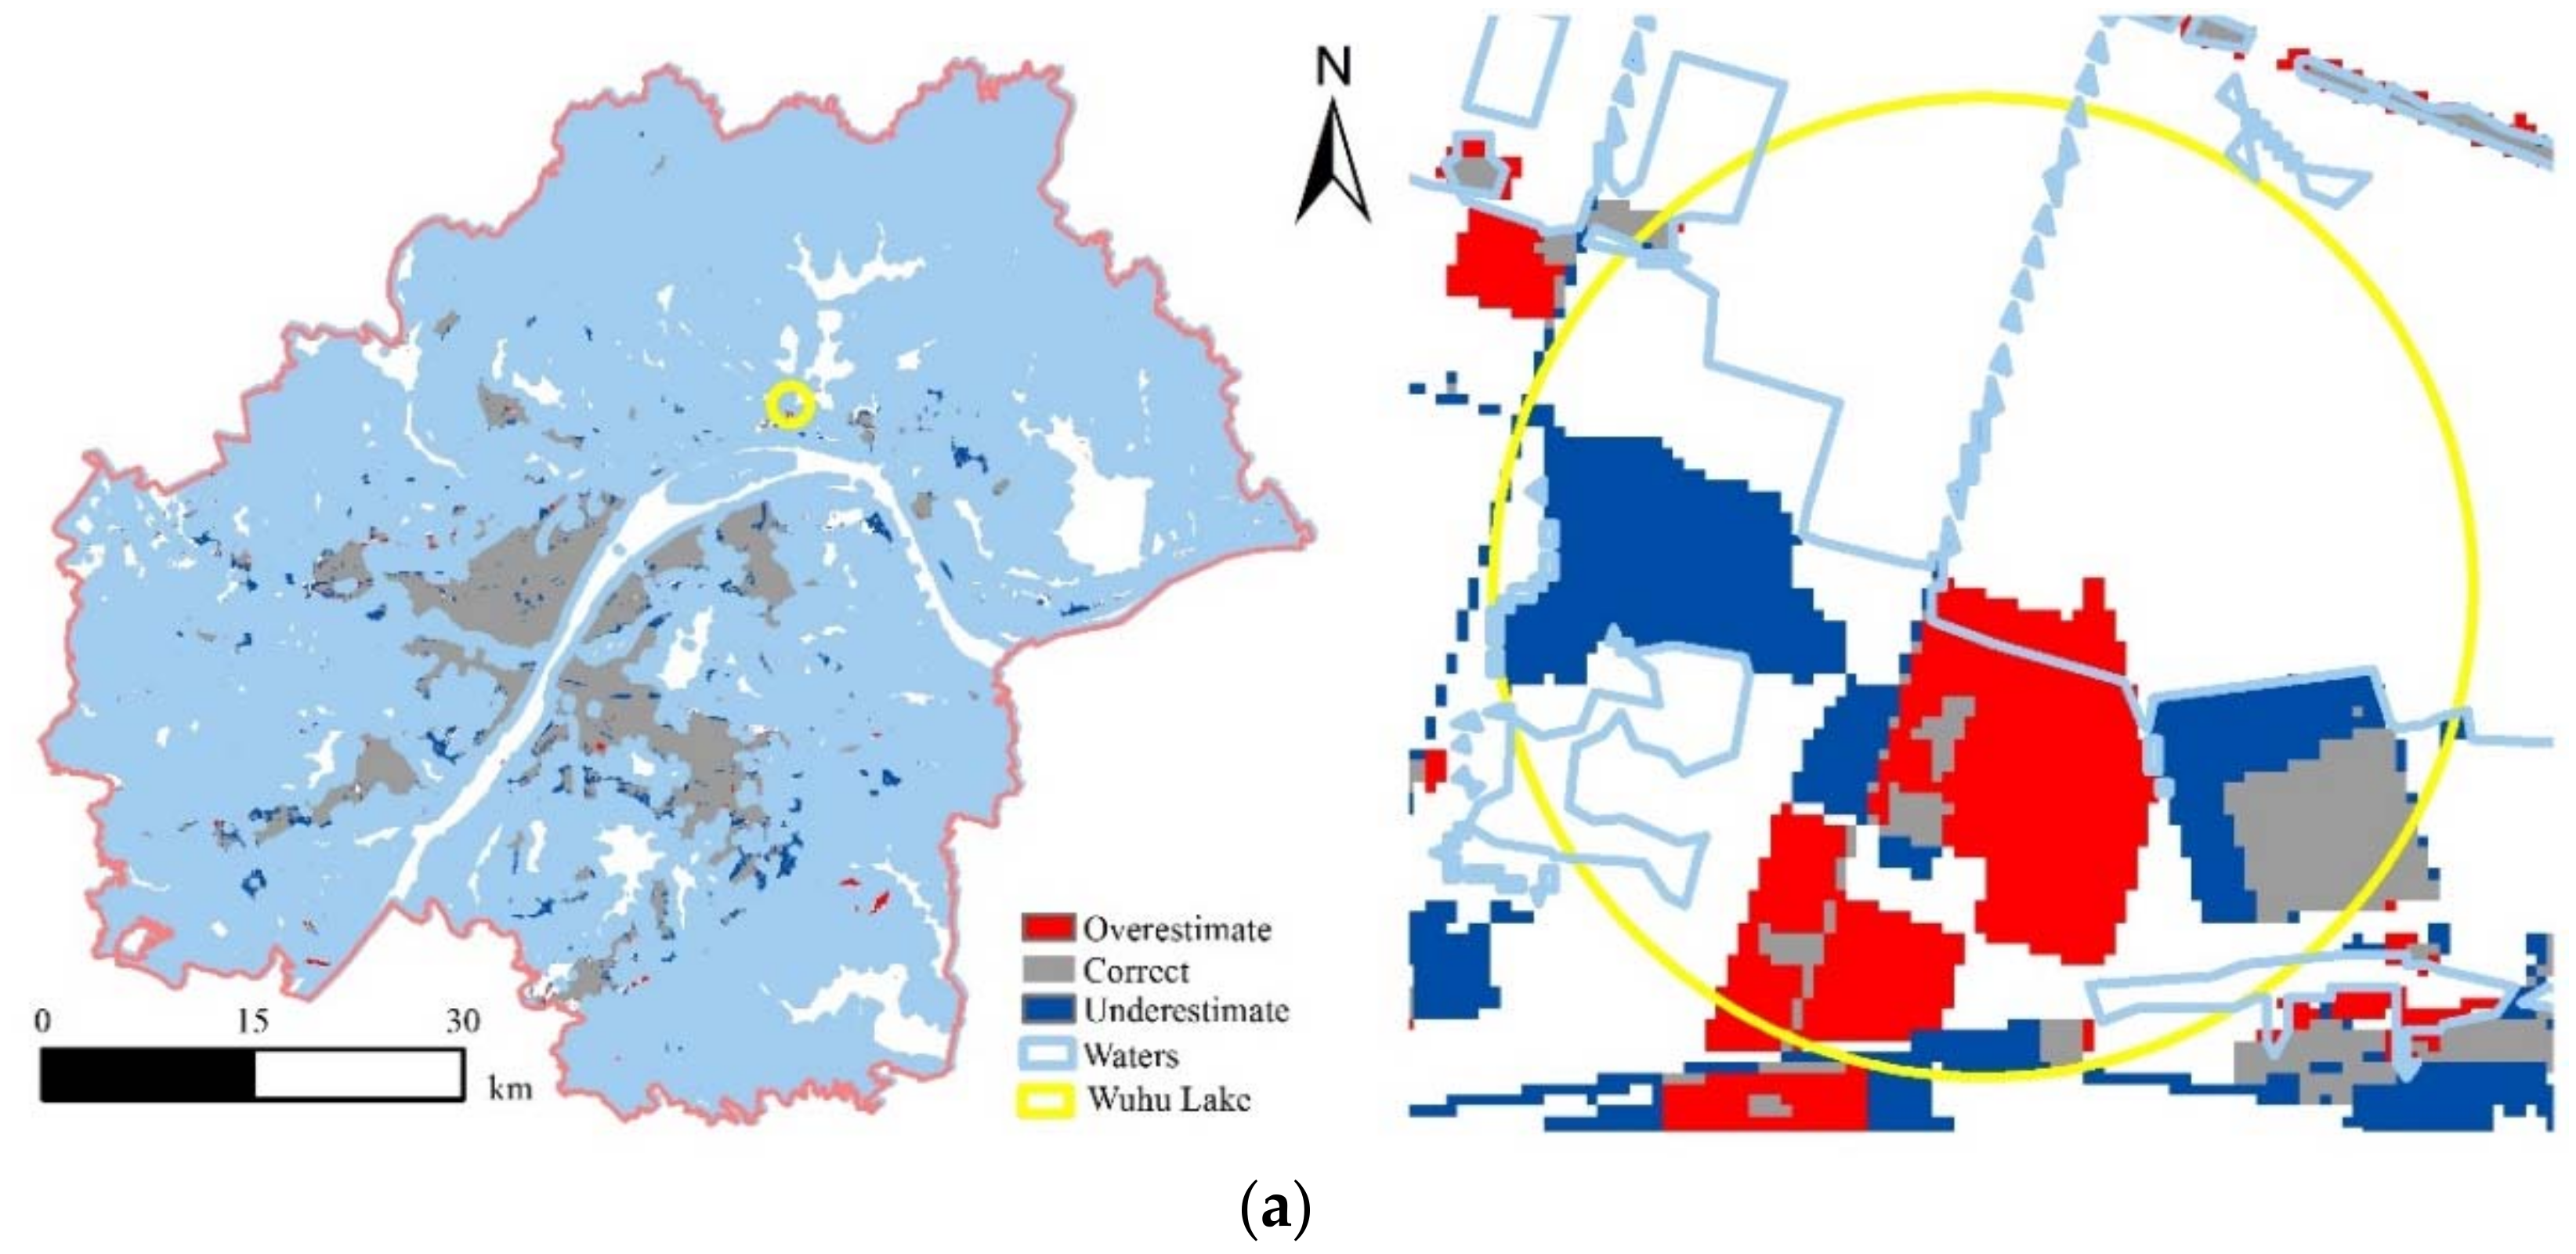
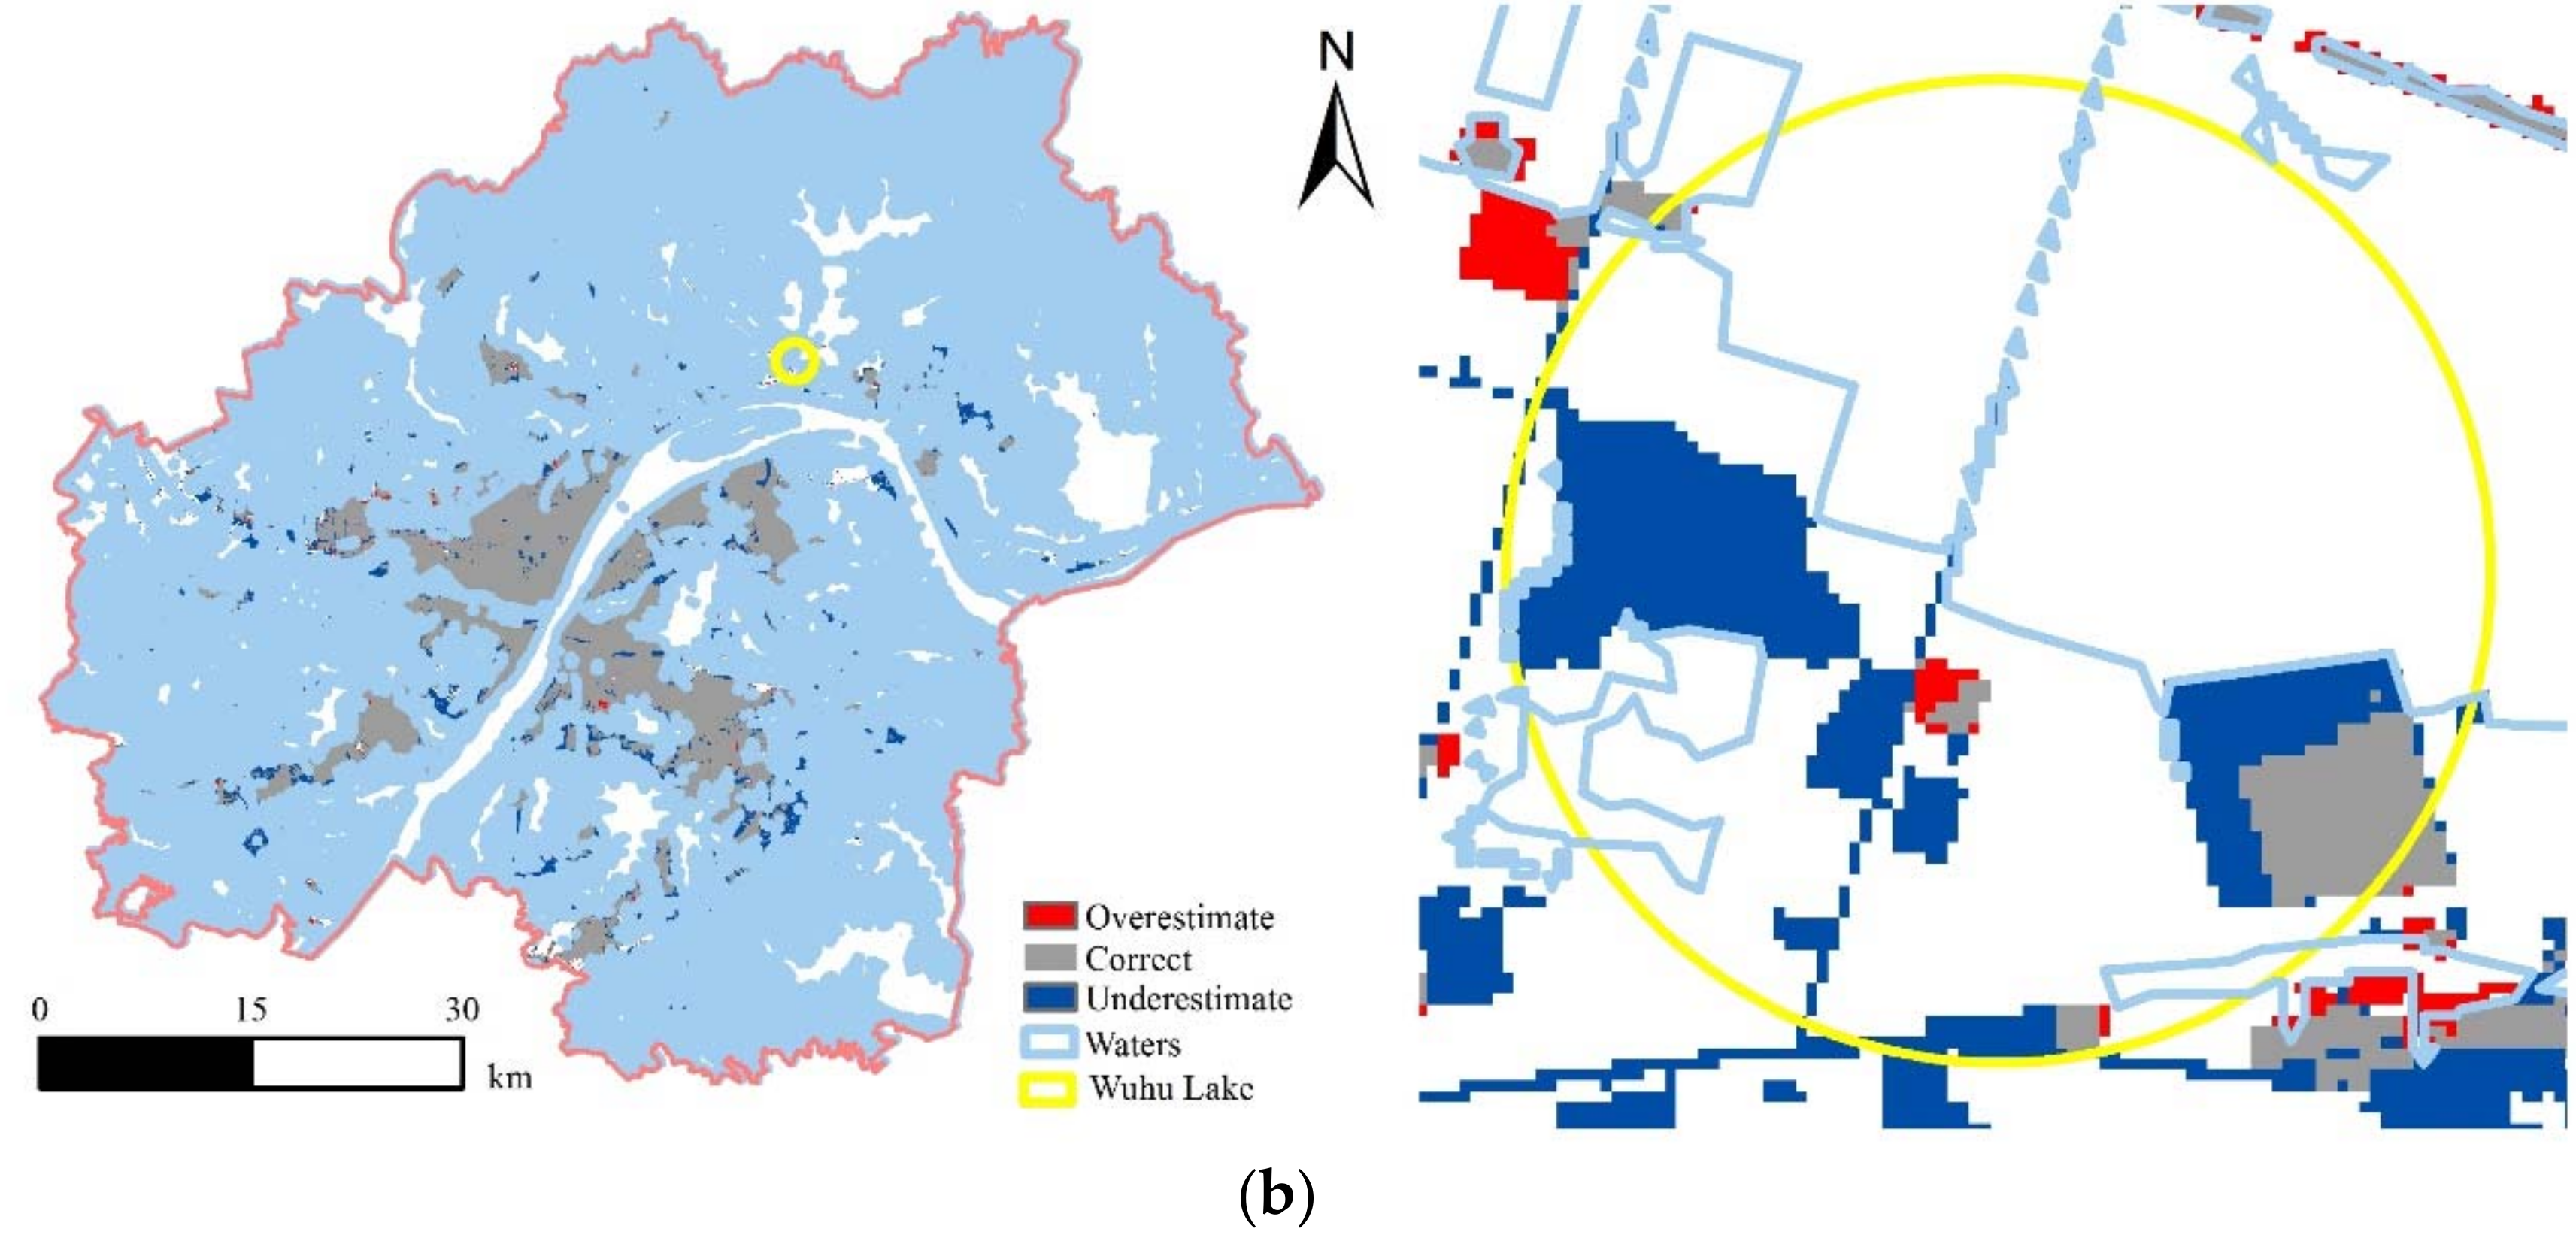
Water Constraints
We take the surrounding areas of Wuhu Lake as the research object. Figure 11 presents the final analytical result. The study area has numerous lakes and rivers and is known as the ‘City of Hundreds of Lakes.’ A total of 166 lakes of various sizes are located in the area. The water areas encompass pit, reservoir, river, and lake water surfaces.
Development and construction should be prohibited within 800–1000 m of the areas that surround recreational lakes to ensure the integrity of ecological elements and coordinate land functions. As can be seen from the locally enlarged Figure 11a, the simulation results obtained by the non-MCR model indicate that the lake can be developed. However, the ecological environment around the original lake should be protected and is unsuitable for development and construction.
In conclusion, both models consider the influence of similar factors, such as distance from the freeway, railway, main road, collector streets, and river and slope. Results show that the MCR-modified CA–Markov model can better predict forest, water, and other ecological factors than the non-MCR model. The MCR model can be applied to develop approaches for protecting the local ecological environment because it can express resistance values in urban expansion, such as woodland and water bodies, that represent areas that are unsuitable for urban development and construction. Therefore, this method excludes ecological land, such as woodland and water, from future urban expansion. By contrast, the non-MCR model ignores ecological land and identifies all areas as equally suitable for future urban expansion.
3.6. Simulation of Urban Expansion in 2020
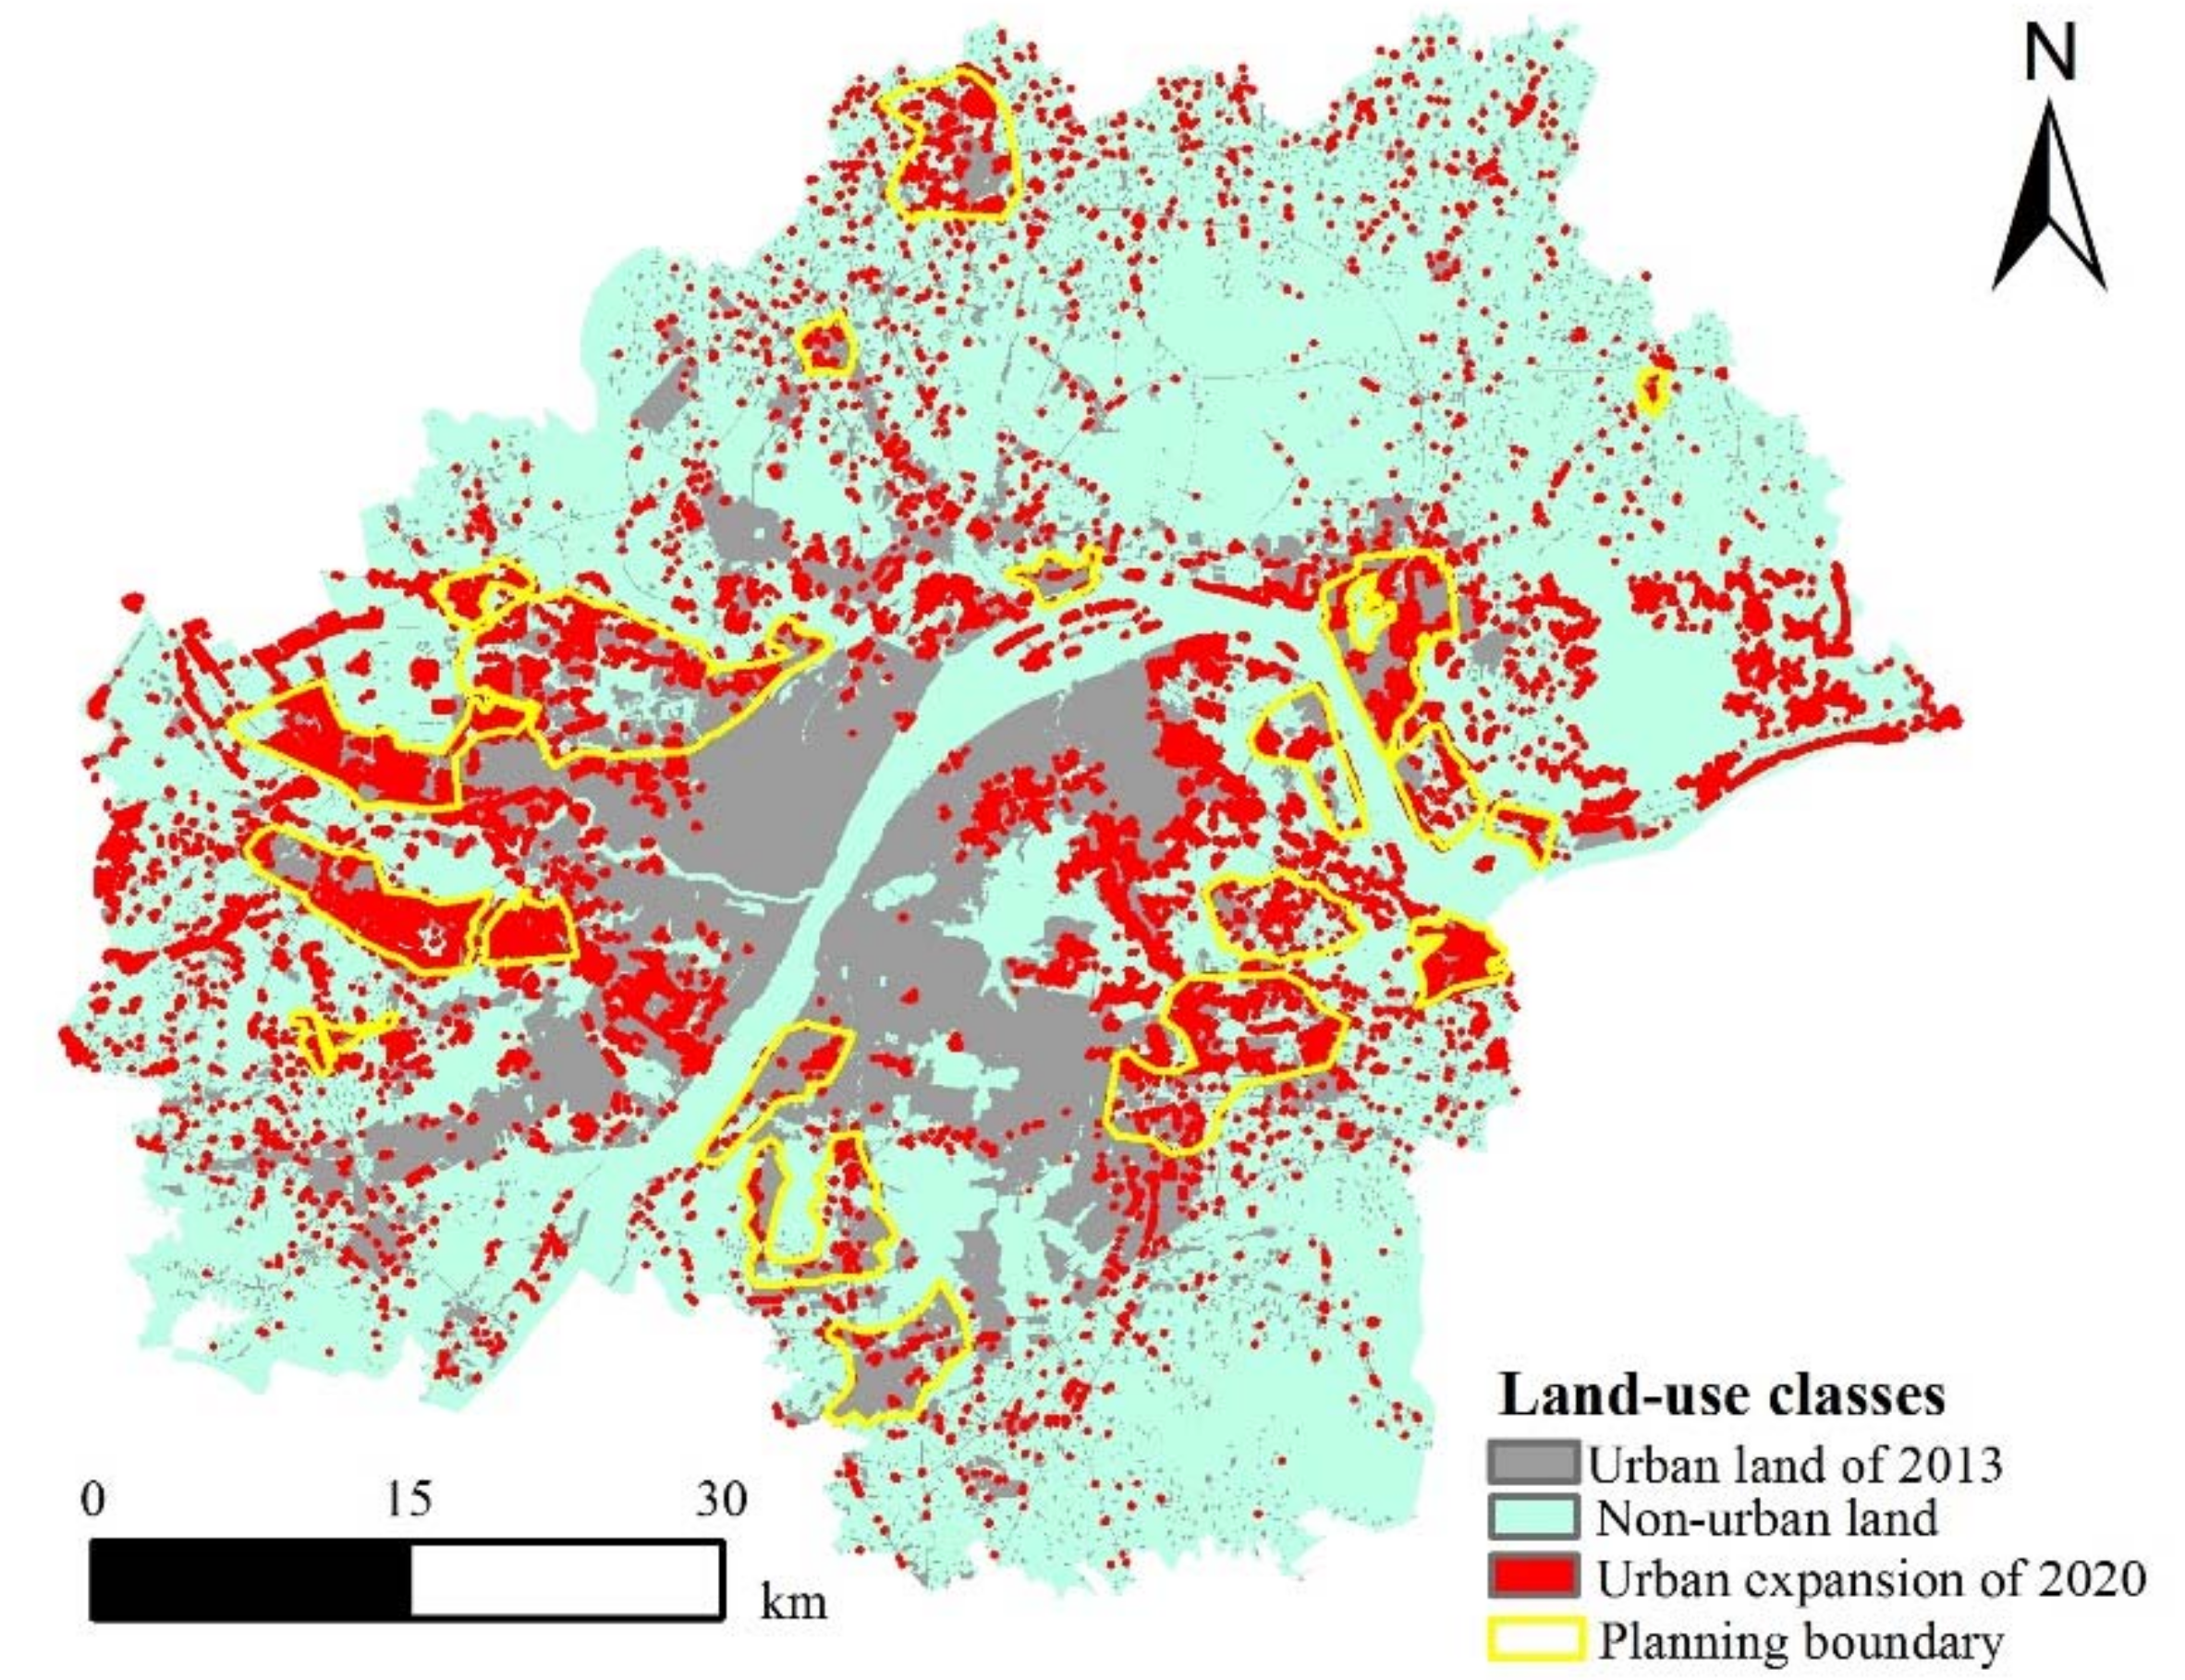
Through comparative analysis, we find that the results generated by the MCR-modified CA–Markov model closely resemble the real data of urban land. Therefore, the spatial distribution of urban land in 2020 can be simulated by using this method. Figure 12 illustrates the predicted results.
The statistical analysis of simulation results reveal that the area of urban land will increase to 148,631.065 ha by 2020. Given that the concept of sustainable development has gained popularity, the local government has formulated an overall urban land-use plan for Wuhan from 2010 to 2020. This plan integrates environmental protection approaches. Our simulation results are consistent with the overall planning expansion direction set by the government of Wuhan. Both the urban land-use plan and proposed model show that the eastern and western regions are more suitable for urban construction land than the northern regions. Therefore, the proposed MCR-modified CA–Markov model has high reliability.
4. Conclusions
In this paper, preprocessing data mainly includes reclassification, slope calculation based on the digital elevation model, distance analysis of traffic factors, and river factors. Based on the MCR model, extended source selection is performed and a comprehensive resistance surface is constructed. The suitability of the atlas is determined on the basis of the MCR model. The MCR model is used to modify the transformation rules of the CA–Markov model, and urban expansion in 2013 is simulated on the basis of data derived from 1996 to 2006 land-use status maps. The results of the MCR and non-MCR models are compared on the macro- and micro levels.
We utilised the MCR-modified CA–Markov model to simulate the expansion of the Wuhan metropolitan area in 2020. Experiments show that the model can simulate urban expansion well by considering certain ecological factors. We draw the following conclusions:
- (1)
- The MCR-modified CA–Markov model more accurately simulates the distribution of areas with obvious ecological features, such as water bodies and woodlands, than the traditional CA–Markov model.
- (2)
- The two models provide different simulation results for forest land, water areas, and other ecological land areas. Nevertheless, they overestimated and underestimated similar areas because the land-use transfer matrix is solved by using the Markov model. The MCR-modified CA–Markov model provides additional advantages for the simulation of urban expansion simulation under the premise of protecting the ecological environment.
- (3)
- Urban expansion is a complex and dynamic spatial process that is easily affected by land use, government policies and other random factors. The MCR-modified CA–Markov model considers the effect of natural conditions, such as ecological factors, on urban expansion. It does not consider the effects of social and economic factors on urban expansion. Therefore, future studies could consider integrating social, economic, and other factors into urban expansion simulations.
Author Contributions
Methodology, X.L. and M.W.; Formal Analysis, X.L.; Resources, Z.C.; Validation, X.W. and W.C. All authors collaborated on the interpretation of the results and on writing and revising the paper.
Funding
This research was funded by the National Key Research and Development Program (Grant No. 2016YFE0131600),the National Natural Science Foundation of China (NSFC) (Grant No. 41771420, 51708098), the Sustainable Construction of Advantageous Subjects in Jiangsu Province (Grant No. 164320H116), the Priority Academic Program Development of Jiangsu Higher Education Institutions, Guangdong Innovative and Entrepreneurial Research Team Program (2016ZT06D336), GDAS’ Special Project of Science and Technology Development (2017GDASCX-0802), Research Foundation of Educational Department in Jiangxi (GJJ160537) and Research Foundation of Key Laboratory for Digital Land and Resources in Jiangxi Province (DLLJ201720).
Conflicts of Interest
The authors declare no conflict of interest.
References
- UN (United Nations). World Urbanization Prospects: The 2007 Revision; UN: New York, NY, USA, 2008; Volume 22, pp. 656–659. [Google Scholar]
- Wu, Q.; Li, H.Q.; Wang, R.S.; Paulussen, J.; He, Y.; Wang, M.; Wang, B.H.; Wang, Z. Monitoring and predicting land use change in Beijing using remote sensing and GIS. Landsc. Urban Plan. 2006, 78, 322–333. [Google Scholar] [CrossRef] [Green Version]
- Guan, D.J.; Li, H.F.; Inohae, T.; Su, W.; Nagaie, T.; Hokao, K. Modeling urban land use change by the integration of cellular automaton and Markov model. Ecol. Model. 2011, 222, 3761–3772. [Google Scholar] [CrossRef]
- Warrick, R.A.; Bhuiya, A.K.A.H.; Mirza, M.Q. The Greenhouse Effect and Climate Change; Springer: Dordrecht, The Netherlands, 1996; pp. 35–96. [Google Scholar]
- Javed, A.; Jamal, S.; Khandey, M.Y. Climate change induced land degradation and socio-economic deterioration: A remote sensing and gis based case study from Rajasthan, India. J. Geogr. Inf. Syst. 2012, 4, 219–228. [Google Scholar] [CrossRef]
- Falcucci, A.; Maiorano, L.; Boitani, L. Changes in land-use/land-cover patterns in Italy and their implications for biodiversity conservation. Landsc. Ecol. 2007, 22, 617–631. [Google Scholar] [CrossRef]
- Turner, B.L.; Lambin, E.F.; Reenberg, A. The emergence of land change science for global environmental change and sustainability. Proc. Natl. Acad. Sci. USA 2007, 104, 20666–20671. [Google Scholar] [CrossRef] [PubMed] [Green Version]
- Bentz, J.; Lopes, F.; Calado, H.; Dearden, P. Sustaining marine wildlife tourism through linking limits of acceptable change and zoning in the wildlife tourism model. Mar. Policy 2016, 68, 100–107. [Google Scholar] [CrossRef]
- Barredo, J.I.; Demicheli, L. Urban sustainability in developing countries’ megacities: Modelling and predicting future urban growth in Lagos. Cities 2003, 20, 297–310. [Google Scholar] [CrossRef]
- He, C.; Okada, N.; Zhang, Q.; Shi, P.; Zhang, J. Modeling urban expansion scenarios by coupling cellular automata model and system dynamic model in Beijing, China. Appl. Geogr. 2006, 26, 323–345. [Google Scholar] [CrossRef]
- Alsharif, A.A.A.; Pradhan, B. Urban sprawl analysis of tripoli metropolitan city (Libya) using remote sensing data and multivariate logistic regression model. J. Indian Soc. Remote Sens. 2014, 42, 149–163. [Google Scholar] [CrossRef]
- Wu, F. Calibration of stochastic cellular automata: The application to rural-urban land conversions. Int. J. Geogr. Inf. Syst. 2002, 16, 795–818. [Google Scholar] [CrossRef]
- Arsanjani, J.J.; Kainz, W.; Mousivand, A.J. Tracking dynamic land-use change using spatially explicit Markov Chain based on cellular automata: The case of Tehran. Int. J. Image Data Fusion 2011, 2, 329–345. [Google Scholar] [CrossRef]
- Al-Ahmadi, K.; See, L.; Heppenstall, A.; Hogg, J. Calibration of a fuzzy cellular automata model of urban dynamics in Saudi Arabia. Ecol. Complex. 2009, 6, 80–101. [Google Scholar] [CrossRef]
- Zhang, H.; Zeng, Y.; Ling, B.; Yu, X. Modelling urban expansion using a multi agentbased model in the city of Changsha. J. Geogr. Sci. 2010, 20, 540–556. [Google Scholar] [CrossRef]
- Tian, G.; Ma, B.; Xu, X.; Liu, X.; Xu, L.; Liu, X.; Xiao, L.; Kong, L. Simulation of urban expansion and encroachment using cellular automata and multi-agent system model—A case study of Tianjin metropolitan region, China. Ecol. Indic. 2016, 70, 439–450. [Google Scholar] [CrossRef]
- Verburg, P.H.; Soepboer, W.; Veldkamp, A.; Limpiada, R.; Espaldon, V.; Mastura, S.S. Modeling the spatial dynamics of regional land use: The clue-s model. Environ. Manag. 2002, 30, 391–405. [Google Scholar] [CrossRef] [PubMed]
- Tobler, W.R. A computer movie simulating urban growth in the Detroit region. Econ. Geogr. 1970, 46, 234–240. [Google Scholar] [CrossRef]
- White, R.; Engelen, G. Cellular automata and fractal urban form: A cellular modelling approach to the evolution of urban land-use patterns. Environ. Plan. A 2008, 25, 1175–1199. [Google Scholar] [CrossRef]
- Li, X.; Gar-On Yeh, A. Neural-network-based cellular automata for simulating multiple land use changes using GIS. Int. J. Geogr. Inf. Syst. 2002, 16, 323–343. [Google Scholar] [CrossRef] [Green Version]
- Li, X.; Gar-On Yeh, A. Data mining of cellular automata’s transition rules. Int. J. Geogr. Inf. Syst. 2004, 18, 723–744. [Google Scholar] [CrossRef]
- Li, F.; Ye, Y.; Song, B.; Wang, R. Evaluation of urban suitable ecological land based on the minimum cumulative resistance model: A case study from Changzhou, China. Ecol. Model. 2015, 318, 194–203. [Google Scholar] [CrossRef] [Green Version]
- Wei, W.; Zhao, J.; Wang, X.F.; Zhou, Z.Y.; Li, H.L. Landscape pattern macrs analysis and the optimal utilization of shiyang river basin based on RS and GIS approach. Acta Ecol. Sin. 2009, 29, 216–221. [Google Scholar] [CrossRef]
- Taleai, M.; Mansourian, A. Using delphi-ahp method to survey major factors causing urban plan implementation failure. J. Appl. Sci. 2008, 8, 2746–2751. [Google Scholar] [CrossRef]
- Arsanjani, J.J.; Kainz, W.; Helbich, M.; Boloorani, A.D. Integration of logistic regression, Markov Chain and cellular automata; models to simulate urban expansion. Int. J. Appl. Earth Obs. Geoinf. 2013, 21, 265–275. [Google Scholar] [CrossRef]
- Landis, J.R.; Koch, G.G. The measurement of observer agreement for categorical data. Biometrics 1977, 33, 159–174. [Google Scholar] [CrossRef] [PubMed]
- Hagen, A. Fuzzy set approach to assessing similarity of categorical maps. Int. J. Geogr. Inf. Syst. 2003, 17, 235–249. [Google Scholar] [CrossRef] [Green Version]
- Pijanowski, B.C.; Brown, D.G.; Shellito, B.A.; Manik, G.A. Using neural networks and GIS to forecast land use changes: A land transformation model. Comput. Environ. Urban Syst. 2002, 26, 553–575. [Google Scholar] [CrossRef]
Figure 1.
Flowchart of urban expansion simulation using the MCR-modified CA–Markov model.

Figure 2.
Wuhan metropolitan area and land-use type in 2013.

Figure 3.
1996, 2006, and 2013 land-use maps of the Wuhan metropolitan area. (a) land use 1996; (b) land use 2006; (c) land use 2013; and (d) spatial distribution of land use.
Figure 3.
1996, 2006, and 2013 land-use maps of the Wuhan metropolitan area. (a) land use 1996; (b) land use 2006; (c) land use 2013; and (d) spatial distribution of land use.

Figure 4.
Mapping of influential factors. (a) Distance from the expressway; (b) distance from the railway; (c) distance from the main road; (d) distance from collector streets; (e) distance from the river; (f) elevation distribution map; (g) slope distribution map; and (h) the comprehensive suitability of all influential factors.

Figure 5.
Comprehensive spatial distribution of MCR values.

Figure 6.
Division of suitability.

Figure 7.
Results of the MCR-modified CA–Markov model for urban expansion in 2013.

Figure 8.
Difference between simulation results provided by the MCR and non-MCR models. (a) Comparison between real values and values generated by the non-MCR model; (b) comparison between real values and values generated by the MCR-modified model; (c) differential distribution by two models; and (d) local discrepancy annotation.

Figure 9.
Area comparison between two models. (a) Overestimation by the two models; and (b) underestimation by the two models.
Figure 9.
Area comparison between two models. (a) Overestimation by the two models; and (b) underestimation by the two models.

Figure 10.
Microlevel analysis of the results for Longquan Mountain. (a) Simulation and overview of urban expansion in 2013 by the non-MCR model; and (b) simulation and overview of urban expansion in 2013 by the MCR model.
Figure 10.
Microlevel analysis of the results for Longquan Mountain. (a) Simulation and overview of urban expansion in 2013 by the non-MCR model; and (b) simulation and overview of urban expansion in 2013 by the MCR model.

Figure 11.
Analysis of the result of Wuhu Lake at the micro level. (a) Simulation of urban expansion in 2013 by the non-MCR model; and (b) simulation and overview of urban expansion in 2013.
Figure 11.
Analysis of the result of Wuhu Lake at the micro level. (a) Simulation of urban expansion in 2013 by the non-MCR model; and (b) simulation and overview of urban expansion in 2013.


Figure 12.
Simulation of urban expansion in 2020.


Table 1.
Dependent and independent variables of urban expansion.
| Variables | Type | Assignment Values |
|---|---|---|
| Dependent variable | ||
| Type of land use | Binary variables | 0, 1 |
| Independent variables | ||
| Distance from expressway () | Continuous variable | 1, 2, 3, 4, 5 |
| Distance from railway () | Continuous variable | 1, 2, 3, 4, 5 |
| Distance from main road () | Continuous variable | 1, 2, 3, 4, 5 |
| Distance from collector streets () | Continuous variable | 1, 2, 3, 4, 5 |
| Distance from river () | Continuous variable | 1, 2, 3, 4, 5 |
| Elevation () | Continuous variable | 1, 2, 3, 4, 5 |
| Slope () | Continuous variable | 1, 2, 3, 4, 5 |
Table 2.
The p-values of the influential factors from 1996–2006.
| Variables | Elevation | Slope | Distance from Expressway | Distance from Railway | Distance from Main Road | Distance from Collector Streets | Distance from River |
|---|---|---|---|---|---|---|---|
| p-values | 0.077 | 0.000 | 0.000 | 0.000 | 0.000 | 0.000 | 0.000 |
Table 3.
Estimated statistical values for the logistic regression model consisting of independent variables from 1996 to 2006.
Table 3.
Estimated statistical values for the logistic regression model consisting of independent variables from 1996 to 2006.
| Variables | |||
|---|---|---|---|
| Distance from expressway () | 0.060 | 90.037 | 0.006 |
| Distance from railway () | −0.064 | 98.628 | 0.006 |
| Distance from main road () | −0.096 | 238.039 | 0.006 |
| Distance from collector streets () | −0.060 | 97.005 | 0.006 |
| Distance from river () | −0.117 | 46.055 | 0.017 |
| Slope () | 0.057 | 16.221 | 0.014 |
| Constant | 0.860 | 68.576 | 0.104 |
Table 4.
Weight of each influential factor.
| Slope | Expressway | Railway | Main Road | Collector Streets | Rivers | Type of Land Use | |
|---|---|---|---|---|---|---|---|
| Weight | 0.16 | 0.13 | 0.13 | 0.14 | 0.13 | 0.19 | 0.12 |
Table 5.
Suitability statistics for the Wuhan metropolitan area.
| Suitability Partition | Area (ha) | Percentage |
|---|---|---|
| Very suitable | 218,732.21 | 53.26% |
| Suitable | 120,458.93 | 29.33% |
| Less suitable | 47,868.43 | 11.65% |
| Unsuitable | 18,946.74 | 4.61% |
| Very unsuitable | 4706.38 | 1.15% |
| Total | 410,712.69 | 100.00% |
Table 6.
Area comparison of two models (ha).
| Models | ||
|---|---|---|
| Non-MCR | MCR-Modified CA–Markov | |
| Overestimated | 15,535.33 | 10,873.89 |
| Correct | 76,891.53 | 79,322.76 |
| Underestimated | 38,277.62 | 40,507.83 |
© 2018 by the author. Licensee MDPI, Basel, Switzerland. This article is an open access article distributed under the terms and conditions of the Creative Commons Attribution (CC BY) license (http://creativecommons.org/licenses/by/4.0/).
Share and Cite
MDPI and ACS Style
Li, X.; Wang, M.; Liu, X.; Chen, Z.; Wei, X.; Che, W. MCR-Modified CA–Markov Model for the Simulation of Urban Expansion. Sustainability 2018, 10, 3116. https://doi.org/10.3390/su10093116
AMA Style
Li X, Wang M, Liu X, Chen Z, Wei X, Che W. MCR-Modified CA–Markov Model for the Simulation of Urban Expansion. Sustainability. 2018; 10(9):3116. https://doi.org/10.3390/su10093116
Chicago/Turabian StyleLi, Xiuquan, Meizhen Wang, Xuejun Liu, Zhuan Chen, Xiaojian Wei, and Weitao Che. 2018. "MCR-Modified CA–Markov Model for the Simulation of Urban Expansion" Sustainability 10, no. 9: 3116. https://doi.org/10.3390/su10093116
Note that from the first issue of 2016, this journal uses article numbers instead of page numbers. See further details here.