Assessment of Carbon Storage and Its Influencing Factors in Qinghai-Tibet Plateau


1
State Key Laboratory of Resources and Environmental Information System, Institute of Geographic Sciences and Natural Resources Research, Chinese Academy of Sciences, 11A Datun Road, Chaoyang District, Beijing 100101, China
2
University of Chinese Academy of Sciences, 19A Yuquan Road, Shijingshan District, Beijing 100049, China
3
College of Geomatics, Shandong University of Science and Technology, Qingdao 266510, China
4
Institute for Geospatial Research and Education, Eastern Michigan University, Ypsilanti, MI 48197, USA
5
Institute of Geographic Science and Natural Resources Research, Chinese Academy of Sciences, 11A Datun Road, Chaoyang District, Beijing 100101, China
6
Guangzhou Institute of Geography, Guangzhou 510070, China
*
Authors to whom correspondence should be addressed.
Sustainability 2018, 10(6), 1864; https://doi.org/10.3390/su10061864
Submission received: 9 May 2018
/
Revised: 29 May 2018
/
Accepted: 30 May 2018
/
Published: 4 June 2018
(This article belongs to the Special Issue Data Analytics on Sustainable, Resilient and Just Communities)
Abstract
:Land use/cover change (LUCC) is one of the major factors influencing the storage of ecosystem carbon. The carbon storage in Qinghai-Tibet Plateau, the world’s highest plateau, is affected by a combination of many factors. Using MCD12Q1 land classification data, aboveground biomass, belowground biomass, soil carbon and humus carbon data, as well as field sampling data for parameters verification, we applied the InVEST model to simulate the ecosystem carbon storage and the impacts of driving factors. The field survey samples were used to test the regression accuracy, and the results confirmed that the model performance was reasonable and acceptable. The main conclusions of this study are as follows: From 2001 to 2010, carbon storage in the Qinghai-Tibet Plateau increased by 10.39 billion t when assuming that the carbon density in each land cover type was constant. Changes of the land cover types caused carbon storage to increase by 116 million t, which contributed 13.82% of the dynamic carbon storage. Consequently, changes in carbon density accounted for 86.18% of the carbon storage change. In addition, we investigated the soil organic matter and aboveground biomass characteristics between 2012 and 2014 and found that the influences of fencing and dung on carbon storage were positive.

1. Introduction
Global climate warming is one of the most serious environmental conditions currently facing human society, and carbon emissions and the greenhouse effect are considered as important factors of climate change [1,2,3]. Changes in land use cause changes in the carbon cycle of terrestrial ecosystems, which in turn affect the regional carbon balance [4,5,6]. Thus, maintaining the function of this service for the ecosystem is crucial. Scientifically evaluating and predicting the influence of landscape changes on carbon in the ecosystem can provide data on the increased transfer of greenhouse gas emissions [7,8,9].
Land use/cover change (LUCC) impacts residual vegetation, the input and distribution of soil organic matter, and the soil respiration rate. Such changes can also influence the soil organic carbon budget [10]. Changes in land use caused by altering the structure (species) and function of an ecosystem (e.g., biodiversity, energy balance, carbon, nitrogen, and water cycle) can affect the carbon cycle of an ecosystem [11,12,13]. During the carbon cycle, carbon pools can accumulate carbon from multiple systems, including vegetation, soil, atmosphere and oceans. In an ecosystem, the functions of carbon sinks are reflected in the reserves and storage rate of the carbon pool and the intensity of carbon emissions from carbon sources [14]. Basic carbon pools include living and residual vegetation and soil carbon pools. Basic storage processes include photosynthesis and soil carbon sequestration, whereas basic emission processes include vegetation and soil respiration [15,16].
In recent decades, the carbon cycle has become an increasingly popular issue in the fields of global climate change and Earth sciences [17,18,19,20,21,22,23,24,25,26,27]. Global carbon mainly occurs in soil, vegetation and the atmosphere; these three large carbon pools include approximately 1400–1500 Gt of organic carbon in the soil [28,29,30], approximately 500–600 Gt of carbon in land vegetation [27], and 750 Gt of atmospheric carbon. The early estimates of carbon pools differed widely, mainly due to the use of few soil profile data and different methods and considerations. For example, in 1946, Bohn estimated that there were 7949 Gt of global carbon [25]; in 1951, Rubey analyzed nine soil profiles and calculated that global carbon reserves comprised 710 Gt of carbon [31]. Since the 1980s, different scholars have obtained increasingly similar estimations of global carbon [24,25,28,32,33,34,35]. For example, Schlesinger estimated that there were 1500 Gt of global soil carbon reserves in 1990 [29]; in 1993, Eswaran obtained an estimate of 1576 Gt [36]. Forest planting, grassland management, and changes in land use have prominent effects on carbon [37,38,39,40].
In 1999, the United States enacted a policy to encourage the growth of the soil carbon pool. Since the 1990s, scholars have used two sets of Chinese soil census data to analyze the significance of carbon in China and its changes with respect to those around the world. Different researchers have obtained different results; for example, in 1996, Fang Jingyun calculated that China’s total soil carbon stock was 185.7 Gt, and, in 1999, Wang Shao Qiang estimated that the total soil carbon stock was 100.18 Gt [41]. Many studies have assessed the influence of LUCC on carbon [42,43,44,45]. Changes in land use type have altered the distribution pattern of carbon storage to a certain extent [46]. Remote sensing and geostatistical data have provided efficient means for monitoring regional biomass and soil organic carbon [47,48,49]. The net primary productivity (NPP) simulation model is constructed based on the normalized difference vegetation index (NDVI) for long time series [50,51], and some scholars have used case studies to establish a relationship between the NDVI and soil organic carbon [52,53].
The InVEST (Integrated Valuation of Ecosystem Services and Trade-offs) model provides a dynamic visualization of the service functions of an ecosystem across time and space. The InVEST carbon module can simulate the levels of carbon in four different carbon pools, namely aboveground biomass, belowground biomass, soil carbon and humus carbon, based on spatiotemporal LUCC data. The process of carbon sequestration and release is not definitely considered in the module, but the module can reliably estimate the storage of carbon in the landscape. The InVEST carbon module output for carbon storage in the landscape can be visually displayed, and its dynamics are driven by LUCC. From this calculation, the value of carbon storage and the effects of LUCC on the regulation of ecosystem services are obtained. This methodology has been extensively used in carbon storage research. Additionally, this model requires less input data and produces more output data than other models. The InVEST model can use multiple modules on multiple scales, and it can analyze many situations [17,18].
Based on the spatial and temporal variations in land use/cover, the InVEST model can be used to simulate processes in terrestrial ecosystems, including carbon storage, biological harvesting, water flow, water purification, and habitat quality, as well as to assess soil conservation and dynamic changes in the functions of ecosystem services [19,20,21,22]. The carbon sink module of the InVEST model assumes that the carbon intensity (i.e., carbon per unit area) of each land cover type remains unchanged and that the amount of carbon changes linearly over time [23]. The assumptions and simplified algorithm of the InVEST model make it necessary to improve the simulation of carbon storage and transfer accuracy so that the model is suitable for sinks spanning large areas and for rapidly simulating the dynamic characteristics of an area across space and time.
The Qinghai-Tibet Plateau (26°00′–39°47′ N, 73°19′–104°47′ E) is the largest plateau in China and the highest plateau in the world. It is known as “the roof of the world”, covers a total area of approximately 2.57 million km2, and is located at an average elevation of 4000 m or higher. Its ecological system is fragile and sensitive; thus, its carbon cycle has exerted an important influence on global climate change. In recent decades, because of human activities and global climate change, especially LUCC, China has implemented a major ecological construction project and the ecological quality of the Qinghai-Tibet Plateau has been improved. Studies of the Qinghai-Tibet Plateau can therefore provide references for making decisions about ecological conservation and climate change responses.
The forests and grassland of the Qinghai-Tibet Plateau cover a large area, are widely distributed, and have strong carbon sequestration and oxygen production capabilities. Using international carbon trading rules to create carbon sink areas in Qinghai-Tibet Plateau can strengthen ecological environmental protection and can further promote the development of the carbon industry, thus enhancing economic and social development in Qinghai-Tibet Plateau to achieve green development while sharing development goals. Analyses of soil carbon pool indicate that the Qinghai-Tibet Plateau covers an area of 2.57 million km2, with an average soil depth of 72 cm, and this area has accumulated 3.84 × 10⁹ t of organic carbon, comprising approximately 21% of the total soil carbon stock in China, including plateau meadow soil and plateau steppe soil organic carbon storage. Although carbon sinks mainly represent forest carbon sinks, grassland carbon reserves are large. The restoration of grassland vegetation is relatively inexpensive, can protect the ecological integrity and play a further role in carbon sequestration. Thus, developing a carbon sink in Qinghai-Tibet Plateau can be based on the previous development of carbon sequestration in forests, which gradually occurred in forests, grasslands and wetlands to form a multilevel and multidimensional carbon trading market.
2. Research Methods and Data Sources
2.1. Data Sources
Land cover data: The MODIS MCD12Q1 source yielded a total of 3 datasets in 2001, 2005, and 2010, with a spatial resolution of 500 m (upon resampling, the calculated spatial resolution of the image data is 463.3 m). The MCD data products include 5 different types of land cover classification systems. This paper uses the International Geosphere-Biosphere Programme (IGBP) global vegetation classification scheme, which is mainly divided into 17 classes. This dataset is provided by the International Scientific & Technical Data Mirror Site, Computer Network Information Center, Chinese Academy of Sciences (http://www.gscloud.cn).
NDVI: The Terra satellite MODND1M yields a monthly product with a spatial resolution of 1 km, obtaining NDVI images over a growth season of June to October and yielding a total of 4 datasets in 2000, 2001, 2005, and 2010. The dataset is provided by the International Scientific & Technical Data Mirror Site, Computer Network Information Center, Chinese Academy of Sciences (http://www.gscloud.cn).
Carbon stock parameters: Carbon pool data were collected in 2000, including biomass data from the Carbon Dioxide Information Analysis Center (CDIAC), soil organic carbon data from the European Union JRC soil working group (0 to 30 cm), and humus carbon data and root-to-shoot ratios from the IPCC 2006 national greenhouse gas emissions.
Field survey data: The aboveground biomass data were derived from 102 samples surveyed in 2013 and 18 samples surveyed in Naqu, northern Tibet, in 2014, and the land cover type was grassland. Each 25 cm × 25 cm grassland sample was randomly selected. After the grass was mowed, cleaned, and dried, the ground biomass was weighed (Guangzheng YP-B electronic scale, Shanghai, China 0.01 g); its carbon content was converted by a ratio of 0.47.
In addition, in 2013 and 2014, aboveground biomass and soil organic matter were obtained from 36 field samples. The soil samples were collected using the quadrilateral method and the samples were then dried and passed through a 2-mm sieve. The determination of soil organic matter was performed by assessing the potassium dichromate capacity using the external heating method.
2.2. Research Methods
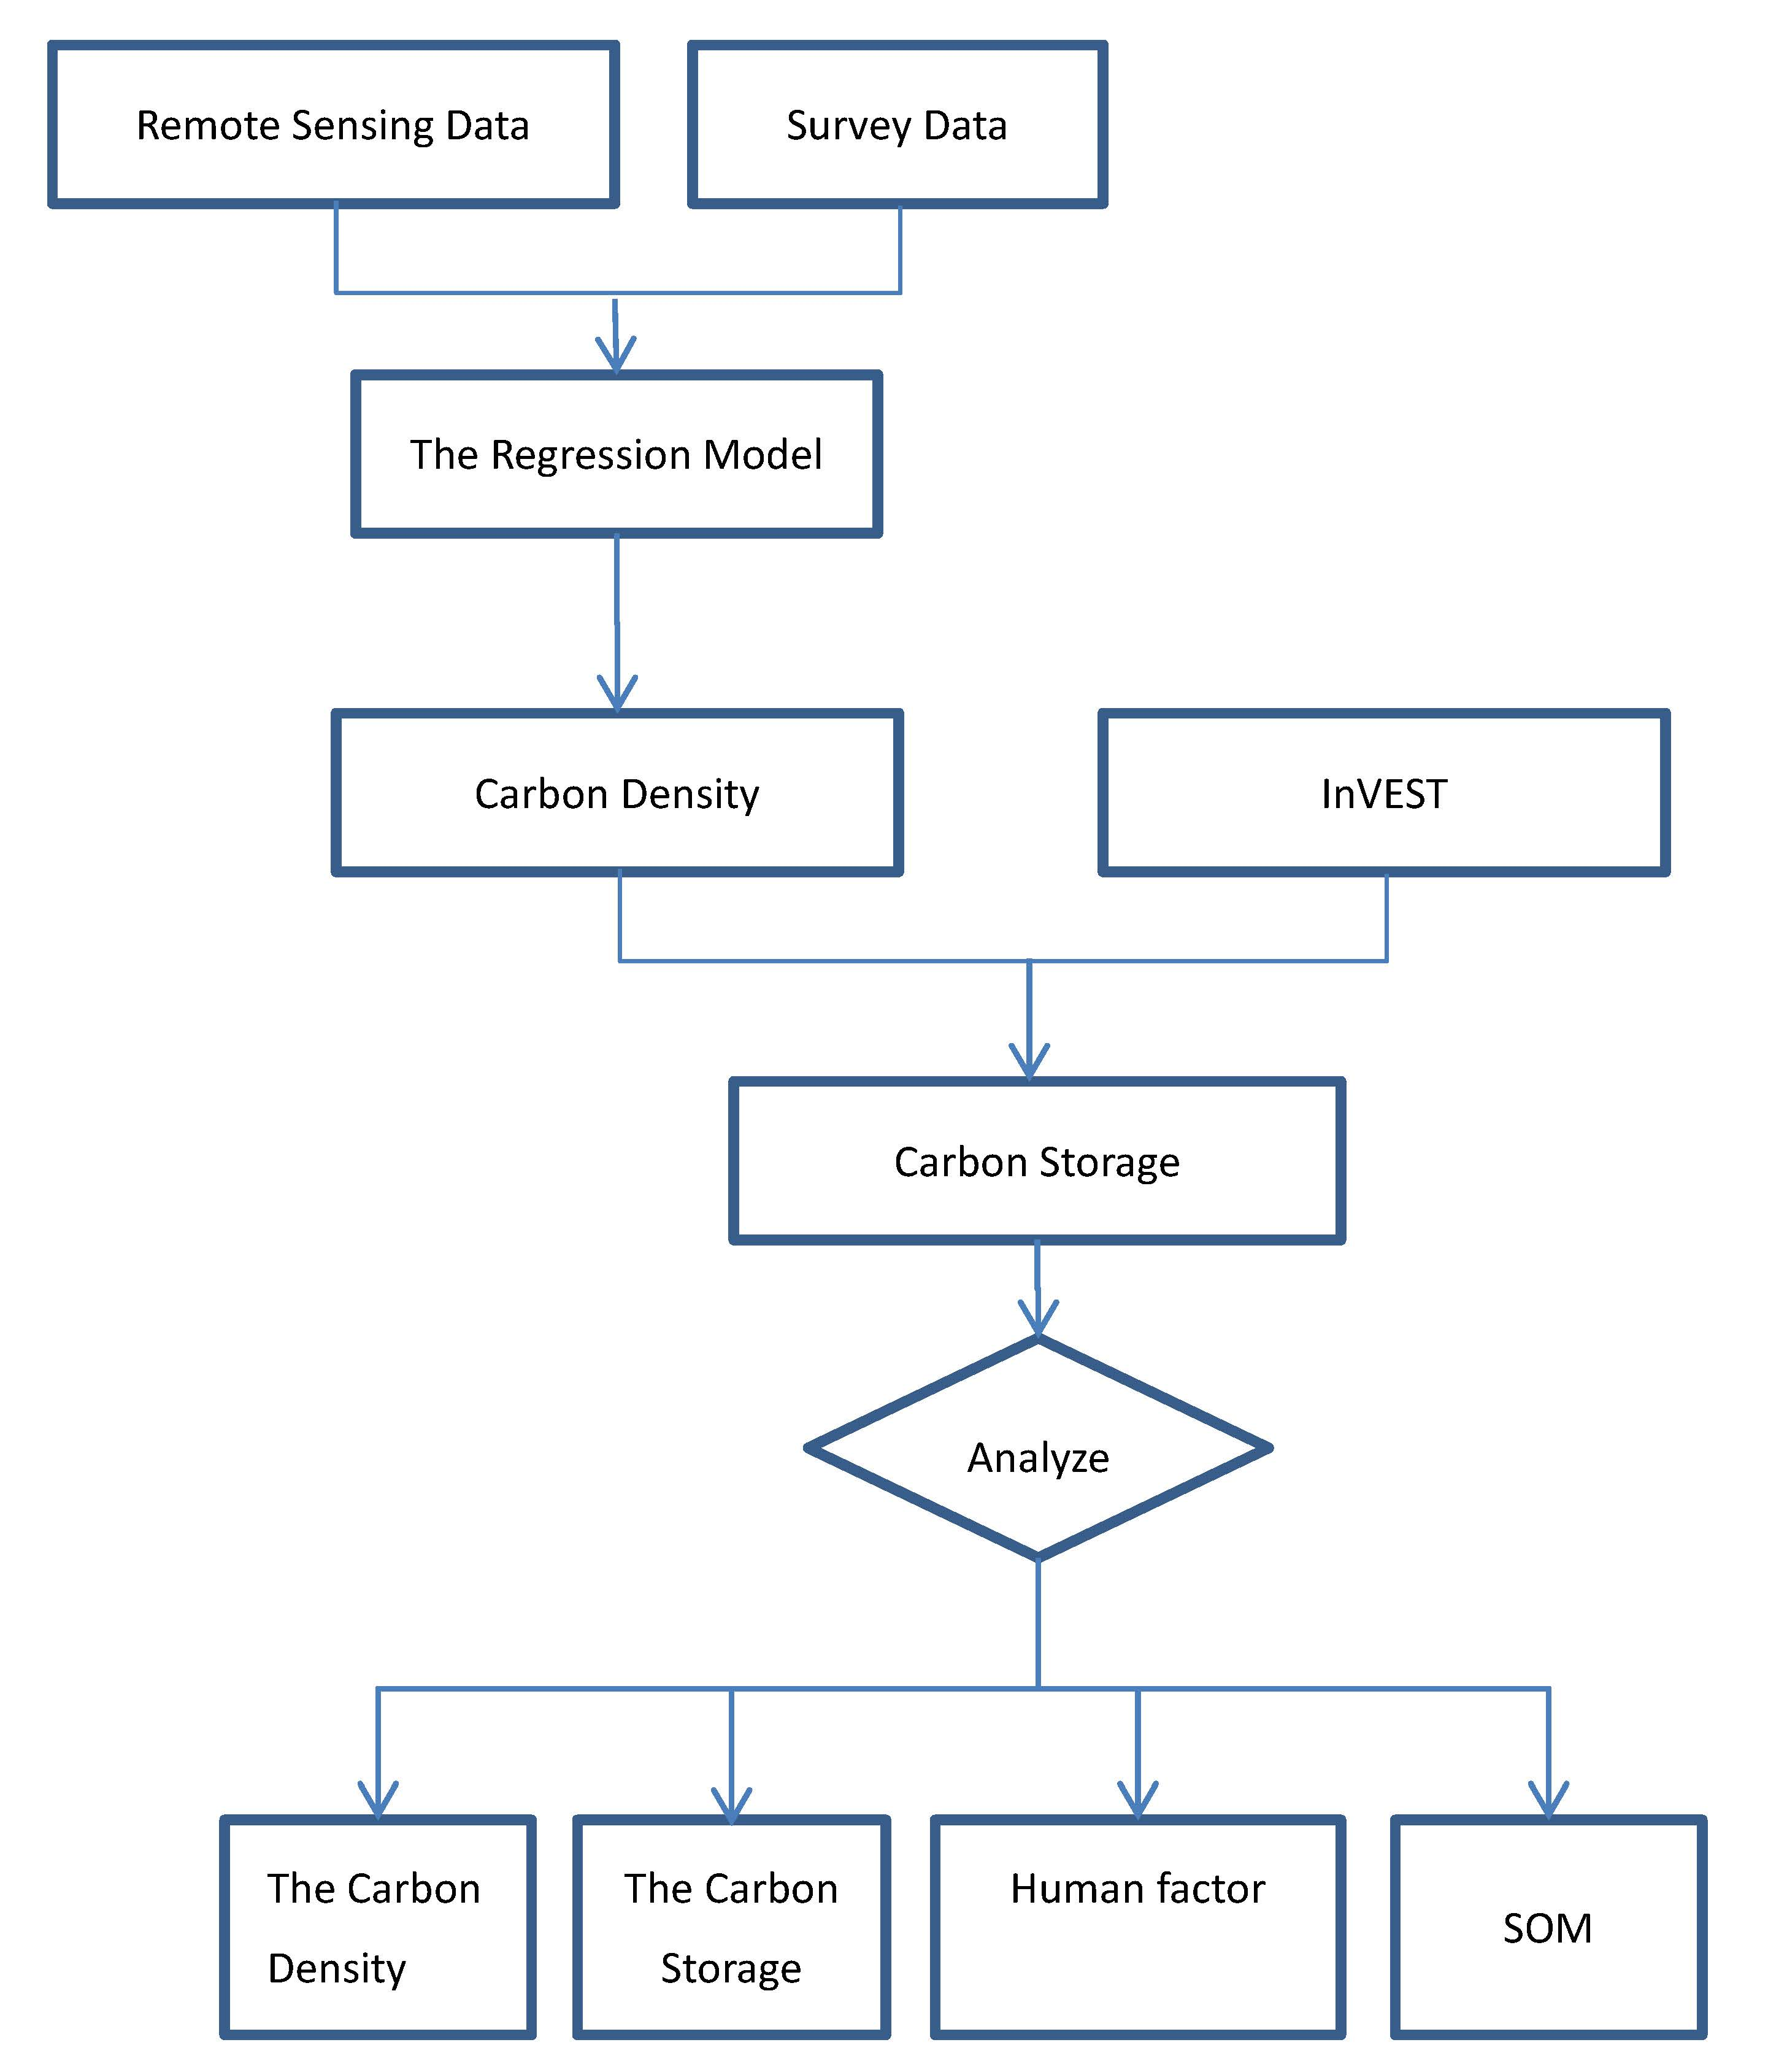
We used the dataset of 2000 to construct two regression models: one was NDVI and biomass, and the other was NDVI and soil organic carbon. Then, based on the inversion of the models, biomass and soil organic carbon data in 2001, 2005 and 2010 were modeled. Based on the root-to-shoot ratio, biomass was converted into aboveground biomass and underground biomass. Because the humus carbon pool is small and relatively stable [54], the humus carbon density data in this paper represent those collected in 2000. Then, the land cover and carbon density parameters were input into InVEST to determine the carbon storage in 2001, 2005 and 2010 in the Qinghai-Tibet Plateau.
(1) The key carbon pool parameter inversion
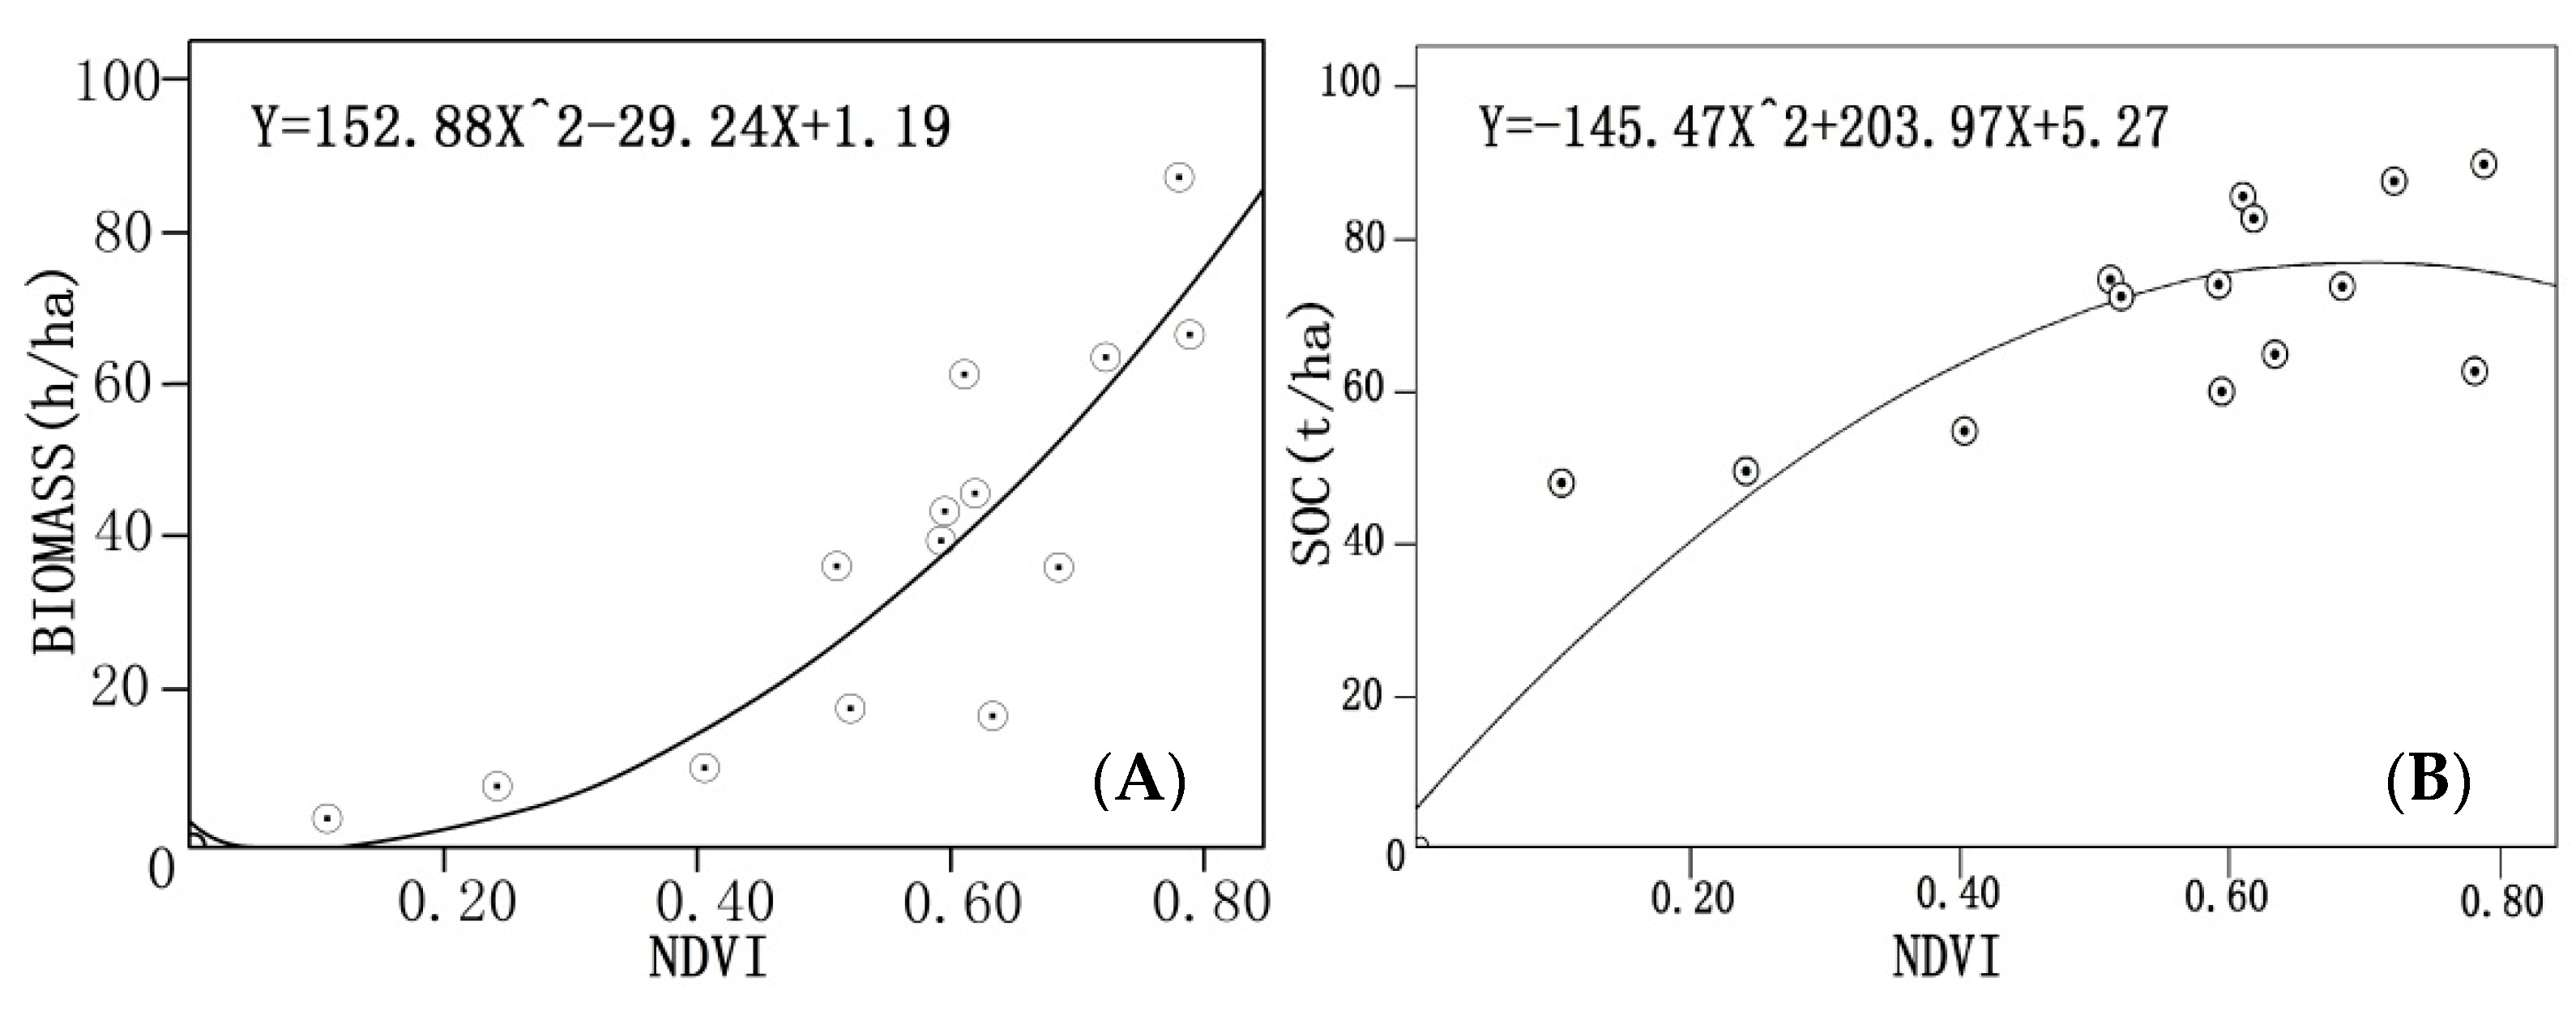
GIS spatial analysis was used to acquire the NDVI mean values of 17 types of land use, biomass and soil organic carbon. Then, SPSS 21.0 statistical analysis was applied. NDVI, BIOMASS, and soil organic carbon (SOC) exhibited normal distributions, and NDVI and BIOMASS were significantly related to SOC (alpha = 0.05), as they yielded correlation coefficients of = 0.854 and = 0.902, respectively, according to regression analysis. In accordance with the requirements of the fit of strong correlation, a high BIOMASS-NDVI index model and a quadratic curve model of SOC-NDVI were constructed (Figure 1). The equation was derived through the analysis of variance and the regression coefficient t-test (p < 0.05). The regression equation was based on NDVI, biomass and soil organic carbon, as well as the inversion of key parameters measured in 2001, 2005 and 2010, such as biomass and soil organic carbon.
Based on the regression analysis, the obtained grassland biomass was 66.07 t C/ha in 2010. Moreover, according to the root-to-shoot ratios (RSRs) from the IPCC 2006 national greenhouse gas emission inventory, the RSR of grassland is 2.8. Thus, the aboveground biomass of grassland was 17.39 t C/ha; the belowground biomass of grassland was 48.68 t C/ha. We used 102 field survey samples of grassland collected in 2013 to test the model accuracy. The average aboveground biomass of the 102 grassland samples was 16.70 t C/ha, the difference between the observations and model results was 0.69 t C/ha, or approximately 4.13%. When we used the 18 grassland samples collected in 2014 in Naqu, a typical grassland area on the Qinghai-Tibet Plateau, the average biomass of 18 grassland samples was 17.49 t C/ha, and the difference between the observations and model results was 0.1 t C/ha, or approximately 0.57%. The test results show that the accuracy of the applied model is reasonable and acceptable.
(2) Ecosystem carbon pool simulation
InVEST, developed at Stanford University, is a comprehensive ecosystem service evaluation model that can assess various ecosystem services, provide comprehensive analysis for planning ecological restoration, design payments for ecosystem services (PES), and assess developmental effects and space permits. Cooperation risk management plays an increasingly vital role in promoting biodiversity conservation, and the coordinated development of human well-being is of great significance [55]. Land cover, biomass, soil carbon and humus carbon data collected in the study area in 2000, 2005, and 2010 were regarded as InVEST input data to simulate carbon storage during the corresponding years. Then, the behavior and spatial differentiation of carbon storage in the Tibetan Plateau from 2000 to 2010 was analyzed. The carbon computation formula in the carbon module of the InVEST model is described as follows:
where Ai is the area of class i, is the carbon density of class i (t C/ ha), represents aboveground biomass, represents root biomass, represents humus carbon, and represents soil organic carbon.
(3) Carbon storage function change analysis of the impact factor and its attribution
In general, LUCC can be divided into changes in land cover types (land conversion) and changes in the internal quality of a specific land cover type (land modification). Accordingly, changes in the regional carbon storage function involve changes in the land cover type and carbon density, and they involve the contribution of different factors that affect the carbon storage function. The model of this process is described as follows:
- (1)
- Changes in regional carbon storage function based on two carbon available pools using the characteristic:where and are the areas of class i before and after the change, respectively, and and are the carbon densities of class i before and after the change, respectively.
- (2)
- We assume that the carbon density of all land use/land cover types is constant and the carbon storage changes are only caused by changes in the landscape; thus, the carbon storage change can be represented as follows:
- (3)
- Assuming that the land use/land cover is constant and that changes are caused only by carbon density changes, then the carbon storage change can be represented as follows:
- (4)
- The contribution rate of the change in land use/land cover types to carbon storage () and the contribution rate of the change in carbon density to carbon storage () can be calculated using the following formulas:
3. Results
Land use/land cover data and corresponding carbon density data were input into InVEST to simulate the three phases of carbon storage and sequestration in Qinghai-Tibet Plateau in 2000, 2005, and 2010. We analyzed the contribution of land use change to carbon sequestration, the contribution of carbon footprint change to carbon storage, and the relationship between carbon storage change and geographical factors, namely elevation and slope. In addition, the impacts of fencing and dung on carbon storage and carbon sequestration were analyzed.
3.1. Land Cover Change
Using the MODIS MCD12Q1 data obtained in 2001 and 2010, as well as IGBP classification system data, we can assess the LUCC in Qinghai-Tibet Plateau from 2001 to 2010 (Table 1). The Qinghai-Tibet Plateau is affected by terrain, atmospheric circulation and climatic factors, and it varies from warm and wet in the southeast to cold and dry in the northwest; these ecological climate factors also affect the distribution of vegetation. The distribution of forest, meadow, steppe and desert vegetation varies throughout the Qinghai-Tibet Plateau. The analysis of the land use/land cover structure of the Qinghai-Tibet Plateau from 2001 to 2010 yields the following conclusions.
In Qinghai-Tibet Plateau, rainfall and evaporation gradually decrease from the southeast to the northwest. Arid areas, which cover a larger proportion of the region, are mainly located in the northwest; wet areas, which cover a smaller proportion of the region, are mainly located in the east and southeast. Due to the zoning pattern of temperature, precipitation and evapotranspiration, ecological factors such as vegetation are more consistent within Qinghai-Tibet Plateau. The Naqu area in the central region of the Qinghai-Tibet Plateau is cold and wet, with a typical alpine meadow; the Qaidam area has sufficient heat and mainly comprises dry, bare land, with a small amount of sparse vegetation. Similar to the arid zone, the Kunlun Mountains region in the northwest has less precipitation and evapotranspiration, as well as less heat than over the Qaidam area, and the regional vegetation mainly comprises thickets. The temperature and precipitation in the northwestern Qiangtang area are slightly higher than those in the Kunlun Mountains area, and this area represents the main distribution of alpine grassland. South Tibet is affected by terrain, and its climate factors are mainly distributed throughout grasslands and shrub. The southeastern region of the Qinghai-Tibet Plateau features good precipitation and heat conditions. CangDong is generally hotter, but it exhibits abundant rainfall. CangDong and ZangDongNan mainly comprise forests.
Overall, in ten years, the vegetation on the Qinghai-Tibet Plateau steadily increased, with an average annual growth rate of 576 km2. The land use/land cover types of the Qinghai-Tibet Plateau are mainly forestland, grassland, bare land and sparse vegetation. During 2000–2010, woodland areas decreased and then increased, resulting in an overall increase of 9954 km2. Grassland areas also increased from 52.6 to 55.3%, representing a total area of 69,330 km2. Bare or sparse vegetation gradually decreased from 32.2% to 31.1%, thus representing a reduction of 28,908 km2.
In addition to water, ice and snow and wetland areas increased, while crop areas decreased.
3.2. Carbon Storage Function Pattern and Its Change
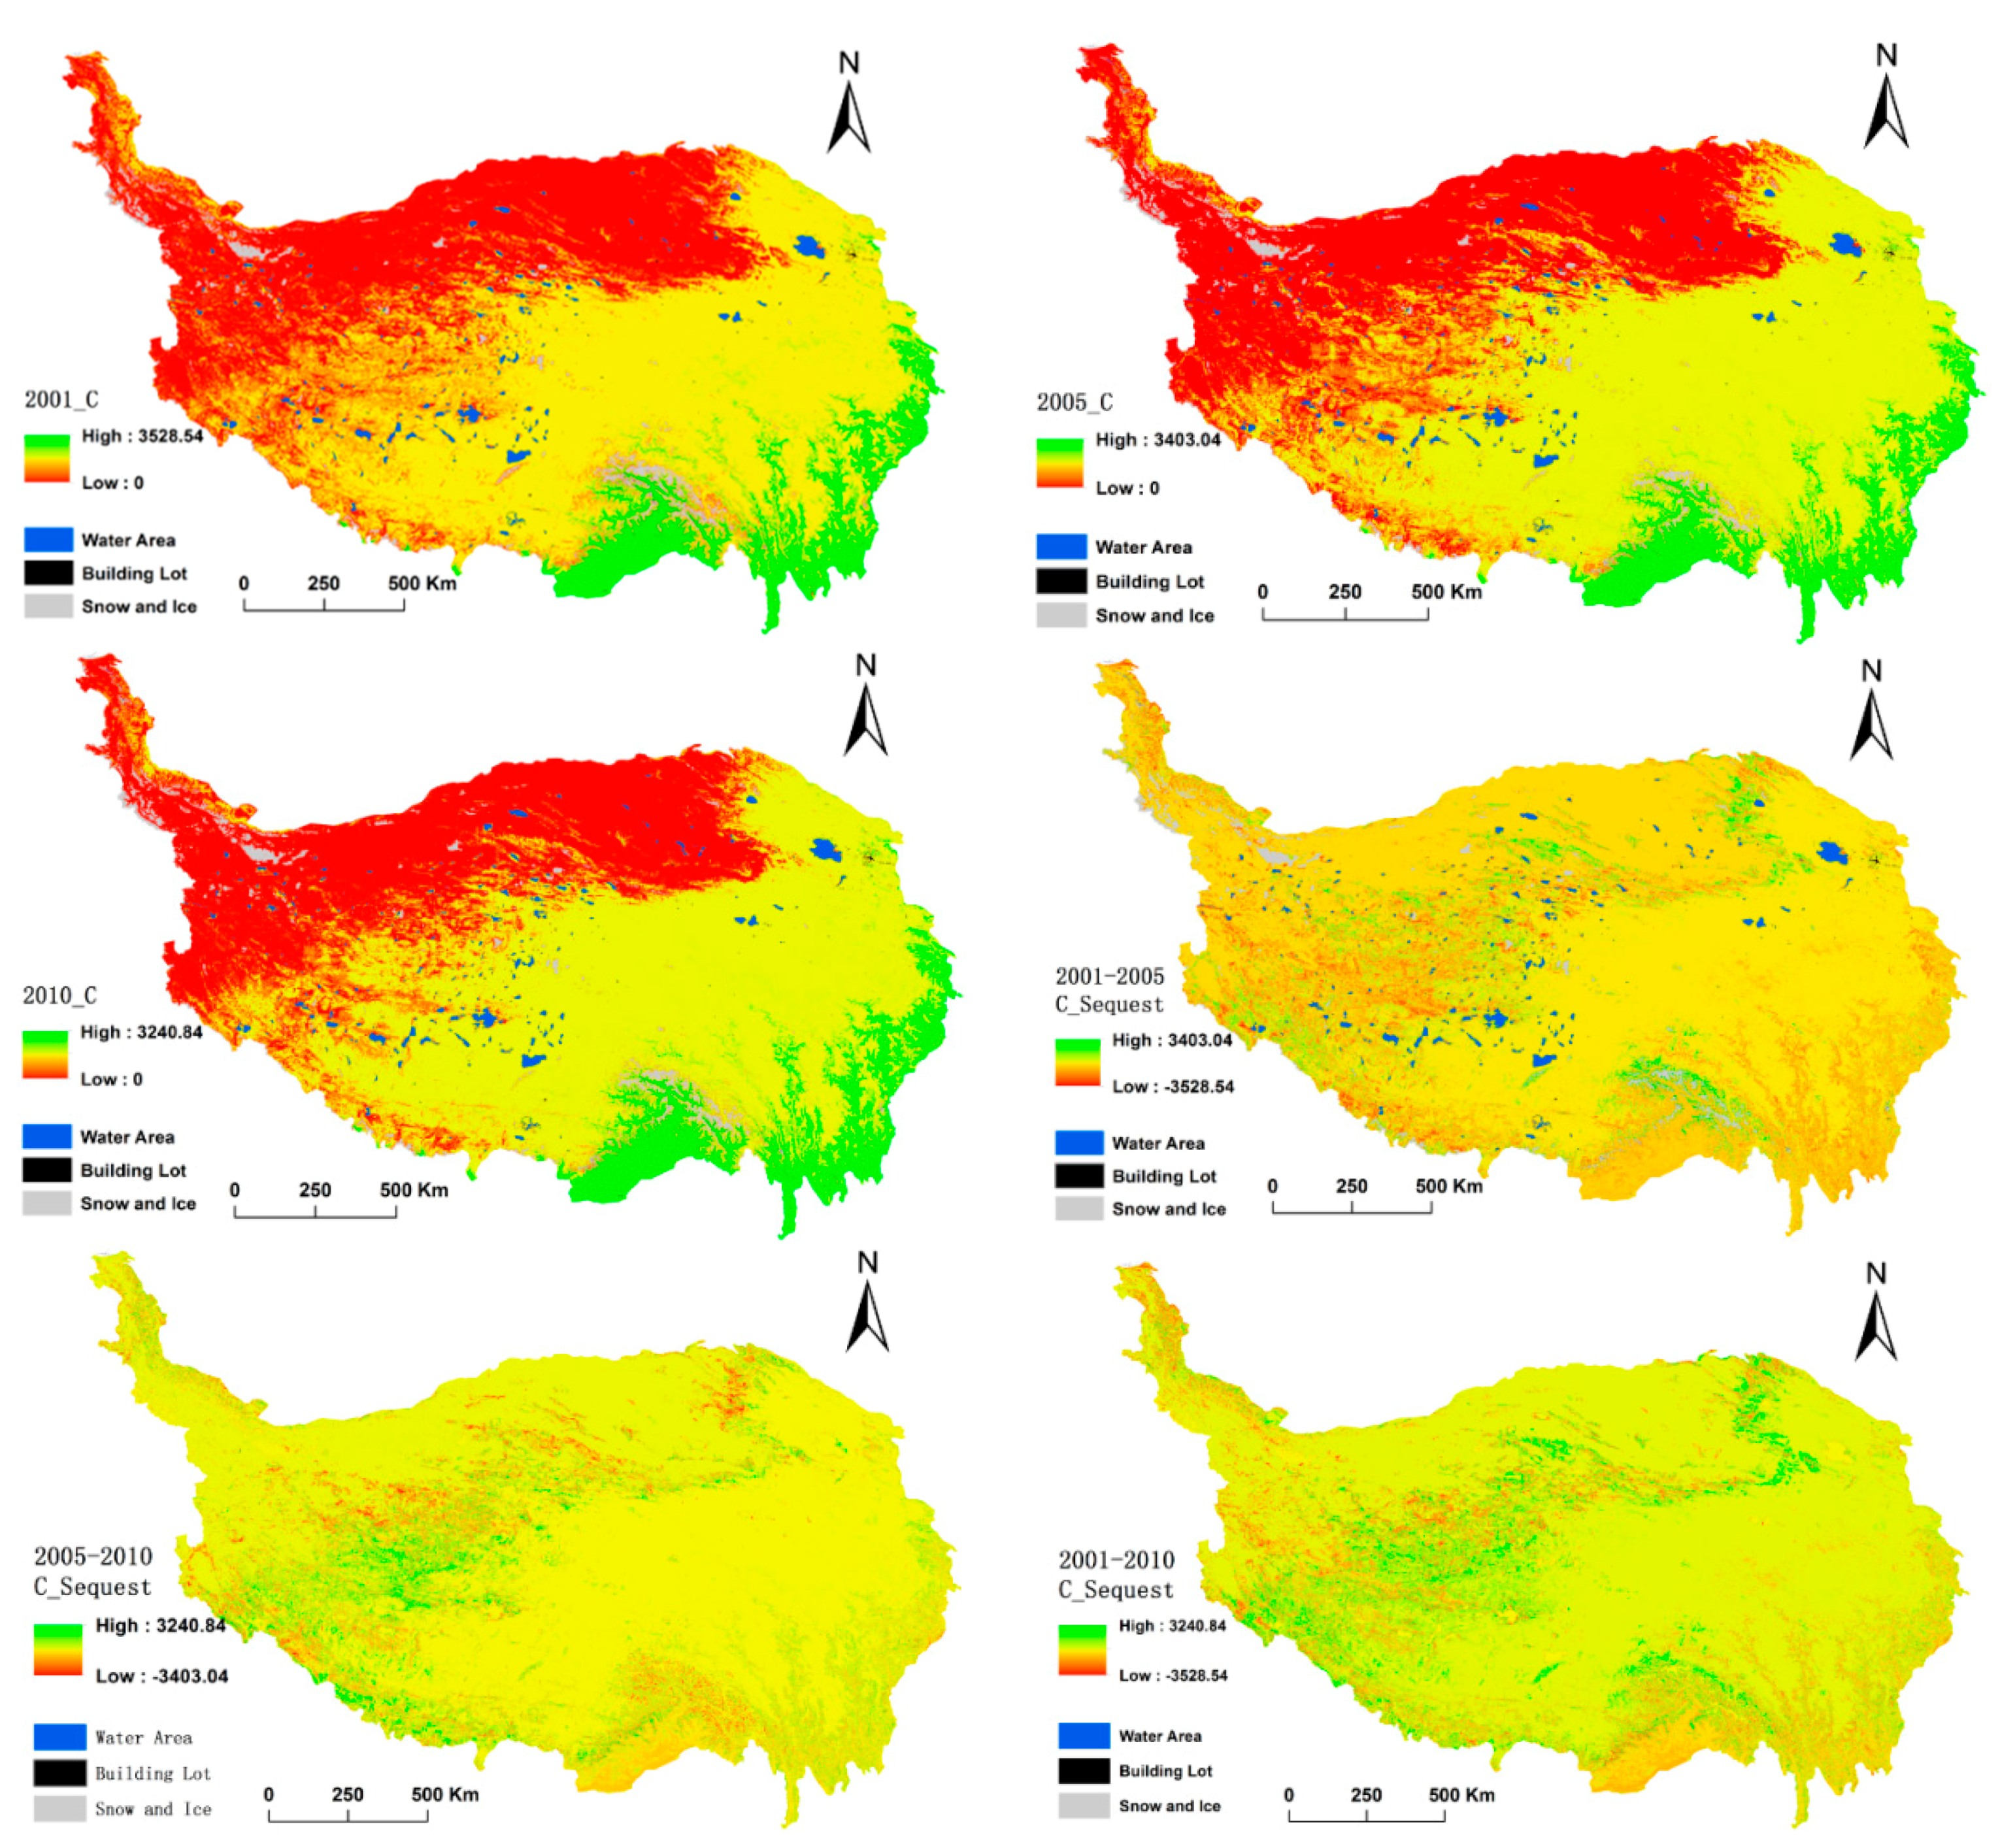
During 2001–2010, the carbon storage of the Qinghai-Tibet Plateau exhibited overall stability and growth. In 2001, 2005 and 2010, the total carbon storage values were 182, 188, and 192 billion t/C, respectively. Over 10 years, an increase of 10 billion t occurred. From southeast to northwest, the Qinghai-Tibet Plateau features the distribution of forest, grass, alpine meadow, alpine steppe and alpine desert. Consistent with this natural distribution, the carbon volumes in 2001, 2005 and 2010 decreased from southeast to northwest, exhibiting minor changes in different years.
CangDong and southern CangDong exhibited better coverage, as they are covered by forest and exhibited a decrease in carbon storage from 2001 to 2010, whereas carbon increased significantly in the northwestern Qiangtang area of the Qinghai-Tibet Plateau, and the remaining areas exhibited stable increases. The spatial distributions of the carbon pool in Qinghai-Tibet Plateau in 2001, 2005, and 2010 and during 2001–2005, 2005–2010, and 2001–2010 are shown in Figure 2.
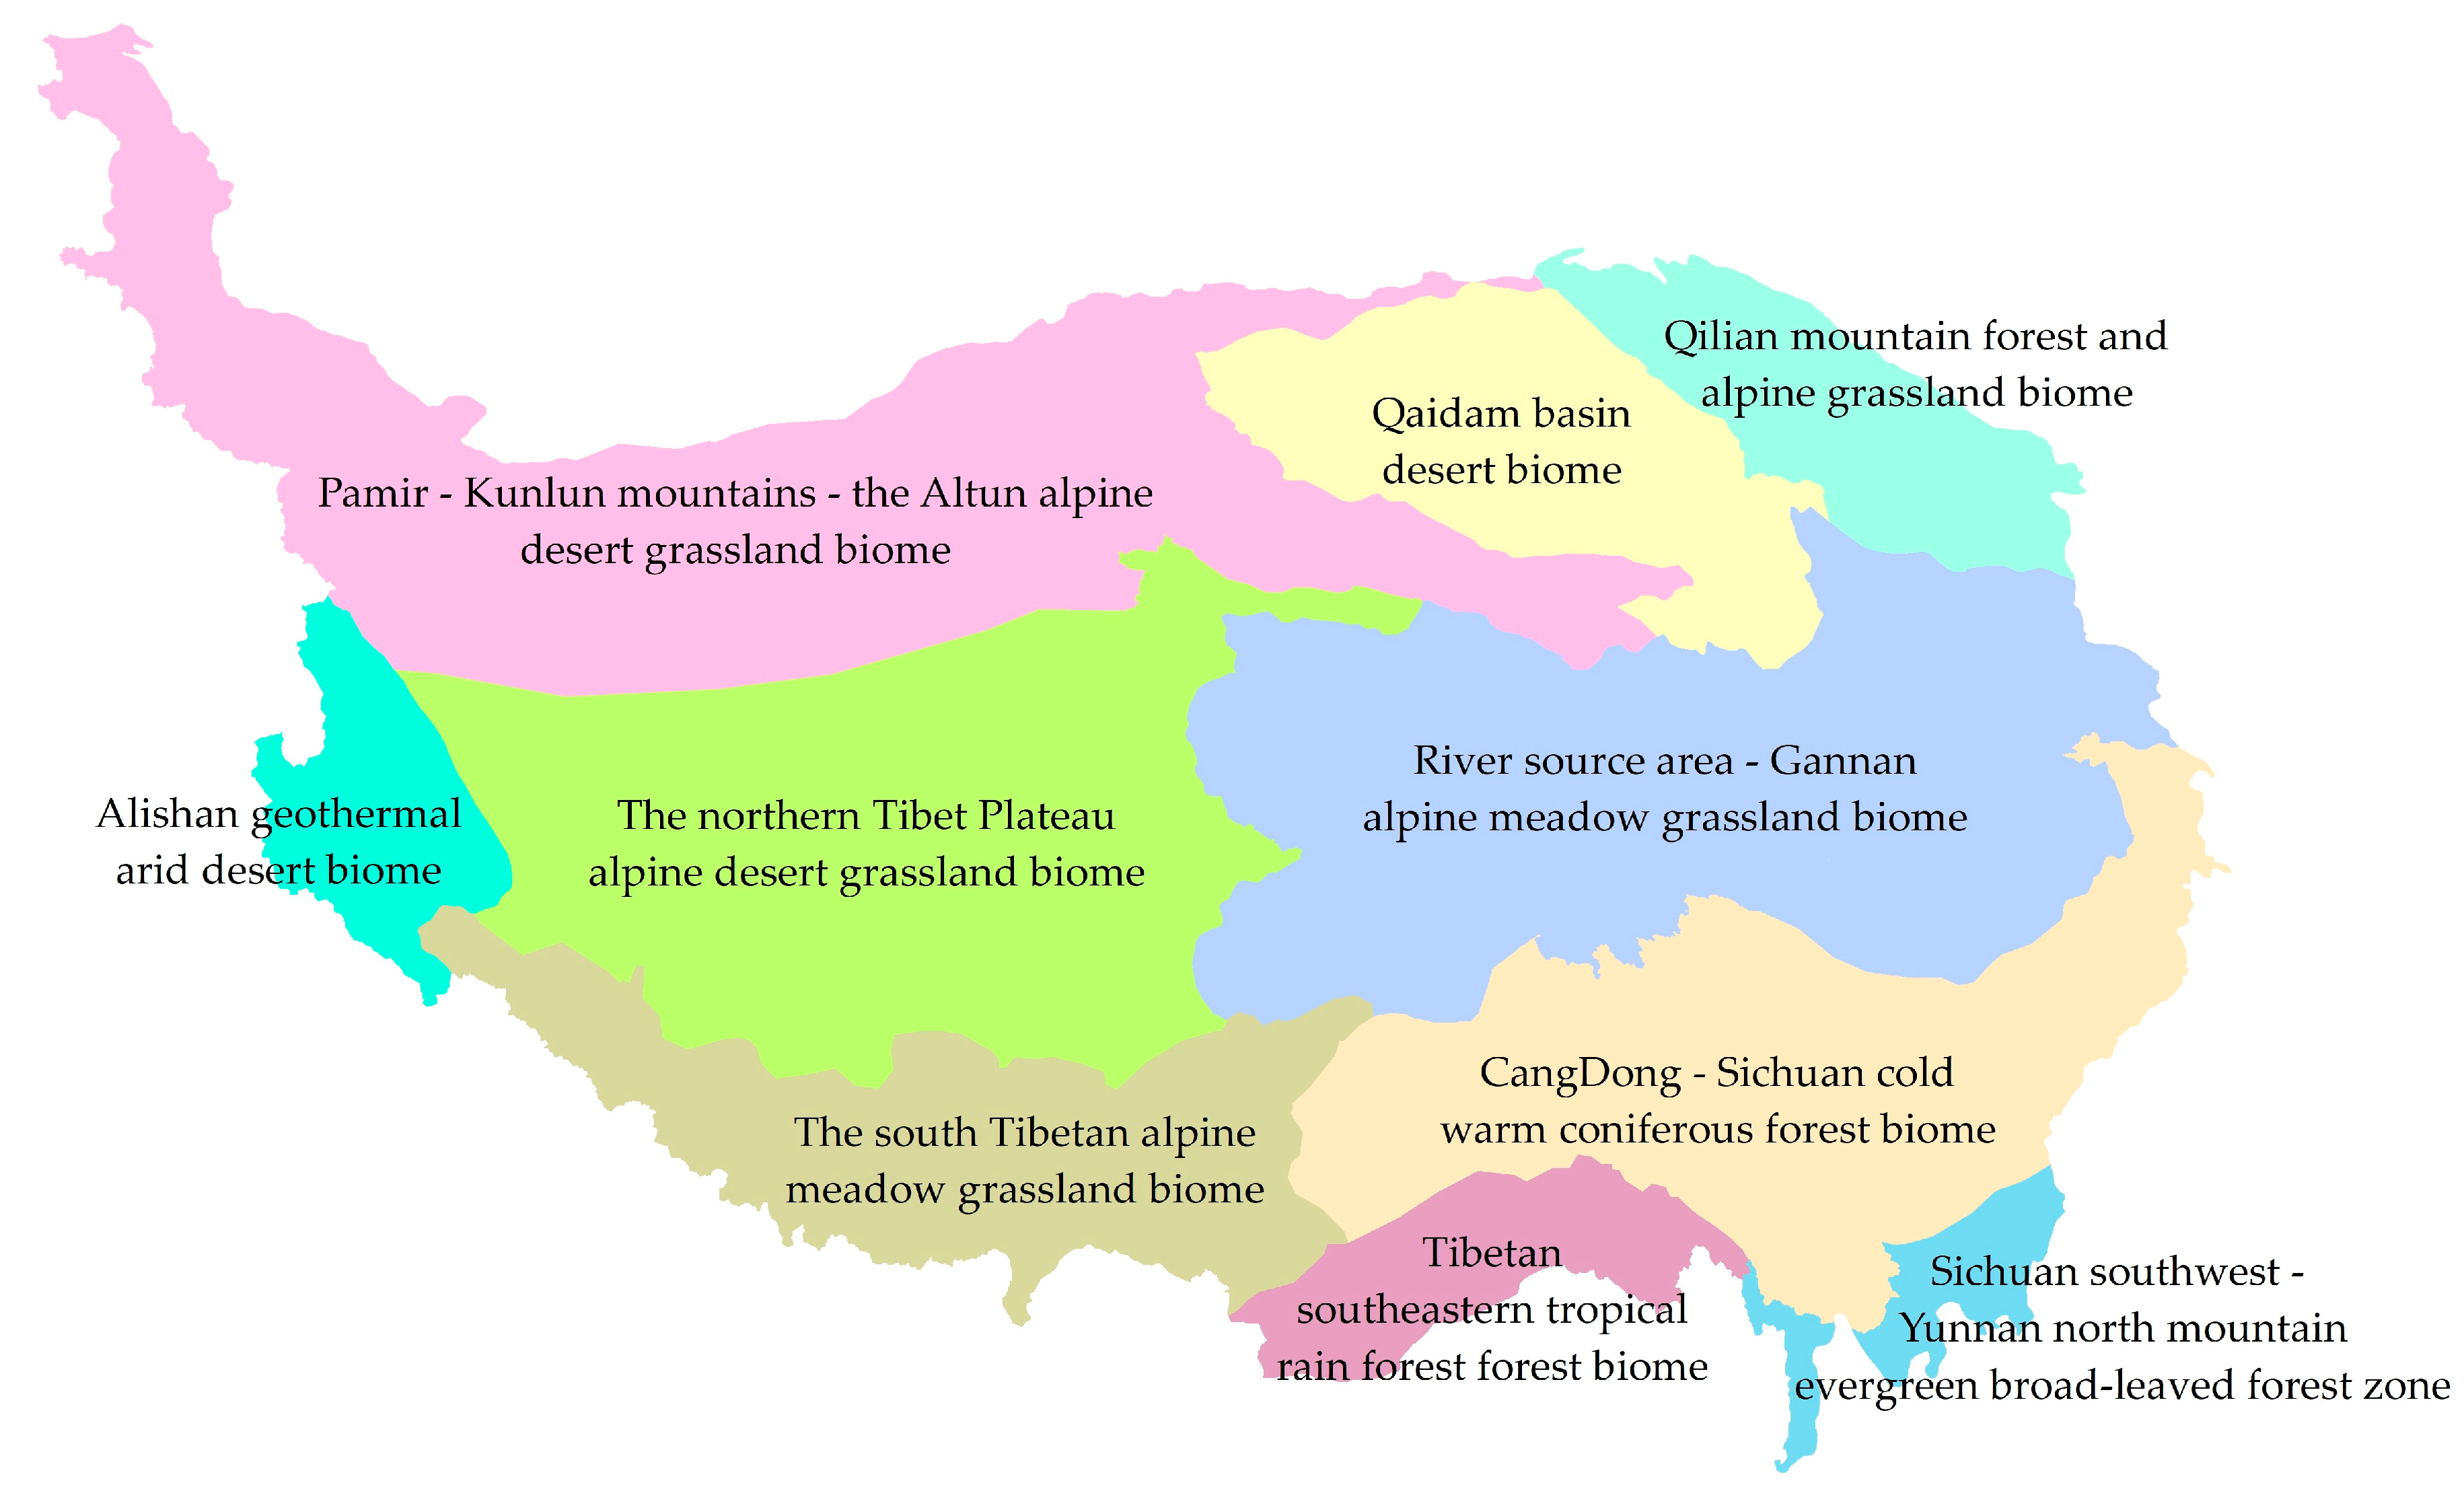
This area can be divided into the following regions based on ecological climate factors: southwest Sichuan-Yunnan, the northern Qinghai-Tibet Plateau mountain evergreen biome, the CangDong-Sichuan cold warm coniferous forest biome and the Qaidam Basin desert biome (Figure 3). The analyses of changes in the carbon storage of each biome from 2001 to 2010 are shown in Table 2. From 2001 to 2010, in seven biomes (i.e., the CangDong-Sichuan cold warm coniferous forest biome, the Qaidam Basin desert biome and river source area, the Gannan alpine meadow grassland biome, the Qilian mountain forest and alpine grassland biome, the Pamir-Kunlun Mountains-Altun alpine desert grassland biome, the northern Tibet Plateau alpine desert grassland biome and the southern Tibet mountain alpine meadow grassland biome), carbon storage steadily increased every year. In the Alishan geothermal arid desert biome, carbon storage increased after first decreasing but exhibited an overall increasing trend. Southwest of Sichuan and Yunnan and southeast of the north mountain evergreen broad-leaved forest zone of the tropical rain forest biome, carbon volume increased after first decreasing, thus yielding an overall decreasing trend. The coverage of ecological vegetation is better when the volume of carbon decreases, which is mainly related to the climate of the region.
3.3. Contribution of Changes in Land Cover Types to Changes in Carbon Storage Function
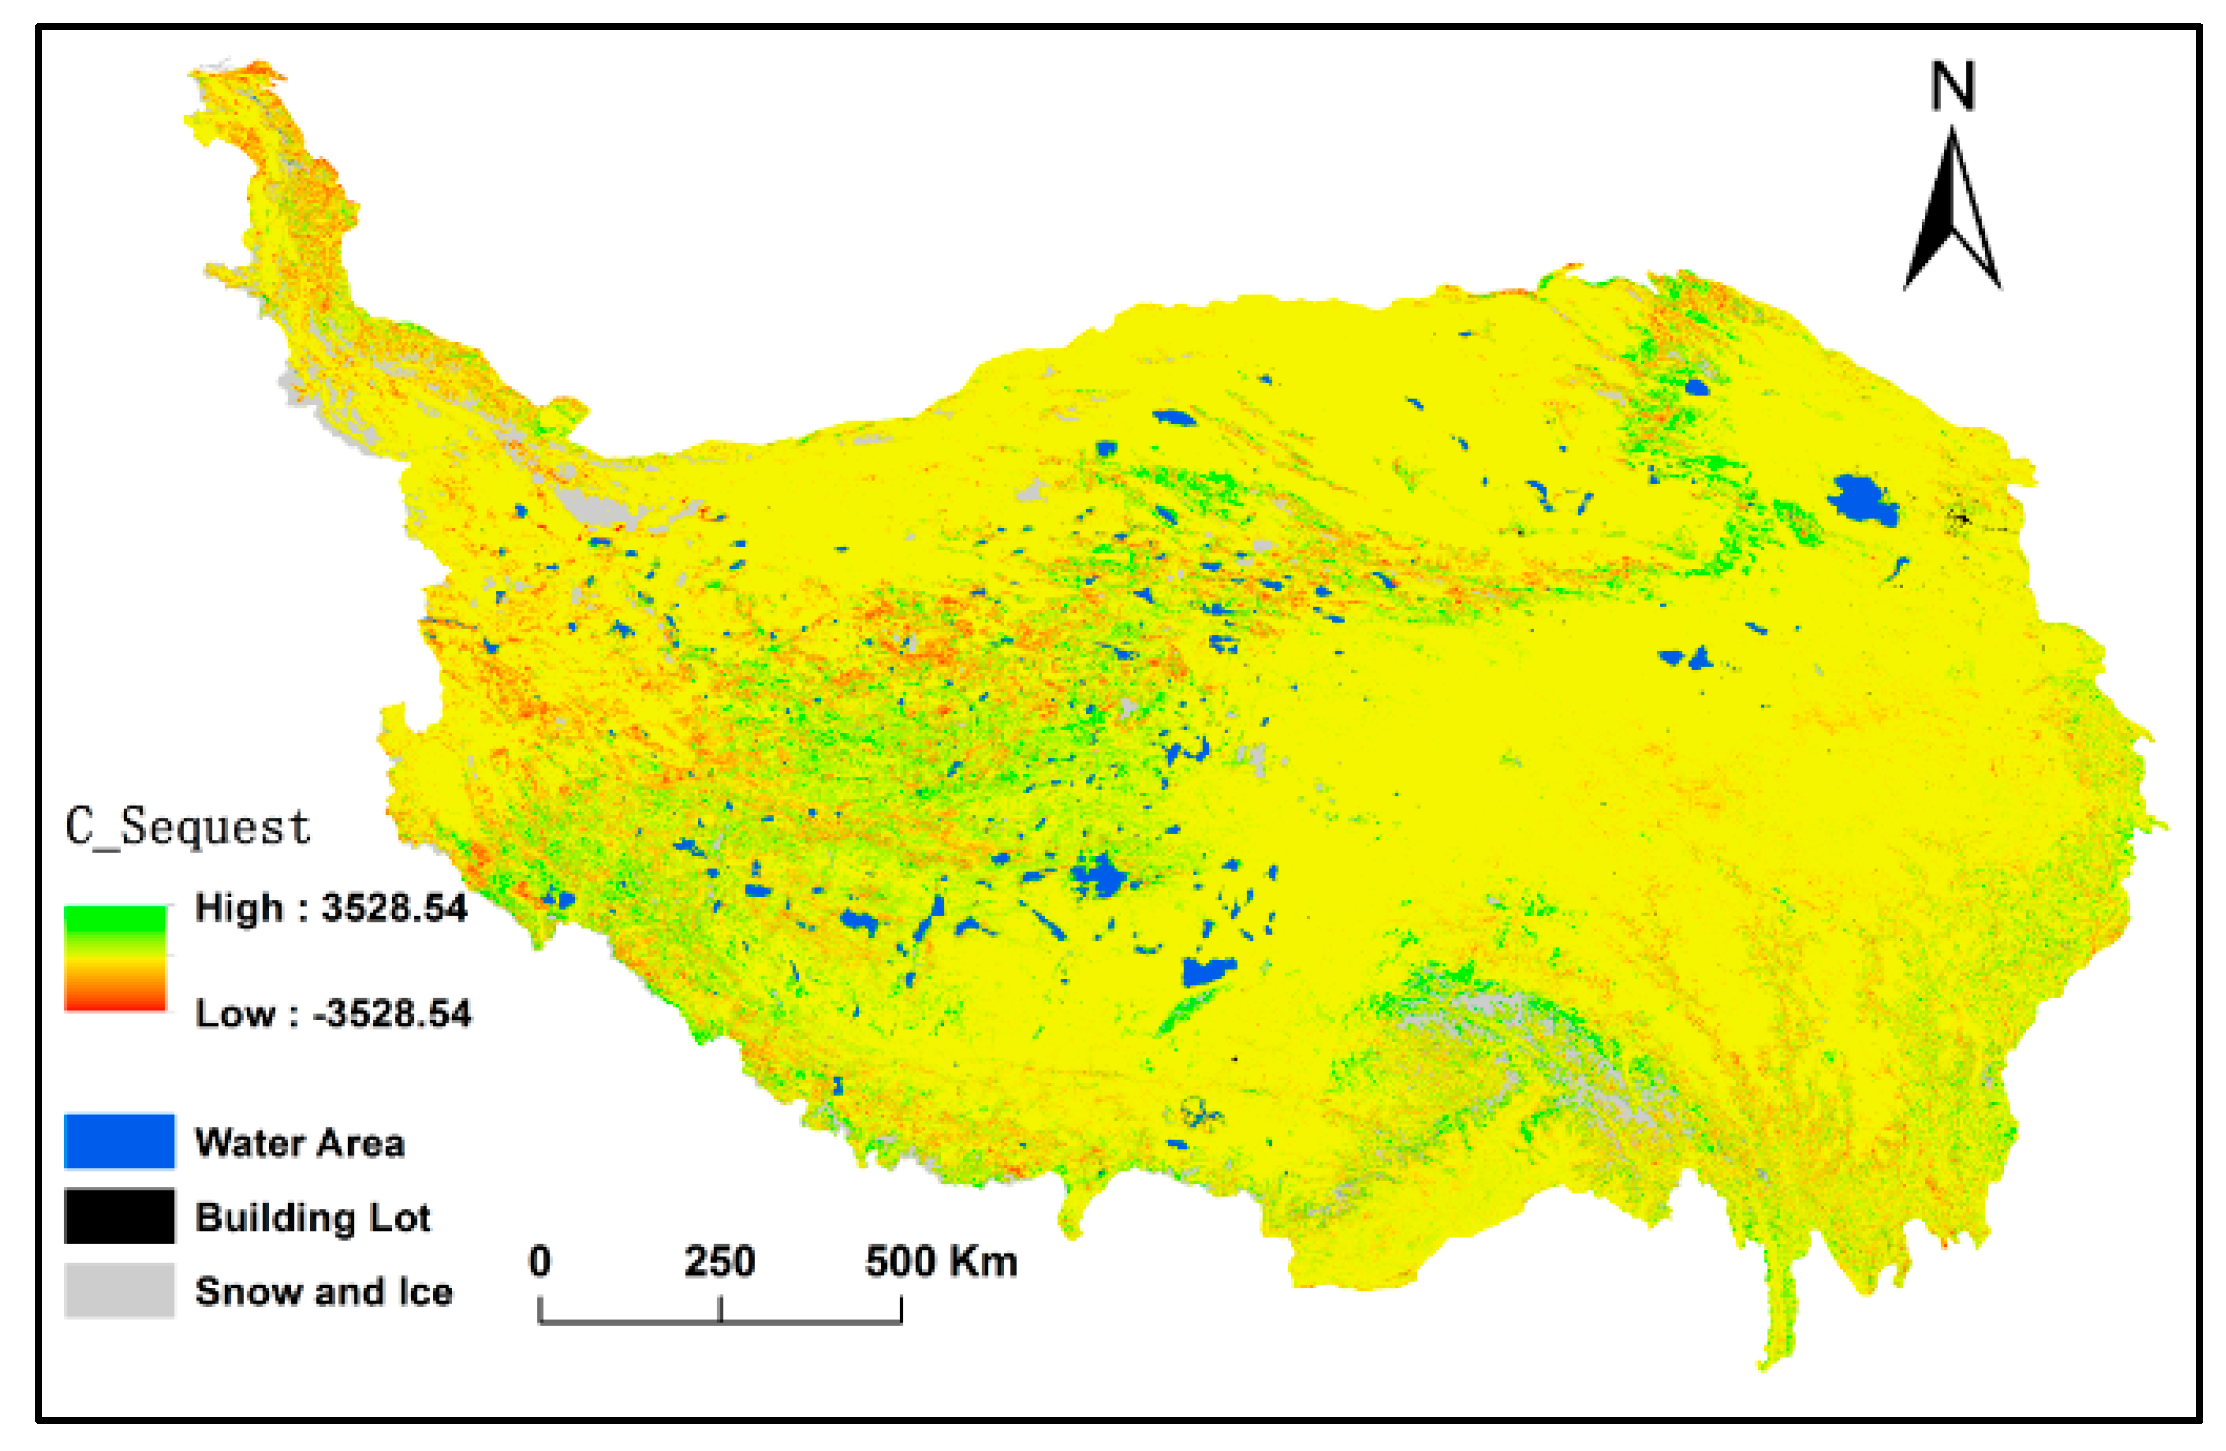
The carbon density in Qinghai-Tibet Plateau increased considerably during 2001–2010 in areas such as grassland and woodland, thickets, and sparse vegetation, whereas it decreased more in areas with lower carbon density. Over ten years, changes in the cover of the Qinghai-Tibet Plateau helped increase the carbon storage. If we assume that the carbon density of each land cover type is constant and assume that only changes in land cover type induce changes in carbon storage, carbon storage increased in the Qinghai-Tibet Plateau during 2001–2010, and the land cover change contributed 116 million tons of carbon with a carbon storage rate of 13.8% (Figure 4).
3.4. Changes in Carbon Density as a Function of Carbon Storage
Carbon density in Qinghai-Tibet Plateau decreased during 2001–2010 (Table 3). The average carbon densities in the area in 2001, 2005 and 2010 were 97 t C/ha, 96 t C/ha and 95 t C/ha, respectively. With respect to classes (Table 2), carbon density is high in the forests, thickets, grasslands, wetlands and crop areas of the Qinghai-Tibet Plateau, whereas it is low in the bare land and sparse vegetation areas.
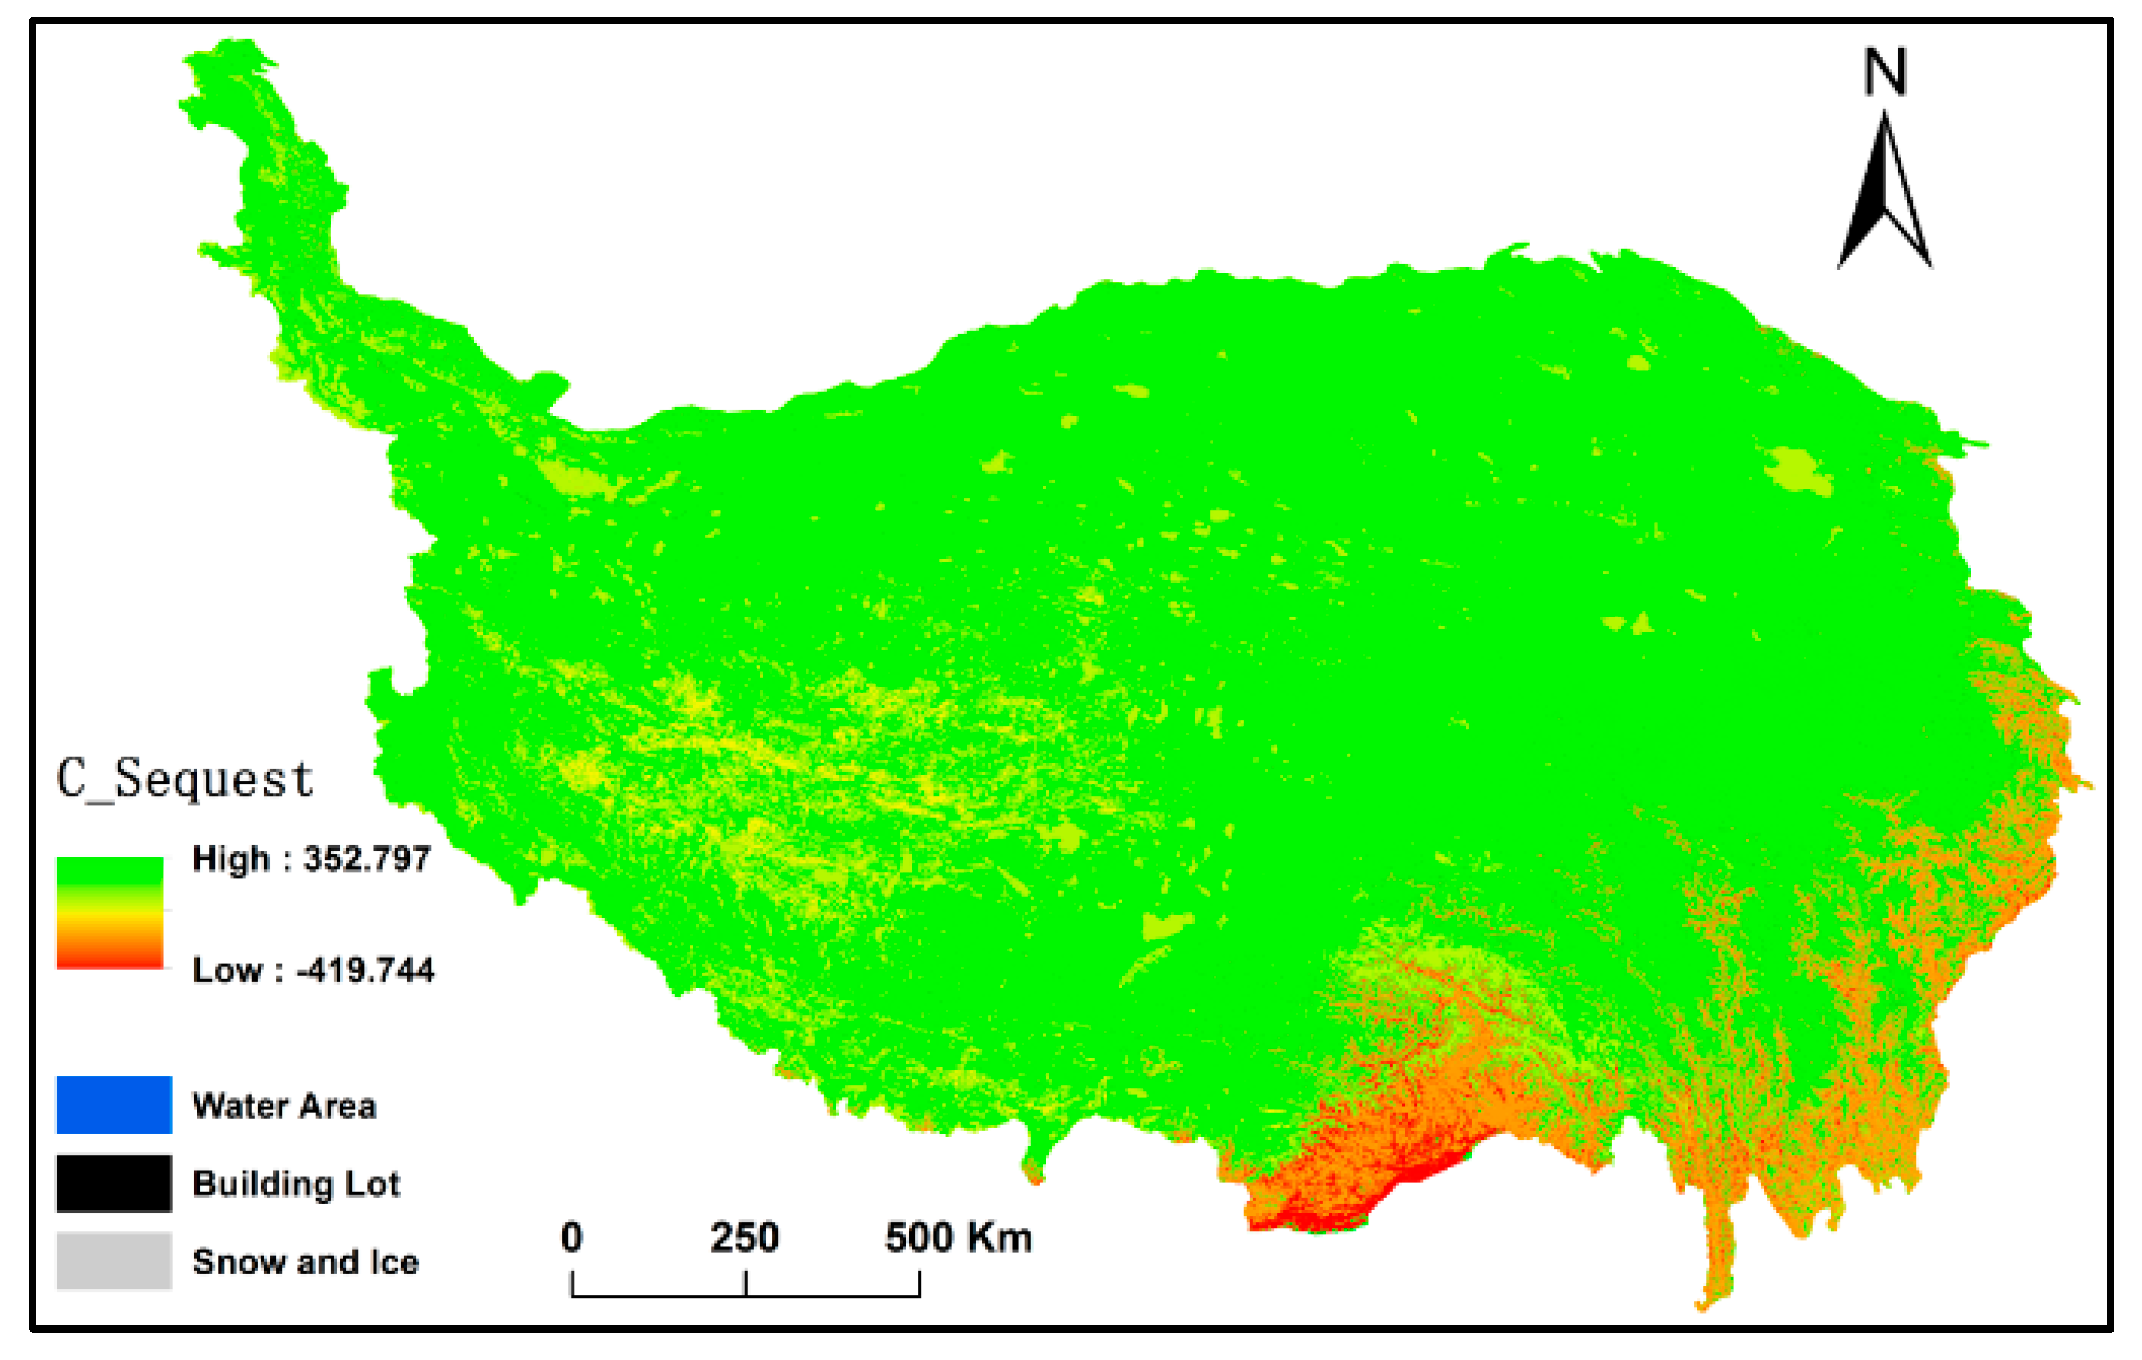
Over the last 10 years, the carbon density decreased in classes with high carbon density (e.g., broad-leaved forests, deciduous evergreen needles, mixed forests, thickets, wetlands, and needles), and the carbon density increased significantly in areas with lower carbon density (e.g., grassland and sparse vegetation areas). Assuming that the land cover types are stable and that only changes in carbon density induce changes in the storage of carbon, the change of carbon density of the Qinghai-Tibet Plateau during 2001–2010 yielded an increased volume of 722 million tons of carbon, and the contribution rate of changes in carbon density to carbon storage was 86.18% (Figure 5).
3.5. The Effects of the “Grass Land Fencing and Dunging Project” on Carbon Storage
The influence of fencing and dung on carbon storage is positive, which has been shown by many scholars. The geographical research station of the Chinese Academy of Sciences in the northern Qinghai-Tibet Plateau grassland ecosystem, which encompasses a small region of alpine meadow grazing grass on the floor and a 15 m × 15 m survey sample layout. In July 2012, fencing was installed for revegetation; inside the fencing, two different measurements were implemented: both fence and dung and fence without dung. This combination was repeated three times. A grazing area was located outside the fenced area.
In mid-July 2013 and mid-July 2014, grassland biomass was also investigated. In each sample area, aboveground biomass samples were randomly selected within 30 cm of where the dung was applied; an area of 25 cm × 25 cm was used to collect the grass samples, and each sample was repeated three times. Thus, six fence and dung biomass samples and six fences without dung biomass samples were collected inside the fence, and six free-grazing biomass samples were collected outside the fence. Biomass samples were also obtained for areas that were mowed, cleaned, and dried; then, their aboveground net primary production (ANPP) was acquired in a precision of 0.01 g (Guangzheng YP - B electronic scale, Shanghai, China, 0.01 g). The samples were analyzed to determine the effects of grassland biomass in response to fencing and dung application.
In 2013 and 2014, soil samples were investigated. Soil was sampled by digging to a depth of 20 cm using an auger borer with a 3.5-cm inside diameter. In mid-July 2013 and mid-July 2014, six fence and dung samples and six fence without dung samples were collected inside the fence, and six free-grazing samples were collected outside the fence. These samples were sent to the laboratory to analyze the effects of the different treatments on biomass and soil organic matter. The soil samples were naturally dried and screened using a 2-mm sieve. Soil organic matter (SOM) was measured via potassium dichromate titration.
The dung samples collected from the fenced region were subjected to different types of processing, including a 0.05-level difference significance test and analyses performed after one and two years following the installation of fencing for nurture. Additionally, the dung decomposition of SOM and the contributions of biomass were analyzed using SPSS 21.0.
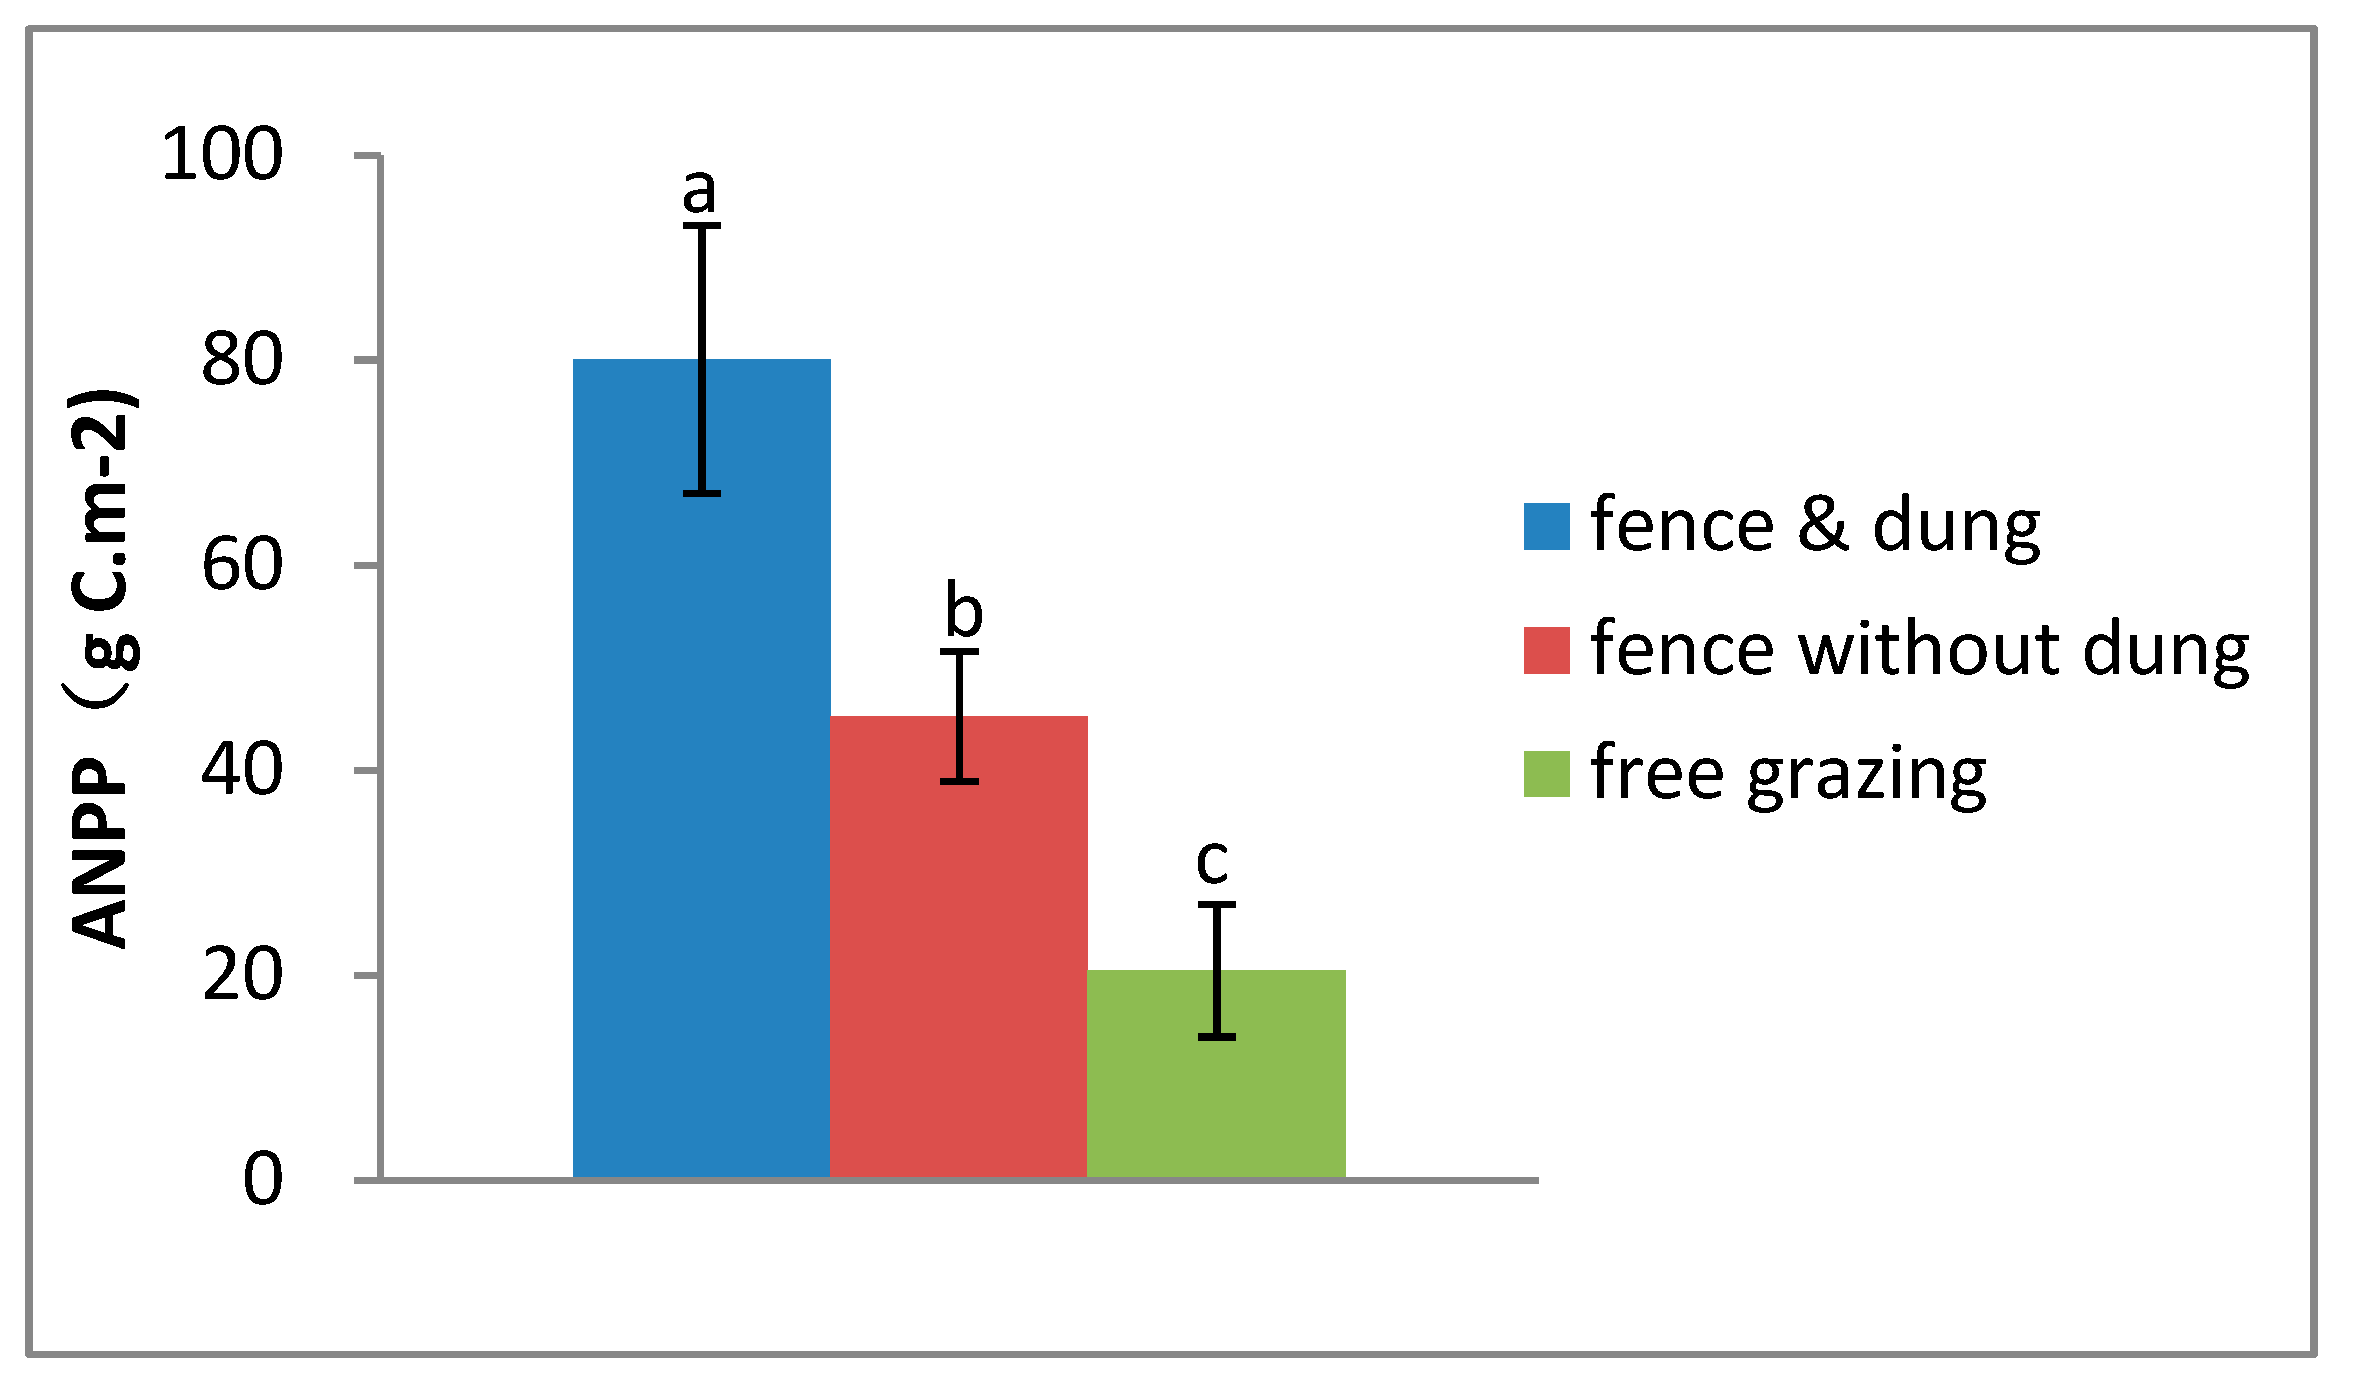
This study aimed to analyze the influence of fences and dung droppings on SOM and ANPP; samples were subjected to three types of treatment (i.e., fence and dung, fence without dung and free grazing). The analysis of the samples in 2013 revealed significant differences between the soil organic matter of the fences and dung, the fences without dung, and the free-grazing samples. The three types of treatment significantly affected ANPP (p = 0.000): fence and dung > fence without dung > free grazing. The ANPP values of the fence and dung and free-grazing samples had the highest significance (p = 0.000); the fence and dung and fence without dung values were significant (p = 0.008); and the free grazing and fence without dung values were significant (p = 0.049). It is clear that fencing with dung can increase aboveground biomass; the effects of dung are obvious (Figure 6).
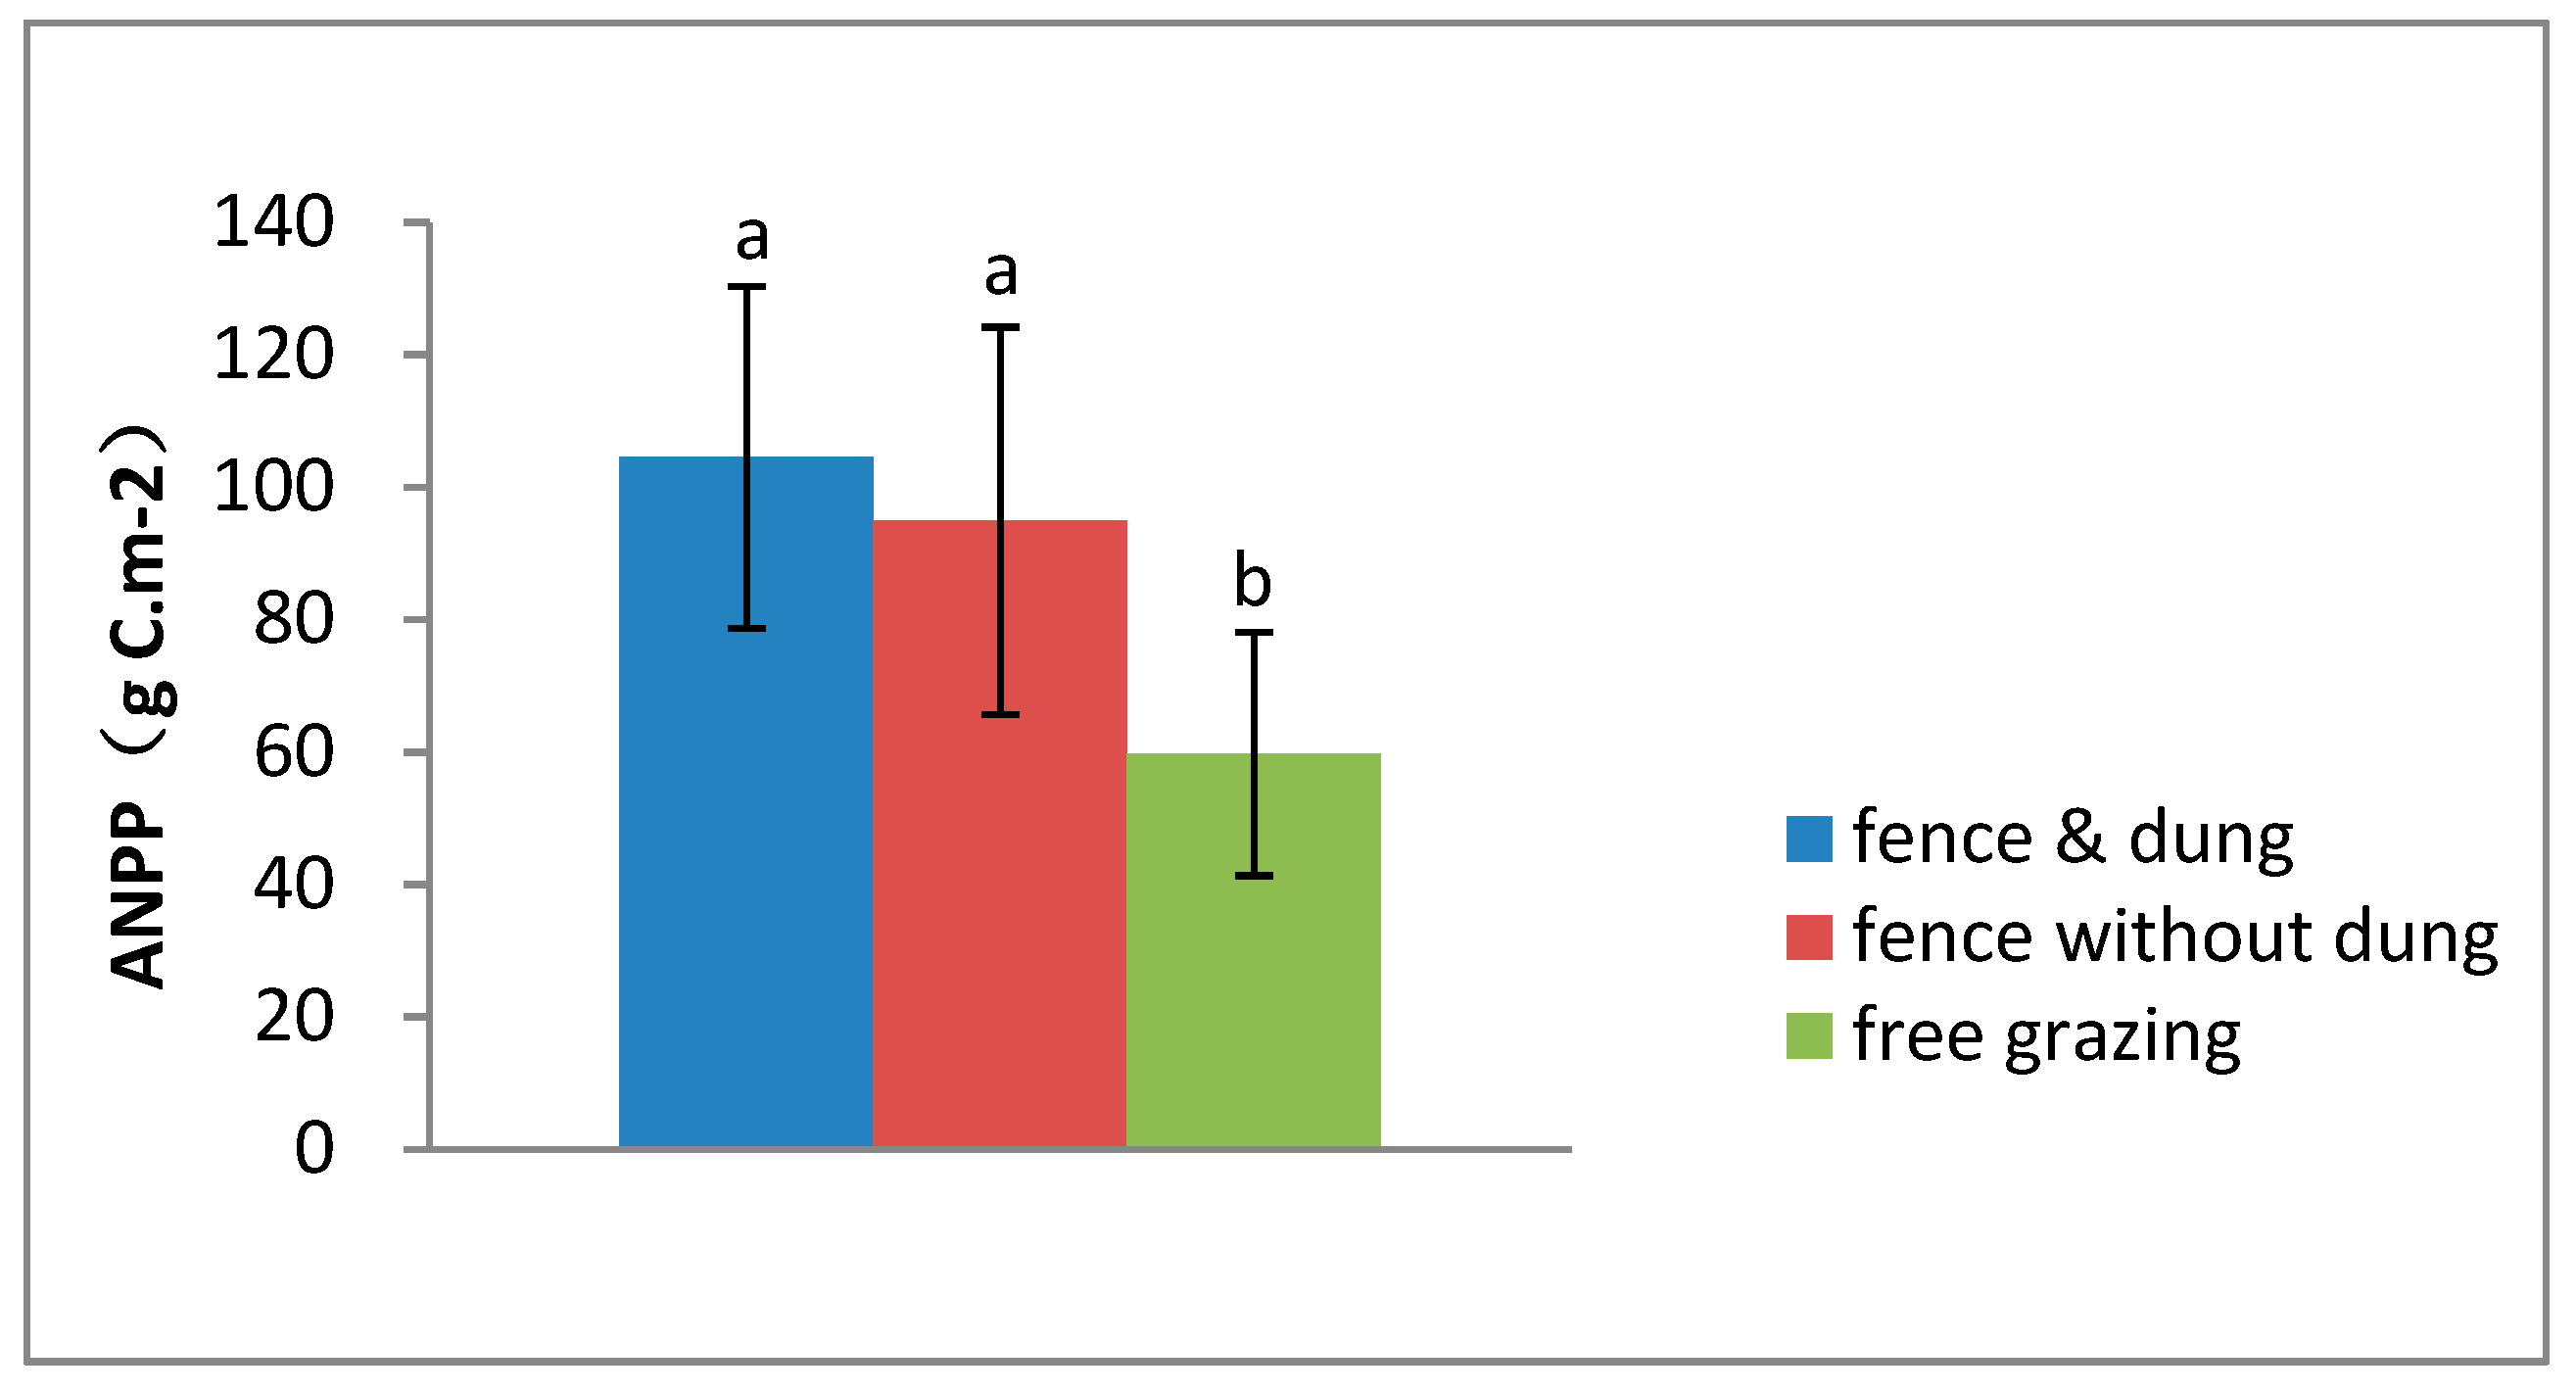
The analysis of the samples in 2014 showed that after two years of natural decomposition of cow dung, the effects of the three types of treatment on ANPP are still significant (p = 0.017): fence and dung > fence without dung > free grazing. The significance of the fence and dung and free grazing (p = 0.007) is the highest; that of the fence without dung and free grazing is the second highest (p = 0.027); and the relationship between fence and dung and fence without dung is not significant. Thus, the effect of ANPP of dung on the ground lasts for no more than three years (Figure 7).
According to the laboratory analysis of the soil samples, SOM increased, which was associated with a restoration effort (free grazing < fence without dung < fence and dung), although the differences were not significant (p > 0.05) among the three treatments in 2013 and 2014. SOM increased in the last year for all three treatments. In 2013, fence and dung, fence without dung, and free-grazing SOM were 70.04, 67.53, and 61.42 g/kg, respectively, and in 2014, they were 70.40, 77.22, and 75.67 g/kg, respectively (Table 4). With the improvement in SOM, soil carbon density also increased, and the total carbon storage increased. Fence and dung contributed to carbon storage.
Three years after the fence was closed, the ground net primary productivity increased each year, and the net primary productivity inside the closed fence was significantly higher than that of free grazing areas. Enclosing grassland after a lack of grazing interference caused the ground biomass to increase significantly. Thus, fencing and returning manure to increase carbon storage have positive effects. Although a grazing ban was first implemented in China in 2003, data were available only by the end of 2010. After cultivating, grassland biomass and coverage inside the fence area will increase year by year. According to the data presented by Li Wenhua and colleagues [56], the ecological construction in Qinghai-Tibet Plateau encompasses a wide range of enclosures (Table 5) [56]. The table shows that about 10% of the grass land were fenced, but more area need to be preserved.
The fence data collected during 2001–2010 indicate that the soil carbon density of the entire Qinghai-Tibet Plateau grassland increased, as its soil carbon sequestration ability also increased. The soil carbon in woodlands increased by 85 million tons; grassland soil carbon increased by 722 million tons. Soil carbon in permanent wetlands and bare land/sparse vegetation areas increased by 101 and 222 million tons, respectively. Soil carbon in irrigation areas, crops, and inlaid natural vegetation areas all decreased, by 246, 135 and 17 million tons, respectively. From 2001 to 2010, the soil carbon volume of the Qinghai-Tibet Plateau increased by 732 million tons.
4. Discussion and Conclusions
Land use/land cover is related to carbon storage, which is considered to be the most complex issue [38,57,58,59,60,61], and changes in land use/land cover have an intricate influence on the ecological system.
In the early stages, no large-scale and continuous monitoring data were available, so the study used MODIS MCD12Q1 of land use and MODND1M of NDVI in 2001, 2005 and 2010 as representative patterns for evaluation. However, the data processing and spatial resolution may induce uncertainty. In the context of the regression model, parameter inversion comes from remote sensing data and this process may lead to a series of extended uncertainty in quantitative assessments of the impacts of land use/land cover on carbon stocks. In addition, InVEST model cannot simulate the changes in all substances and energy in the ecosystem caused by LUCC. Because of regional diversity, soil sampling points and biomass sampling points may have spatial differences. Further, due to the difference of regional geographic factors, the carbon content in accordance with the 0.47 RSRs may increase the simulation uncertainty. In addition, based on the three-year enclosure experiment, fence time and regional factors can also cause uncertainty in the simulation. The sources of uncertainty can be summarized as follows:
- (1)
- The accuracy of the land use/land cover and NDVI data, with a spatial resolution of 1 km × 1 km, can be improved by improving the image quality and the spatial resolution.
- (2)
- Existing data on carbon pool parameters, such as biomass and soil organic carbon, have been obtained only during the 2000s and have low spatial resolution. During statistical analysis, the poor coupling of carbon stock parameters and NDVI data restricted the accuracy of the regression model. In the future, we expect to obtain higher-resolution biomass data and soil organic carbon products. In addition, biomass and soil organic carbon can be modeled as single regression factors using NDVI and thus expanded from the NPP binary to increase the amount of information that can be obtained. In China, we have made achievements in defining the ecological function areas and implementing the ecological protection and construction in Qinghai-Tibet Plateau, but ecological barriers remain.
- (3)
- The InVEST model does not simulate the impact of LUCC-induced carbon cycle changes on carbon storage. This situation may directly impact the accurate estimation of the SOC storage capacity, thus affecting the speed of carbon emissions or absorption.
- (4)
- The InVEST model does not consider changes in the physical structure of the soil and the ecosystem process, which has a great impact on the estimation of SOC. This factor leads to a certain degree of uncertainty in the simulation of the SOC pool.
- (5)
- The problems noted above exist in the process of simulation; our simulation involves some parameters and variables by default. Although some of the parameters were obtained through the field investigation or parametric inversion and through the precision verification, because of regional differences and representativeness of the sampling, the parameter accuracy can influence the simulation results, and the ground carbon flux is not widely used.
In the study, the storage of carbon in Qinghai-Tibet Plateau increased during 2001–2010. The volumes of the Qinghai-Tibet Plateau carbon stock in 2001, 2005 and 2010 were 182, 187, and 192 billion t/C, respectively, thus representing a total increase of 10 billion t/C. The Qinghai-Tibet Plateau features complex terrain and diverse climate conditions; ecological climate factors vary over horizontal and vertical spatial scales, thus influencing the horizontal and vertical distributions of the land cover. This relationship results in the horizontal distribution of carbon storage in Qinghai-Tibet Plateau. The carbon storage decreased in the southern and southeastern regions of the Qinghai-Tibet Plateau, while it increased in the central and western regions. Changes in land use contributed to 13.82% of carbon storage, whereas changes in carbon density contributed to 86.18% of carbon storage.
The combination of fencing and dung can clearly increase the effects of carbon storage. Appropriate fencing and dung often cause an increase in grassland biomass and in the concentration of organic matter and chemicals from excreta and other associated consequences [62]. Long-term heavy grazing was reported to decrease biomass [63]. Returning cow dung can be used to improve grassland soil, promote the circulation of grassland ecosystem material and increase grassland biomass. This process can finally achieve grass balance and the sustainable development of ecosystem service function.
In China, achievements have been made in defining ecological function areas and establishing ecological protection and construction in Qinghai-Tibet Plateau, but there is still a large gap in terms of the importance of the ecological barrier. Establishing the carbon sink function of the Qinghai-Tibet Plateau can be used to determine the regional forest and grassland carbon sink baseline, as well as to implement institutional arrangements to form a long-term, stable carbon trading mechanism to ensure the future ecological protection and construction fund for the Qinghai-Tibet Plateau region. This support can further improve the ecological function and strengthening the role of the area as an ecological barrier in China. At the same time, the carbon sink function and the construction of ecological protection, especially the latter, can improve the carbon sink increment in the region and represents a new way to promote economic growth and employment.
Author Contributions
All of the authors contributed to the work in the paper. Z.Z. and G.L. designed the research and wrote the paper. G.L., Z.X. and Y.X. provided advice and suggestions. N.M. and Z.X. collected and preprocessed the data. N.M., Y.X. and Y.L. improved language.
Acknowledgments
This research was supported in part by the National Natural Science Foundation of China under the projects “Impact of Climate and Land Use Change on Water Quantity and Water Quality in the Mun River Basin (No. 41661144030)”; “Study on Water Resources Change and Adaptive Management in the Great Mekong River Basin (No. 41561144012)”; Guangdong Innovative and Entrepreneurial Research Team Program, 2016ZT06D336; and GDAS’ Special Project of Science and Technology Development, 2017GDASCX-0101.
Conflicts of Interest
The authors declare no conflict of interest.
References
- Fang, J.; Zhu, J.; Wang, S.; Yue, C.; Shen, H. Global Warming, Human-Induced Carbon Emissions, and Their Uncertainties. Sci. China Earth Sci. 2011, 54, 1458–1468. [Google Scholar] [CrossRef]
- Jagdish, J.; Erayya; Makanur, B.; Managanvi, K. Prospects for Mitigation of Greenhouse Gas Emission: In Context to Agriculture and Climate Change. Environ. Ecol. 2013, 31, 551–557. [Google Scholar]
- Peck, S.C.; Teisberg, T.J. Optimal Carbon Emissions Trajectories When Damages Depend on the Rate or Level of Global Warming. Clim. Chang. 1994, 28, 289–314. [Google Scholar] [CrossRef]
- Chen, G.S.; Tian, H.Q. Land Use/Cover Change Effects on Carbon Cycling in Terrestrial Ecosystems. J. Plant Ecol. 2007, 31, 189–204. [Google Scholar]
- Dai, J.; Ge, Q.; Zhang, X. Land-Use/Land-Cover Change in East China and Its Possible Effects on Carbon Cycle of Terrestrial Ecosystems in the Last 20 Years. In Ecosystems Dynamics, Ecosystem-Society Interactions, and Remote Sensing Applications for Semi-Arid and Arid Land; International Society for Optics and Photonics: Washington, DC, USA, 2003; Volume 4890. [Google Scholar]
- Hayes, D.J.; Mcguire, A.D.; Kicklighter, D.W.; Burnside, T.J.; Melillo, J.M. The Effects of Land Cover and Land Use Change on the Contemporary Carbon Balance of the Arctic and Boreal Terrestrial Ecosystems of Northern Eurasia; Springer: Dordrecht, The Netherlands, 2011; pp. 109–136. [Google Scholar]
- Gr, Y.U.; Zhang, L.M.; Sun, X.M.; Yl, F.U.; Wen, X.F.; Wang, Q.F.; Sg, L.I.; Ren, C.Y.; Song, X.; Liu, Y.F. Environmental Controls Over Carbon Exchange of Three Forest Ecosystems in Eastern China. Glob. Chang. Biol. 2008, 14, 2555–2571. [Google Scholar]
- Wu, H.; Guo, Z.; Peng, C. Land Use Induced Changes of Organic Carbon Storage in Soils of China. Glob. Chang. Biol. 2010, 9, 305–315. [Google Scholar] [CrossRef]
- Zhang, M.; Yu, G.R.; Zhang, L.M.; Sun, X.M.; Wen, X.F.; Han, S.J.; Yan, J.H. Impact of Cloudiness on Net Ecosystem Exchange of Carbon Dioxide in Different Types of Forest Ecosystems in China. Biogeosciences Discuss. 2010, 7, 711–722. [Google Scholar] [CrossRef]
- Wang, S.; Zhou, C.; Li, K.; Zhu, S.; Huang, F. Analysis on Spatial Distribution Characteristics of Soil Organic Carbon Reservoir in China. Acta Geogr. Sin. 2000, 55, 533–544. [Google Scholar]
- Brown, S.; Lugo, A.E. Effects of Forest Clearing and Succession on the Carbon and Nitrogen Content of Soils in Puerto Rico and US Virgin Islands. Plant Soil 1990, 124, 53–64. [Google Scholar] [CrossRef]
- Govender, Y.; Thomlinson, J.R. Changes in Landuse/Landcover Affect Distribution and Habitat of the Land Crab, Cardisoma Guanhumi (Gecarcinidae, Decapoda) in Two Estuaries in Puerto Rico. Caribb. J. Sci. 2016, 46, 258–266. [Google Scholar] [CrossRef]
- Sonnentag, O.; Detto, M.; Runkle, B.; Kelly, M.; Baldocchi, D.D. How Do Land Management Practices Affect Net Ecosystem CO2 Exchange of An Invasive Plant Infestation? AGU Fall Meet. 2009, CD004639. [Google Scholar]
- Mongelli, I.; Tassielli, G.; Notarnicola, B. Global Warming Agreements, International Trade and Energy/Carbon Embodiments: An Input–Output Approach to the Italian Case. Energy Policy 2006, 34, 88–100. [Google Scholar] [CrossRef]
- Hu, J. Carbon Storage of Artificial Forests in Rehabilitated Lands in the Upper Reaches of the Yellow River. Front. For. China 2005, 1, 268–276. [Google Scholar] [CrossRef]
- Wu, J.G.; Zhang, X.Q.; Xu, D.Y. The Assessment of the Impacts of Land Use Change on the Ecosystem Carbon Sink. Eng. Sci. 2003, 5, 65–71. [Google Scholar]
- Nelson, E.; Mendoza, G.; Regetz, J.; Polasky, S.; Tallis, H.; Cameron, D.R.; Chan, K.M.A.; Daily, G.C.; Goldstein, J.; Kareiva, P.M. Modeling Multiple Ecosystem Services, Biodiversity Conservation, Commodity Production, and Tradeoffs at Landscape Scales. Front. Ecol. Environ. 2009, 7, 4–11. [Google Scholar] [CrossRef]
- Jing, T.F.; Yu, Y.H. Highland Lakes Ecosystem Services Evaluation System Based Invest Mode. Ecol. Econ. 2016, 32, 180–185. [Google Scholar]
- Wu, P.J.; Liu, X.P.; Xia, L.I.; Chen, Y.M. Impact of Urban Expansion on Carbon Storage in Terrestrial Ecosystems Based on Invest Model and CA: A Case Study of Guangdong Province, China. Geogr. Geo-Inf. Sci. 2016, 32, 22–36. [Google Scholar]
- He, C.; Zhang, D.; Huang, Q.; Zhao, Y. Assessing the Potential Impacts of Urban Expansion on Regional Carbon Storage By Linking the LUSD-Urban and Invest Models. Environ. Model. Soft. 2016, 75, 44–58. [Google Scholar] [CrossRef]
- Yan, C.; Fei, Q.; Lei, J. Effects of Land Use Pattern Change on Regional Scale Habitat Quality Based on Invest Model—A Case Study in Beijing. Acta Sci. Nat. Univ. Pekin. 2016, 52, 553–562. [Google Scholar]
- Zhang, C.; Li, W.; Zhang, B.; Liu, M. Water Yield of Xitiaoxi River Basin Based on Invest Modeling. J. Resour. Ecol. 2012, 3, 50–54. [Google Scholar]
- Name, L.; Name, F.; Training, O.; Training, P.; Darin, C.; Training, R.O.; Kimberly, M.; Deepa, G.; Board, E.; Principal, E. InVEST Users Guide; The Natural Capital Project: Stanford, CA, USA, 2014; pp. 82–95. [Google Scholar]
- Bolin, B. Changes of Land Biota and Their Importance for the Carbon Cycle. Science 1977, 196, 613–615. [Google Scholar] [CrossRef] [PubMed]
- Bohn, H.L. Estimate of Organic Carbon in World Soils. Soil Sci. Soc. Am. J. 1982, 40, 468–470. [Google Scholar] [CrossRef]
- Wang, S.Q.; Zhou, C.H.; Xia, J.; Chenghu, Z.; Jie, X. The latest tendency on carbon cycle research from usgcrp. Adv. Earth Sci. 2000, 15, 592–597. [Google Scholar]
- Liu, L.H.; Xing, S.H.; Gao, C.F.; Cui, J.C.; Wei, D.L.; Hu, Z.H.; Lu, C. The Research Progress, Problems and Prospects of Soil Carbon Storage at Home and Aboard. Chin. J. Soil Sci. 2009, 40, 697–701. [Google Scholar]
- Post, W.M.; Emanuel, W.R.; Zinke, P.J.; Stangenberger, A.G. Soil Carbon Pools and World Life Zones. Nature 1982, 298, 156–159. [Google Scholar] [CrossRef]
- Schlesinger, W.H. Evidence from Chronosequence Studies for a Low Carbon-Storage Potential of Soils. Nature 1990, 348, 232–234. [Google Scholar] [CrossRef]
- Cheng, Q.Q.; Shen, C.D.; Yi, W.X.; Peng, S.L. Progresses in soil carbon cycle researches. Adv. Earth Sci. 1998, 13, 555–563. [Google Scholar]
- Wang, Y.X.; Zhao, S.D. Research State of Soil Carbon Cycling in Terrestrial Ecosystem. Chin. J. Ecol. 1999, 18, 29–35. [Google Scholar]
- Bolin, B.; Degens, E.T.; Duvignesd, P. Land Biota and Their Importance for the Carbon Cycle. Soope 1979, 13, 51–56. [Google Scholar] [CrossRef] [PubMed]
- Franzmeier, D.P.; Lemme, G.D.; Miles, R.J. Organic Carbon in Soils of North Central United States. Soil. Soc. Am. J. 1985, 49, 702–708. [Google Scholar] [CrossRef]
- Parton, W.J.; Schimel, D.S.; Cole, C.V.; Ojima, D.S. Analysis of Factors Controlling Soil Organic Matter Levels in Great Plains Grasslands1. Soil Sci. Soc. Am. J. 1987, 51, 1173–1179. [Google Scholar] [CrossRef]
- Feng, J.; Hao, Y.; Zhang, Q.G. Soil Organic Carbon and Its Influencing Factors. Soils 2000, 32, 11–17. [Google Scholar]
- Eswaran, H.; Berg, E.V.D.; Reich, P. Organic Carbon in Soils of the World. Soil Sci. Soc. Am. J. 1993, 90, 269–273. [Google Scholar] [CrossRef]
- Lal, R. The Potential of U.S. Cropland to Sequester Carbon and Mitigate the Greenhouse Effect; Lewis Publishers: New York, NY, USA, 1998. [Google Scholar]
- Houghton, R.A.; Hackler, J.L.; Lawrence, K.T. The U.S. Carbon Budget: Contributions from Land-Use Change. Science 1999, 285, 574. [Google Scholar] [CrossRef] [PubMed]
- Caspersen, J.P.; Pacala, S.W.; Jenkins, J.C.; Hurtt, G.C.; Moorcroft, P.R.; Birdsey, R.A. Contributions of Land-Use History to Carbon Accumulation in U.S. Forests. Science 2000, 290, 1148–1151. [Google Scholar] [CrossRef] [PubMed]
- Oren, R.; Ellsworth, D.S.; Johnsen, K.H.; Phillips, N.; Ewers, B.E.; Maier, C.; Schafer, K.V.; Mccarthy, H.; Hendrey, G.; Mcnulty, S.G.; et al. Soil Fertility Limits Carbon Sequestration by Forest Ecosystems in a CO2-Enriched Atmosphere. Nature 2001, 411, 469–472. [Google Scholar] [CrossRef] [PubMed]
- Wang, S.Q.; Zhou, C.H. Estimating Soil Carbon Reservior of Terrestrial Ecosystem in China. Geogr. Res. 1999, 18, 349–356. [Google Scholar]
- Liu, J.Y.; Wang, S.Q.; Chen, J.M.; Liu, M.L.; Zhuang, D.F. Storages of Soil Organic Carbon and Nitrogen and Land Use Changes in China: 1990–2000. Acta Geogr. Sin. 2004, 59, 483–496. [Google Scholar]
- Chen, C.G.; Peng, H. Standing Crops and Productivity of the Major Forest-Types at the Huoditang Forest Region of the Qingling Mountains. J. Northwest For. Coll. 1996, 11, 92–102. [Google Scholar]
- Wang, Y.F.; Chen, Z.Z. Distribution of soil organic carbon in the major grasslands of xilinguole, inner mongolia, china. Chin. J. Plant Ecol. 1998, 22, 545–551. [Google Scholar]
- Yuan, F.; Zhao, X.M.; Le, L.H.; Jia, X.M. Organic Carbon Reserves of Topsoil and Spatial Distribution in Jiangxi Province. Ecol. Environ. 2008, 17, 268–272. [Google Scholar]
- Zhao, R.; Huang, X.; Zhong, T.; Chuai, X. Carbon Effect Evaluation and Low-Carbon Optimization of Regional Land Use. Trans. Chin. Soc. Agric. Eng. 2013, 29, 220–229. [Google Scholar]
- Gonzalez, P.; Asner, G.P.; Battles, J.J.; Lefsky, M.A.; Waring, K.M.; Palace, M. Forest Carbon Densities and Uncertainties from Lidar, Quickbird, and Field Measurements in California. Remote Sens. Environ. 2010, 114, 1561–1575. [Google Scholar] [CrossRef]
- Boyd, D.S.; Foody, G.M. An Overview of Recent Remote Sensing and GIS Based Research in Ecological Informatics. Ecol. Inf. 2011, 6, 25–36. [Google Scholar] [CrossRef]
- Xu, S.J.; Zeng, B.; Su, X.L.; Lei, S.T.; Liu, J.H. Spatial Distribution of Vegetation and Carbon Density in Jinyun Mountain Nature Reserve Based on RS/GIS. Acta Ecol. Sin. 2012, 32, 2174–2184. [Google Scholar]
- Zheng, Y.R.; Zhou, G.S. A forest vegetation NPP model based on NDVI. Chin. J. Plant Ecol. 2000, 24, 9–12. [Google Scholar]
- Dong, J.; Kaufmann, R.K.; Myneni, R.B.; Tucker, C.J.; Kauppi, P.E.; Liski, J.; Buermann, W.; Alexeyev, V.; Hughes, M.K. Remote Sensing Estimates of Boreal and Temperate Forest Woody Biomass: Carbon Pools, Sources, and Sinks. Remote Sens. Environ. 2003, 84, 393–410. [Google Scholar] [CrossRef]
- Gluck, M.; Banko, G.; Vrzal, W. Harnessing Remote Sensing to Accomplish Full Carbon Accounting: Workshop Report; Working Papers; IIASA Interim Report: Laxenburg, Austria, 2000. [Google Scholar]
- Wang, Q.; Wang, K.R.; Li, S.K.; Xiao, C.H.; Li, J.; Dai, J.G.; Fang, L.F.; Chen, B.; Wang, F.Y. Study on Evaluation Methods for Soil Fertility in Oasis Cotton Field Based on the Normalized Difference Vegetation Index (NDVI). Cotton Sci. 2013, 25, 148–153. [Google Scholar]
- Hong, Z. Distribution Characteristics of Soil Raganic Carbon and Its Composition under Erosion Enviroment in Different Vegetable Regions of Loess Plateau; Northwest A&F University: Yangling, China, 2013. [Google Scholar]
- Sharp, R.; Tallis, H.T.; Ricketts, T.; Guerry, A.D.; Wood, S.A.; Chaplin-Kramer, R.; Nelson, E.; Ennaanay, D.; Wolny, S.; Olwero, N.; et al. InVEST 3.1.2 User’s Guide; The Natural Capital Project: Stanford, CA, USA, 2015. [Google Scholar]
- Li, W.H.; Zhao, X.Q.; Zhang, X.Z.; Shi, P.L.; Wang, X.D.; Zhao, L. Change Mechanism in Main Ecosystems and Its Effect of Carbon Source/Sink Function on the Qinghai-Tibetan Plateau. Chin. J. Nat. 2013, 35, 172–178. [Google Scholar]
- Houghton, R.A. Land—Use Change and the Carbon Cycle. Glob. Chang. Biol. 1995, 1, 275–287. [Google Scholar] [CrossRef]
- Houghton, R.A. Aboveground Forest Biomass and the Global Carbon Balance. Glob. Chang. Biol. 2005, 11, 945–958. [Google Scholar] [CrossRef]
- Houghton, R.A. Revised Estimates of the Annual Net Flux of Carbon to the Atmosphere from Changes in Land Use and Land Management 1850–2000. Tellus 2010, 55, 378–390. [Google Scholar]
- Houghton, R.A.; Lawrence, K.T.; Hackler, J.L.; Brown, S. The Spatial Distribution of Forest Biomass in the Brazilian Amazon: A Comparison of Estimates. Glob. Chang. Biol. 2001, 7, 731–746. [Google Scholar] [CrossRef]
- Houghton, R.A.; Skole, D.L.; Nobre, C.A.; Hackler, J.L.; Lawrence, K.T.; Chomentowski, W.H. Annual Fluxes of Carbon from Deforestation and Regrowth in the Brazilianamazon. Nature 2000, 403, 301–304. [Google Scholar] [CrossRef] [PubMed]
- Brown, J.H.; Mcdonald, W. Livestock Grazing and Conservation on Southwestern Rangelands. Conserv. Biol. 1995, 9, 1644–1647. [Google Scholar] [CrossRef]
- Kawanabe, S.; Nan, Y.; Oshida, T.; Kou, Z.; Jiang, D.; Oikawa Takada, N.; Mukaiyama, S. Degradation of Grassland in Keerqin Sandland, Inner Mongolia [Neimenggu], China. J. Jpn. Soc. Grassl. Sci. 1998, 44, 109–114. [Google Scholar]
Figure 1.
BIOMASS-NDVI (A) and SOC-NDVI (B) regression analyses.

Figure 2.
Spatial distributions of carbon storage in Qinghai-Tibet Plateau in 2001, 2005 and 2010. Note: unit: t/C grid, (463.3 m × 463.3 m)/grid.
Figure 2.
Spatial distributions of carbon storage in Qinghai-Tibet Plateau in 2001, 2005 and 2010. Note: unit: t/C grid, (463.3 m × 463.3 m)/grid.

Figure 3.
Ecological zoning map of the Qinghai-Tibet Plateau.

Figure 4.
Changes in carbon storage with changes in land cover in Tibet during 2001–2010. Note: unit: t/C grid, (463.3 m × 463.3 m)/grid.
Figure 4.
Changes in carbon storage with changes in land cover in Tibet during 2001–2010. Note: unit: t/C grid, (463.3 m × 463.3 m)/grid.

Figure 5.
Carbon storage induced by changes in carbon density in Tibet during 2001–2010. Note: unit: t/C, grid, (463.3 m × 463.3 m)/grid.
Figure 5.
Carbon storage induced by changes in carbon density in Tibet during 2001–2010. Note: unit: t/C, grid, (463.3 m × 463.3 m)/grid.

Figure 6.
Influence of dung on grassland biomass in 2013, two years after the fence was closed. Note: different letters represent different management measures; within the same letters, p < 0.05 represents a significant difference, whereas p > 0.05 represents no significant difference.
Figure 6.
Influence of dung on grassland biomass in 2013, two years after the fence was closed. Note: different letters represent different management measures; within the same letters, p < 0.05 represents a significant difference, whereas p > 0.05 represents no significant difference.

Figure 7.
Influence of dung on grassland biomass in 2014, three years after the fence was closed. Note: different letters represent different management measures; within the same letters, p < 0.05 represents a significant difference, whereas p > 0.05 represents no significant difference.
Figure 7.
Influence of dung on grassland biomass in 2014, three years after the fence was closed. Note: different letters represent different management measures; within the same letters, p < 0.05 represents a significant difference, whereas p > 0.05 represents no significant difference.


Table 1.
Land use areas in Qinghai-Tibet Plateau from 2001 to 2010 (unit: km2).
| Land Use/Cover Types | 2001 | 2005 | 2010 | 2001–2005 | 2005–2010 | 2001–2010 |
|---|---|---|---|---|---|---|
| Water | 33,153 | 35,397 | 35,181 | 2244 | −216 | 2028 |
| Evergreen coniferous forest | 21,637 | 32,390 | 27,286 | 10,753 | −5104 | 5649 |
| Evergreen broad-leaved forest | 12,109 | 17,143 | 15,098 | 5034 | −2045 | 2989 |
| Deciduous coniferous forest | 170 | 187 | 264 | 17 | 77 | 94 |
| Deciduous broad-leaved forest | 2208 | 512 | 380 | −1696 | −132 | −1828 |
| Mixed forests | 148,511 | 119,778 | 151,562 | −28,733 | 31,784 | 3051 |
| Canopy closure brush | 3305 | 982 | 1381 | −2323 | 399 | −1924 |
| Not closed brush | 104,803 | 96,227 | 57,315 | −8576 | −38912 | −47,488 |
| Scrub grassland | 8309 | 5781 | 4159 | −2528 | −1622 | −4150 |
| Savanna | 1187 | 994 | 486 | −193 | −508 | −701 |
| Grassland | 1,377,490 | 1,441,135 | 1,451,672 | 63,645 | 10,537 | 74,182 |
| Permanent wetlands | 134 | 293 | 278 | 159 | −15 | 144 |
| Crops | 10,669 | 5160 | 5966 | −5509 | 806 | −4703 |
| City and built-up area | 952 | 952 | 952 | 0 | 0 | 0 |
| Crops—inlaid natural vegetation | 3935 | 1303 | 1766 | −2632 | 463 | −2169 |
| Ice and snow | 59,226 | 56,665 | 62,963 | −2561 | 6298 | 3737 |
| Bare or sparse vegetation | 847,321 | 820,220 | 818,410 | −27,101 | −1810 | −28,911 |
Table 2.
Biota carbon storage in Qinghai-Tibet Plateau from 2001–2010 (unit: 104 t).
| Biome | 2001 | 2005 | 2010 | 2001–2005 | 2005–2010 | 2001–2010 |
|---|---|---|---|---|---|---|
| Sichuan southwest-Yunnan evergreen broad leaved forest zone | 58799 | 57,028 | 58,457 | −1771 | 1428 | −342 |
| CangDong-Sichuan cold warm coniferous forest biome | 349,693 | 357,709 | 361,833 | 8015 | 4125 | 12,140 |
| Qaidam basin desert biome | 70,960 | 78,642 | 81,975 | 7682 | 3334 | 11,015 |
| River source area- Gannan alpine meadow grassland biome | 444,413 | 462,420 | 465,985 | 18,007 | 3564 | 21,571 |
| Qilian mountain forest and alpine grassland biome | 89,233 | 94,669 | 95154 | 5436 | 485 | 5920 |
| Pamir-Kunlun Mountains-Altun alpine desert grassland biome | 179,891 | 184,208 | 190,381 | 4317 | 6174 | 10,490 |
| Northern Tibet Plateau alpine desert grassland biome | 296,965 | 305,175 | 327,864 | 8211 | 22,689 | 30,899 |
| Alishan geothermal arid desert biome | 32,799 | 32,495 | 34,145 | −304 | 1649 | 1345 |
| South Tibetan alpine meadow grassland biome | 188,280 | 195,688 | 203,986 | 7408 | 8297 | 15,706 |
| Tibetan southeastern tropical rain forest biome | 111,571 | 109,381 | 106,748 | −2190 | −2634 | −4824 |
| A total of | 1,822,605 | 1,877,416 | 1,926,526 | 54,811 | 49,111 | 103,922 |
Table 3.
Carbon density of the land cover types in Qinghai-Tibet Plateau (unit: t/ha).
| Land Use/Cover Types | 2001 | 2005 | 2010 |
|---|---|---|---|
| Water | - | - | - |
| Evergreen coniferous forest | 135 | 130 | 123 |
| Evergreen broad-leaved forest | 164 | 159 | 145 |
| Deciduous coniferous forest | 104 | 81 | 91 |
| Deciduous broad-leaved forest | 154 | 152 | 142 |
| Mixed forests | 158 | 154 | 151 |
| Canopy closure brush | 132 | 125 | 132 |
| Not closed brush | 58 | 52 | 55 |
| Scrub grassland | 126 | 124 | 130 |
| Savanna | 114 | 143 | 130 |
| Grassland | 89 | 93 | 93 |
| Permanent wetlands | 130 | 123 | 113 |
| Crops | 121 | 122 | 129 |
| City and built-up area | - | - | - |
| Crops—inlaid natural vegetation | 135 | 143 | 146 |
| Ice and snow | - | - | - |
| Bare or sparse vegetation | 26 | 27 | 30 |
Table 4.
SOM of threedifferent treatments in 2013 and 2014.
| Factors | Treatments | N | 2013 (g/kg) | 2014 (g/kg) |
|---|---|---|---|---|
| SOM | fence and dung | 6 | 70.04 | 70.40 |
| fence without dung | 6 | 67.53 | 77.22 | |
| free grazing | 6 | 61.42 | 75.67 |
Table 5.
The grassland area and fence engineering area in Qinghai-Tibet Plateau.
| Province | Fence Engineering Area/km2 | Grassland Area/km2 | Percentage |
|---|---|---|---|
| Sichuan | 33,139.63 | 110,323.81 | 30% |
| Xizang | 34,480.00 | 807,710.81 | 4% |
| Qinghai | 63,092.81 | 410,404.19 | 15% |
| Gansu | 16,818.81 | 90,680.63 | 18% |
| Total | 147,531.25 | 1,419,119.44 | 10% |
© 2018 by the authors. Licensee MDPI, Basel, Switzerland. This article is an open access article distributed under the terms and conditions of the Creative Commons Attribution (CC BY) license (http://creativecommons.org/licenses/by/4.0/).
Share and Cite
MDPI and ACS Style
Zhao, Z.; Liu, G.; Mou, N.; Xie, Y.; Xu, Z.; Li, Y. Assessment of Carbon Storage and Its Influencing Factors in Qinghai-Tibet Plateau. Sustainability 2018, 10, 1864. https://doi.org/10.3390/su10061864
AMA Style
Zhao Z, Liu G, Mou N, Xie Y, Xu Z, Li Y. Assessment of Carbon Storage and Its Influencing Factors in Qinghai-Tibet Plateau. Sustainability. 2018; 10(6):1864. https://doi.org/10.3390/su10061864
Chicago/Turabian StyleZhao, Zhonghe, Gaohuan Liu, Naixia Mou, Yichun Xie, Zengrang Xu, and Yong Li. 2018. "Assessment of Carbon Storage and Its Influencing Factors in Qinghai-Tibet Plateau" Sustainability 10, no. 6: 1864. https://doi.org/10.3390/su10061864
Note that from the first issue of 2016, this journal uses article numbers instead of page numbers. See further details here.