Quantifying the Similarity in Perceptions of Multiple Stakeholders in Dingcheng, China, on Agricultural Drought Risk Governance

1
Key Laboratory of Environmental Change and Natural Disaster, MOE, Beijing Normal University, Beijing 100875, China
2
Faculty of Geographical Science, Beijing Normal University, Beijing 100875, China
*
Author to whom correspondence should be addressed.
Sustainability 2018, 10(9), 3219; https://doi.org/10.3390/su10093219
Submission received: 6 August 2018
/
Revised: 31 August 2018
/
Accepted: 6 September 2018
/
Published: 8 September 2018
(This article belongs to the Special Issue Disasters, Crisis, Hazards, Emergencies and Sustainable Development)
Abstract
:In recent years, integrated disaster risk governance of multi-stakeholders, multi-scales, and multi-measures has received great attention. The way different stakeholders perceive how the risk of drought is governed affects their coordination in dealing with drought. Quantifying the extent to which the perceptions of different stakeholders are similar will deepen understanding of how they cooperate; this will subsequently improve regional integrated drought risk governance and promote regional sustainable development of agriculture. An indicator system of perception similarity and a model were constructed around the perceptions of government managers (G), village committees (V), and households (H) in Zhoujiadian Town, of the drought risk governance. Based on perspectives of “bottom-up” and “horizontal-vertical”, the effort led to the following main conclusions: (1) The perception similarity of homogeneous stakeholders is quite different, sorted by the values as G > V > H; (2) The greater the hierarchical difference between stakeholders, the more marked the differences between their perceptions, as sorted by the values as G&V > V&H > G&H; (3) All stakeholders have obvious perception differences in the fairness of the allocation of disaster relief funds and the most suitable recovery methods. Considering the needs of multiple stakeholders in integrated risk governance, the paper quantified the differences between individuals through a study of perception similarity, which makes up for the shortcomings in the current research—which only considers the perception of stakeholders—and provides new ideas and references for further exploration of rational system design, optimization of cooperation efficiency, and consensus of multiple stakeholders in integrated drought risk governance.
1. Introduction
On a global scale, drought is one of the most widespread and longest-lasting natural disasters [1], and often causes huge agricultural losses; problems such as food production reduction and water shortage resulting from drought have caused great threats to food security, ecological balance, and economic development of the world [2,3]. Agriculture is most affected by drought; 83% of all economic losses caused by drought occur in agriculture [4]. In 2000–2015, in China alone, the average annual drought-affected area was as high as 20.2 million hectares, resulting in average annual grain loss of 30.4 million tonnes [5]. Thus, drought severely affects the sustainable development of China’s agriculture and the stability of rural people’s lives. Strengthening the governance of risk from drought has become a key issue in current research on disaster management [6].
In the field of drought risk management and governance, numerous studies emphasize prevention, mitigation, preparedness, response, and recovery [7]. With respect to disaster preparedness, scholars often predict the occurrence of drought by constructing drought indexes [8] or regression analysis models [9]. With respect to response, scholars often use indicators to quickly assess response capabilities in disaster-affected areas [10]. With respect to recovery, many scholars are concerned about drought risk assessment and the application of insurance [11,12]. In recent years, the importance of integration has been stressed in the field of disaster risk governance; “multi-stakeholders, multi-scales, multi-measures” of risk governance is generally considered to effectively improve the socio-ecological system’s ability to resist attacks. The United Nations also held three World Conferences on Disaster Reduction in 1994, 2005, and 2015, emphasizing that the “synergistic collaboration” of multiple stakeholders is of great significance for risk governance [13].
Synergy of multiple stakeholders plays an important role in integrated risk governance [14]. For example, studies suggest that an enhanced risk perception among multiple stakeholders can promote more suitable plans for local flood risk management [15]. Studies also show that the Chinese government coordinated the actions of multiple participants in the face of disasters such as the Wenchuan earthquake [16] and the southern snowstorm [17], both of which have been recognized as a model responses to natural disasters. When emphasizing the role of multiple stakeholders, research of “bottom-up” collaboration has received lots of attention [18]. “Bottom-up” cooperation can be understood as management of individuals at the local scale who increase their participation and sense of responsibility in risk governance, in order to respond to natural disasters in unison with the national authorities [19]. For instance, some scholars find that the “bottom-up” management system of the public coordinating actively with national authorities has become a successful approach in flood risk governance [20]. Some studies also point out that Bottom-Up Initiatives play an important role in risk governance, and they often replace the tasks that national authorities can’t accomplish [21]. Some scholars point out that “bottom-up” cooperation in the Netherlands is the most feasible strategy for flood risk governance [22].
How multiple stakeholders perceive the governance of risk affects the extent of synergistic collaboration, and that perception, in turn, affects their ability to cope with disasters [23,24]. For example, some scholars find that individual risk perception of the Greek public and authorities influences their communication in the prevention process, thus affecting their positive response to disasters [25]. Some scholars advocate that managers should understand the typhoon risk perception of residents in poor areas of the Philippines, so that they can take effective measures to improve residents’ participation in building resilience [26]. Some scholars study the impact of the public’s storm risk perception on their preparedness measures, and conclude that managers and the public should strengthen their long-term risk governance perception [27]. Some find that residents with high risk perception in tourist areas are more likely to interact and actively prepare for disasters than those in non-tourist areas [28]. Finally, some find that people with high landslide risk perception tend to communicate more, and adopt multiple disaster preparedness behavior [29]. We can see that people’s perceptions have an impact on self-action and interaction with others, and are thus important regarding the effectiveness of the governance of risks [30,31,32].
Current research on stakeholder perceptions in the field of risk governance usually adopts two approaches; first, perceptions are assessed at the level of a group [33]; in the other, they are assessed at the level of the individual. In the first approach, perception is generally scored using the Likert scale, and the average of all individual scores is expressed as the cognitive state of the group’s perception [34,35]. The use of the Likert scale as a quantitative method is common to the above studies. In the second approach, attention is focused on the perceptions of individuals, usually ascertained by analyzing individual differences in qualitative terms. For example, some scholars maintain that the exchange of information between individual households is conducive to strengthening cognitive consistency and acceptance of irrigation technology, and helps them to adjust planting time and agricultural inputs, thereby improving a household’s ability to resist drought [36,37]. Stakeholders will have different opinions because of many factors, such as their knowledge and personal preferences; these differences may affect how relief measurements are implemented [38]. The smaller the differences in individual perceptions, the greater the similarity; this promotes consilience.
Similarity research is used mainly in sociology and the natural sciences, which provide a reference for the exploration of perception similarity. In sociology, to judge the semantic similarity of groups, some scholars define a model of ‘strict consensus’ or ‘soft consensus’ to measure semantic similarity using two values (1 or 0), or a continuous scale (any value between 0 and 1) to measure semantic similarity [39,40]. In the natural sciences, to calculate the similarity of sets, vectors, networks, etc., some scholars use the feature model based on the set theory: set similarity is represented by characteristic values which are obtained by the solution of the inequality of the intersection and the difference between the two sets [41]. Some use geometric models (the most common geometric model is the Minkowski formula) based on the distance theory: the vector similarity is calculated by the dimension of the vectors and the value of each dimension [42]. Some apply the network model based on graph theory. Network similarity is measured by the average minimum path length of all possible pairs of nodes in the network [43,44]. Although these models have not been applied to the governance of disaster risks, the ideas of ‘set theory’, ‘distance’, and ‘graph theory’ may be used for quantifying the similarity in perceptions of multiple stakeholders in the context of risk.
Based on the above, there are still some improvements in the research on multi-stakeholders’ perception of disaster risk governance: (1) Most studies treat individual risk perception independently, while ignoring the connections between them in the socio-ecological system, so there is a lack of consideration of perception differences between stakeholders. In the future, integrated risk governance of multi-stakeholders and multi-scales will become the main direction of disaster risk reduction; therefore, exploring the perceptual consistency among multiple stakeholders has become the key to concentrating all stakeholders’ efforts to resist disasters and improving cooperation efficiency; (2) At present, there is no quantification model and application of perception similarity for integrated risk governance of multiple stakeholders. The paper constructed an indicator system of perceptions of multiple stakeholders and a quantification model, and chose Zhoujiadian, a typical drought-affected area in Dingcheng district, as a sample to calculate perception similarity of homogeneous and heterogeneous stakeholders. The idea of “multi-indicators and multi-stakeholders” and the quantification of individual perception similarities serve to help us to understand the ‘soft (non-structural)’ factors between multiple stakeholders in combating drought; it is hoped that these principles will contribute to the studies of consilience and policies of drought risk governance [45].
2. Materials and Methods
2.1. Study Area
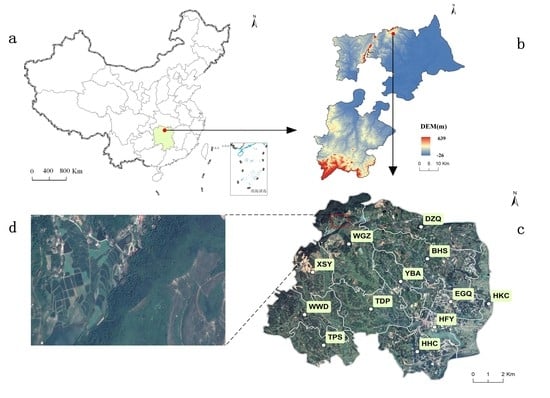
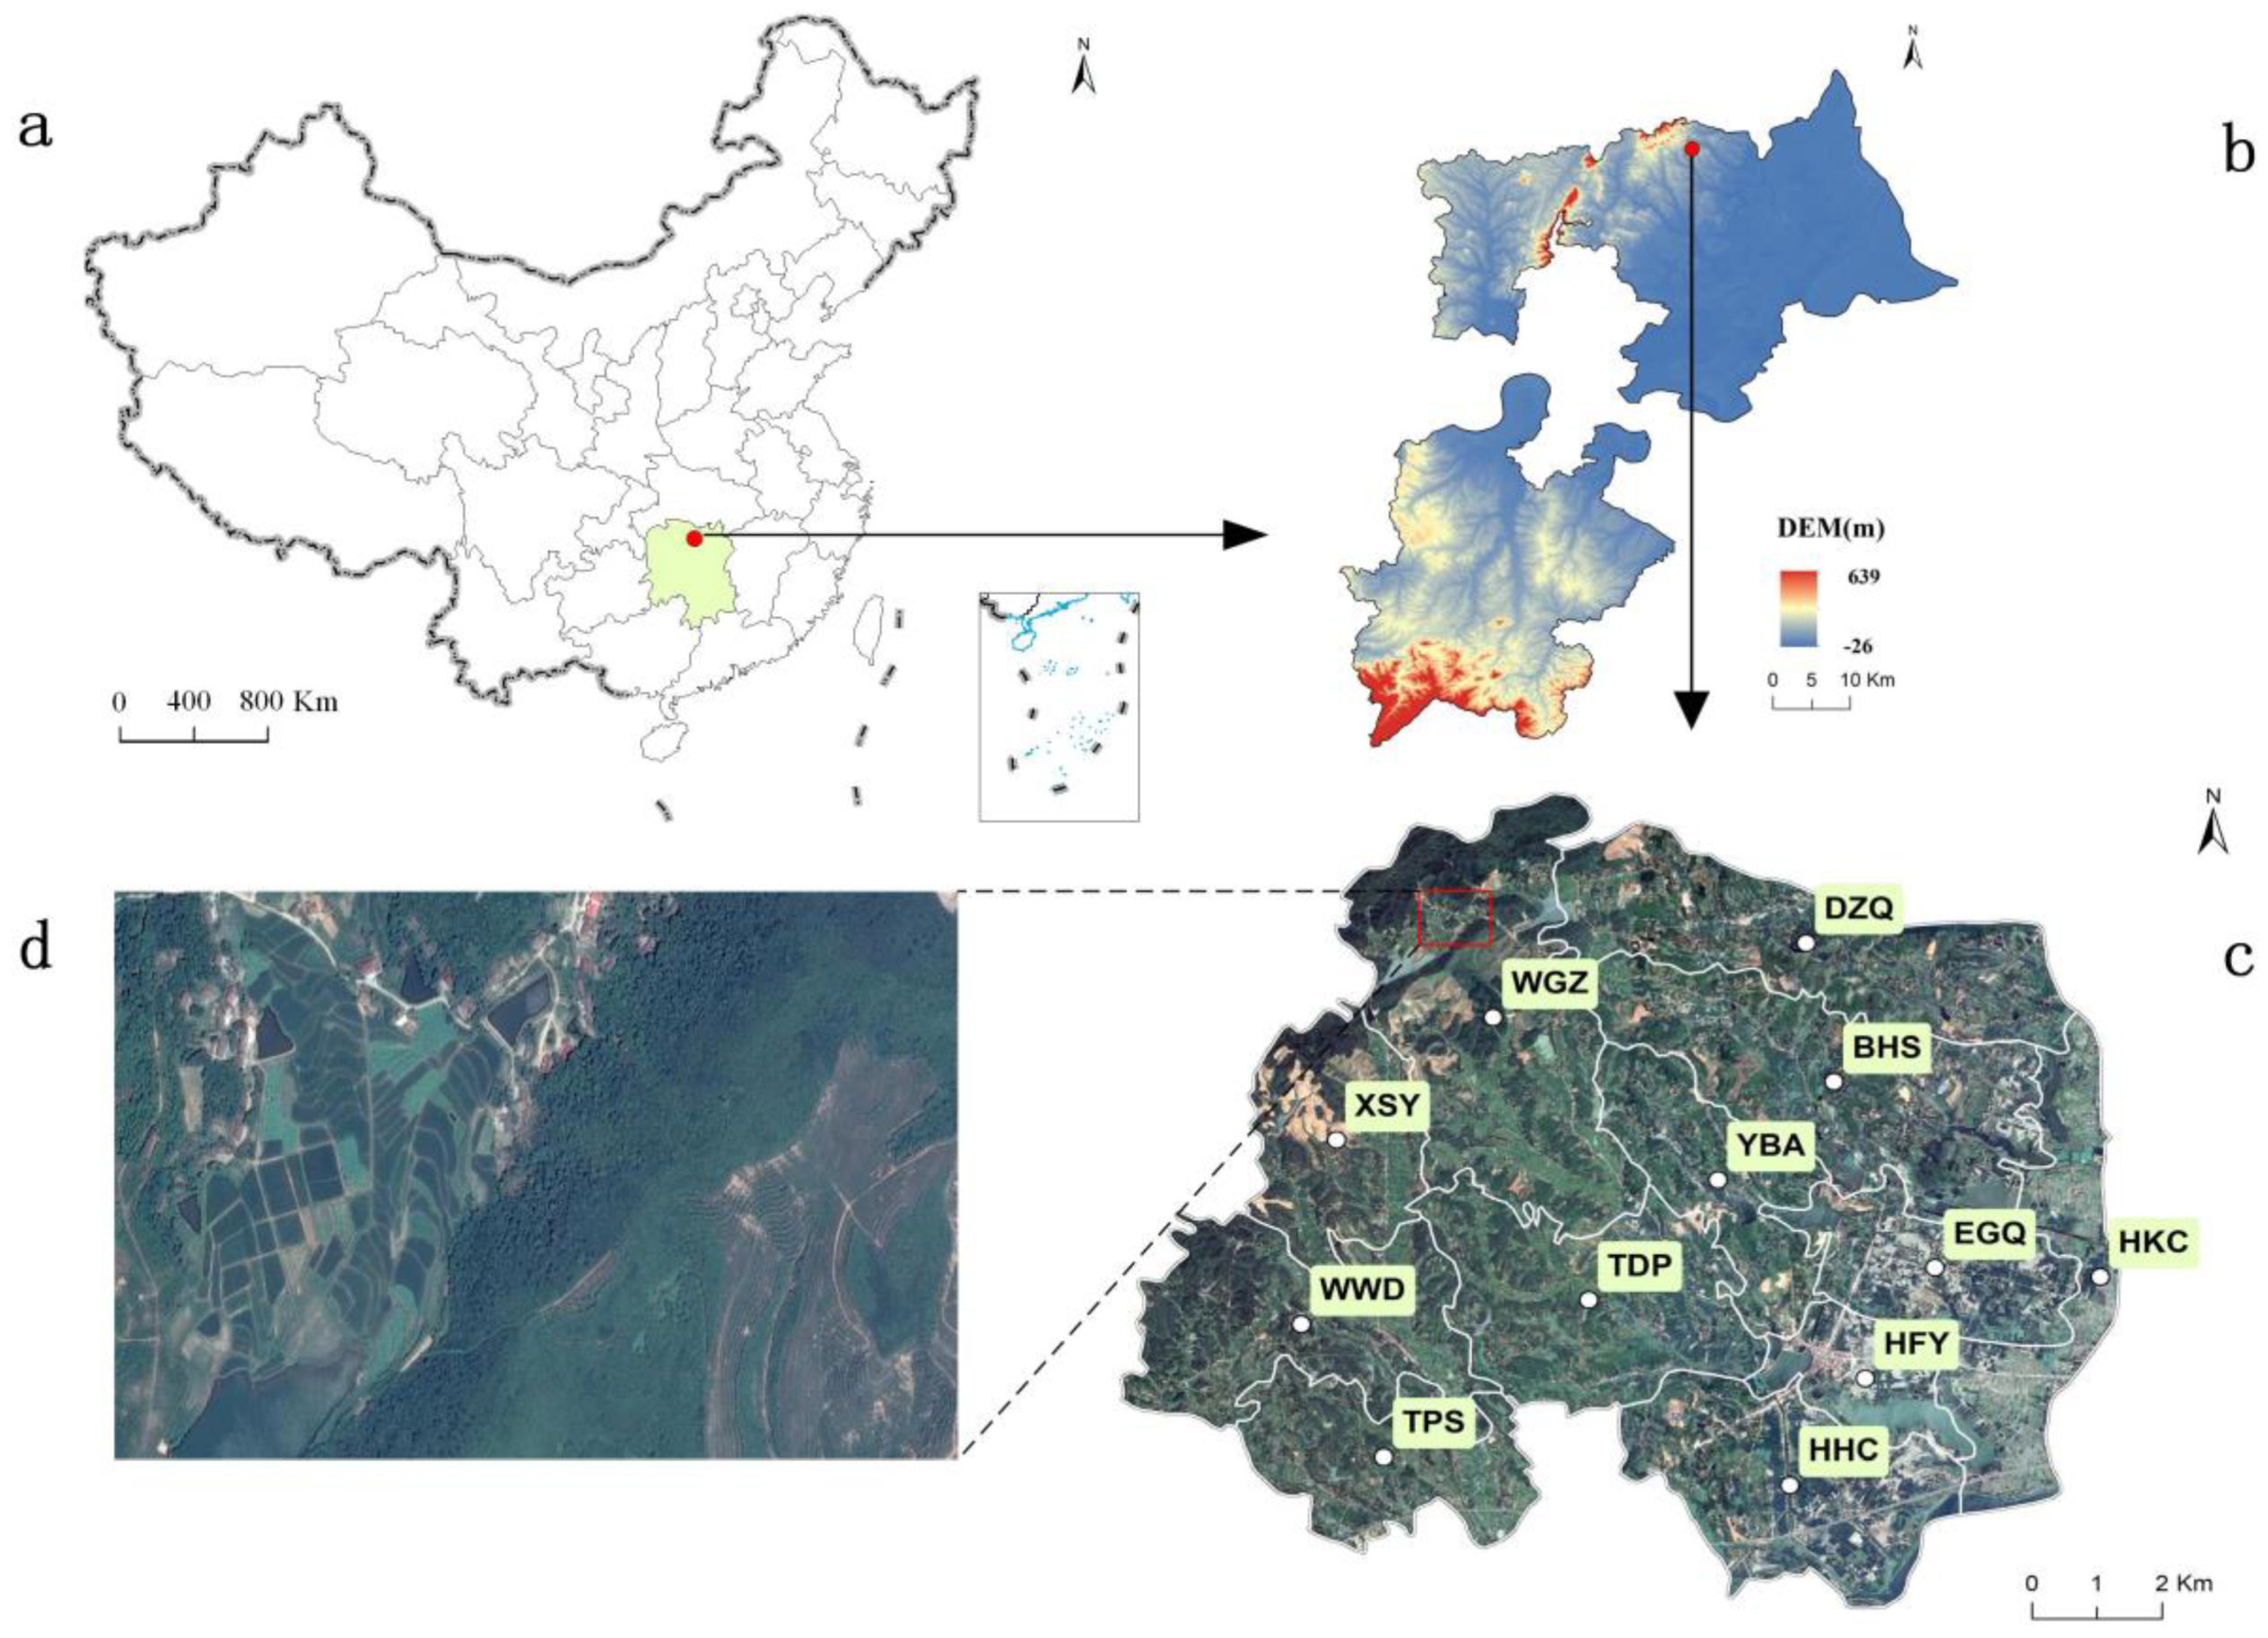
Dingcheng district, in northern Hunan province of China and on the western coast of Dongting Lake, is one of the national grain bases, and one of the most severely drought-affected areas. The terrain slopes from the south-west to the north-east. Roughly 30% of the area consists of hillocks, 25% of mountains, and 45% of plains and water bodies [46]. The climate is typically continental, but also humid. Precipitation is abundant (1300 mm annually) but unevenly distributed, and varies greatly from year to year. Droughts are frequent both in summer and autumn. Zhoujiadian is in the northern part of Dingcheng district, and it governs the following twelve villages: Hehuacun (HHC), Egongqiao (EGQ), Hengfengyuan (HFY), Yangbeian (YBA), Baihesi (BHS), Dazhuangqiao (DZQ), Wugangzhai (WGZ), Xinshiyan (XSY), Wawudang (WWD), Tuandangping (TDP), Taipingsi (TPS), and Haokoucun (HKC) (Figure 1). The effects of drought vary a great deal owing to the spatial differences in the terrain, and temporal differences in precipitation.
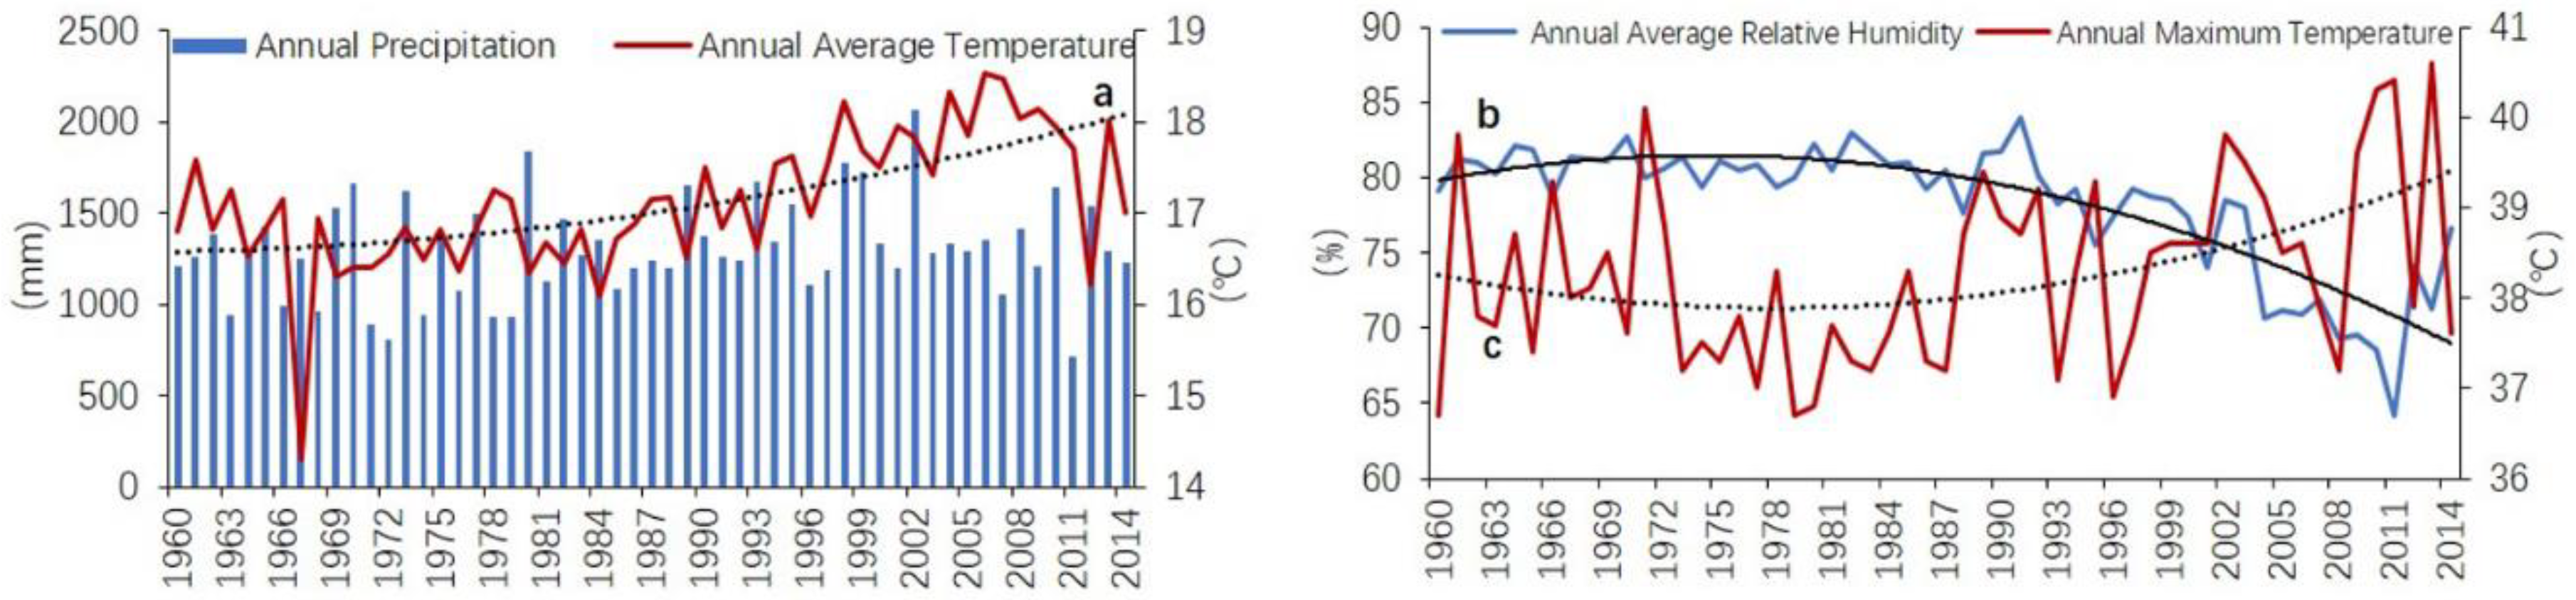
In the past half century (1960–2014), the climate of Dingcheng district experienced significant warming and drying (Figure 2). The total annual precipitation was slightly higher than averages in the 1980s and 1990s, but has been declining in recent decades, and the annual average temperature has been rising since the 1970s. At the same time, relative humidity has decreased and the maximum temperature has increased. The local community continues to be threatened by drought.
2.2. Data
The data for the present study can be divided into two categories (Table 1), namely (1) basic geographic data (including data for the local administrative division, images obtained by remote sensing, and meteorological data); (2) fieldwork data (including social-economic and perception data). Social-economic data were obtained from the local government’s statistics department; perception data were derived from the questionnaires administered to members of 188 households, members of 36 village committees (including the Party Secretary, the Vice Party Secretary, and Accountant in each village), and 8 managers (including the Mayor, the Deputy Mayor from the state agricultural department, the Director of the Office of Agriculture, the Manager and the Deputy Manager of the Agricultural Technology Station, the Chief of Water Station and its Engineer, and the Director for Civil Affairs). The questionnaire consisted of multiple-choice questions and the Likert scale.
2.3. Mehtod
2.3.1. Basic Idea
The research was mainly carried out through the following steps: (1) From the perspectives of disaster preparedness, response and recovery, a perception indicator system (3 first-level indicators and 12 s-level indicators) for agricultural drought risk governance was constructed. (2) According to the indicators, we designed sets of multiple-choice questions and a Likert scale separately. (3) Based on the idea of “set theory”, each person’s answer to each multiple-choice question is treated as a set, and each option in each set is considered an element. The ratio of the element number of the intersection of person A and B to the element number of union of them is their basic perception similarity on the choice question. (4) Based on the idea of “distance”, the ratio of the score gap (“distance”) on each question for person A and B to the grade of the scale is their basic perception similarity on the Likert scale. (5) The perception similarity of the multiple-choice questions and the Likert scales are normalized and then averaged to obtain the perception similarity between stakeholders. (6) Taking Zhoujiadian Town as a case study, from the bottom-up perspective of households → villages → townships, we calculates perception similarity of households, village committees, and agricultural department managers respectively, as well as perception similarities between these three groups. Meanwhile, as a means of scale integration, we calculate the average values for households and village committees on a village scale to estimate the corresponding degree of similarity in perception on the scale of a township.
2.3.2. Questionnaire Survey
The questionnaire consisted of two parts. The first part covered basic demographic information for each household (basic information on family, income, etc. and basic work-related information in the case of officials, namely government employees and members of village committees). The second part consisted of questions designed to assess perceptions (Table 2). The present paper attempts to measure the similarities in stakeholders’ perceptions of the process of preparing for droughts, responding to them, and recovering from them, as well as their perceptions of the extent to which they took care of the area.
2.3.3. Quantification of Similarity in Perceptions of Multiple Stakeholders
We constructed a model of “perception similarity” to calculate the similarity in perceptions of multiple stakeholders. The construction consisted of the following steps:
(1) Divide the perception of each stakeholder i into two matrices. The first is perception P(i)ch based on choice (hereinafter referred to as choice perception). The second one is perception P(i)ju based on the Likert scale (hereinafter referred to as judgment perception). In Formula (1), x is the serial number of the question, with each question corresponding to a second-level indicator.
(2) Calculate the perception similarity between two stakeholders (i,j). Similarity of choice perception S(i,j)ch is shown as Formula (2) and similarity of judgment perception S(i,j)ju S(i,j)ju is shown as Formula (3) NP(i)x=P(j)x represents the number of stakeholders (i,j) who made the same choice in answering the xth question; NP(i)x+P(j)x represents the total number of choices for the two stakeholders in that question, and g stands for grade 5 on the Likert Scale.
(3) Calculate the similarity of homogeneous stakeholder groups. Calculate the average of results from step (2) as the degree of similarity between groups. The corresponding group similarity of choice perception Sch-ho is shown as Formula 4, which is normalized to get the basic similarity S-Sch-ho (Formula (5)), and judgment perception Sju-ho is shown as Formula (6), which is normalized to get the basic similarity S-Sju-ho (Formula (7)). Finally, the average of two results is regarded as similarity of homogeneous stakeholders (Formula (8)).
(4) Calculate the similarity of heterogeneous stakeholder groups. Stakeholder i ∈ A, j ∈ B, K is the number of people interviewed in group A and M is the number of people interviewed in group B. Calculate the average of results from step (2) as the similarity between the two groups. The corresponding group similarity of choice perception Sch-he is shown as Formula (9), which is normalized to get the basic similarity S-Sch-he (Formula (10)), and judgement perception Sju-he is shown as Formula (11), which is normalized to get the basic similarity S-Sju-he (Formula (12)). Finally, the average of two results is regarded as similarity of heterogeneous stakeholders (Formula (13)).
(5) Arrive at the ‘bottom-up’ similarity. Calculate the average of all low scales to get the similarity at higher scales. The similarities of choice perception Sup-ch, judgment perception Sup-ju, and similarity Sup-ih at a higher level are shown as Formula (14), in which m is the number of groups surveyed at the lower scale and ϕ stands for the average algorithm.
3. Results
3.1. Similarity of Perception among Households
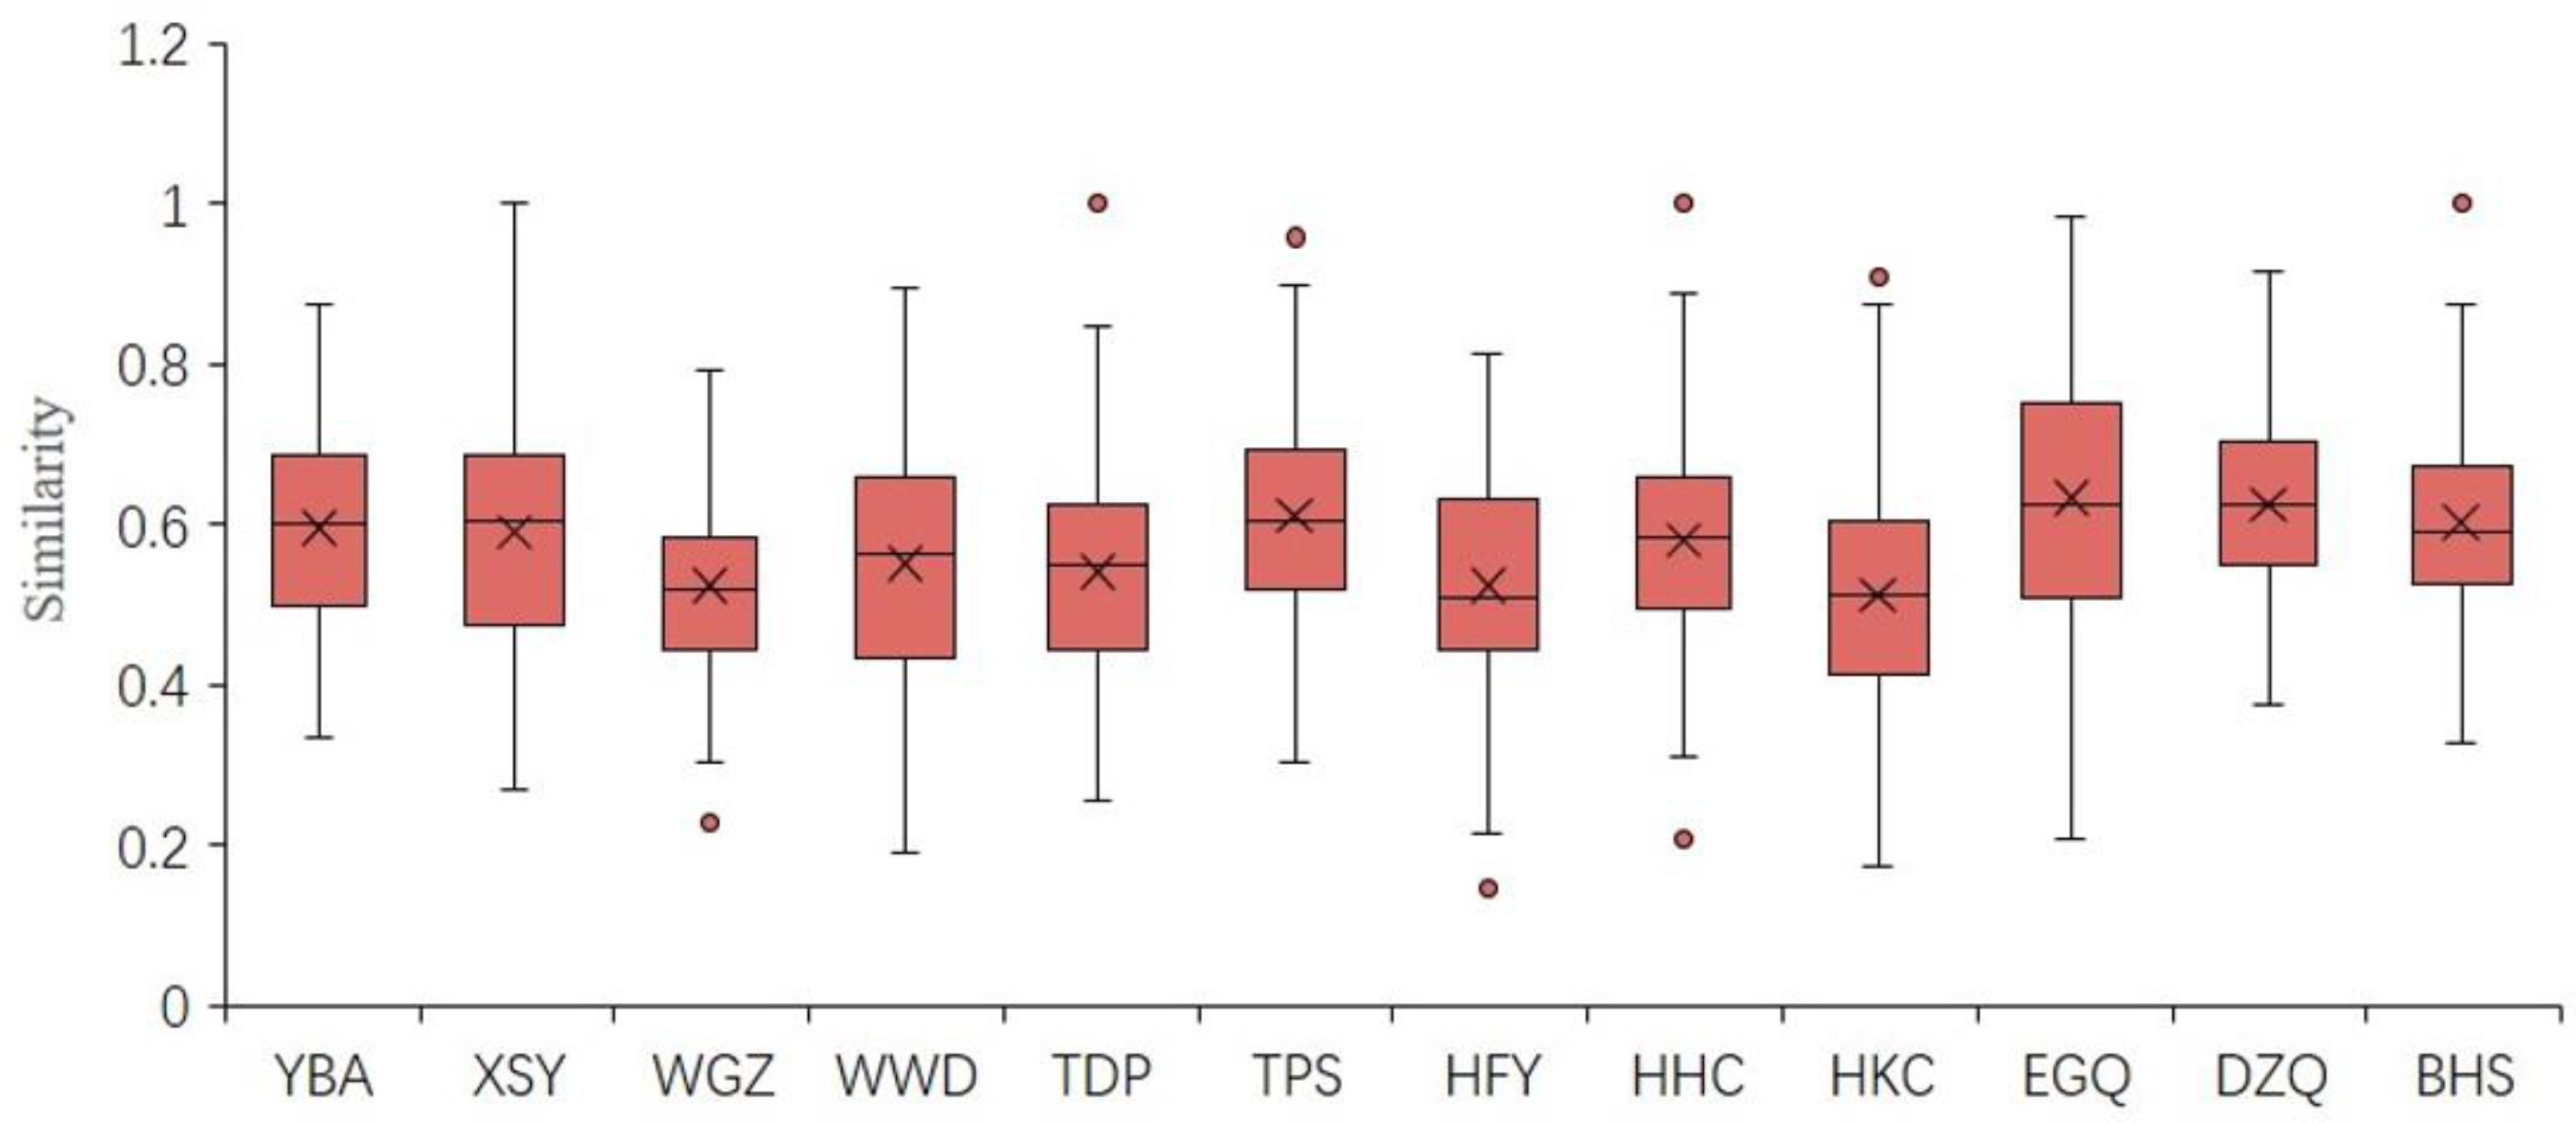
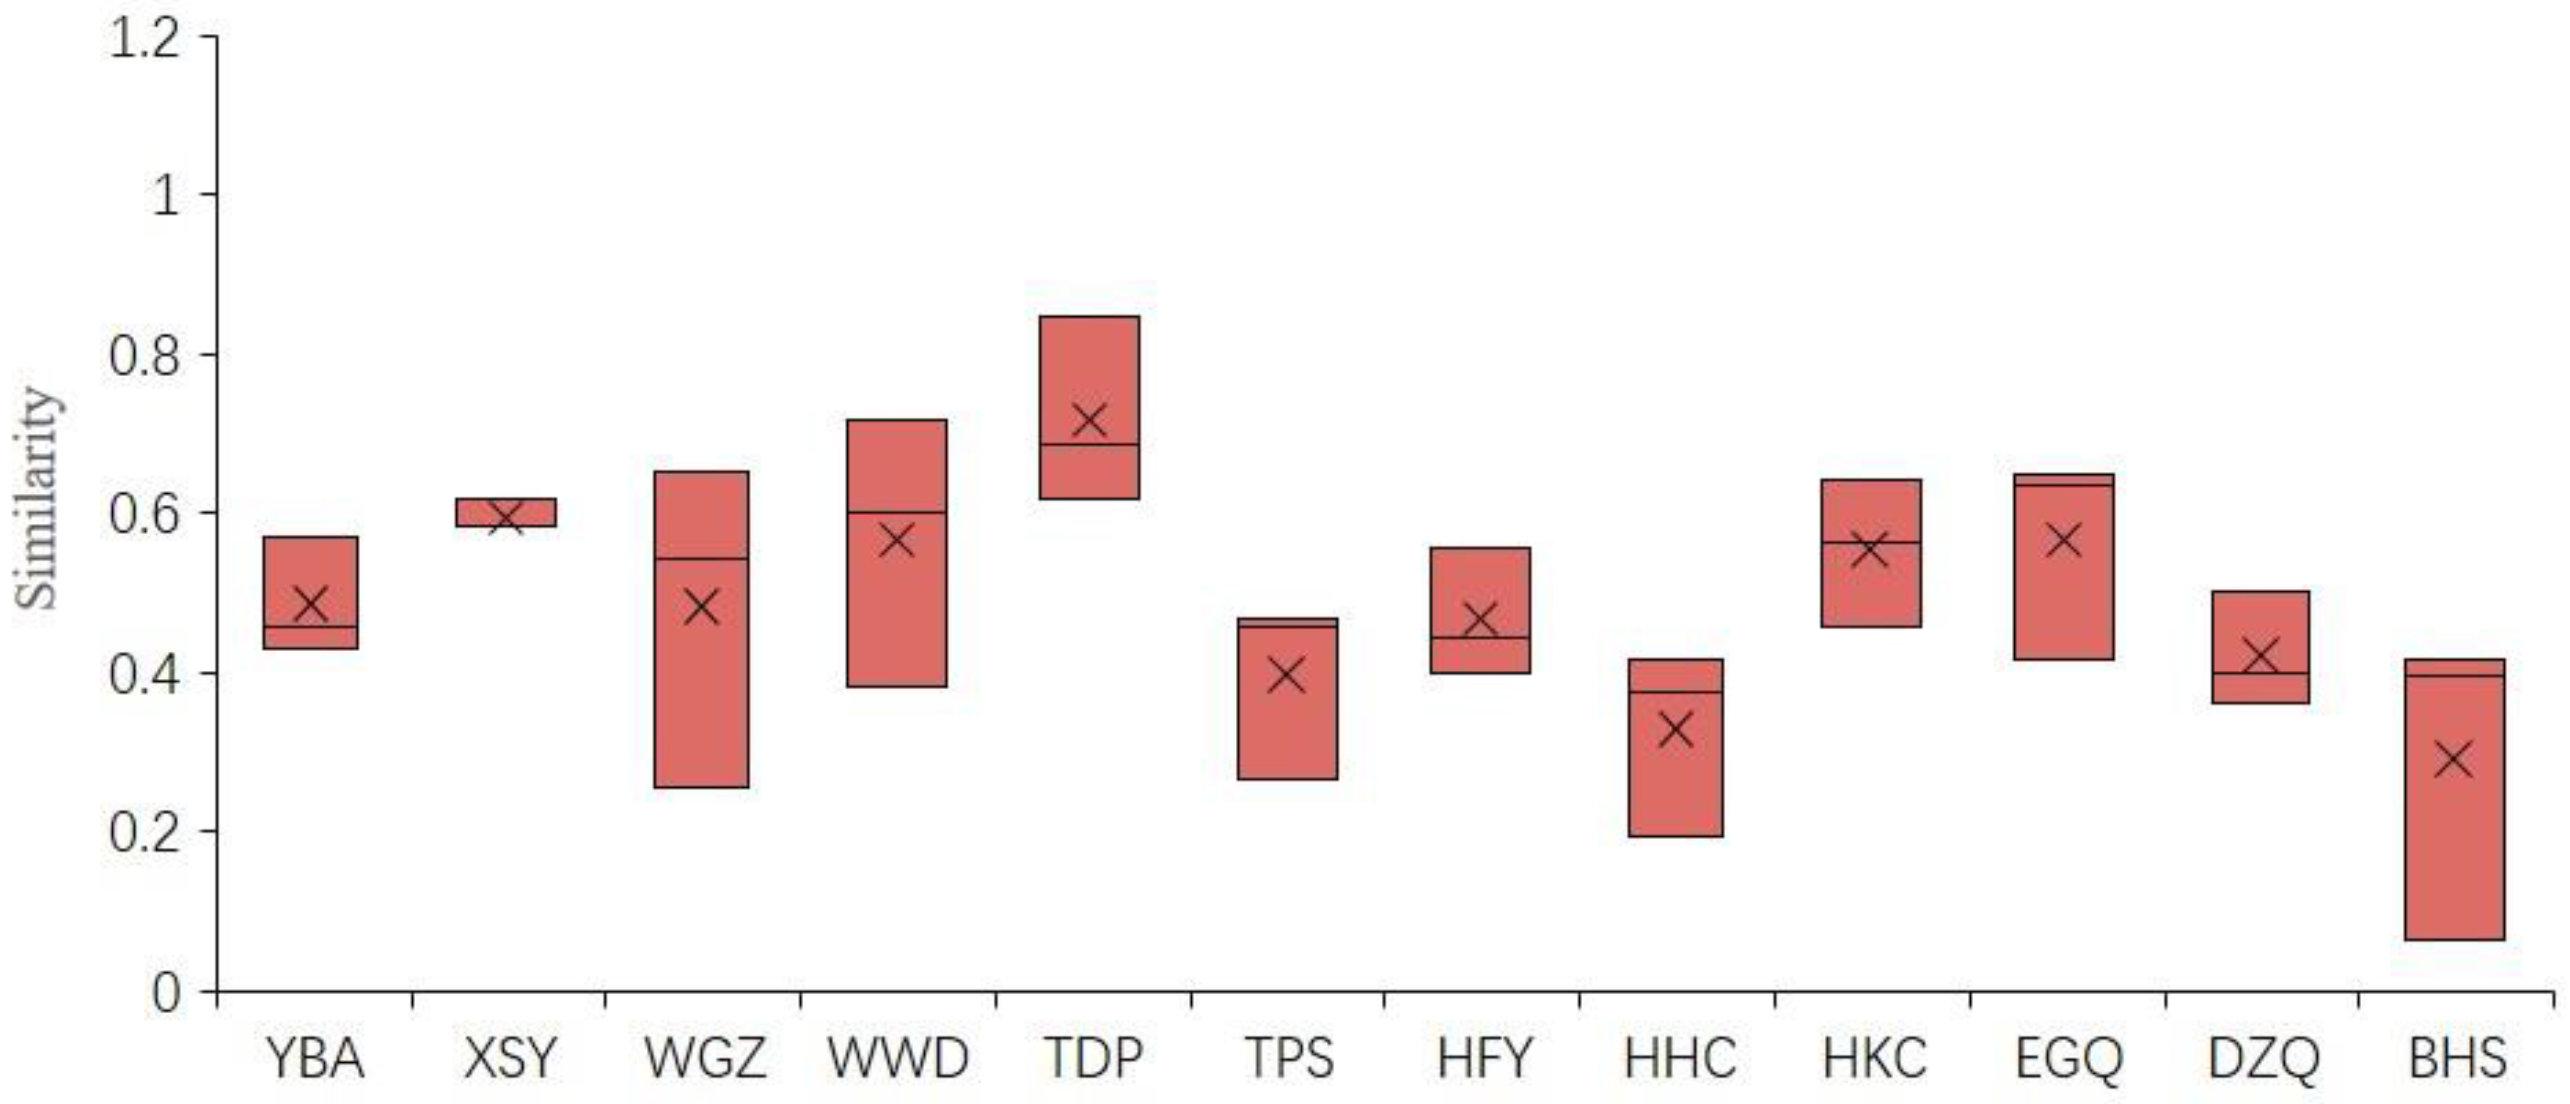
Individual households showed a diversity of perceptions on the governance of drought risk. The average of the households’ similarity was 0.56; the standard deviation was 0.13; 32% of the values were below 0.5; 53% were between 0.5 and 0.7, and only 15% were greater than 0.7. The perception similarity of households was thus at a medium level, the volatility was relatively small, and the proportion of high similarity was low. It is known that perception similarity can be increased greatly. Households’ perception similarity was distributed mainly between 0.58 and 0.70. Village EGQ showed maximum variation (0.775) and village WGZ showed minimum variation (0.5) (Figure 3). The differences in perception between households may be due to their different levels of education and farming experience, both of which varied greatly in any given village, although the perception showed much greater similarity between villages.
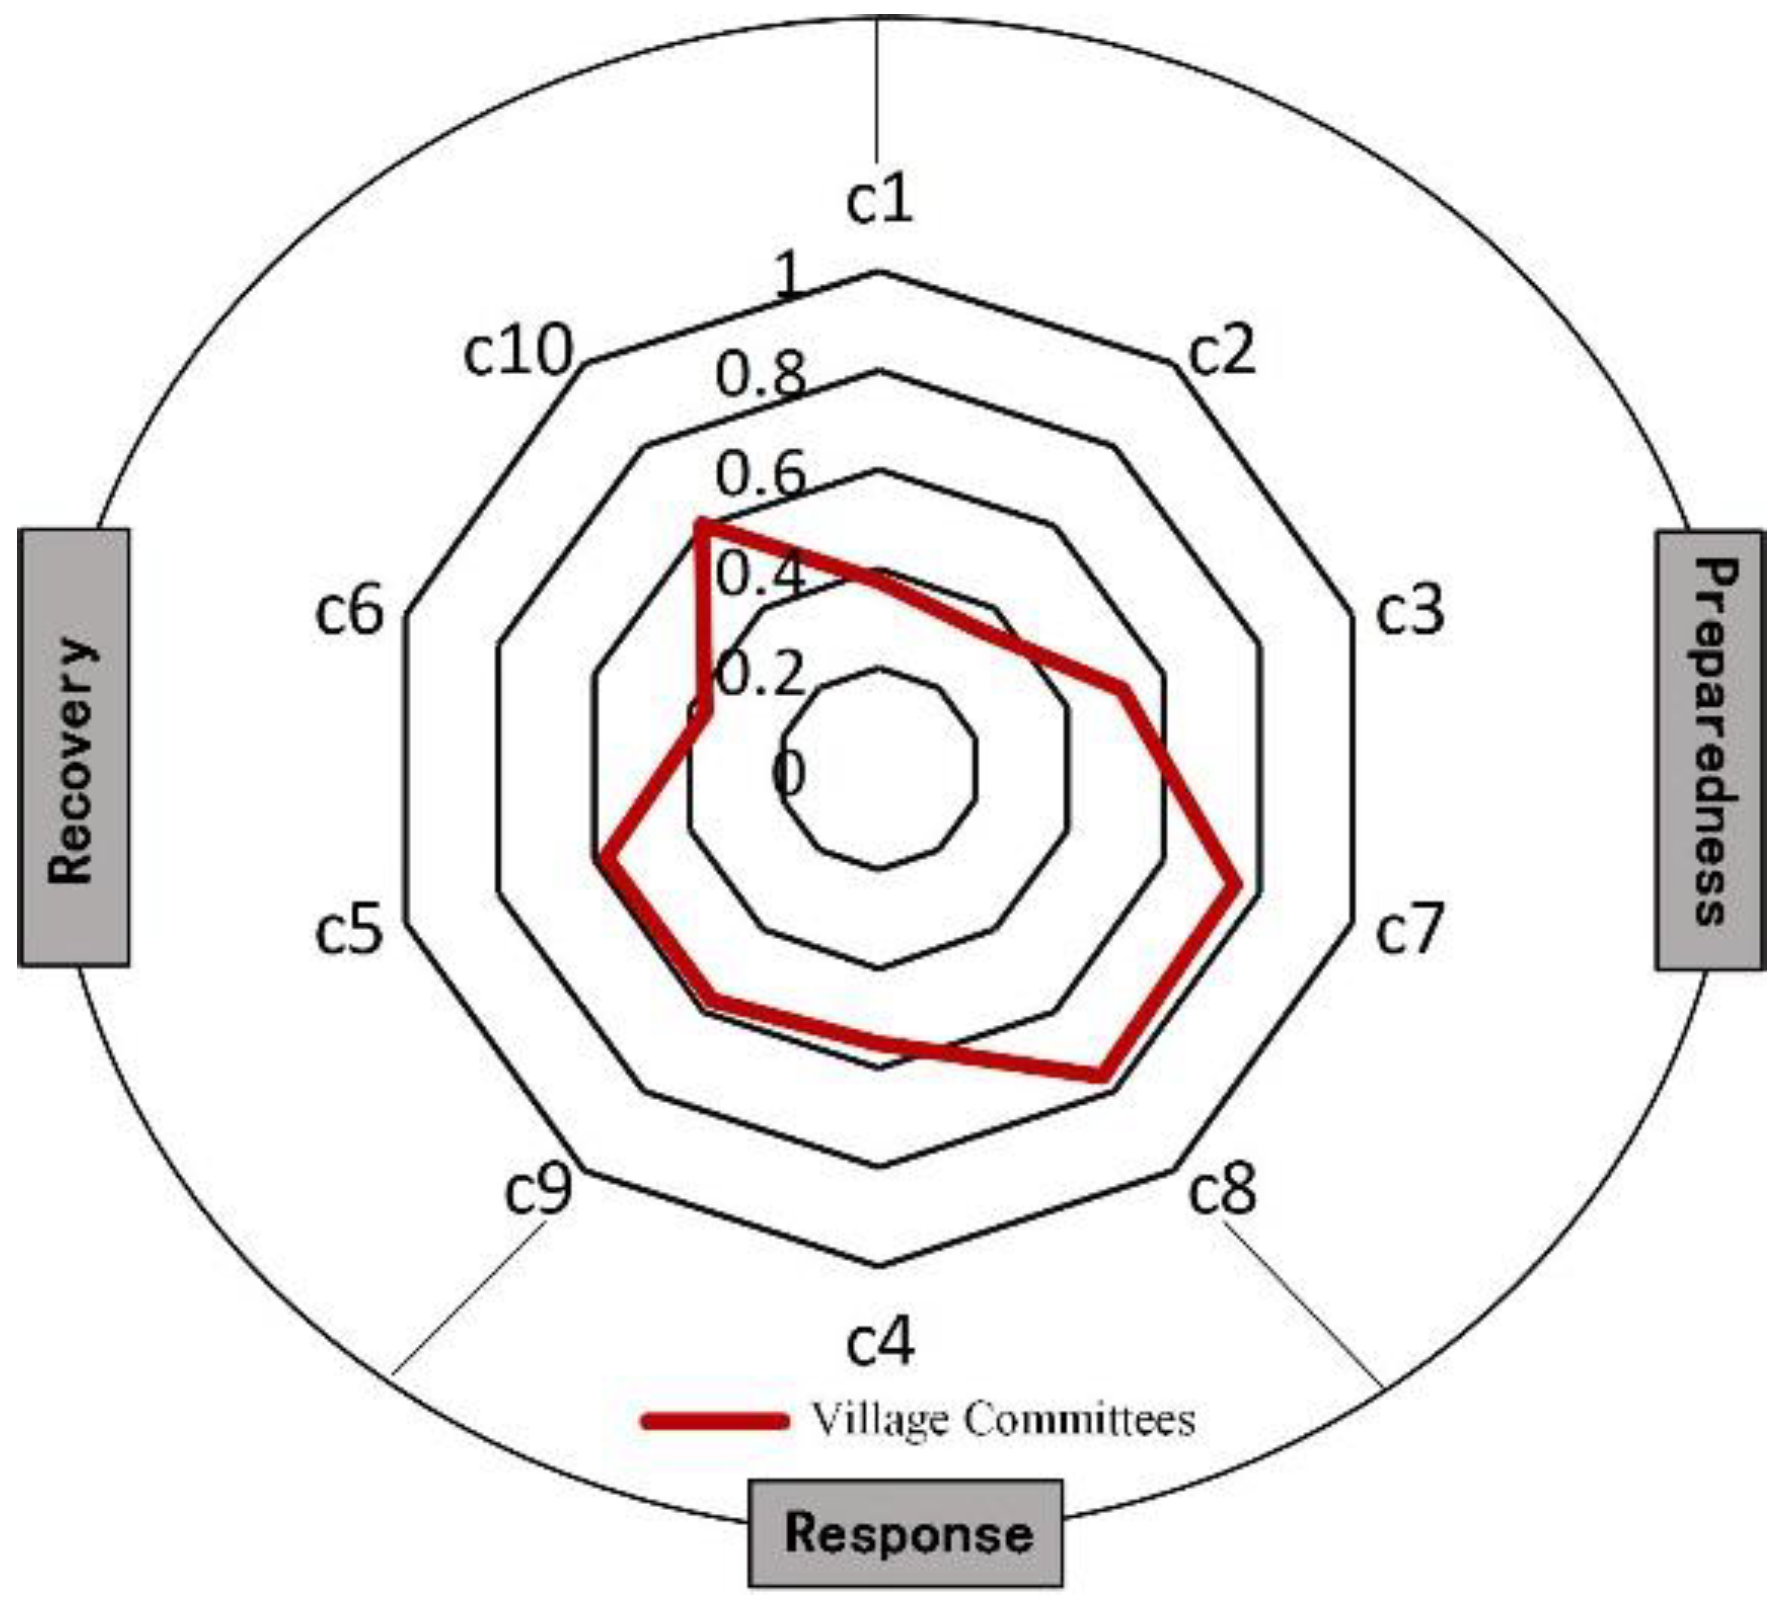
In order to assess the similarity between perceptions of different groups of households with respect to specific issues, we calculated the average of results of all individuals and classified them from the perspective of being prepared for, responding to, and recovering from drought. In general, households’ perceptions of response were more profound and unified, whereas those of preparedness and recovery were relatively diverse (Figure 4). The average similarity of households in drought preparedness, response, and recovery was 0.44, 0.65 and 0.54 respectively. The perceptions of households of the causes of drought (c1), methods of water management (c2), and most suitable methods of recovering from drought (c6) varied greatly, whereas their perceptions of appropriate measures to combat drought, allocation of funds for disaster relief (c9), and subsidies after a disaster (c10) were more consistent.
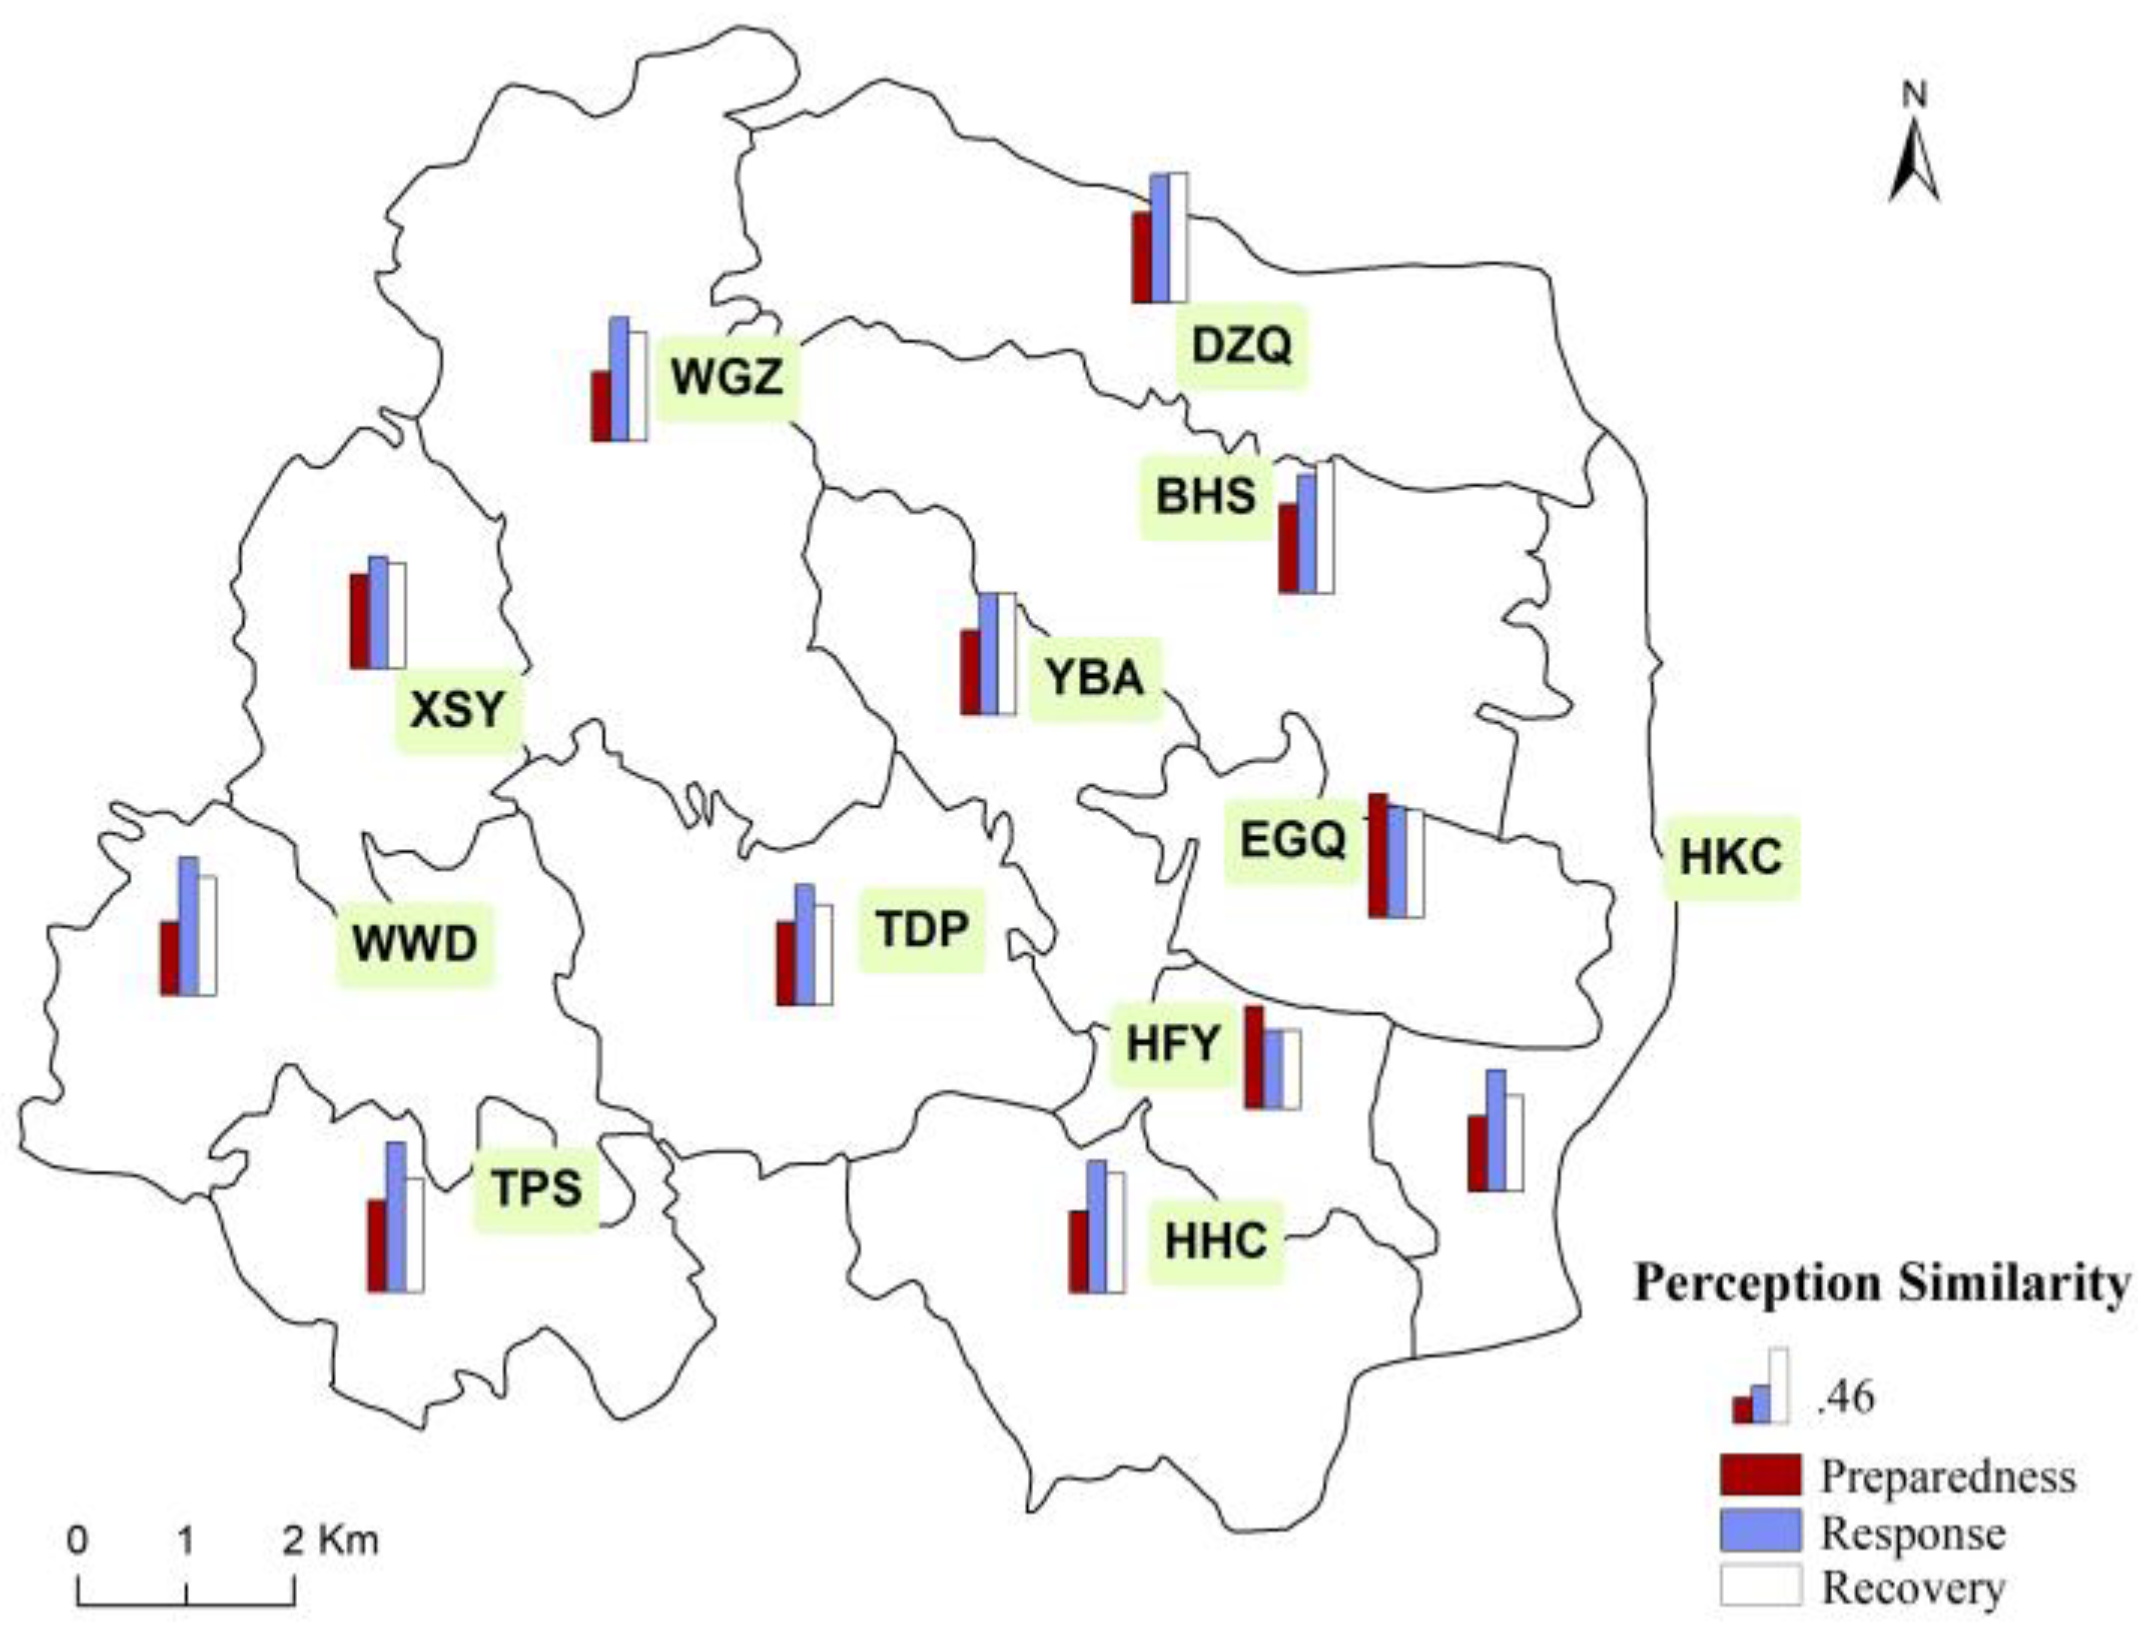
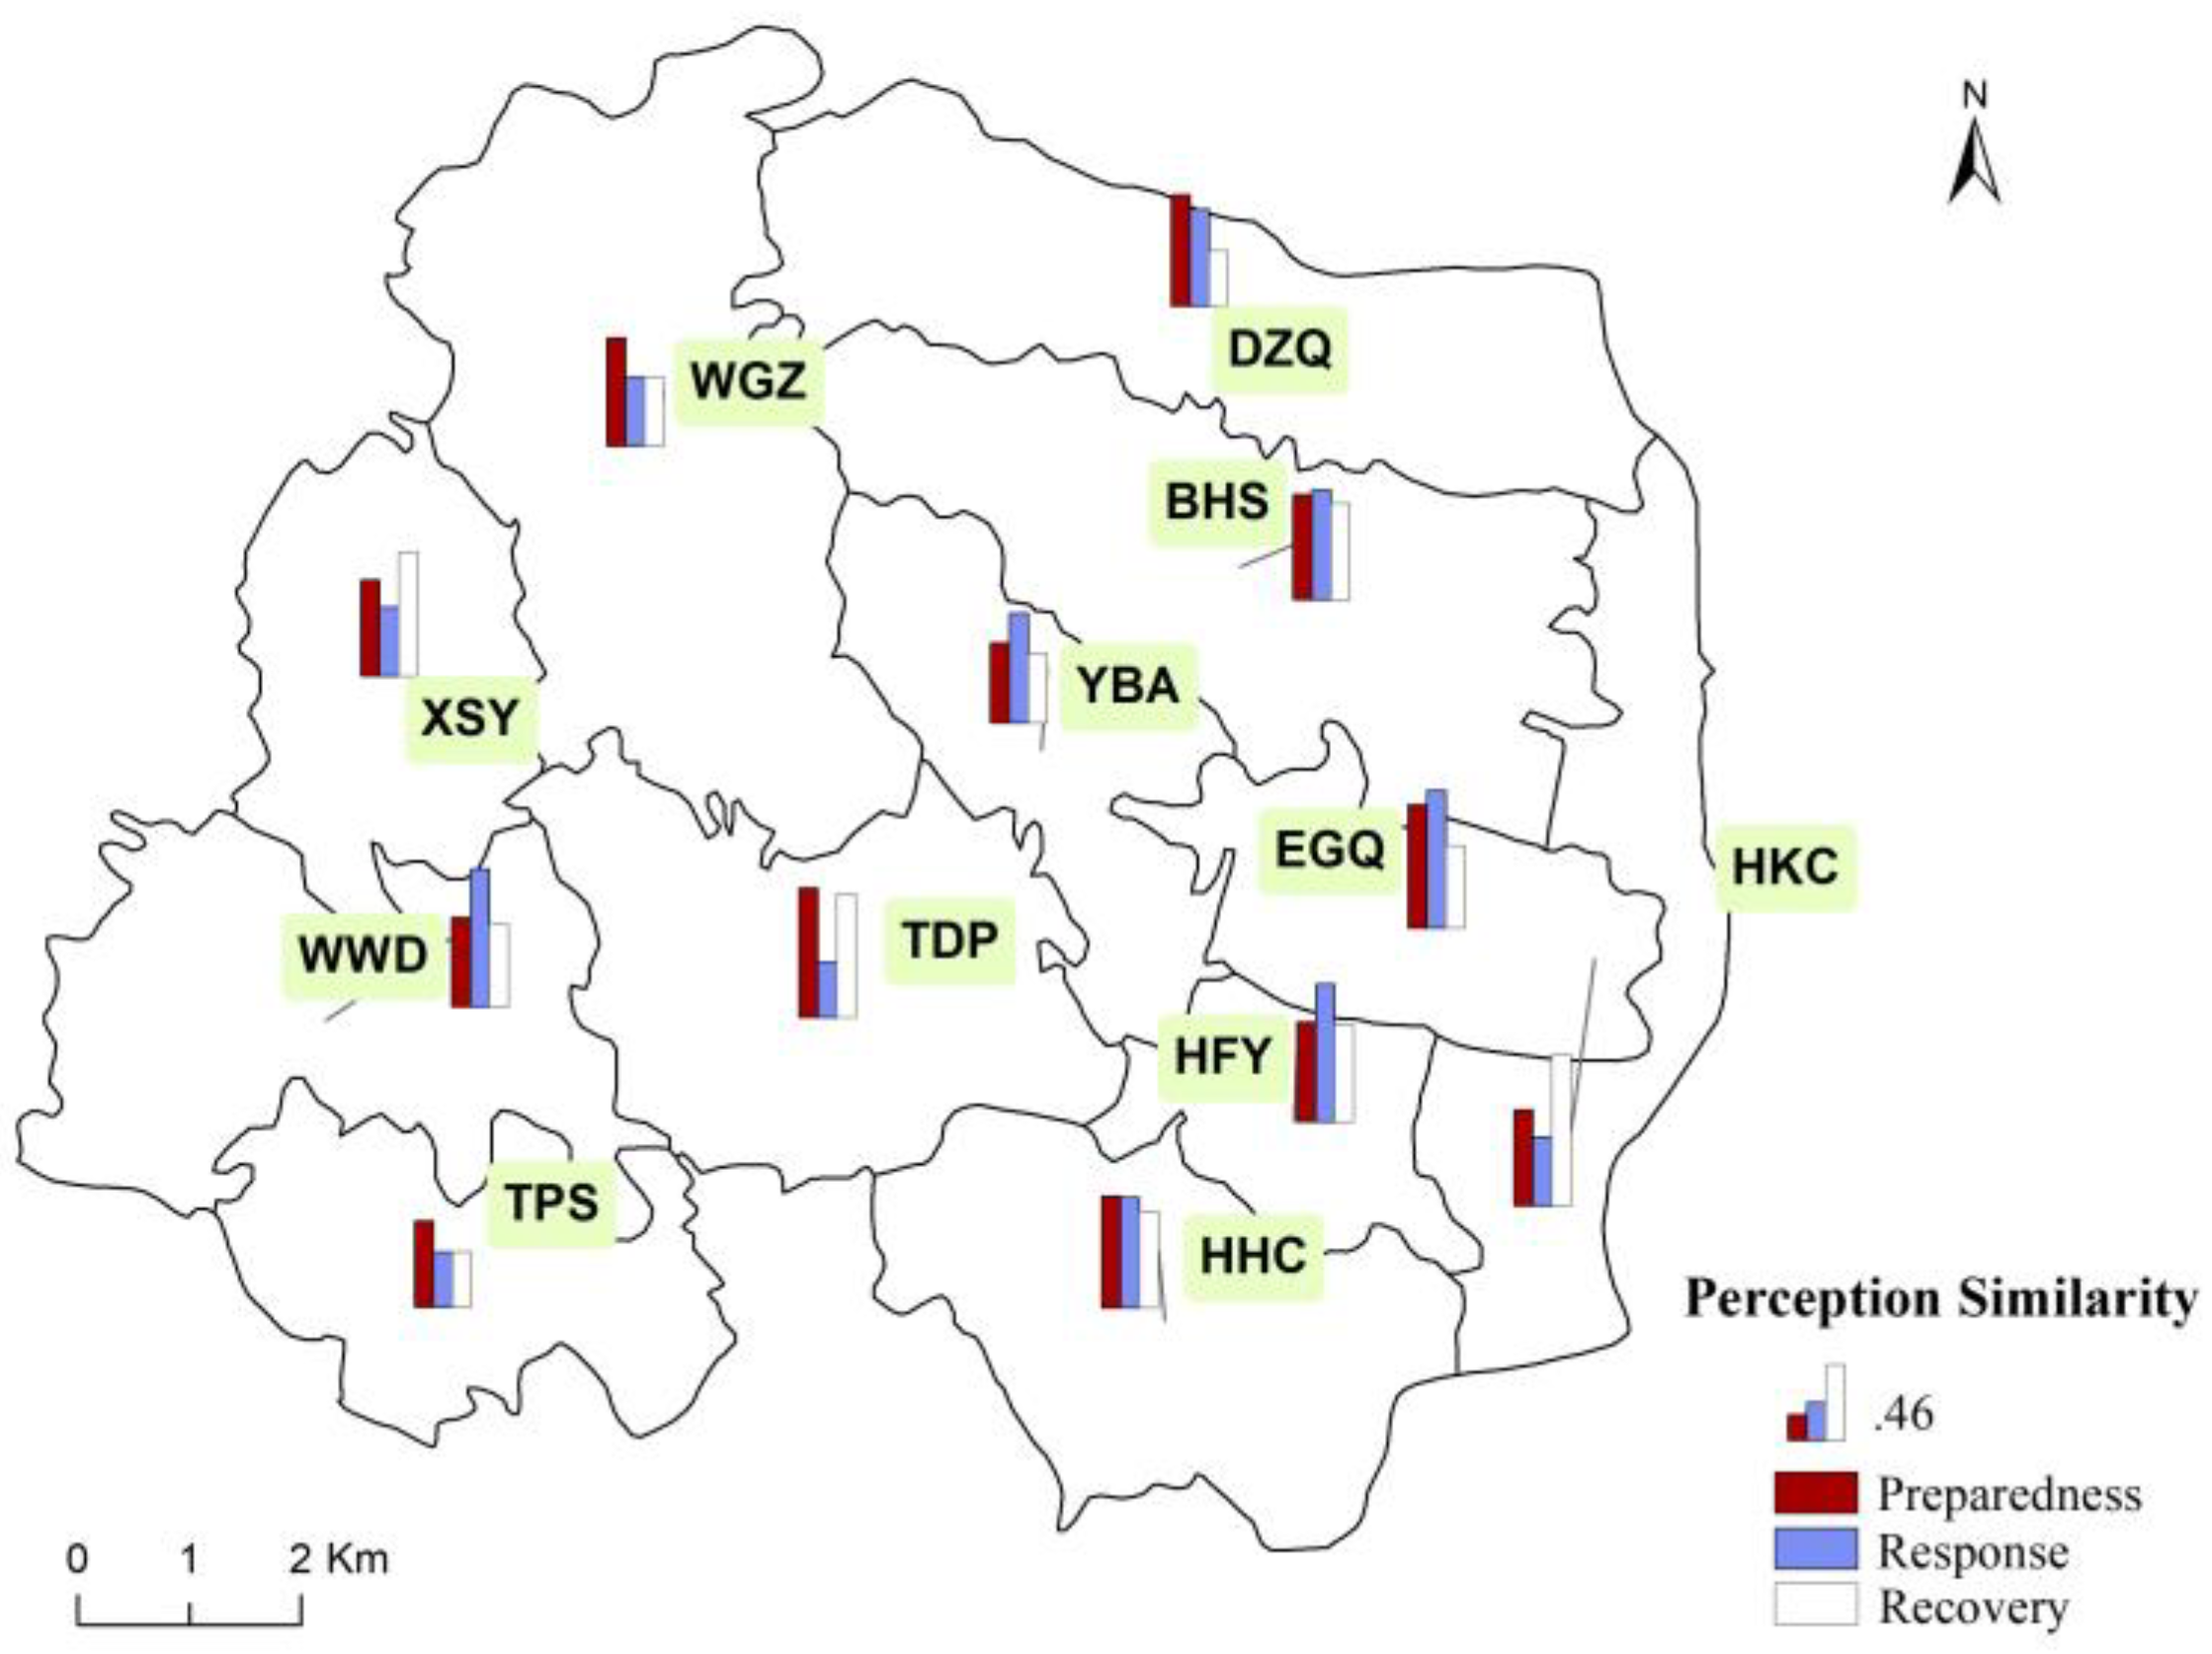
With respect to preparedness (Figure 5), the perceptions of households in EGQ obtained a maximum value of 0.67. With respect to response, TPS obtained a maximum value of 0.63. Finally, with respect to recovery, BHS obtained a maximum value of 0.71. Across the categories, the households in TPS and DZQ showed highly similar perceptions. Both villages share similar average elevation (is about 49 m), similar extent of cultivated area (about 1250 ha and 1530 ha, respectively), and roughly an equal number of ponds (70). These shared features probably affected their perceptions of the most important measure against drought, namely the construction of facilities to conserve water. For example, the majority hoped that the state would do more in terms of investing, building, and maintaining the relevant infrastructure, which makes their perceptions similar. TDP was the only village in which the households’ perception similarity was below the average in the whole process. In 2015, TDP was formed by merging three small villages (Tuanping, Xiangjiadang, and Quanshui). Due to this administrative restructuring, the internal differences were prominent, which partly explains the differences in perceptions.
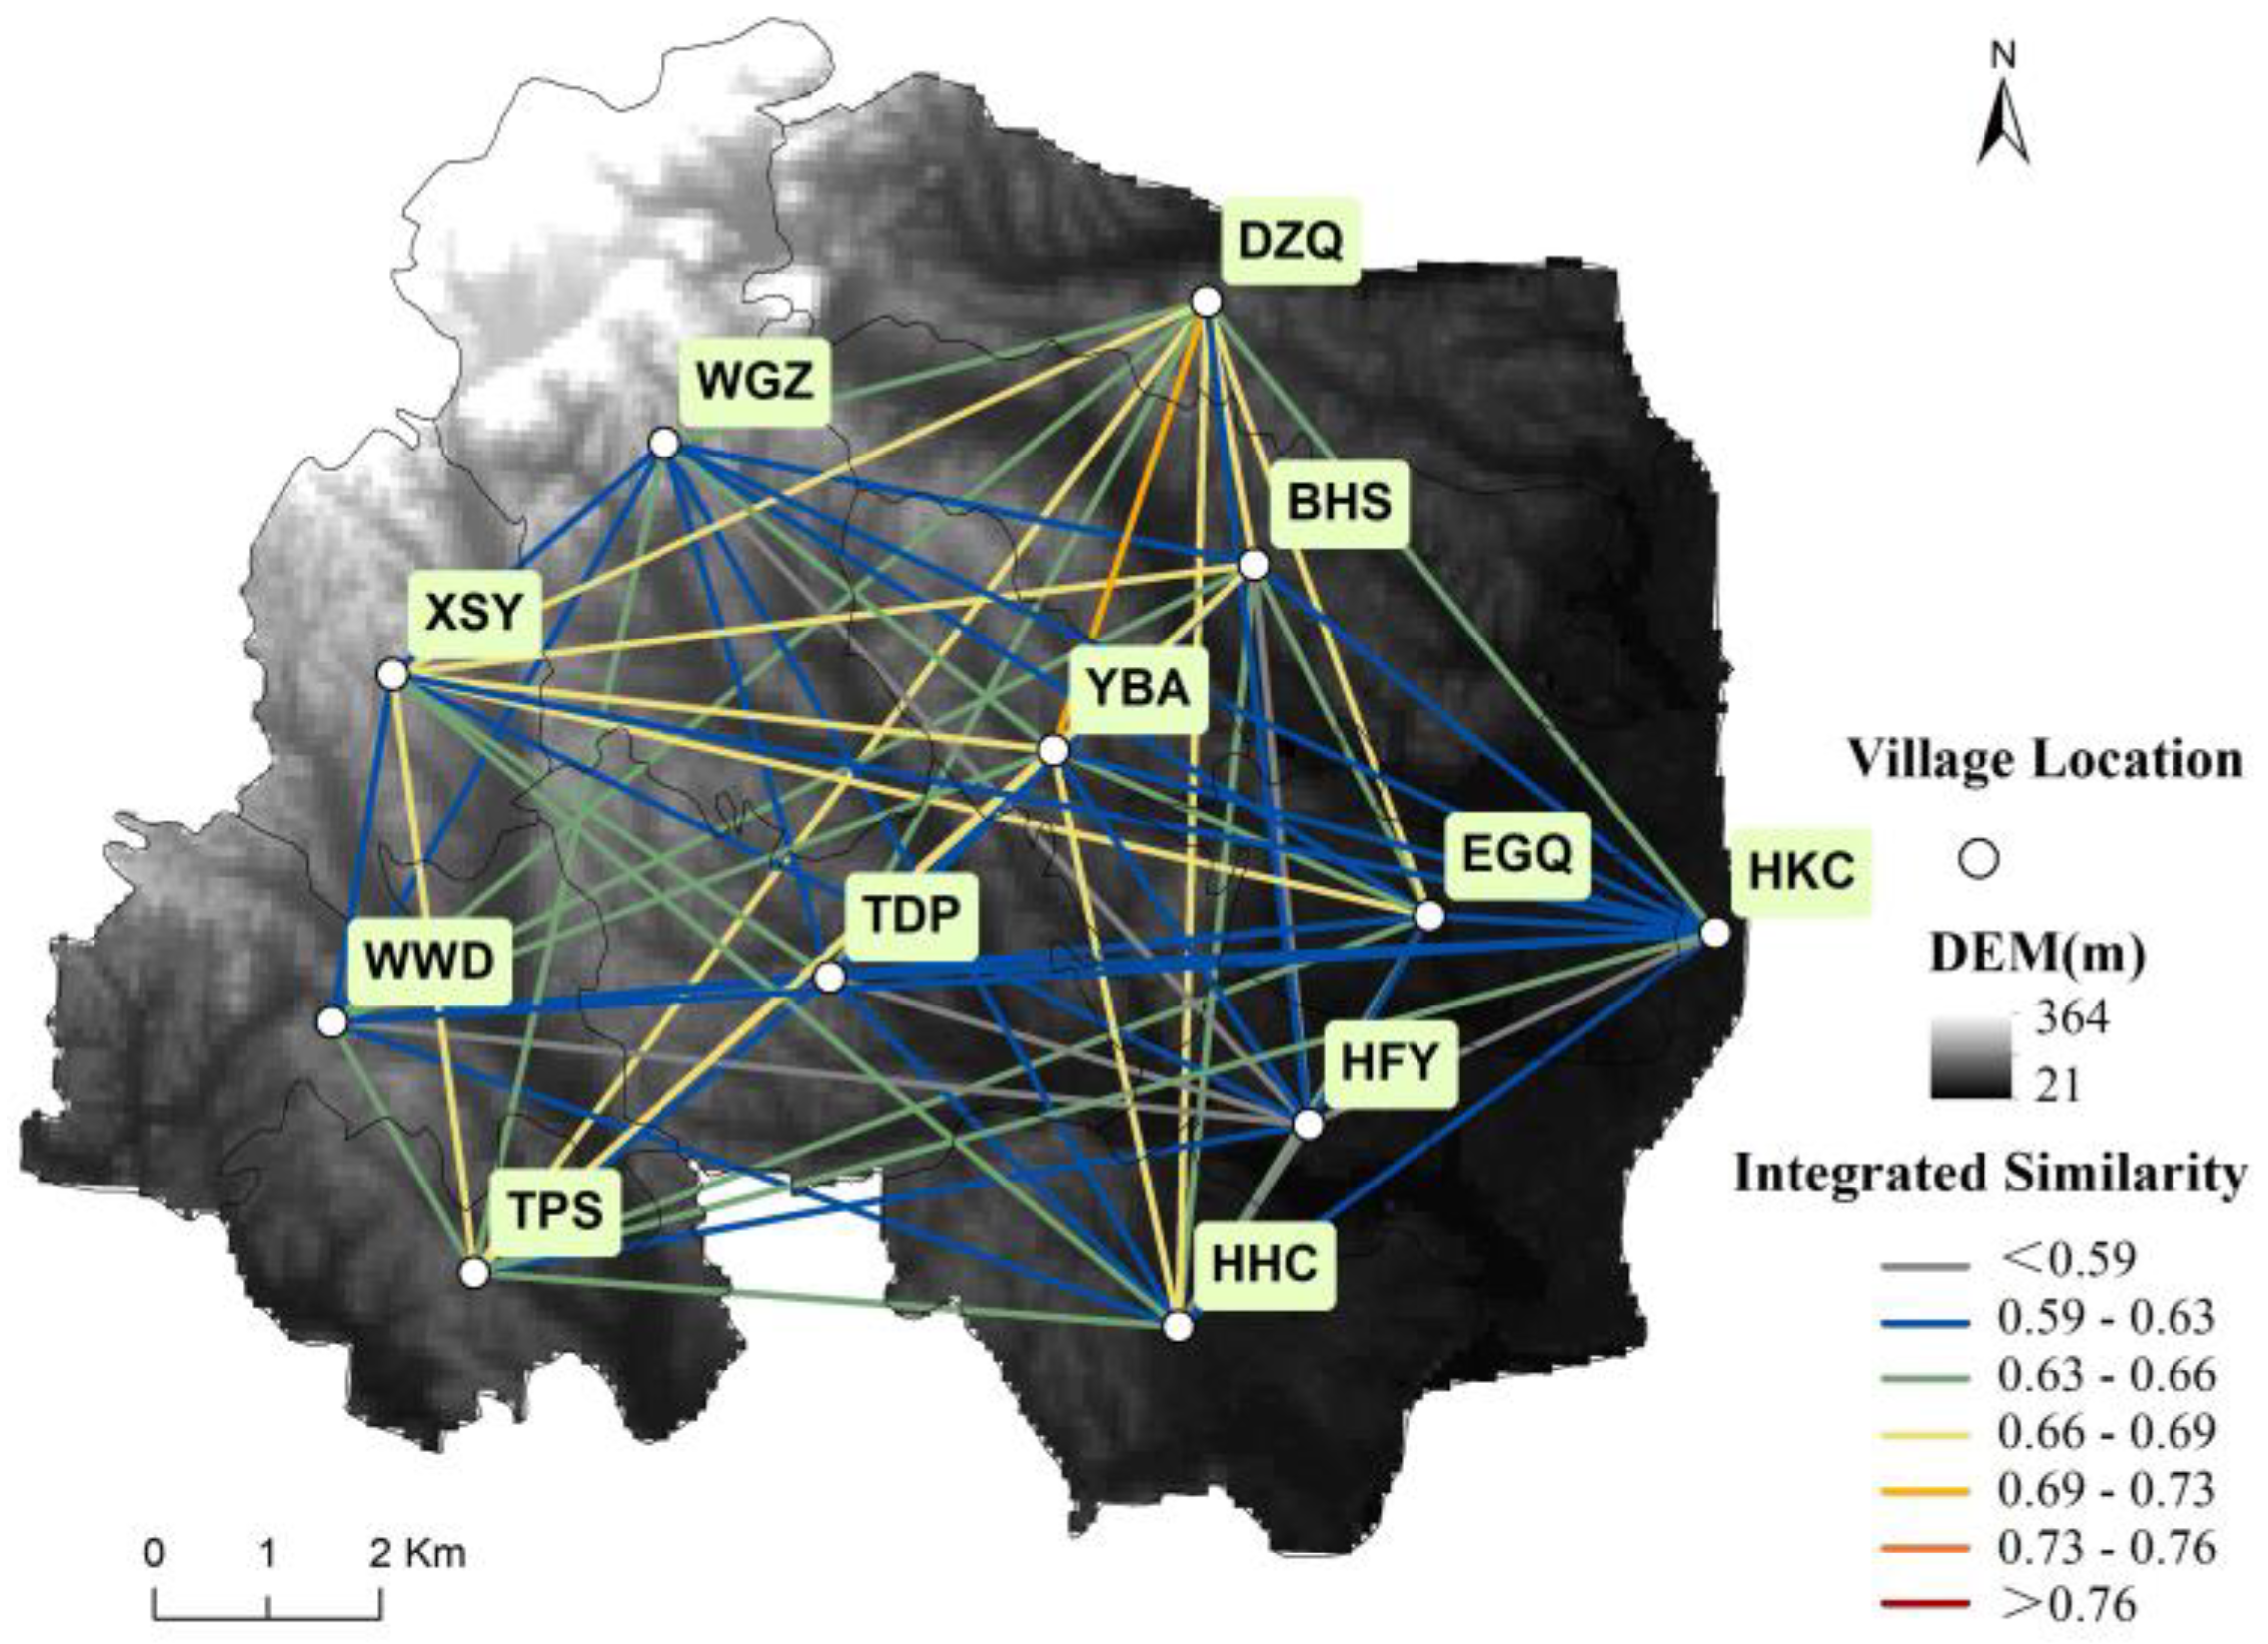
We explored the perception similarity among households in each pair of villages (Figure 6). The similarities in most pairs was below 0.66, which indicates a low similarity between households in different villages. Households in BHS, DZQ, and YBA showed higher similarities with other villages, the average values being 0.646, 0.662, and 0.652, respectively. Generally, the villages in the central and northern parts showed higher similarities with other villages, followed, in that order, by villages in the western and southern parts. The similarity values were the lowest in the north-western, south-western, and eastern parts of the study area. Moreover, villages downstream of rivers, such as HFY, HKC, and EGQ, showed lower similarities with other villages. These villages were relatively affluent. The majority was more positive towards the construction of local structures for water conservation compared to the less affluent villages (such as TPS and WWD). We can see that economic development and greater access to water conservation structures may greatly improve the similarities in perception, thereby improving the extent of cooperation in combating drought.
3.2. Similarity of Perception Among Village Committees
Compared to the perceptions of households, those of village committees were more uniform. The average value of integrated similarity of them was 0.62, and the standard deviation was 0.11. Only 16% of the values were below 0.5; 62% were between 0.5 and 0.7, and 22% were greater than 0.7. The similarity of perceptions and the proportion of high values of that similarity were slightly higher than those between households. WGZ recorded the maximum variation (0.4), and XSY recorded the minimum (0.03) (Figure 7). In any given village, the perceptions were similar because it was easier for the committees to reach a consensus; however, between different villages, the perceptions were probably affected by the level of economic development and cultural environment of the village, which accounts to some extent for the significant differences in perceptions between committees from different villages. For example, village committees with the highest average similarity reflect the dominance of the secretary of the village party, who lays down the rules for communication. This mechanism to ensure frequent feedback promotes higher levels of similarity. In contrast, committees in the newly merged villages (in 2015) of HHC, TPS, DZQ, and BHS are less familiar with one another, which makes it harder to arrive at shared perceptions.
We also analyzed the similarity in perception between groups of village committees with respect to being prepared for, responding to, and recovering from drought (Figure 8). The average similarity of village committees in drought preparedness, response, and recovery is 0.55, 0.56, and 0.51 respectively. The village committees also differed in ideas, as did households, on the most suitable methods of recovering from drought (c6). With respect to preparedness (Figure 9), the perceptions of village committees in TDP obtained the maximum value being 0.79. With respect to response, WWD obtained a maximum value of 0.83. With respect to recovery, HKC obtained a maximum value of 0.92. Village committees of BHS and HHC showed higher value of similarity in perception throughout the process. In 2015, the per capita annual income of these two villages was 9826 yuan and 9208 yuan, respectively, which placed them among the more affluent villages in Zhoujiadian. In 2016, they received a financial subsidy of 2.207 million yuan and 1.98 million yuan, respectively, which made them the two villages receiving the highest subsidy in Zhoujiadian. Given the level of affluence and such generous support, the village committees were highly satisfied with the local early warning system, water conservation projects, allocation of relief material, and subsidies, which increased the degree of similarity in perception to some extent.
The perception similarities among village committees in each pair of villages were greater than 0.66 (Figure 10), which indicates highly similar perceptions of village committees in any pair. The village committee represents the grassroots self-governing organization in China with democratic functioning and enjoys great autonomy. With respect to drought resistance, most of the committees will consider the matter from the viewpoint of an entire township. The committees of BHS, EGQ, TDP, and DZQ showed greater values of similarity than those any of the other villages, the average values being 0.725, 0.723, 0.742, and 0.710, respectively On the whole, villages at lower altitudes scored higher than other villages, followed by the central and northern villages, whereas the lowest values were seen in the villages in the western and southern parts of the study area
3.3. Similarity of Perception among Heterogeneous Stakeholders
Households (abbreviated now on to H), village committees (V), and government managers (G) are the most important groups in the context of resistance to drought. Exploring the relationships among these heterogeneous stakeholders helps in understanding the “soft factors” that affect their collaboration in resisting drought.
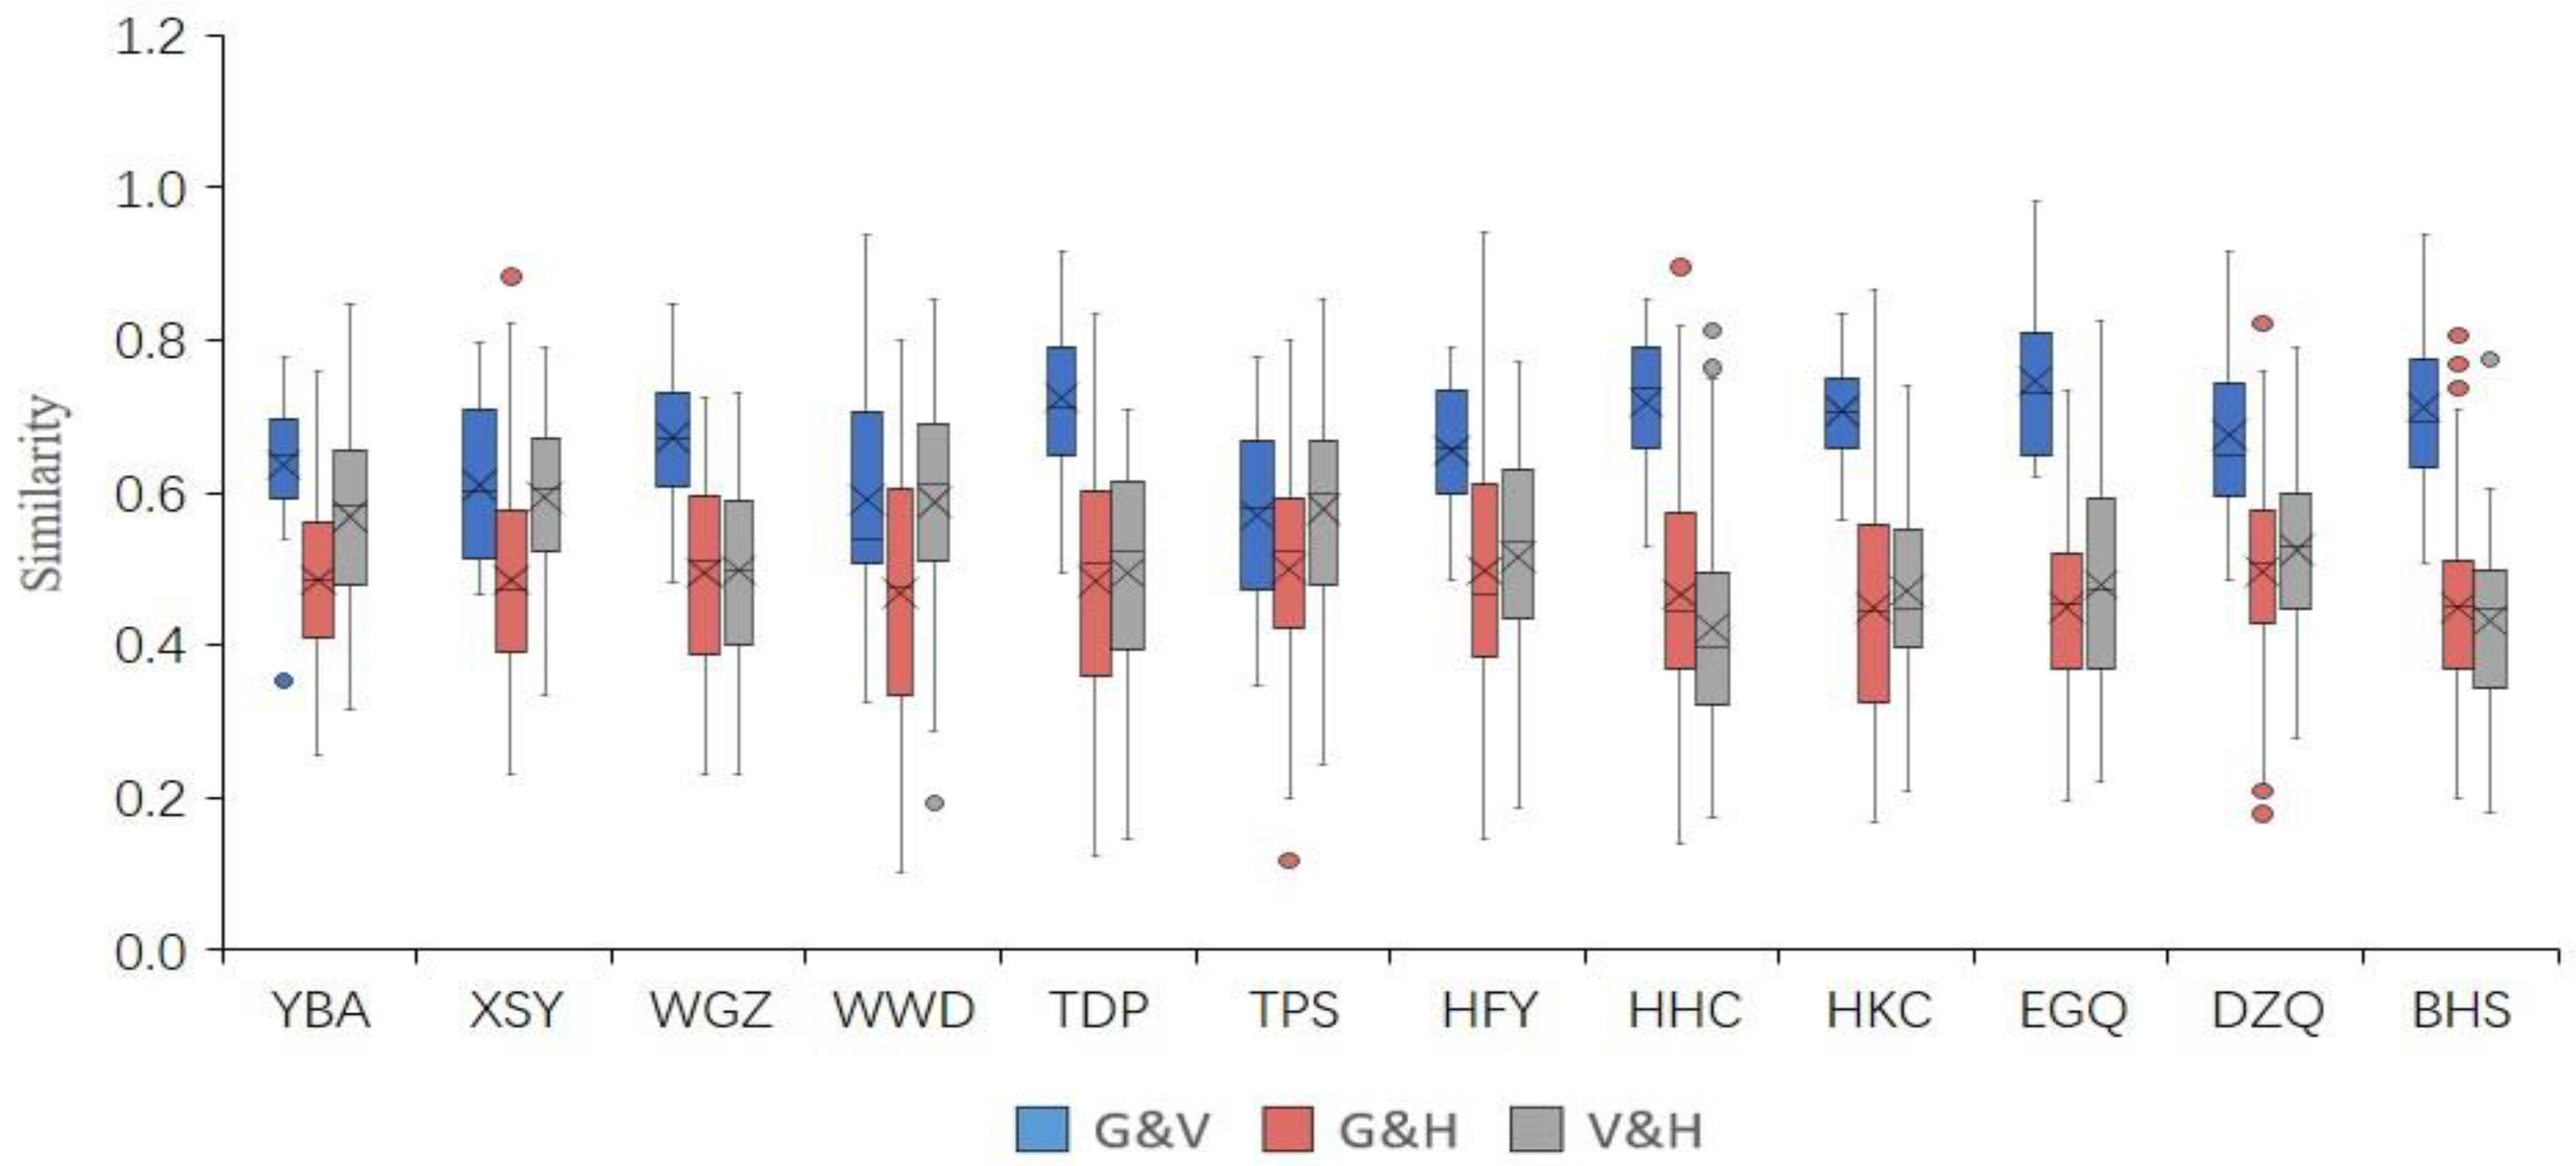
Overall, similarity of perception between individuals of heterogeneous stakeholders showed the following pattern: G&V (it stands for between G and V) > V&H > G&H. The similarity of G&V was generally high: the average was 0.7, and the standard deviation was 0.13; only 8% of the values were below 0.5 (none was below 0.3), 53% were between 0.5 and 0.7, and 40% were greater than 0.7. The similarity of G&H was generally low: the average was 0.48, and the standard deviation was 0.14; 59% of the values were below 0.5, 33% were between 0.5 and 0.7, and only 5% were greater than 0.7. These results indicate a wide gap between the perceptions of government managers and those of the households. The similarity of V&H was generally between that of the two aforementioned categories: the average was 0.51, and the standard deviation was 0.14; 49% of the values were below 0.5, 43% were between 0.5 and 0.7, and only 8% were greater than 0.7.
We plotted the similarity of perception between individuals from the same village (Figure 11): (1) The similarity of perceptions of G&V in each village was generally characterized by a small variation, with the values being distributed mainly between 0.3 and 0.4. Government managers and village committees are usually in close contact with each other, which explains the shared perceptions to some extent. (2) The similarity of perceptions of G&H was generally characterized by a large variation, the values being distributed mainly between 0.5 and 0.8. On issues related to the governance of risk, the households are more concerned about their own interests, whereas the managers tend to consider problems from the viewpoint of regional development, which accounts for the differences in perceptions. (3) The similarity of perceptions of V&H was close to that of G&H.
We calculated the average similarity in perception in each of the corresponding villages to arrive at the similarity of perceptions of the heterogeneous groups. The overall trend showed that the greater the “hierarchical distance”, the lower the similarity, as can be seen in the following results. (1) The average similarity of perceptions of G&V in each village was high overall, ranging from 0.66 in TPS to 0.82 in EGQ. (2) The average similarity of perceptions of G&H was quite low, ranging from 0.45 in EGQ to 0.5 in TPS. (3) The pattern for V&H was close to that of G&H.
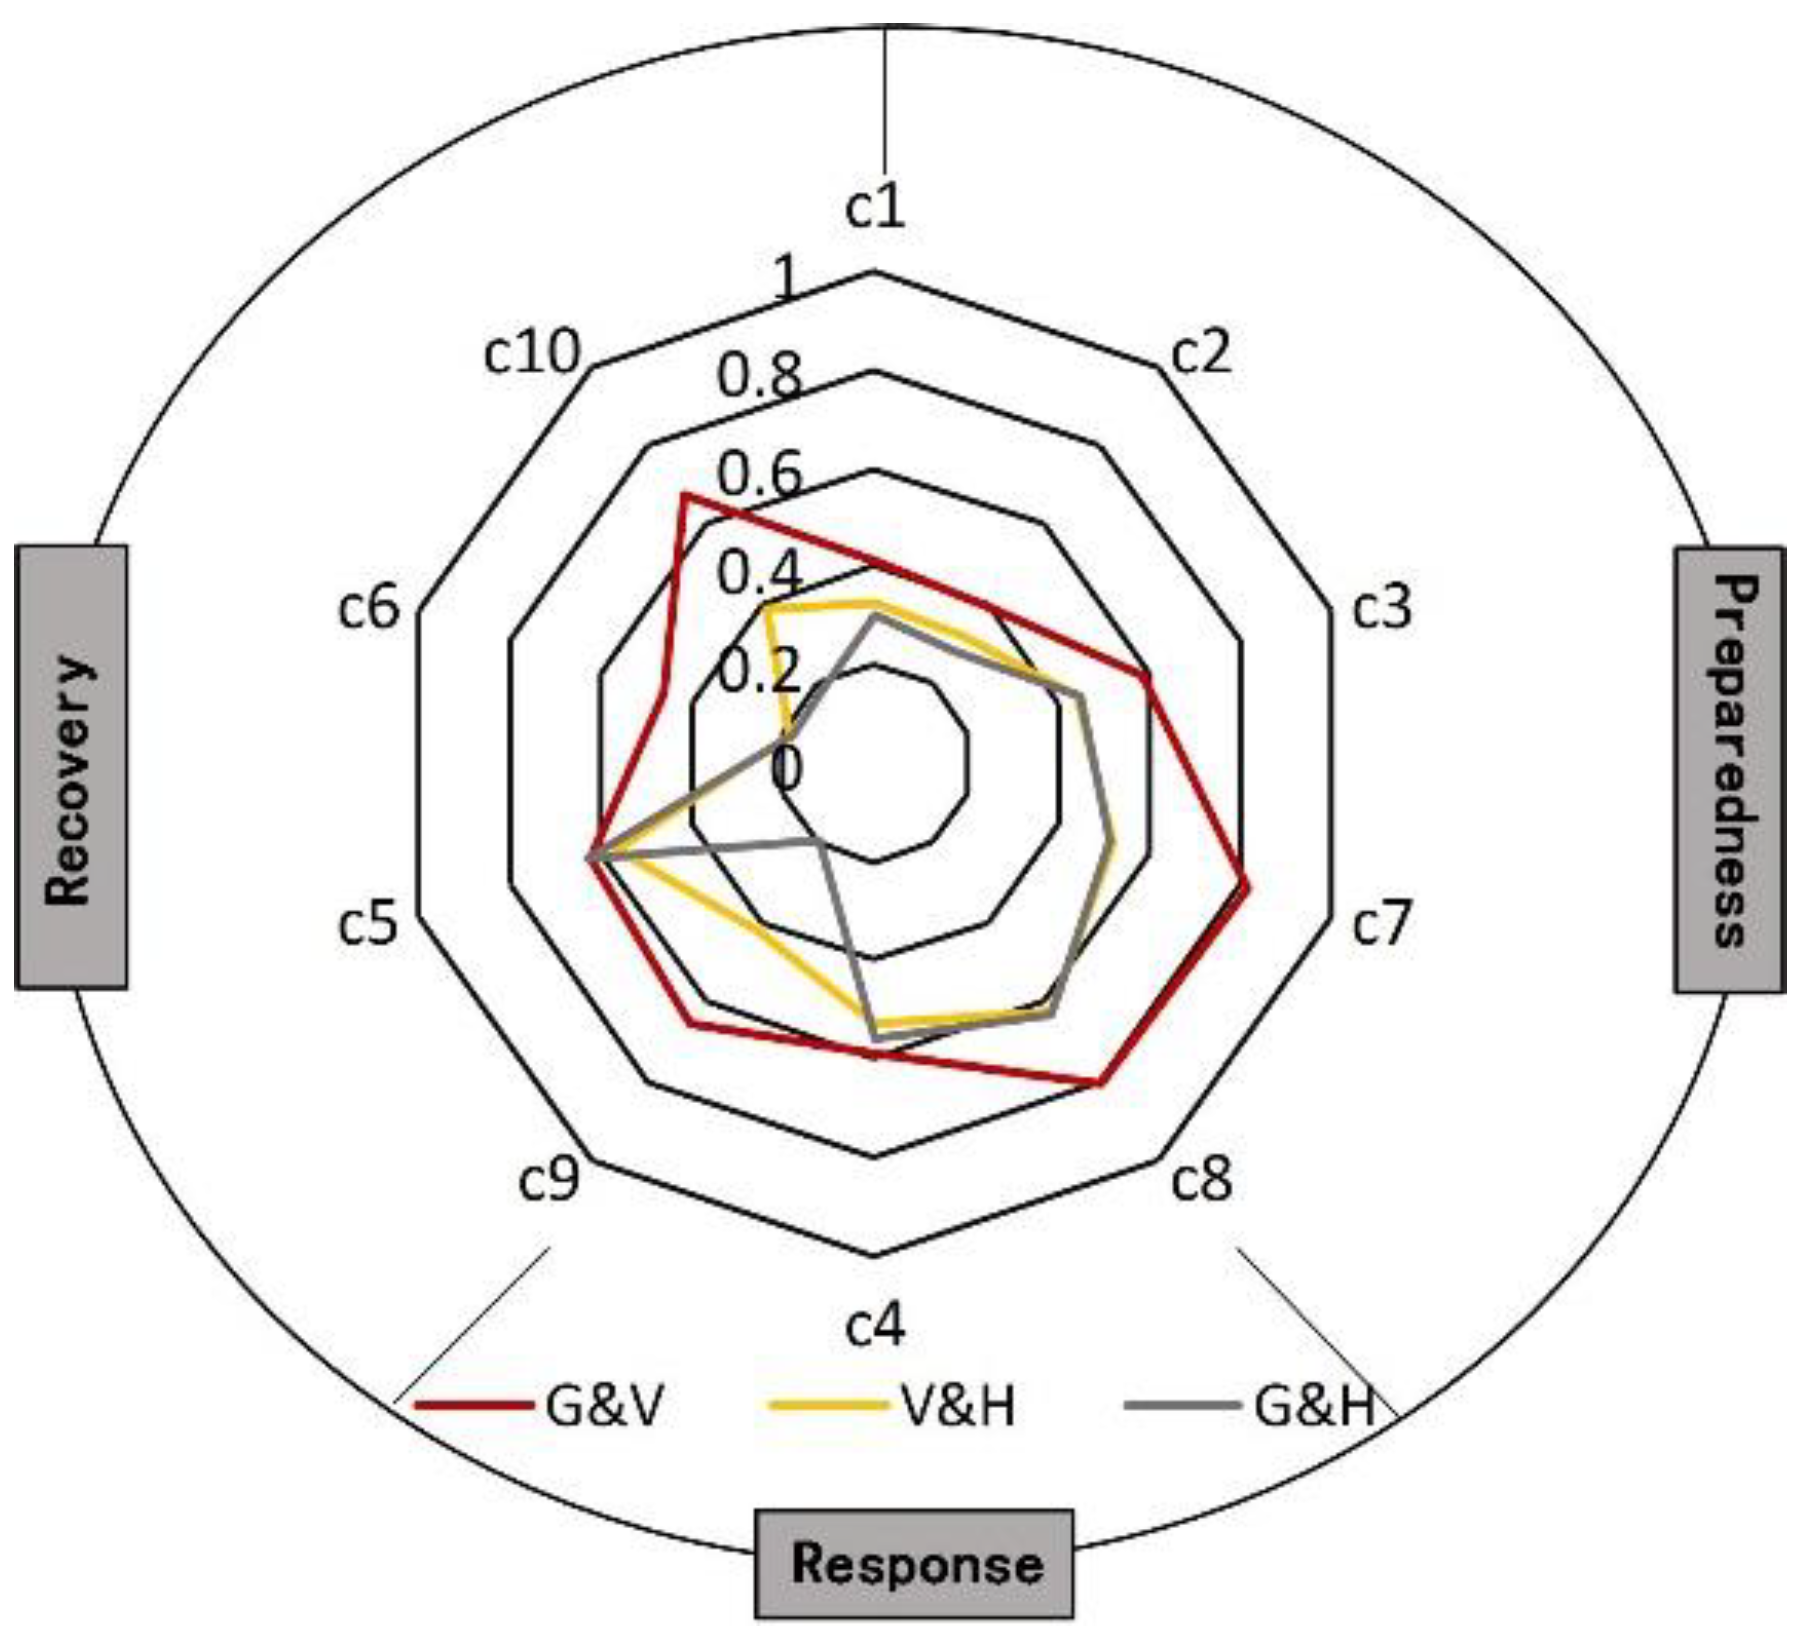
The similarity was very high in the case of G&V for many aspects, whereas that in the case of G&H and of V&H was low with respect to fairness in allocation of funds for relief from drought (C9 was 0.19 and 0.42, respectively), and with respect to appropriate recovery methods (C6 was 0.18 for both) (Figure 12). When asked to rate the fairness of allocating funds for relief from drought, 100% of the managers assigned a rating of 4 and above, whereas only 58.3% of the village committees, and only 8% of the households rated that item in the same way. Low scores on the similarity of perceptions also encourage managers to communicate their work of drought relief to households. When asked about the most effective measure to recover from drought, 25% of the managers chose providing work to the migrants and 87.5% chose replanting; in the case of village committees, 30.6% chose the first option and 50% chose the second, whereas among the households, only 25.5% chose the first option and 16.5% chose the second. This dissimilarity in perceptions points to the need for the leadership to understand what the households want and then offer appropriate help if it wishes to secure greater cooperation from households in combating drought.
3.4. Similarity of Perceptions among ‘Scale-Integration’ Stakeholders
To assess the similarity of perception among the stakeholders on a larger scale, we opted for “scale integration”: calculating the average similarity of perception among homogeneous stakeholders (households and village committees) on the scale of a village to estimate the similarity on the scale of a township, and then compared the two with the similarity of perception among town government managers.
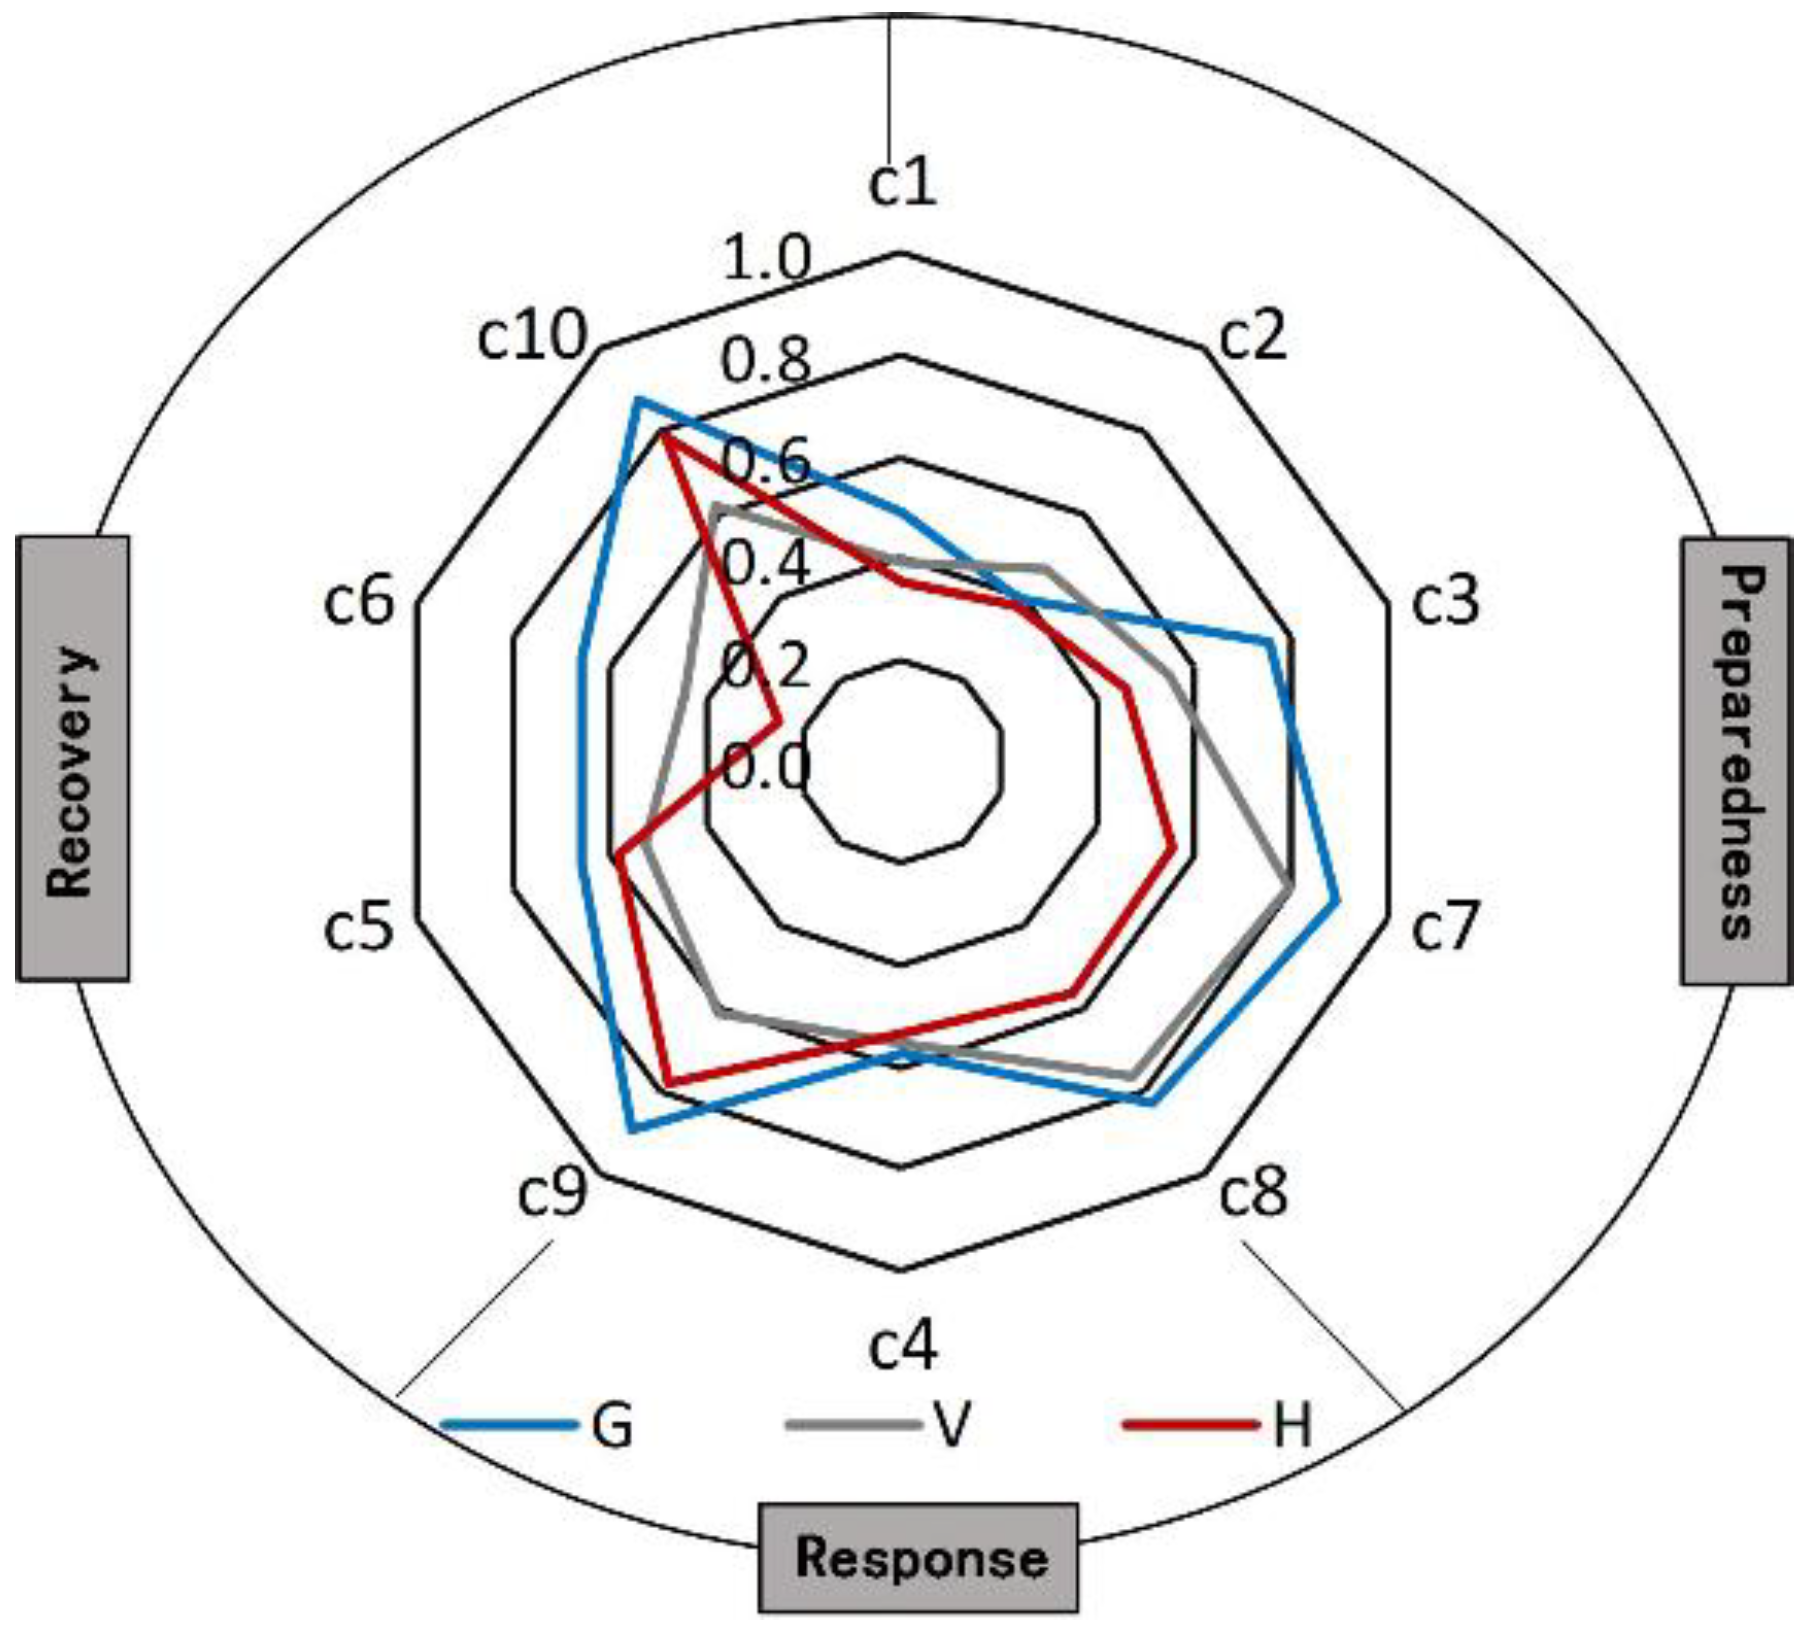
In general, the pattern was G > V > H (Figure 13). The perceptions of the managers were more consistent with respect to drought preparedness, response, and recovery. More organized stakeholders are more likely to have similar perceptions.
These groups have various ideas about methods to conserve water (c2), and methods of drought relief (c4). The similarity of perceptions ranged from 0.38 to 0.47 for c2 and from 0.53 to 0.57 for c4. When asked about the most suitable method to conserve water, 25% of managers chose state intervention, 65% chose participation of households encouraged by state support, and 12.5% chose intervention by the relevant organization; the corresponding percentages were 36.1%, 47.2%, and 16.8% in the case of village committees and 54.8%, 22.9%, and 21.9% in the case of households. When asked about the most effective method of responding to drought, 25% of managers chose artificial rain and 75% chose finding or developing water sources for emergencies; the corresponding percentages were 27.5% and 69.4% in the case of village committees and 16.5% and 69.1% in the case of households. Thus, the different groups of stakeholders preferred different methods of drought relief, an issue that needs better communication in order to find a solution which is acceptable to most people.
4. Discussion
Previous studies have mostly studied risk perception of multiple stakeholders from a single perspective, and have rarely analyzed the relationship between government departments, institutions, enterprises, and individuals from a system perspective, or comprehensively considered their synergy in agricultural drought risk governance. The innovation of the present research is to study the risk perception of multiple stakeholders with systematic thinking; we used “perception similarity” to express the degree of consistency in the perception of various specific issues, which makes up for the shortcomings of the research that only considers the stakeholder’s risk perception without taking into account individual differences. In addition, we constructed a quantitative model of perception similarity and made a case application, which enhances the understanding of the “soft power” of multiple stakeholders and their synergistic cooperation in the process of drought resistance, and opens up a quantifiable way for integrated drought risk governance of multiple stakeholders. In-depth analysis of the following three aspects in the future will promote the development of soft power research on disaster risk governance of multiple stakeholders:
4.1. Impact Factors Influencing Similarity of Perception
To find out the factors that influenced the extent to which the perceptions of different groups were similar, we examined some social and economic factors, and offer some speculations here:
The extent to which the perceptions of the households were similar was negatively correlated to the proportion of interviewed individuals receiving education to the level of junior school or above (Pearson Correlation Coefficient (Hereinafter referred to PCC) of −0.588 at 0.05 level of significance). Education has always been considered an important factor influencing perceptions [47]. Many scholars believe that education helps individuals to form their own perspectives on many issues [48,49]: in the present case, this can account for households’ greater divergence in thinking regarding the issues of drought risk governance, which partly explains the negative correlation between the level of education and similarity of perceptions.
The extent to which the perceptions of V and of G&V were similar was positively correlated to per capita income (PCC is 0.622 and 0.637 at 0.05 level of significance). Some studies have reported that the higher the level of economic development, the greater the inclination to adopt measures to deal with risk [50,51]. Adequate funds can effectively support managers in allocating resources more equitably, and to carry out projects to mitigate the adverse effects of disasters more vigorously. Generally speaking, the better the condition of the economy, the better the implementation of measures aimed at disaster mitigation.
On the other hand, the extent to which the perceptions of V&H were similar was negatively correlated to total population (PCC is −0.609 at 0.05 level of significance) and cultivated area (PCC is −0.650), and that in the case of G&H was negatively correlated to the ratio of the primary industry output value (PCC is −0.691 at 0.05 level of significance). The size of the local society (in terms of population, land ownership etc.) affects the disaster risk perceptions of its members [25,52]. These correlations partly show that the households did not trust the managers as much regarding some resource issues such as cultivated area. In future, more in-depth communication and coordination will be needed if the two groups are to cooperate more efficiently in dealing with the regional drought risks.
4.2. Expanding the Study of Similarity of Perception among Multiple Stakeholders
In recent years, cooperation among multiple stakeholders has received extensive attention in the fields of disaster reduction and risk governance [53,54]. Scholars have emphasized cooperation among different stakeholders as a key factor in lowering the risks of disasters effectively [45].
Governments and individuals are often the focus of the research of disaster risk governance, while enterprises are receiving less attention. Enterprises will also bear serious losses because of limited production and sales due to disasters, so perception of enterprises managers of risk governance is crucial for disaster risk reduction [55]. The synergistic cooperation between enterprises managers, governments, households, and institutions is conducive to the exchange of information and funds, and the promotion of management planning. The social network between enterprises with other stakeholders can help improve the efficiency of integration of corporate resources in disaster mitigation, thereby improving the disaster resistance capability of the social-ecological system [56]. Therefore, study of similarity of perceptions in the future should include more types of stakeholders along both vertical and horizontal dimensions. The inclusion of higher-level government departments, for example, will extend the study in the vertical dimension, whereas the inclusion of institutions and enterprises will extend the study in the horizontal dimension.
We did so by way of a preliminary exploration. We attempted to calculate the similarities of perception between heads of enterprises (8 questionnaires, abbreviated to E) and district government managers (7 questionnaires, DG), between E and township government managers (TG), and between DG and TG. The similarities were maximal in the case of DG_TG (superior and subordinate). The similarities in the case of heterogeneous groups were relatively low with respect to the appropriate method of water management (c2), the best method for disaster relief (c4), and the best method for production recovery (c6). These results probably stem from differences in the concerns of each group, and their familiarity with specific aspects of Disaster Risk Reduction. In future, developing such vertical and horizontal multiple stakeholders systems and exploring ways to enhance the efficiency of cooperation will facilitate greater integration of the willingness and the resources in dealing with drought risks.
4.3. The Relationship between Similarity of Perceptions and Consensus
Perception similarity is closely related to another concept that focuses on consciousness, namely “consensus”. Consensus is the similarity in perceptions when multiple stakeholders try to achieve a goal which has directionality. In the study of “consilience”, it emphasizes synergistic cooperation in the system with respect to soft factors: the greater the consensus, the greater the contribution to consilience [45]. Some scholars use the cosine of the vector to express the consensus of the node [57]. The studies provide references for further exploration of the quantitative approach to consensus.
The quantitative model of similarity in the present paper does not distinguish between the positive and the negative. The similarities among households with respect to the fairness of relief funds allocation and agricultural subsidies were very high. Most households considered the allocations to be unfair. Such negative emotions are not conducive to reaching consensus on ways to deal with drought. The present paper attempts to calculate the consensus using Liao’s [58] method, giving positive emotions a positive value and negative emotions a negative value, and calculating the consensus by taking the average of all individual values and normalizing them. Comparing the results of the two methods in the two items (Figure 14), we found the difference: although the households held high similar perceptions, the consensus was very low. In future, based on the study of similarity, we need to distinguish more clearly between the directionality in constructing the consensus model, which will be valuable in calculating consilience and contributing more to dealing with drought risk.
5. Conclusions
Taking Households as the core stakeholder among the three categories of stakeholders studied, perception similarity was examined from the bottom-up perspective. Despite the groups being homogeneous, the differences between the perceptions of their members were large, and the greater the gap between groups in terms of hierarchy, the more marked were the differences. This phenomenon may be summed up as follows. (1). H&H: Individual differences in perceptions being large, and these differences were reflected in their understanding of the causes of drought, of the methods of water management, and of the methods of recovering from drought. (2). H&V: The two groups differed considerably in their perceptions, due mainly to fairness in allocating funds for drought relief and ways of recovering from drought. (3). H&G: The hierarchical distance or the difference in perceptions between households and government agencies was greater than that between households and village committees. The low value was mainly in perceptions with respect to fair allocation of relief funds and ways from recovering from drought. Optimizing the structure and functioning related to drought preparedness, response, and recovery can provide a strategic basis for designing a suitable system for drought integrated risk governance of multiple stakeholders.
The present paper also takes the vertical–horizontal perspective. Along the horizontal dimension are the similarities within each group of household, village committees, and government managers. Along the vertical dimension are the similarities between the three groups. Analyzing the differences between individuals, and exploring the mechanism of cooperation between different groups will help to construct a theoretical framework for the study of consilience, which will be helpful in improving drought integrated risk governance and the ability of regional sustainable development of agriculture.
Author Contributions
Conceptualization, Y.W. and J.W.; Methodology, Y.W. and H.G.; Software, Y.W.; Validation, Y.W. and H.G.; Formal Analysis, Y.W.; Investigation, Y.W. and H.G.; Data Curation, Y.W.; Writing-Original Draft Preparation, Y.W.; Writing-Review & Editing, Y.W., H.G. and J.W.; Visualization, Y.W.; Supervision, J.W.; Project Administration, Y.W. and J.W.; Funding Acquisition, J.W.
Funding
This research was funded by the National Natural Science Foundation of China (NO.: 41671501).
Acknowledgments
We gratefully acknowledge the support of National Natural Science Foundation of China and thanks to Peijun Shi and Xiaobin Hu, both from the Beijing Normal University, China, for their comments to the paper.
Conflicts of Interest
The authors declare no conflict of interest.
Appendix A
Questionnaire
1. Multiple-choice Questions
(1) ( ) In addition to less rainfall, what do you think are the main causes of local drought?
A. Insufficient construction of reservoirs and canals. B. Insufficient labour. C. Excessive irrigation. D. Excessive fertilizer application. E. Poor maintenance of water conservancy facilities. F. Serious water pollution. G. Inappropriate planting structure. H. None
(2) ( ) What kind of construction management method for small-scale water conservation facilities do you think is most suitable for local development?
- A.
- Government dominance in construction and manage.
- B.
- Household dominance and government assistance in construction and management.
- C.
- Household and village collective dominance in construction and management.
- D.
- Organization dominance in construction and management.
- E.
- Social welfare donation dominance in construction and management.
(3) ( ) Which crops do you think are most suitable for local development (multiple choices)?
A. Early-maturing rice. B. Intermediate-duration rice. C. Late-maturing rice. D. Wheat. E. Beans. F. Rape. G. Cotton. H. Vegetables. I. Others.
(4) ( ) In a drought, which of the following measures do you think will most mitigate the impact of drought on agricultural production?
A. Artificial rainfall. B. Developing or finding emergency sources of water.
C. Drought-resistant fertilizers. D. Mulching with straw or gravel. E. Others.
(5) ( ) After the drought, what measure should government take that will be most helpful for production recovery?
A. Promote drought-tolerant varieties. B. Develop water conservation facilities.
C. Subsidize seed and agricultural machinery. D. Provide other opportunities to work. E. Others.
(6) ( ) After the drought, what measure does a household take that will be most helpful for income recovery?
A. Transfer/lease land. B. Seek alternative work. C. Replant with other crops.
D. Seek help from others. E. Others.
2. Likert Scale
| Please indicate the extent to which you agree with each of the statements based on your actual situation. | Disagree Agree |
| 1 2 3 4 5 | |
| Almost all of us can receive drought-warning information. | |
| Almost all of us can benefit from local water conservancy facilities. | |
| The drought relief funds allocation is very fair. | |
| Local agricultural subsidies are very fair after the drought. | |
| I am very concerned about local development and construction. | |
| I love this place very much. |
References
- Van Loon, A.F.; Stahl, K.; Di Baldassarre, G.; Clark, J.; Rangecroft, S.; Wanders, N.; Gleeson, T.; Van Dijk, A.I.J.M.; Tallaksen, L.M.; Hannaford, J.; et al. Drought in a human-modified world: Reframing drought definitions, understanding, and analysis approaches. Hydrol. Earth Syst. Sci. 2016, 20, 3631–3650. [Google Scholar] [CrossRef]
- Stahl, K.; Kohn, I.; Blauhut, V.; Urquijo, J.; De Stefano, L.; Acacio, V.; Dias, S.; Stagge, J.H.; Tallaksen, L.M.; Kampragou, E.; et al. Impacts of european drought events: Insights from an international database of text-based reports. Nat. Hazard Earth Syst. 2016, 16, 801–819. [Google Scholar] [CrossRef]
- Carleton, T.A.; Hsiang, S.M. Social and economic impacts of climate. Science 2016, 353, aad9837. [Google Scholar] [CrossRef] [PubMed]
- Food and Agriculture Organization (FAO). The Impact of Disasters and Crises on Agriculture and Food Security; FAO: Roma, Italy, 2018; ISBN 978-92-5-130359-7. [Google Scholar]
- Yao, W. Flood and Drought Disaster Report of China; China Map Press: Beijing, China, 2017; pp. 30–39. ISBN 978-7-5031-9925-7. [Google Scholar]
- Pulwarty, R.S.; Sivakumar, M.V. Information systems in a changing climate: Early warnings and drought risk management. Weather Clim. Extremes 2014, 3, 14–21. [Google Scholar] [CrossRef]
- McBean, G.A. Integrating disaster risk reduction towards sustainable development. Curr. Opin. Environ. Sustain. 2012, 4, 122–127. [Google Scholar] [CrossRef]
- Bachmair, S.; Stahl, K.; Collins, K.; Hannaford, J.; Acreman, M.; Svoboda, M.; Knutson, C.; Smith, K.H.; Wall, N.; Fuchs, B.; et al. Drought indicators revisited: The need for a wider consideration of environment and society. Water 2016, 3, 516–536. [Google Scholar] [CrossRef]
- Bachmair, S.; Svensson, C.; Prosdocimi, I.; Hannaford, J.; Stahl, K. Developing drought impact functions for drought risk management. Nat. Hazard Earth Syst. 2017, 17, 1947–1960. [Google Scholar] [CrossRef]
- Le Dé, L.; Rey, T.; Leone, F.; Gilbert, D. Sustainable livelihoods and effectiveness of disaster responses: A case study of tropical cyclone pam in vanuatu. Nat. Hazards 2018, 91, 1203–1221. [Google Scholar] [CrossRef]
- Blauhut, V.; Stahl, K.; Stagge, J.H.; Tallaksen, L.M.; De Stefano, L.; Vogt, J. Estimating drought risk across europe from reported drought impacts, drought indices, and vulnerability factors. Hydrol. Earth Syst. Sci. 2016, 20, 2779–2800. [Google Scholar] [CrossRef]
- Annan, F.; Schlenker, W. Federal crop insurance and the disincentive to adapt to extreme heat. Am. Econ. Rev. 2015, 105, 262–266. [Google Scholar] [CrossRef]
- Sendai Framework for Disaster Risk Reduction. Available online: https://www.unisdr.org/we/coordinate/sendai-framework (accessed on 18 March 2015).
- Thaler, T.; Priest, S. Partnership funding in flood risk management: New localism debate and policy in england. Area 2014, 46, 418–425. [Google Scholar] [CrossRef]
- Challies, E.; Newig, J.; Thaler, T.; Kochskämper, E.; Levin-Keitel, M. Participatory and collaborative governance for sustainable flood risk management: An emerging research agenda. Environ. Sci. Policy 2016, 55, 275–280. [Google Scholar] [CrossRef] [Green Version]
- Lu, Y.; Xu, D.; Wang, Q.; Xu, J. Multi-stakeholder collaboration in community post-disaster reconstruction: Case study from the longmen shan fault area in china. Environ. Hazards 2018, 17, 85–106. [Google Scholar] [CrossRef]
- Shi, P.; Jaeger, C.; Ye, Q. Integrated Risk Governance: Science Plan and Case Studies of Large-Scale Disasters; Beijing Normal University Press and Springer Science & Business Media: Beijing, China; Berlin/Heidelberg, Germany, 2012; pp. 71–89. ISBN 978-3-642-31640-1. [Google Scholar]
- Cretney, R.M. Beyond public meetings: Diverse forms of community led recovery following disaster. Int. J. Disaster Risk Reduction 2018, 28, 122–130. [Google Scholar] [CrossRef]
- Thaler, T.; Loschner, L.; Hartmann, T. The introduction of catchment-wide co-operations: Scalar reconstructions and transformation in austria in flood risk management. Land Use Policy 2017, 68, 563–573. [Google Scholar] [CrossRef]
- Thaler, T.; Levin-Keitel, M. Multi-level stakeholder engagement in flood risk management—A question of roles and power: Lessons from england. Environ. Sci. Policy 2016, 55, 292–301. [Google Scholar] [CrossRef]
- Seebauer, S.; Ortner, S.; Babcicky, P.; Thaler, T. Bottom-up citizen initiatives as emergent actors in flood risk management: Mapping roles, relations and limitations. J. Flood Risk Manag. 2018, e12468. [Google Scholar] [CrossRef]
- Edelenbos, J.; Van Buuren, A.; Roth, D.; Winnubst, M. Stakeholder initiatives in flood risk management: Exploring the role and impact of bottom-up initiatives in three ‘room for the river’ projects in the netherlands. J. Environ. Plan. Manag. 2017, 60, 47–66. [Google Scholar] [CrossRef] [Green Version]
- Kapucu, N. Collaborative governance in international disasters: Nargis cyclone in myanmar and sichuan earthquake in china cases. Int. J. Emerg. Manag. 2011, 8, 1–25. [Google Scholar] [CrossRef]
- Perry, R.W.; Lindell, M.K. Volcanic risk perception and adjustment in a multi-hazard environment. J. Volcanol. Geotherm. Res. 2008, 172, 170–178. [Google Scholar] [CrossRef]
- Fuchs, S.; Karagiorgos, K.; Kitikidou, K.; Maris, F.; Paparrizos, S.; Thaler, T. Flood risk perception and adaptation capacity: A contribution to the socio-hydrology debate. Hydrol. Earth Syst. Sci. 2017, 21, 3183–3198. [Google Scholar] [CrossRef]
- Mercado, R.M. People’s risk perceptions and responses to climate change and natural disasters in Baseco Compound, Manila, Philippines. Procedia Environ. Sci. 2016, 34, 490–505. [Google Scholar] [CrossRef]
- Su, Y.; Zhao, F.; Tan, L. Whether a large disaster could change public concern and risk perception: A case study of the 7/21 extraordinary rainstorm disaster in beijing in 2012. Nat. Hazards 2015, 78, 555–567. [Google Scholar] [CrossRef]
- Sun, Y.; Zhou, H.; Wall, G.; Wei, Y. Cognition of disaster risk in a tourism community: An agricultural heritage system perspective. J. Sustain. Tourism 2017, 25, 536–553. [Google Scholar] [CrossRef]
- Xu, D.; Peng, L.; Liu, S.; Wang, X. Influences of risk perception and sense of place on landslide disaster preparedness in southwestern China. Int. J. Disaster Risk Sci. 2018, 1–14. [Google Scholar] [CrossRef]
- Ouedraogo, M.; Barry, S.; Zougmore, R.B.; Partey, S.T.; Some, L.; Baki, G. Farmers’ willingness to pay for climate information services: Evidence from cowpea and sesame producers in Northern Burkina Faso. Sustainability 2018, 10, 611–626. [Google Scholar] [CrossRef]
- Ye, T.; Wang, M. Exploring risk attitude by a comparative experimental approach and its implication to disaster insurance practice in china. J. Risk Res. 2013, 16, 861–878. [Google Scholar] [CrossRef]
- Wang, M.; Liao, C.; Yang, S.; Zhao, W.; Liu, M.; Shi, P. Are people willing to buy natural disaster insurance in china? Risk awareness, insurance acceptance, and willingness to pay. Risk Anal. 2012, 32, 1717–1740. [Google Scholar] [CrossRef] [PubMed]
- Bird, D.K. The use of questionnaires for acquiring information on public perception of natural hazards and risk mitigation-a review of current knowledge and practice. Nat. Hazard Earth Syst. 2009, 9, 1307–1325. [Google Scholar] [CrossRef]
- Johnson, J. Social Cohesion: An Investigation into Post-Earthquake Christchurch. Bachelor’s Thesis, Lincoln University, Lincoln, New Zealand, 2015. [Google Scholar]
- Cao, X.; Jiang, X.; Li, X.; Lo, M.-C.J.H.; Li, R. Family functioning and its predictors among disaster bereaved individuals in china: Eighteen months after the wenchuan earthquake. PLoS ONE 2013, 8, e60738. [Google Scholar] [CrossRef] [PubMed] [Green Version]
- Genius, M.; Koundouri, P.; Nauges, C.; Tzouvelekas, V. Information transmission in irrigation technology adoption and diffusion: Social learning, extension services, and spatial effects. Am. J. Agric. Econ. 2013, 96, 328–344. [Google Scholar] [CrossRef]
- Chen, H.; Wang, J.; Huang, J. Policy support, social capital, and farmers’ adaptation to drought in china. Glob. Environ. Chang. 2014, 24, 193–202. [Google Scholar] [CrossRef]
- Deressa, T.T.; Hassan, R.M.; Ringler, C.; Alemu, T.; Yesuf, M. Determinants of farmers’ choice of adaptation methods to climate change in the nile basin of ethiopia. Glob. Environ. Chang. 2009, 19, 248–255. [Google Scholar] [CrossRef]
- Cabrerizo, F.J.; Al-Hmouz, R.; Morfeq, A.; Balamash, A.S.; Martinez, M.A.; Herrera-Viedma, E. Soft consensus measures in group decision making using unbalanced fuzzy linguistic information. Soft Comput. 2017, 21, 3037–3050. [Google Scholar] [CrossRef]
- Herrera-Viedma, E.; Javier Cabrerizo, F.; Kacprzyk, J.; Pedrycz, W. A review of soft consensus models in a fuzzy environment. Inf. Fusion 2014, 17, 4–13. [Google Scholar] [CrossRef]
- Tversky, A. Features of similarity. Psychol. Rev. 1977, 84, 327–352. [Google Scholar] [CrossRef]
- Suppes, P.; Krantz, D.H. Foundations of Measurement: Geometrical, Threshold, and Probabilistic Representations; Courier Corporation: North Chelmsford, MA, USA, 2007; Volume 2, ISBN 0-486-45315-4. [Google Scholar]
- Rada, R.; Mili, H.; Bicknell, E.; Blettner, M. Development and application of a metric on semantic nets. IEEE Trans. Syst. Man Cybern. 1989, 19, 17–30. [Google Scholar] [CrossRef]
- Schwering, A. Approaches to semantic similarity measurement for geo-spatial data: A survey. Trans. GIS 2008, 12, 5–29. [Google Scholar] [CrossRef]
- Shi, P.; Wang, M.; Hu, X.; Ye, T. Integrated risk governance consilience mode of social-ecological systems. Acta Geogr. Sin. 2014, 69, 863–876. [Google Scholar] [CrossRef]
- Zhou, H.J.; Wang, X.; Wang, J.A. A way to sustainability: Perspective of resilience and adaptation to disaster. Sustainability 2016, 8, 737–750. [Google Scholar] [CrossRef]
- Tang, J.; Folmer, H.; Xue, J. Estimation of awareness and perception of water scarcity among farmers in the guanzhong plain, china, by means of a structural equation model. J. Environ. Manag. 2013, 126, 55–62. [Google Scholar] [CrossRef] [PubMed]
- Feng, W.; Reisner, A. Factors influencing private and public environmental protection behaviors: Results from a survey of residents in shaanxi, china. J. Environ. Manag. 2011, 92, 429–436. [Google Scholar] [CrossRef] [PubMed]
- Stapp, W.B. The concept of environmental education. Environ. Educ. 1969, 1, 30–31. [Google Scholar] [CrossRef]
- Fothergill, A.; Peek, L.A. Poverty and disasters in the united states: A review of recent sociological findings. Nat. Hazards 2004, 32, 89–110. [Google Scholar] [CrossRef]
- Duinen, R.V.; Filatova, T.; Geurts, P.; Veen, A.V.D. Empirical analysis of farmers’ drought risk perception: Objective factors, personal circumstances, and social influence. Risk Anal. 2015, 35, 741–755. [Google Scholar] [CrossRef] [PubMed]
- Sjöberg, L. Factors in risk perception. Risk Anal. 2000, 20, 1–12. [Google Scholar] [CrossRef] [PubMed]
- Dilling, L.; Berggren, J. What do stakeholders need to manage for climate change and variability? A document-based analysis from three mountain states in the western USA. Reg. Environ. Chang. 2015, 15, 657–667. [Google Scholar] [CrossRef]
- Cronin, S.J.; Petterson, M.G.; Taylor, P.W.; Biliki, R. Maximising multi-stakeholder participation in government and community volcanic hazard management programs; a case study from savo, solomon islands. Nat. Hazards 2004, 33, 105–136. [Google Scholar] [CrossRef]
- Johnson, D.A.; Abe, Y. Global overview on the role of the private sector in disaster risk reduction: Scopes, challenges, and potentials. In Disaster Management and Private Sectors; Izumi, T., Shaw, R., Eds.; Springer: Berlin, Germany, 2015; pp. 11–29. ISBN 978-4-431-55413-4. [Google Scholar]
- Haigh, R.; Sutton, R. Strategies for the effective engagement of multi-national construction enterprises in post-disaster building and infrastructure projects. Int. J. Disaster Resilience Built Environ. 2012, 3, 270–282. [Google Scholar] [CrossRef]
- Hu, X.; Shi, P.; Wang, M.; Ye, T.; Leeson, M.S. Consilience degree—A new network property to evaluate system’s performance against disturbances. SCIENTIA SINICA Informationis 2014, 44, 1467–1481. [Google Scholar] [CrossRef]
- Liao, H.; Xu, Z.; Zeng, X.-J. Distance and similarity measures for hesitant fuzzy linguistic term sets and their application in multi-criteria decision making. Inf. Sci. 2014, 271, 125–142. [Google Scholar] [CrossRef]
Figure 1.
Location of Zhoujiadian town (a) position of Dingcheng district in China; (b) elevation map of Dingcheng district; (c) remote sensing image of Zhoujiadian town; (d) partial landscape image of Zhoujiadian.
Figure 1.
Location of Zhoujiadian town (a) position of Dingcheng district in China; (b) elevation map of Dingcheng district; (c) remote sensing image of Zhoujiadian town; (d) partial landscape image of Zhoujiadian.

Figure 2.
a, Inter-annual variation of the average temperature (red line). The black dotted line represents the fit to the data: y = 0.0005x2 − 1.7933x + 1770.9 (R2 = 0.384), showing an up-trend. b, Inter-annual variation of the relative humidity (blue line). The black curve represents the fit to the data: y = −0.008x2 + 31.456x − 30972 (R2 = 0.719), showing an obvious downtrend in the humidity. c, Observed annual high temperature (red line). The black dotted line represents the fit to the data: y = 0.0012x2 − 4.5612x + 4548.6 (R2 = 0.177) and confirms a slight upward trend.

Figure 3.
Similarity between households in each village.

Figure 4.
Similarity of all households in the process of drought risk governance.

Figure 5.
Similarity of household in each village in the drought preparedness, response and recovery.
Figure 5.
Similarity of household in each village in the drought preparedness, response and recovery.

Figure 6.
Comparison of similarity of household in “cross-villages”.

Figure 7.
Similarity between village committees in each village.

Figure 8.
Similarity of village committee in the process drought risk governance.

Figure 9.
Similarity of village committee in the drought preparedness, response, and recovery.

Figure 10.
Comparison of similarities of village committee in “cross-village”.

Figure 11.
Similarity between heterogeneous stakeholders (G&V, G&H and V&H).

Figure 12.
Similarity of heterogeneous stakeholder in the process of drought risk governance.

Figure 13.
Similarity of homogeneous stakeholder in the process of the drought risk governance at township scale.
Figure 13.
Similarity of homogeneous stakeholder in the process of the drought risk governance at township scale.

Figure 14.
Comparison of “Perception Similarity” (a) and “Consensus of Consilience” (b) of homogeneous stakeholders (Normalized).
Figure 14.
Comparison of “Perception Similarity” (a) and “Consensus of Consilience” (b) of homogeneous stakeholders (Normalized).


Table 1.
List of basic geographic data and fieldwork data of study area.
| Type | Source | Contents | Year | |
|---|---|---|---|---|
| Basic Geographic data | Administrative division | Civil Affairs Bureau, Dingcheng district | Administrative boundaries of the county and township | 2017 |
| Images | Google Earth | Remote sensing images of Dingcheng district | 2016 | |
| Meteorological data | China Meteorological Administration Meteorological Data Centre <http://data.cma.cn> | Average temperature, precipitation, average relative humidity, maximum temperature | 1960–2014 daily data | |
| Fieldwork data | Socio-economic data | Local government for Zhoujiadian | Agricultural population, number of rural labour, cultivated area, area sown with grain and grain yield, per capita income of households | 2011–2015 |
| Perception data | Questionnaires | Perceptions of multiple stakeholders of governance of the risk of drought | 2017 |
Table 2.
Perceptions indicator system of drought risk governance (Integrated Similarity).
| First Level | Second Level (Basic Similarity) | Process | Form | |
|---|---|---|---|---|
| Similarity | Cognition | Drought reason (c1) | Preparedness | Multi-choice questions |
| Water conversancy (c2) | ||||
| Planting species (c3) | ||||
| Relief method (c4) | Response | |||
| Production recovery method(government view) (c5) | Recovery | |||
| Production recovery method (households’ view) (c6) | Recovery | |||
| Perception of fairness | Delivery of advance warning about drought (c7) | Preparedness | Likert scale | |
| Benefits from water conservation facilities (c8) | ||||
| Allocation of relief funds (c9) | Response | |||
| Agricultural subsidies (c10) | Recovery | |||
| Sense of belonging | Degree of concern for hometown (c11) | Humanistic care | Likert scale | |
| Degree of attachment to hometown (c12) |
© 2018 by the authors. Licensee MDPI, Basel, Switzerland. This article is an open access article distributed under the terms and conditions of the Creative Commons Attribution (CC BY) license (http://creativecommons.org/licenses/by/4.0/).
Share and Cite
MDPI and ACS Style
Wu, Y.; Guo, H.; Wang, J. Quantifying the Similarity in Perceptions of Multiple Stakeholders in Dingcheng, China, on Agricultural Drought Risk Governance. Sustainability 2018, 10, 3219. https://doi.org/10.3390/su10093219
AMA Style
Wu Y, Guo H, Wang J. Quantifying the Similarity in Perceptions of Multiple Stakeholders in Dingcheng, China, on Agricultural Drought Risk Governance. Sustainability. 2018; 10(9):3219. https://doi.org/10.3390/su10093219
Chicago/Turabian StyleWu, Yaoyao, Hao Guo, and Jing’ai Wang. 2018. "Quantifying the Similarity in Perceptions of Multiple Stakeholders in Dingcheng, China, on Agricultural Drought Risk Governance" Sustainability 10, no. 9: 3219. https://doi.org/10.3390/su10093219
Note that from the first issue of 2016, this journal uses article numbers instead of page numbers. See further details here.