Future Projected Changes in Local Evapotranspiration Coupled with Temperature and Precipitation Variation


1
State Key Laboratory of Desert and Oasis Ecology, Xinjiang Institute of Ecology and Geography, Chinese Academy of Sciences, Urumqi 830011, China
2
University of Chinese Academy of Sciences, Beijing 100049, China
3
Department of Geography, Ghent University, 9000 Ghent, Belgium
4
Sino-Belgian Joint Laboratory of Geo-information, Urumqi 830011, China
5
Sino-Belgian Joint Laboratory of Geo-information, 9000 Ghent, Belgium
*
Author to whom correspondence should be addressed.
Sustainability 2018, 10(9), 3281; https://doi.org/10.3390/su10093281
Submission received: 21 June 2018
/
Revised: 7 September 2018
/
Accepted: 10 September 2018
/
Published: 14 September 2018
(This article belongs to the Special Issue Conflict Analysis and Sustainable Management of Water Resources)
Abstract
:Evapotranspiration is the highest outgoing flux in the hydrological cycle in Xinjiang, Northwest China. Quantifying the temporal and spatial patterns of future evapotranspiration is vital to appropriately manage water resources in water shortage drylands. In this study, the Common Land Model (CoLM) was used to estimate the regional evapotranspiration during the period 2021–2050, and its projected changes in response to climate change under two Representative Concentration Pathways (RCP) scenarios (i.e., RCP4.5 and RCP8.5) were analyzed using the Singular Value Decomposition (SVD) technique. The results indicated that the mean regional evapotranspiration was comparable under the two scenarios during 2021–2050, with a value of 127 (±11.9) mm/year under the RCP4.5 scenario, and 124 (±11.1) mm/year under the RCP8.5 scenario, respectively. Compared to the historical period of 1996–2005, the annual mean evapotranspiration during 2041–2050 will marginally decrease by 0.3 mm under the RCP4.5 scenario and by 0.4 mm under the RCP8.5 scenario, respectively. Empirical Orthogonal Function (EOF) analyses show that the evapotranspiration in relative high altitudes of Xinjiang present strong variations. The SVD analyses suggest that the changes in evapotranspiration are more closely linked to local precipitation variations than to temperature. The results would provide reliable suggestions to understand future changed in evapotranspiration and improve the regional strategy for water resource management in Xinjiang.
1. Introduction
Located deep inside the Eurasian continent, the Xinjiang Uyghur Autonomous Region of China is characterized by extremely low precipitation and high temperatures [1]. Water resources are a critical limiting factor for economic and social sustainable development in Xinjiang [2,3]. Under the impact of global warming, the water cycle has intensified, and consequently over the past 50 years the proportion of glacial meltwater runoff has increased significantly [4]. The annual precipitation has also experienced an increase at a rate of 0.67 mm/year [5,6]. As an important component of the hydrological cycle, evapotranspiration is the highest outgoing water flux or a major pathway of water loss in the water budget [7], and thus is a primary factor in determining water availability in Xinjiang [8,9]. Although great efforts have been devoted to investigate the evapotranspiration change in Xinjiang in the past 60 years [10,11,12], how the evapotranspiration will change in the future has not yet been well explored.
The future projection of climate change reported by the 5th Intergovernmental Panel on Climate Change (IPCC) assessment indicated that the global mean temperature will continue to rise for the rest of 21th century, and the amplitude for 2081–2100, relative to 1986–2005 ranges from 0.3 °C to 4.8 °C, under four Representative Concentration Pathways (RCP) scenarios [13]. Hu, et al. [14] reported that Xinjiang has a high potential in temperature rise at a higher rate than the global average and surrounding areas, which means that a higher temperature than the global average will occur in Xinjiang in the near future. The projection of precipitation also showed a prominent increase tendency at the end of the 21st century [15]. Shi, et al. [16] reported that the climate in Xinjiang has been experiencing a change from warm-dry to warm-wet, and the transition is expected to continue into the future. Such changes in climate would exert a profound effect on evapotranspiration. Therefore, a comprehensive analysis of evapotranspiration in response to future change is necessary to assess and understand the future of water cycle and water resource management.
Evapotranspiration changes in response to climate change have been widely conducted at regional and continental scales. Climate factors affecting evapotranspiration include three independent factors: Demand, supply, and energy [17]. Demand depends on air temperature and wind speed, while supply and energy are determined by precipitation and solar radiation, respectively. In particular, Jung, et al. [18] reported that global evapotranspiration experienced a rising trend and correlated well with the interannual variability of the temperature from 1982 to 1997; but the rising trend disappeared after the last big El Niña event in 1998, associated with a decrease in soil moisture dissipated by evapotranspiration. Zhang et al. [17] indicated that from 1982 to 2013, approximately 29% of the global land area shows significant increases in evapotranspiration, mainly driven by a general global warming trend and associated increases in air vapor pressure deficit. In high elevation regions, such as the Tibetan Plateau, the wind stilling and solar dimming together contributed to the decrease of evaporation [19]. In addition, recent studies also suggested that climate factors played the dominant role in determining spatial patterns of water fluxes over large regions [11,20]. It is evident that evapotranspiration changes in response to climate change are divergent with respect to different geographical locations [21]. Therefore, a comprehensive understanding of response of evapotranspiration to climate changes is required on a regional scale.
Land Surface Models (LSMs) are becoming an effective tool in simulating terrestrial evapotranspiration [21,22,23]. However, large uncertainties in simulations still exist in the current stage due to different structures and representations of land–atmosphere interactions among LSMs. In previous studies, attention has been given to the underestimation of the evapotranspiration within arid or semi-arid regions for most LSMs [24,25]. The possible reason is that most LSMs cannot capture the special vegetation structures that deep root systems and high root/shoot radios have been involved in from long-term limits induced by extreme aridity and high temperatures [26]. The associated functioning, such as nonlinear root water uptake and hydraulic redistribution, are not considered in LSMs that mitigate the effect of high temperatures and provide more for supporting evapotranspiration [26,27]. Therefore, a practically applicable land surface model is needed to quantify the changes in evapotranspiration.
In this study, we used the Common Land Model (CoLM) to project the evapotranspiration changes in Xinjiang during the future period 2021–2050. The purposes of this study are: (1) to estimate the temporal and spatial changes of evapotranspiration under middle and highest emission scenarios (i.e., RCP4.5 and RCP8.5); and (2) to investigate the spatial evapotranspiration changes in response to climate factors (i.e., temperature and precipitation).
2. Materials and Methods
2.1. The Study Area
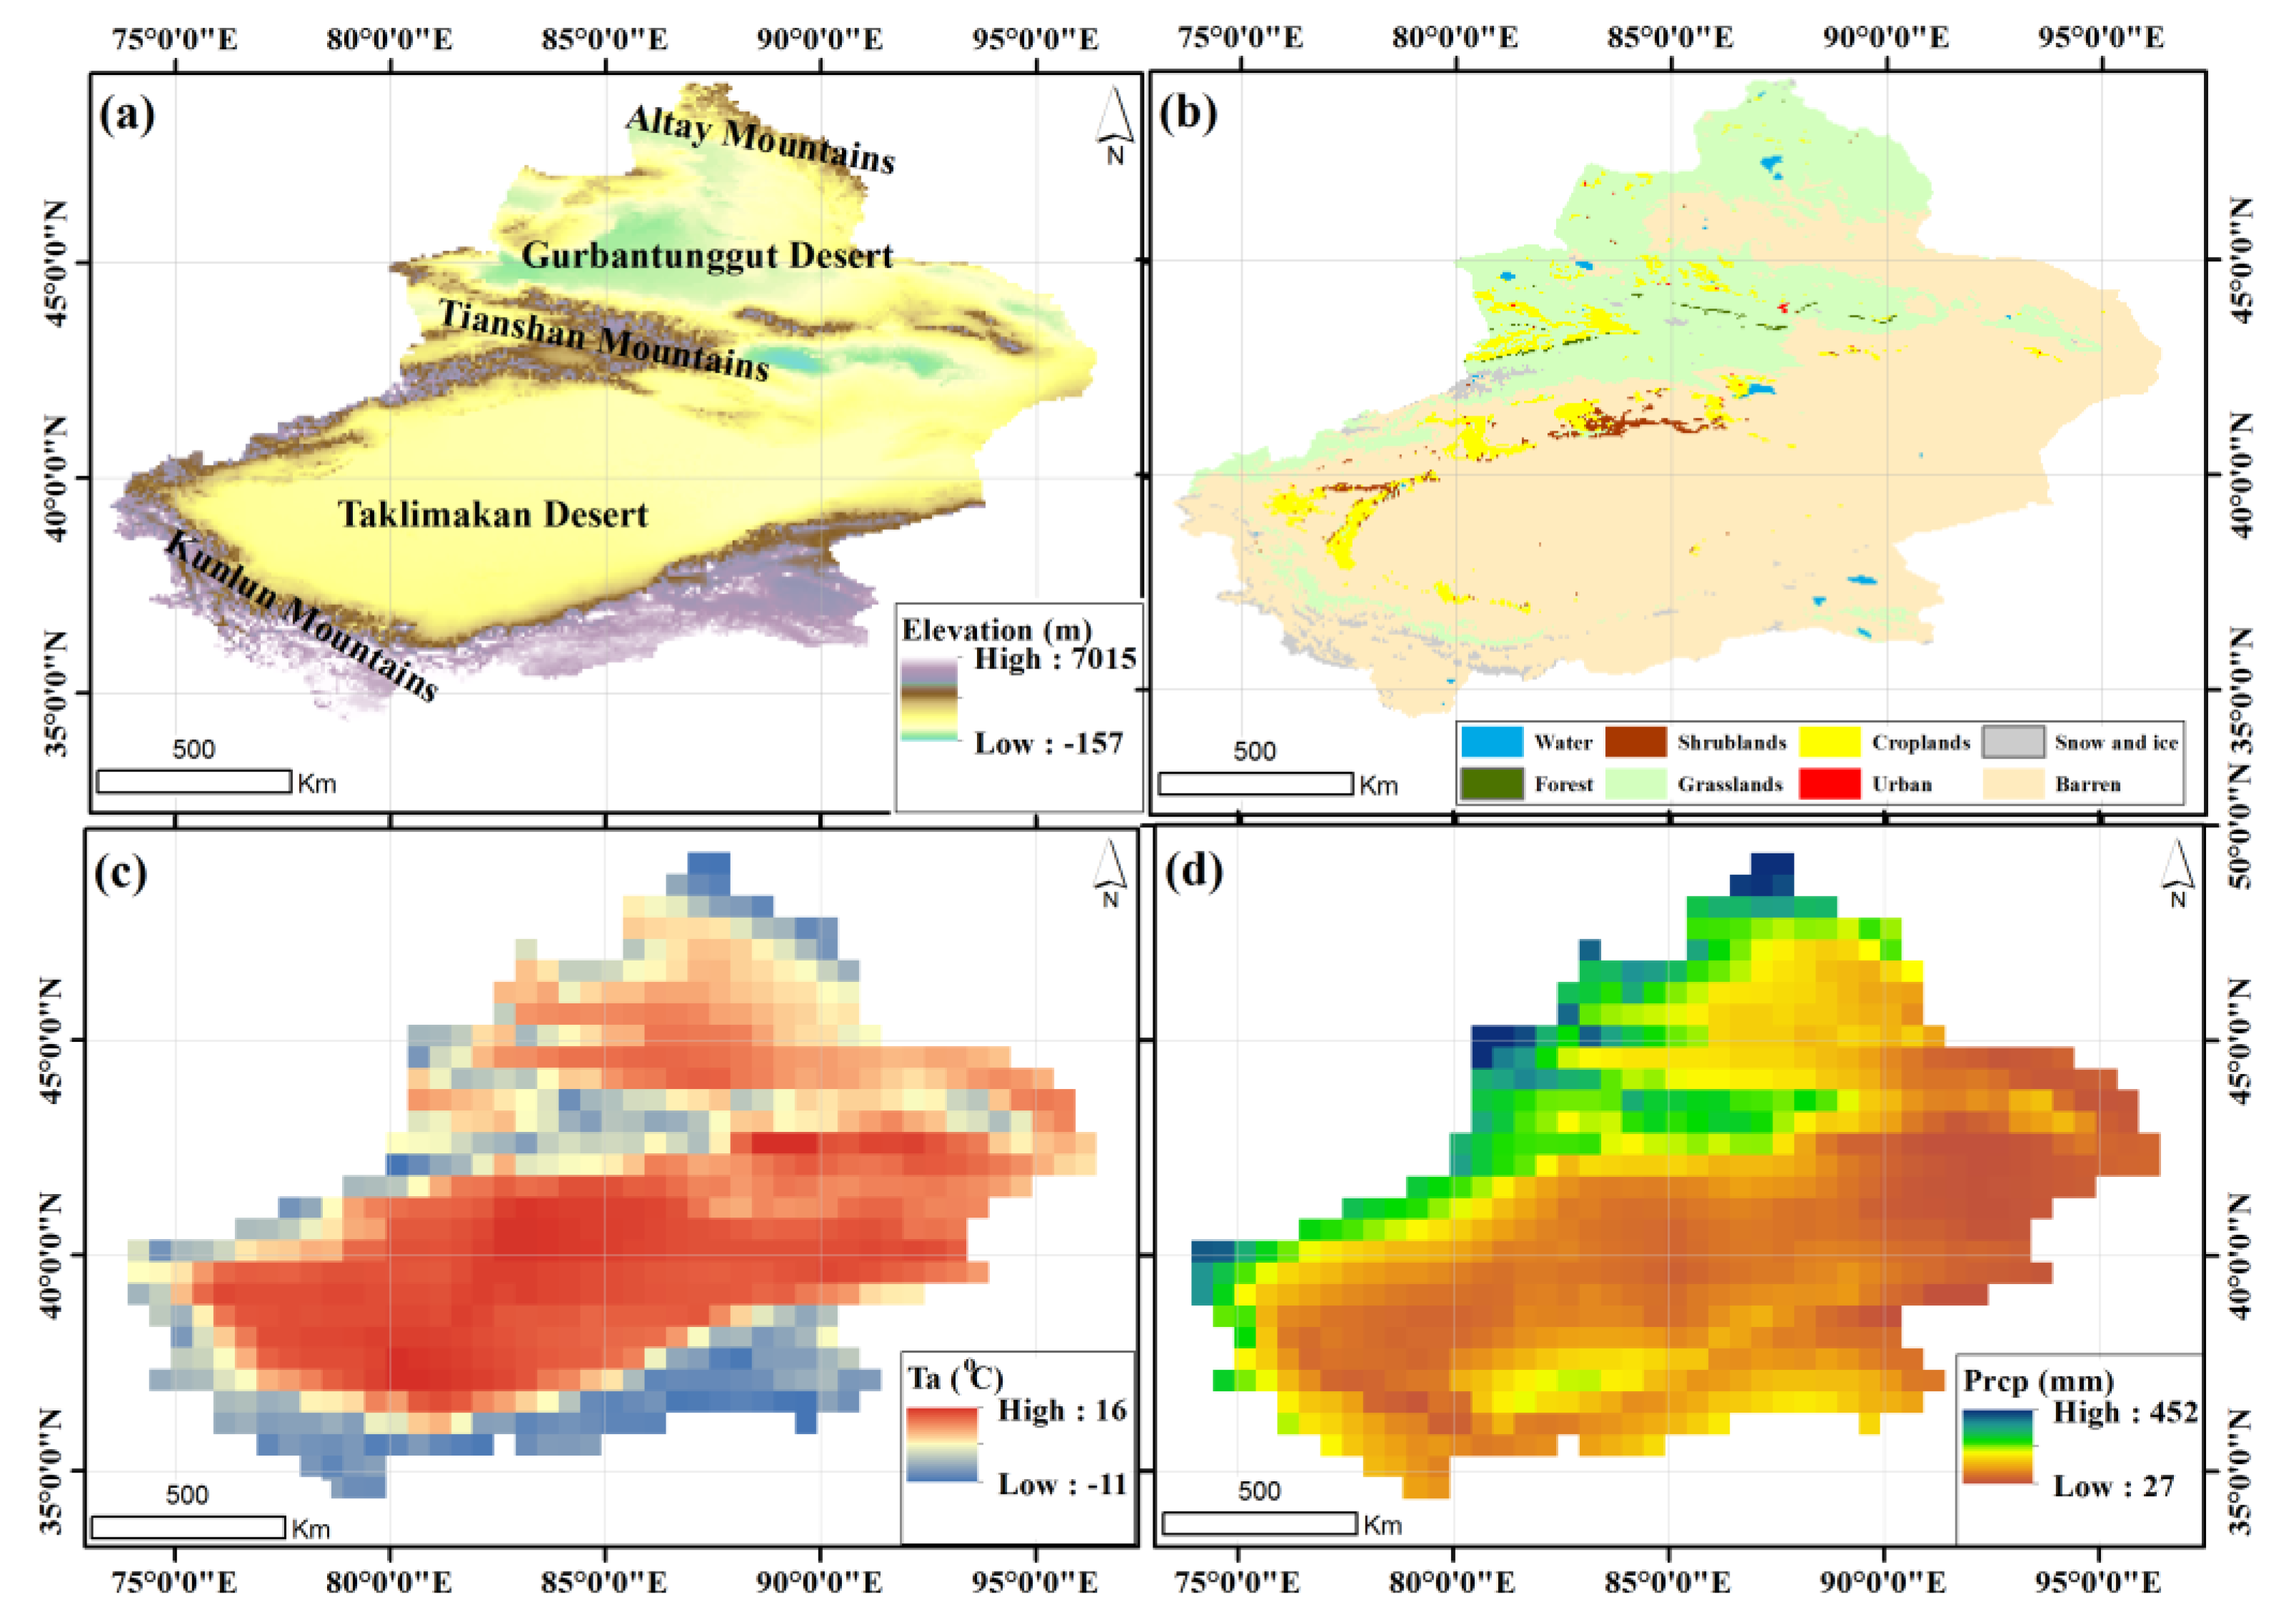
Xinjiang Uyghur Autonomous Region, extending between 73°40′–96°23′ E and 34°25′–49°10′ N and covering an area of about 1.6 million km2, is the largest province-level region in China (Figure 1). Surrounded by three mountains—Altay, Tianshan, and Kunlun, from north to south—the thermodynamic contributions are largely independent of atmospheric circulation. Additionally, two vast deserts lie between the mountains—Taklimakan desert, located in Tarim Basin, and Gurbantunggut Desert, located in Junggar Basin (Figure 1a). Approximately 62% of Xinjiang’s total area is covered by deserts with a low percentage (~9%) of desert vegetation coverage, and is dominated primarily by shrubs (e.g., Haloxylon ammodendron and Tamarix ramosissima) [28] and cropland (4.3%) (Figure 1b). The altitude ranges from less than −157 m in Taklimakan desert to more than 7015 m in Kunlun Mountain (Figure 1a). Located in the hinterland of the Eurasian continent, and far away from the ocean, Xinjiang is one of the driest regions in the world, and is characterized by typical continental climate with mean annual temperature varying from −11 °C within the Kunlun Mountains to 16 °C within Taklimakan Desert (Figure 1c), and mean annual precipitation less than 50 mm/year in Taklimakan Desert and more than 400 mm/year in the Altay and Tianshan Mountains (Figure 1d).
2.2. Model Description
CoLM, used in this study, is a process-based land surface model that allows simulations of vapor water, CO2, and energy fluxes [29]. It combines the best features of three existing successful land models: Land Surface Model (LSM) [30], Biosphere–Atmosphere Transfer Scheme (BATS) [31], and Institute of Atmospheric Physics LSM (IAP94) [10]. In CoLM, the surface evapotranspiration is calculated by a two-big-leaf model, which consists of evaporation of precipitation intercepted by leaves, canopy transpiration, and bare soil evaporation [29]. The calculations for stem and leaf evaporation and transpiration are similar to those used in BATS, while Philip’s [32] formulation is used for the computation of soil evaporation. The CoLM is driven by climate factors: short and long wave radiation, temperature, precipitation, wind, pressure, and humid. Model performance has been extensively validated on a global scale for various biomes. However, uncertainties that underestimate latent heat flux still exist when applied to arid and semi-arid regions [24]. Recently, we have improved the CoLM by adding root distributions functions, root water uptake process, hydraulic redistribution for shrubland, and irrigation for croplandin [11,25]. It has been proved that improved CoLM could simulate the evapotranspiration in arid regions of Xinjiang well [24,25].
2.3. Data Sets
To drive CoLM, we used the future climate forcing, 3-h projected climate data for 1991–2050 at the resolution of 1.25 × 0.9 degree under two RCP scenarios (i.e., RCP4.5 and RCP8.5), including precipitation, temperature, long- and short-wave radiation, pressure, specific humidity, and wind, from climate model CCSM4. These two RCP scenarios are more representative and widely used for future climate forcing. The RCP4.5 scenario explores the long-term climate system response to the stabilizing the anthropogenic components of radiative forcing [33], while the RCP8.5 scenario represents the highest greenhouse gas emissions [34]. We chose these two typical climate change scenarios to focus the effect of climate change on evapotranspiration in the future based on normal and high emissions, respectively, including the effects of low and middle emissions of RCP 2.6 and RCP 6.0 on evapotranspiration. The CoLM contains statistical downscaling procedures for the future climate forcing input data and it was aggregated into the resolution of 0.5 degree. The Land Cover Type Climate Modeling Grid (CMG) product (MCD12C1) with 0.05-degree spatial resolution (eight categories) in 2010 was obtained from the USGS [35]. The land cover data were then aggregated into a 0.5 degree by the rule of maximum area.
2.4. The Statistical Analysis
The annual changes in evapotranspiration and climate factors (i.e., temperature and precipitation) were defined as differences between two individual periods:
where D indicates the annual change of variables between two periods and A is the mean value of variables during the corresponding periods—the period 1996–2005 was selected as historical period.
D = A2041–2050 − A1996–2005
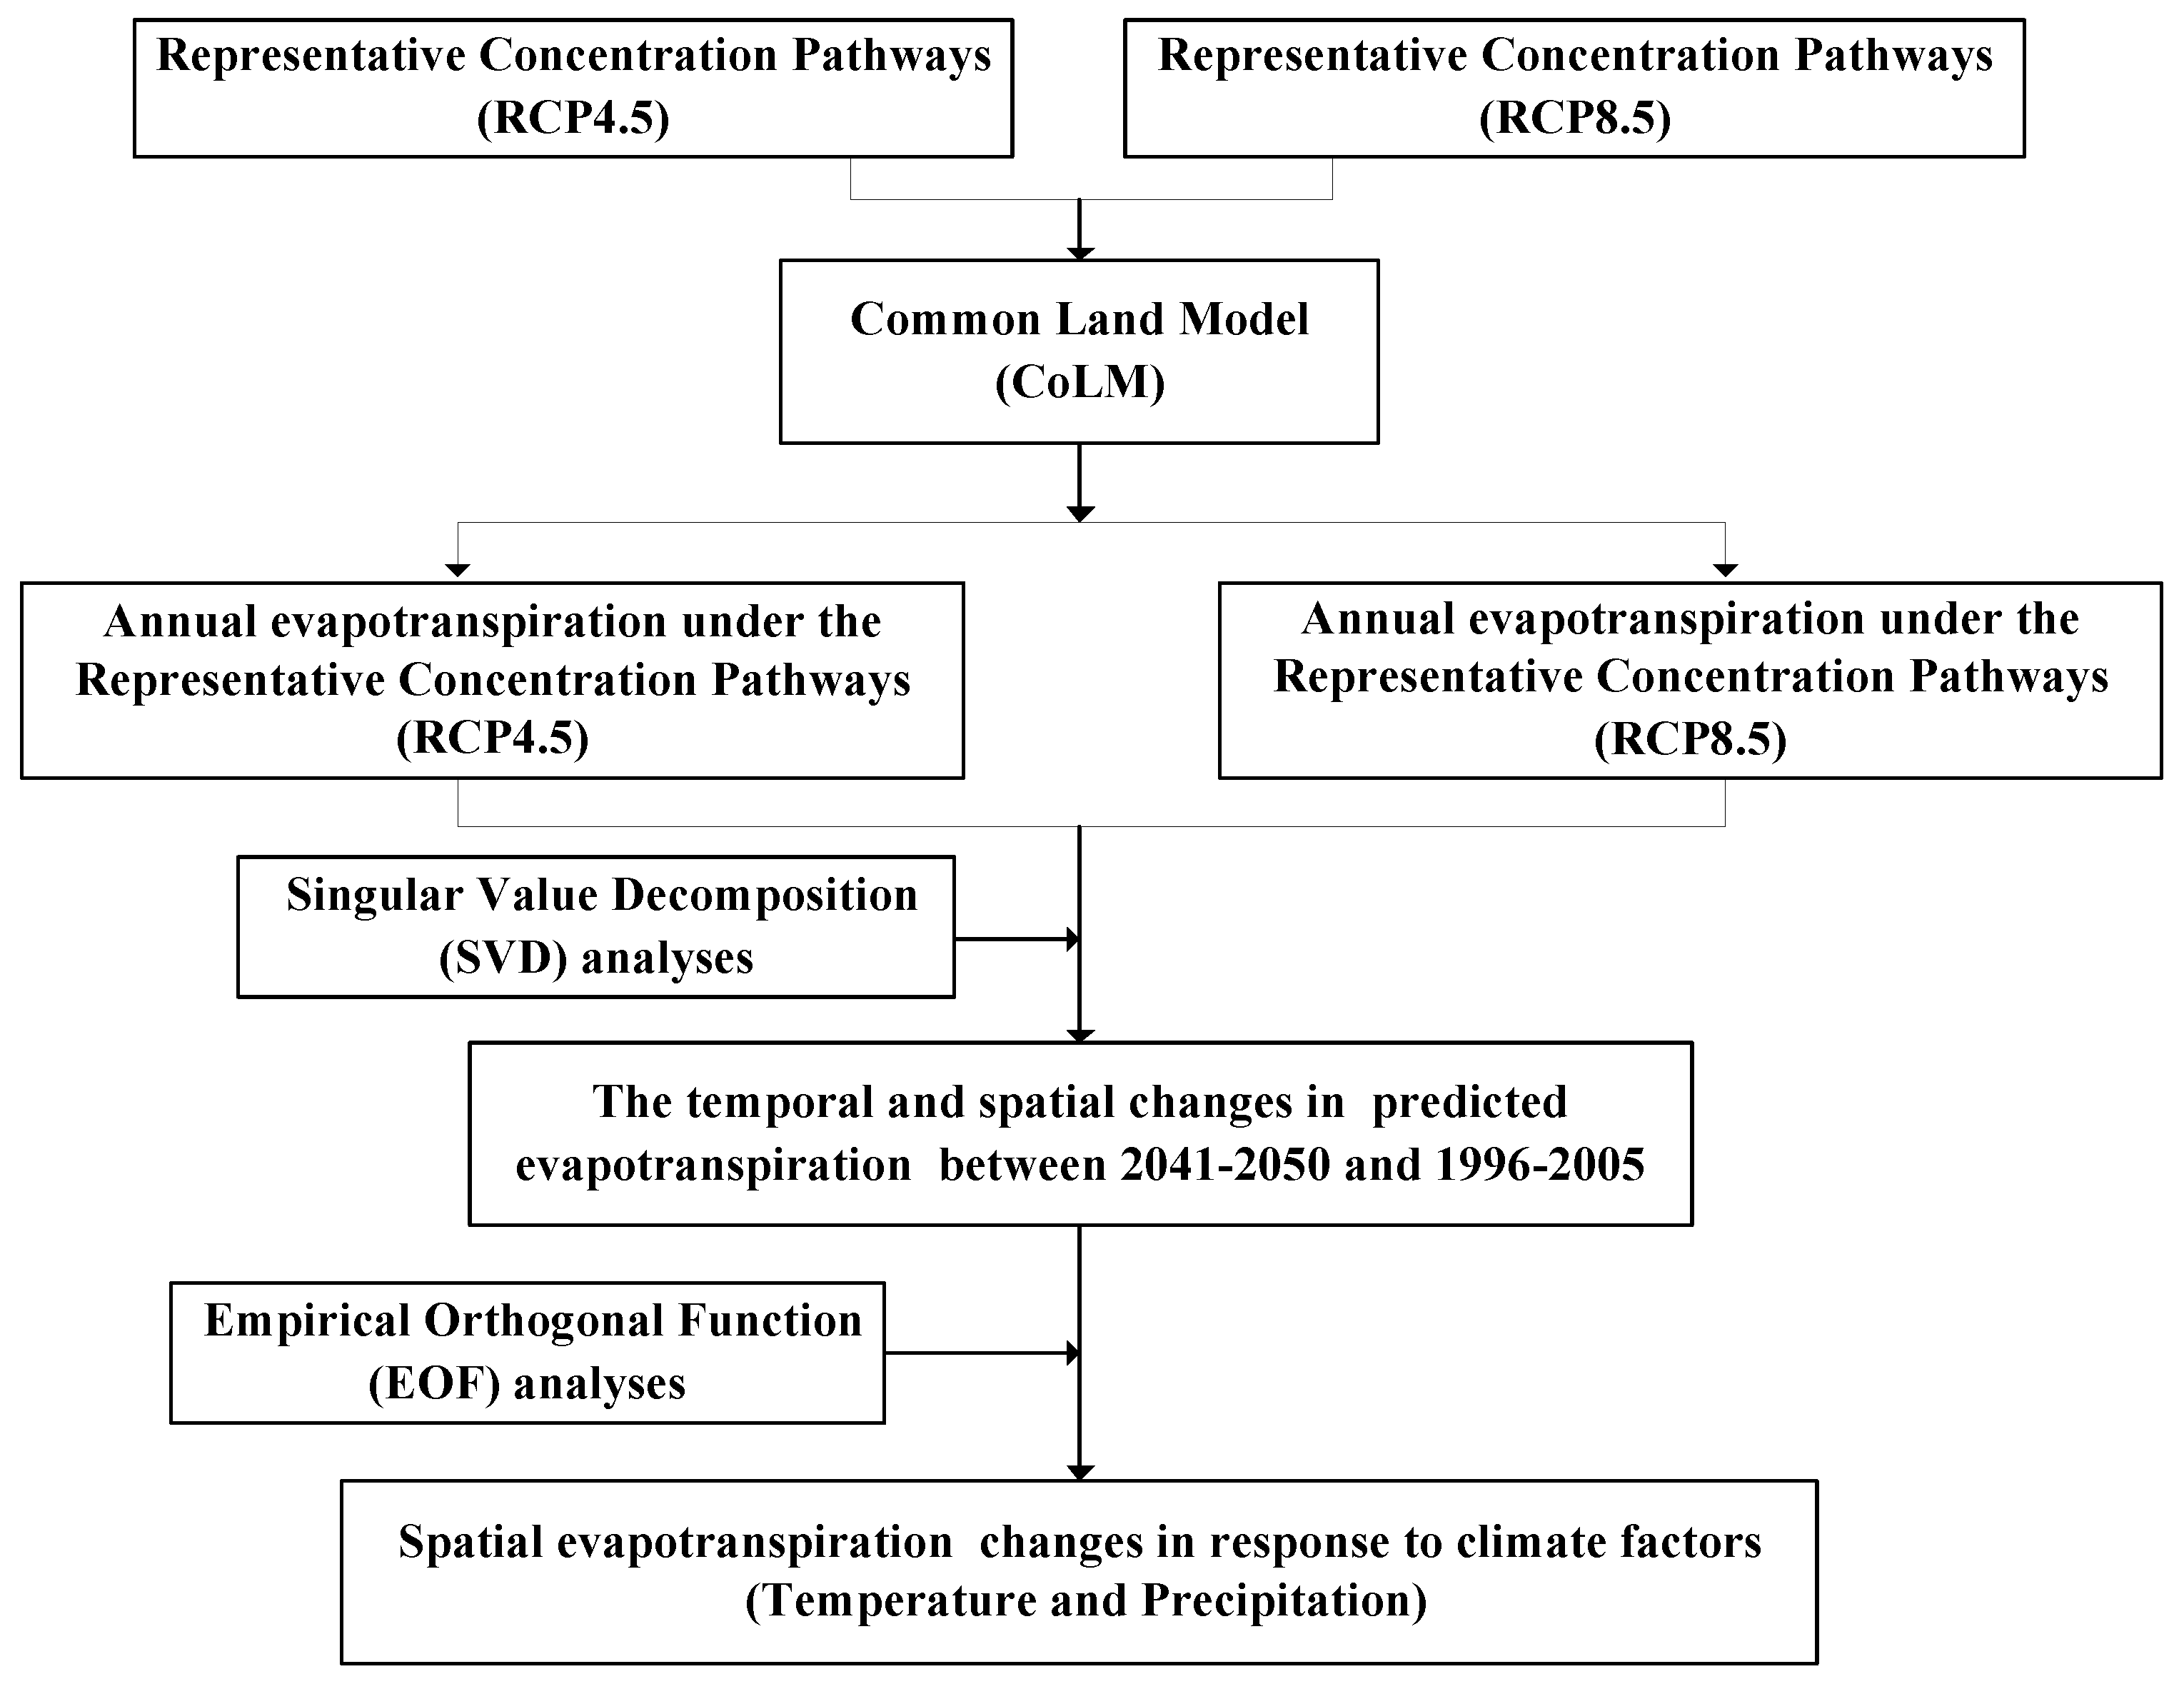
Since variables in terrestrial ecosystems are characterized by non-linearity and high dimensionality, the Empirical Orthogonal Function (EOF) analysis and Singular Value Decomposition (SVD) analysis techniques are widely used to represent the variation in dominant spatiotemporal patterns; the relative importance of each pattern is in explaining observed variation across space [33,34,35]. First, according to the spatial mode, EOF was conducted to analyze temporally varying spatial patterns of annual evapotranspiration, and corresponding time coefficients that describe the magnitude of the variation of the spatial mode. Then, SVD analysis was used to quantify the relationships between annual evapotranspiration and climate factors (temperature and precipitation) over Xinjiang. In SVD analysis, each pair of spatial modes was used to explain cross-covariance of the two fields. The correlation between time coefficients of each coupled spatial mode indicates the degree of coupling between two variables (e.g., evapotranspiration or climate factors in this study). The ratio of each squared singular value to the total squared covariance is used to describe how many fractions can be explained by corresponding coupled spatial modes [34]. The t-test was used to assess the statistical significance (p). We used SVD analysis to identify the coupling between spatial patterns of evapotranspiration and climate factor (precipitation and temperature), respectively. The function “EOF” in the R package of “spacetime” is used to implement EOF analysis; SVD analysis is a fundamental matrix operation in base of R. The statistical analysis is performed in the R software platform 3.4.1. The flowchart along with the steps of calculation in this study are shown in Figure 2.
3. Results
3.1. The Future Changes in Precipitation and Temperature
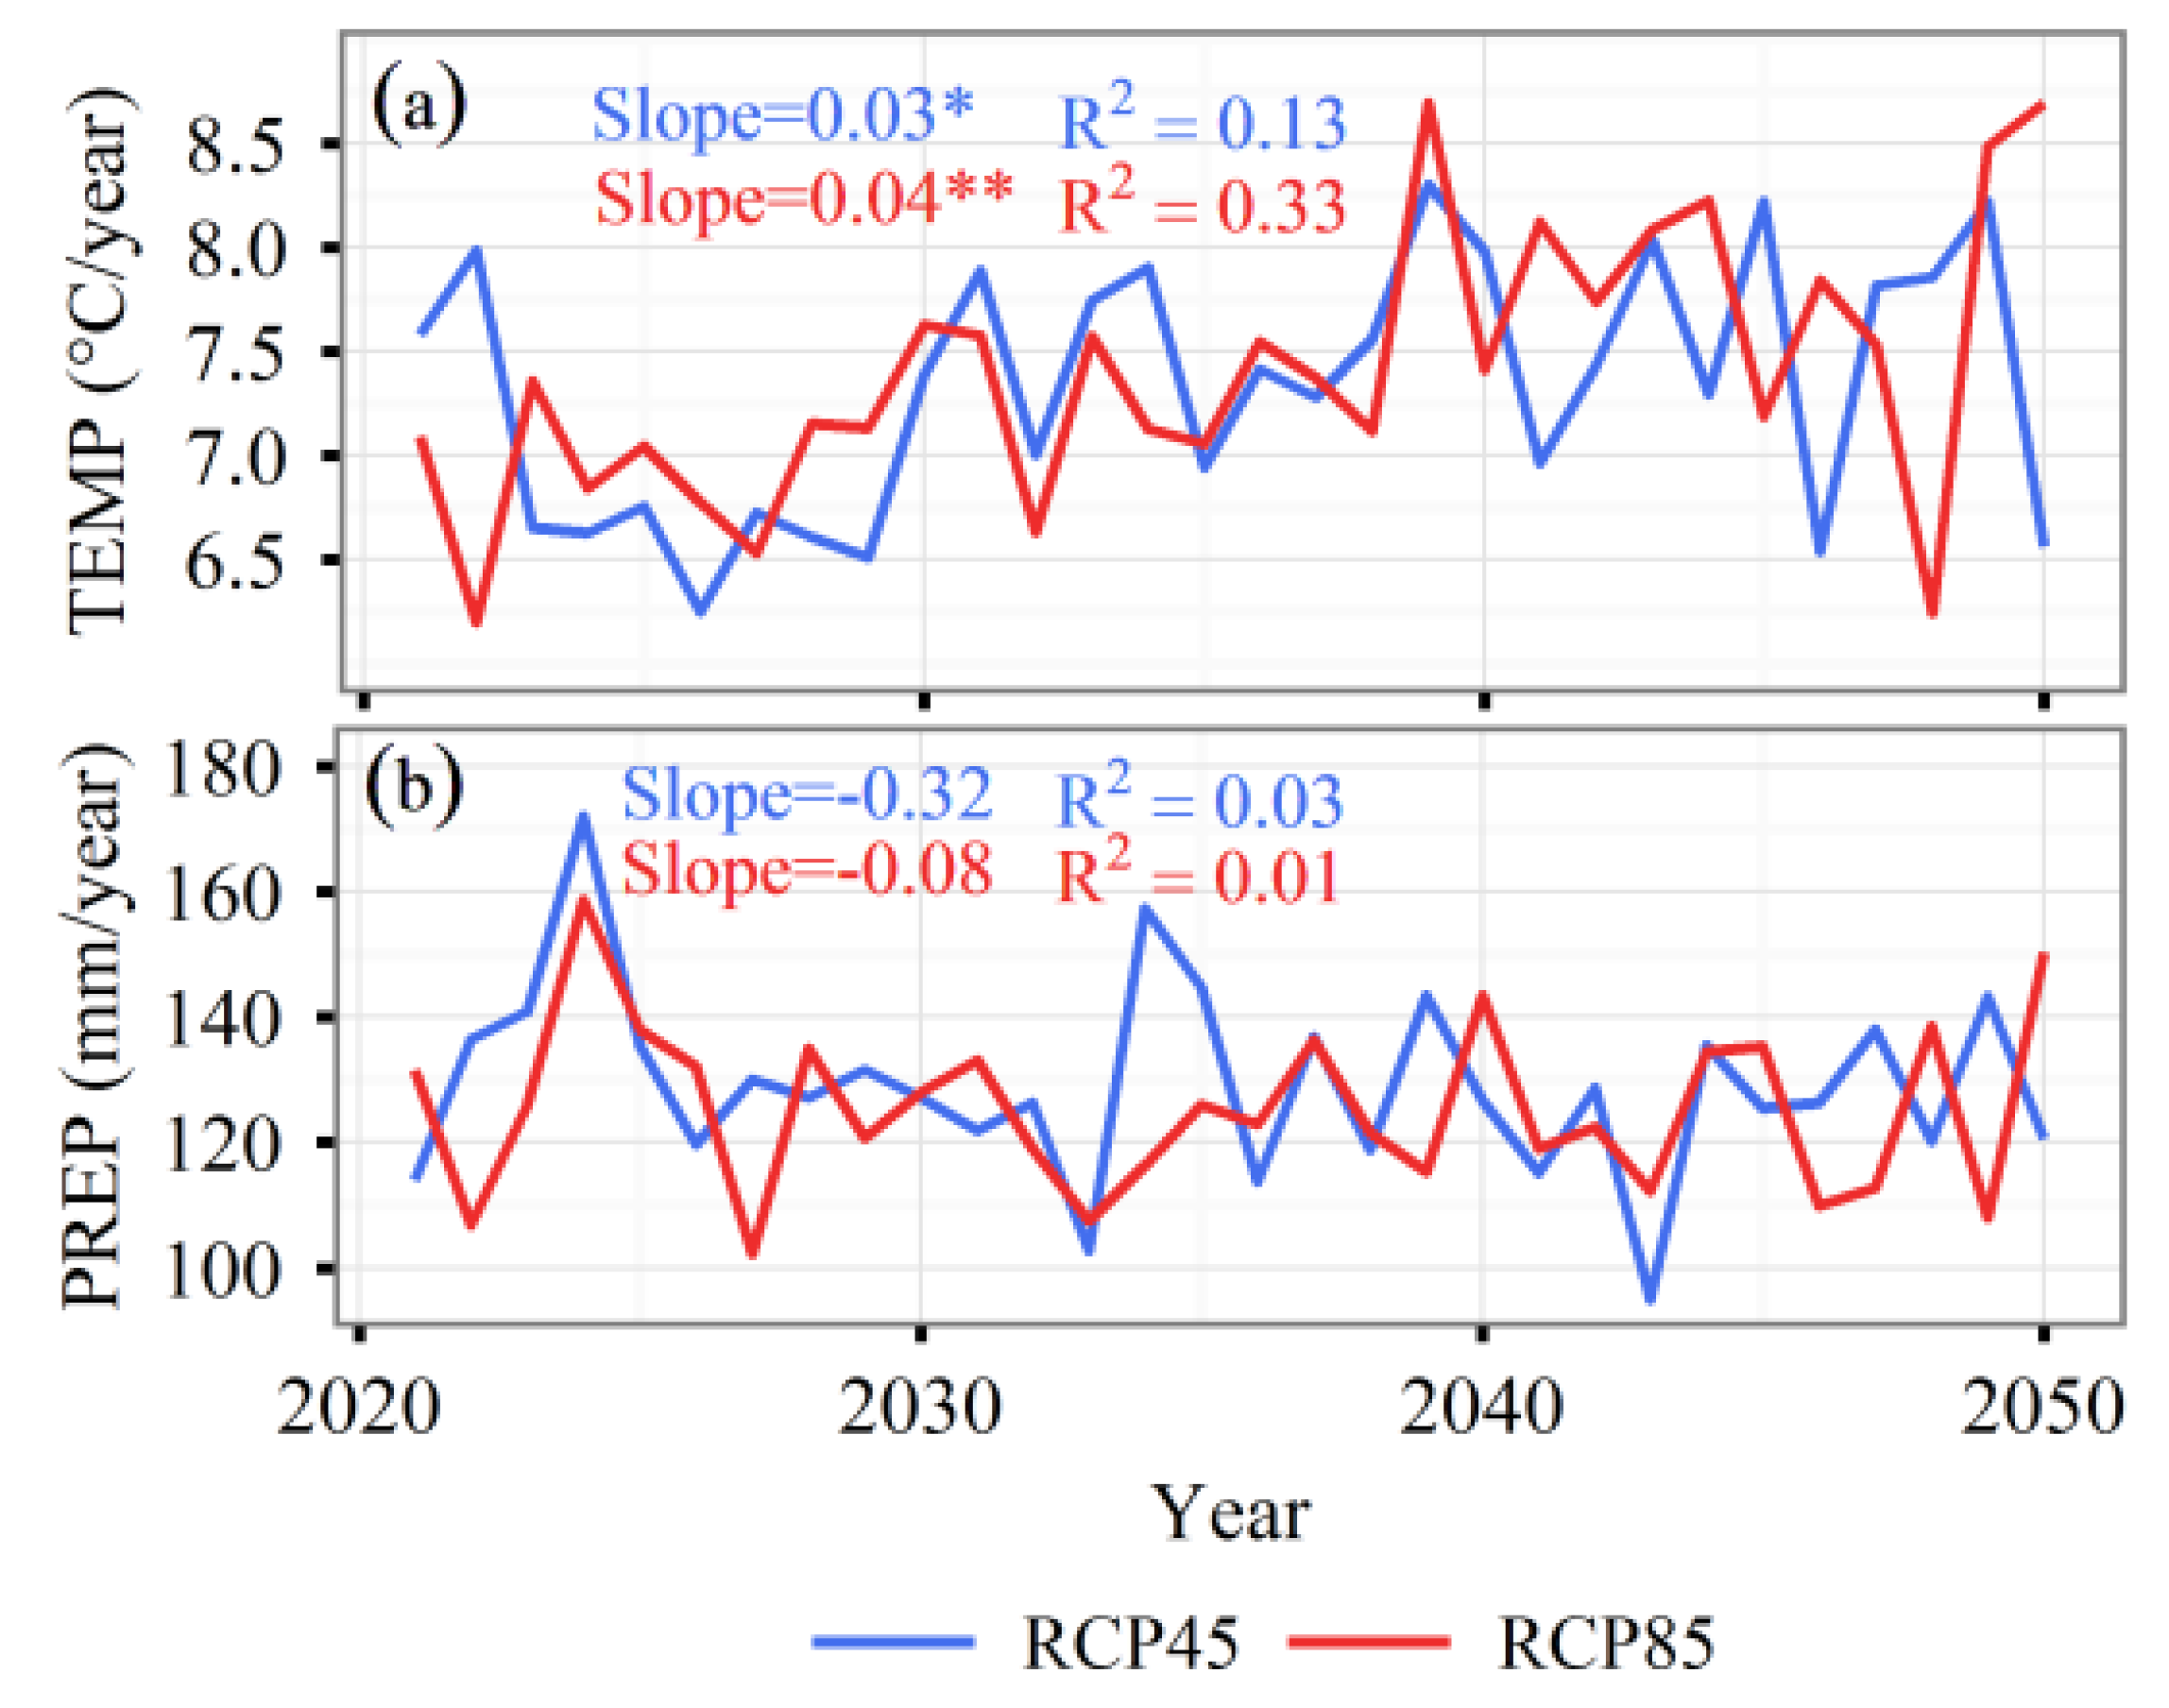
The future temporal variations of the annual precipitation and temperature under two scenarios were analyzed during the period 2021–2050 (Figure 3). The increased temperature rate of 0.03 and 0.04 °C/year under both RCP4.5 and RCP8.5 scenarios were both at the level of 0.05, which showed that the increased rate reached the level of statistical significance (p < 0.1) Compared with the referenced historical period (1996–2005), the annual mean temperature during 2041–2050 will increase by 1.3 °C under RCP4.5 and 1.6 °C under RCP8.5. The annual precipitation under both scenarios showed a large fluctuation between 100 mm/year and 180 mm/year, and demonstrated no significant trend. The two scenarios showed a comparable change for precipitation compared with the reference history period with a small rise of 2.5%.
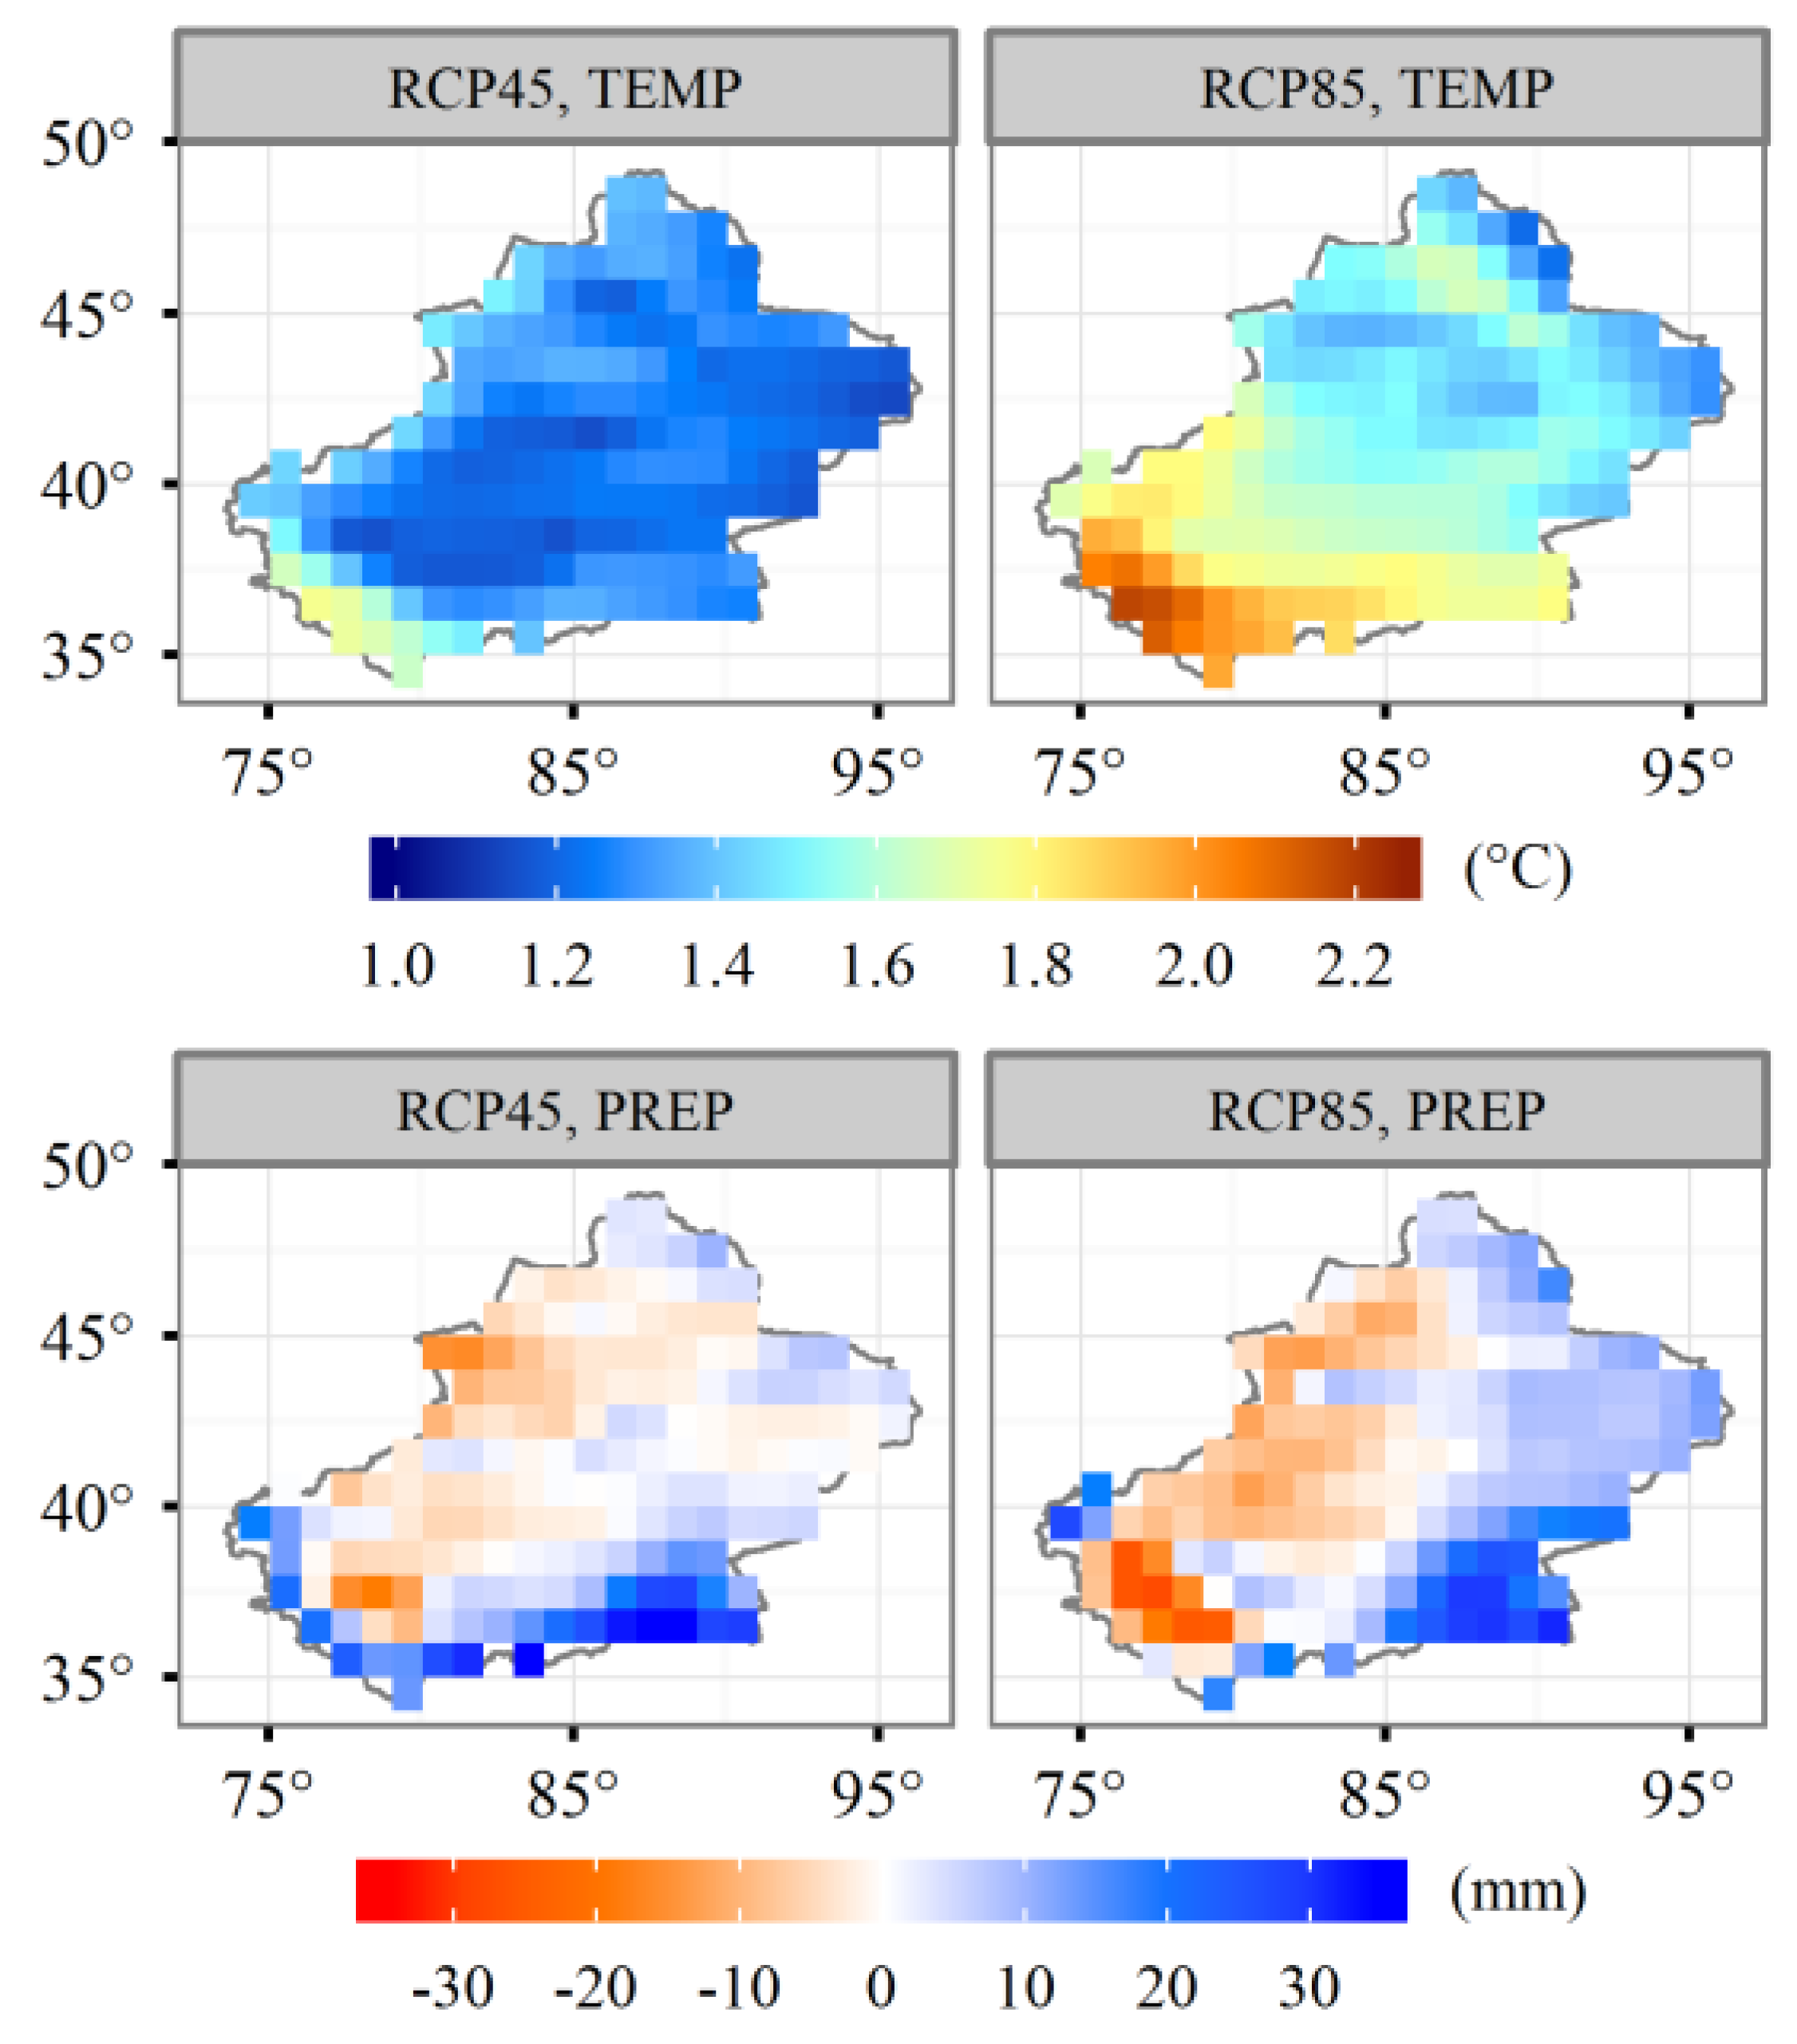
Figure 4 shows spatial pattern variations for both temperature and precipitation during the period 2041–2050, compared with the period of 1996–2005. For the temperature, positive differences appeared almost across the entire region, and the values in the southern regions were higher than that in northern regions, which indicated that almost the entire region will experience a warming. The increased rate of temperature in the southern region is larger than that in northern region. Moreover, the positive differences under the RCP8.5 scenario are larger than that under the RCP4.5 scenario. The increase in temperature is relatively high, at a rate of 2.2 °C in the Kunlun Mountains under the RCP8.5 scenario, and higher than the value of about 1.7 °C under the RCP4.5 scenario. For precipitation, opposite signs of difference values occurred under both scenarios where positive values appeared in eastern and southern areas; negative values occurred in western areas, which means that the eastern and southern areas in Xinjiang will experience a wet trend and western areas will experience a dry trend. Moreover, there are no noticeable differences in magnitudes in the difference values of precipitation between the both scenarios.
3.2. Temporal and Spatial Variations of the Annual Evapotranspiration
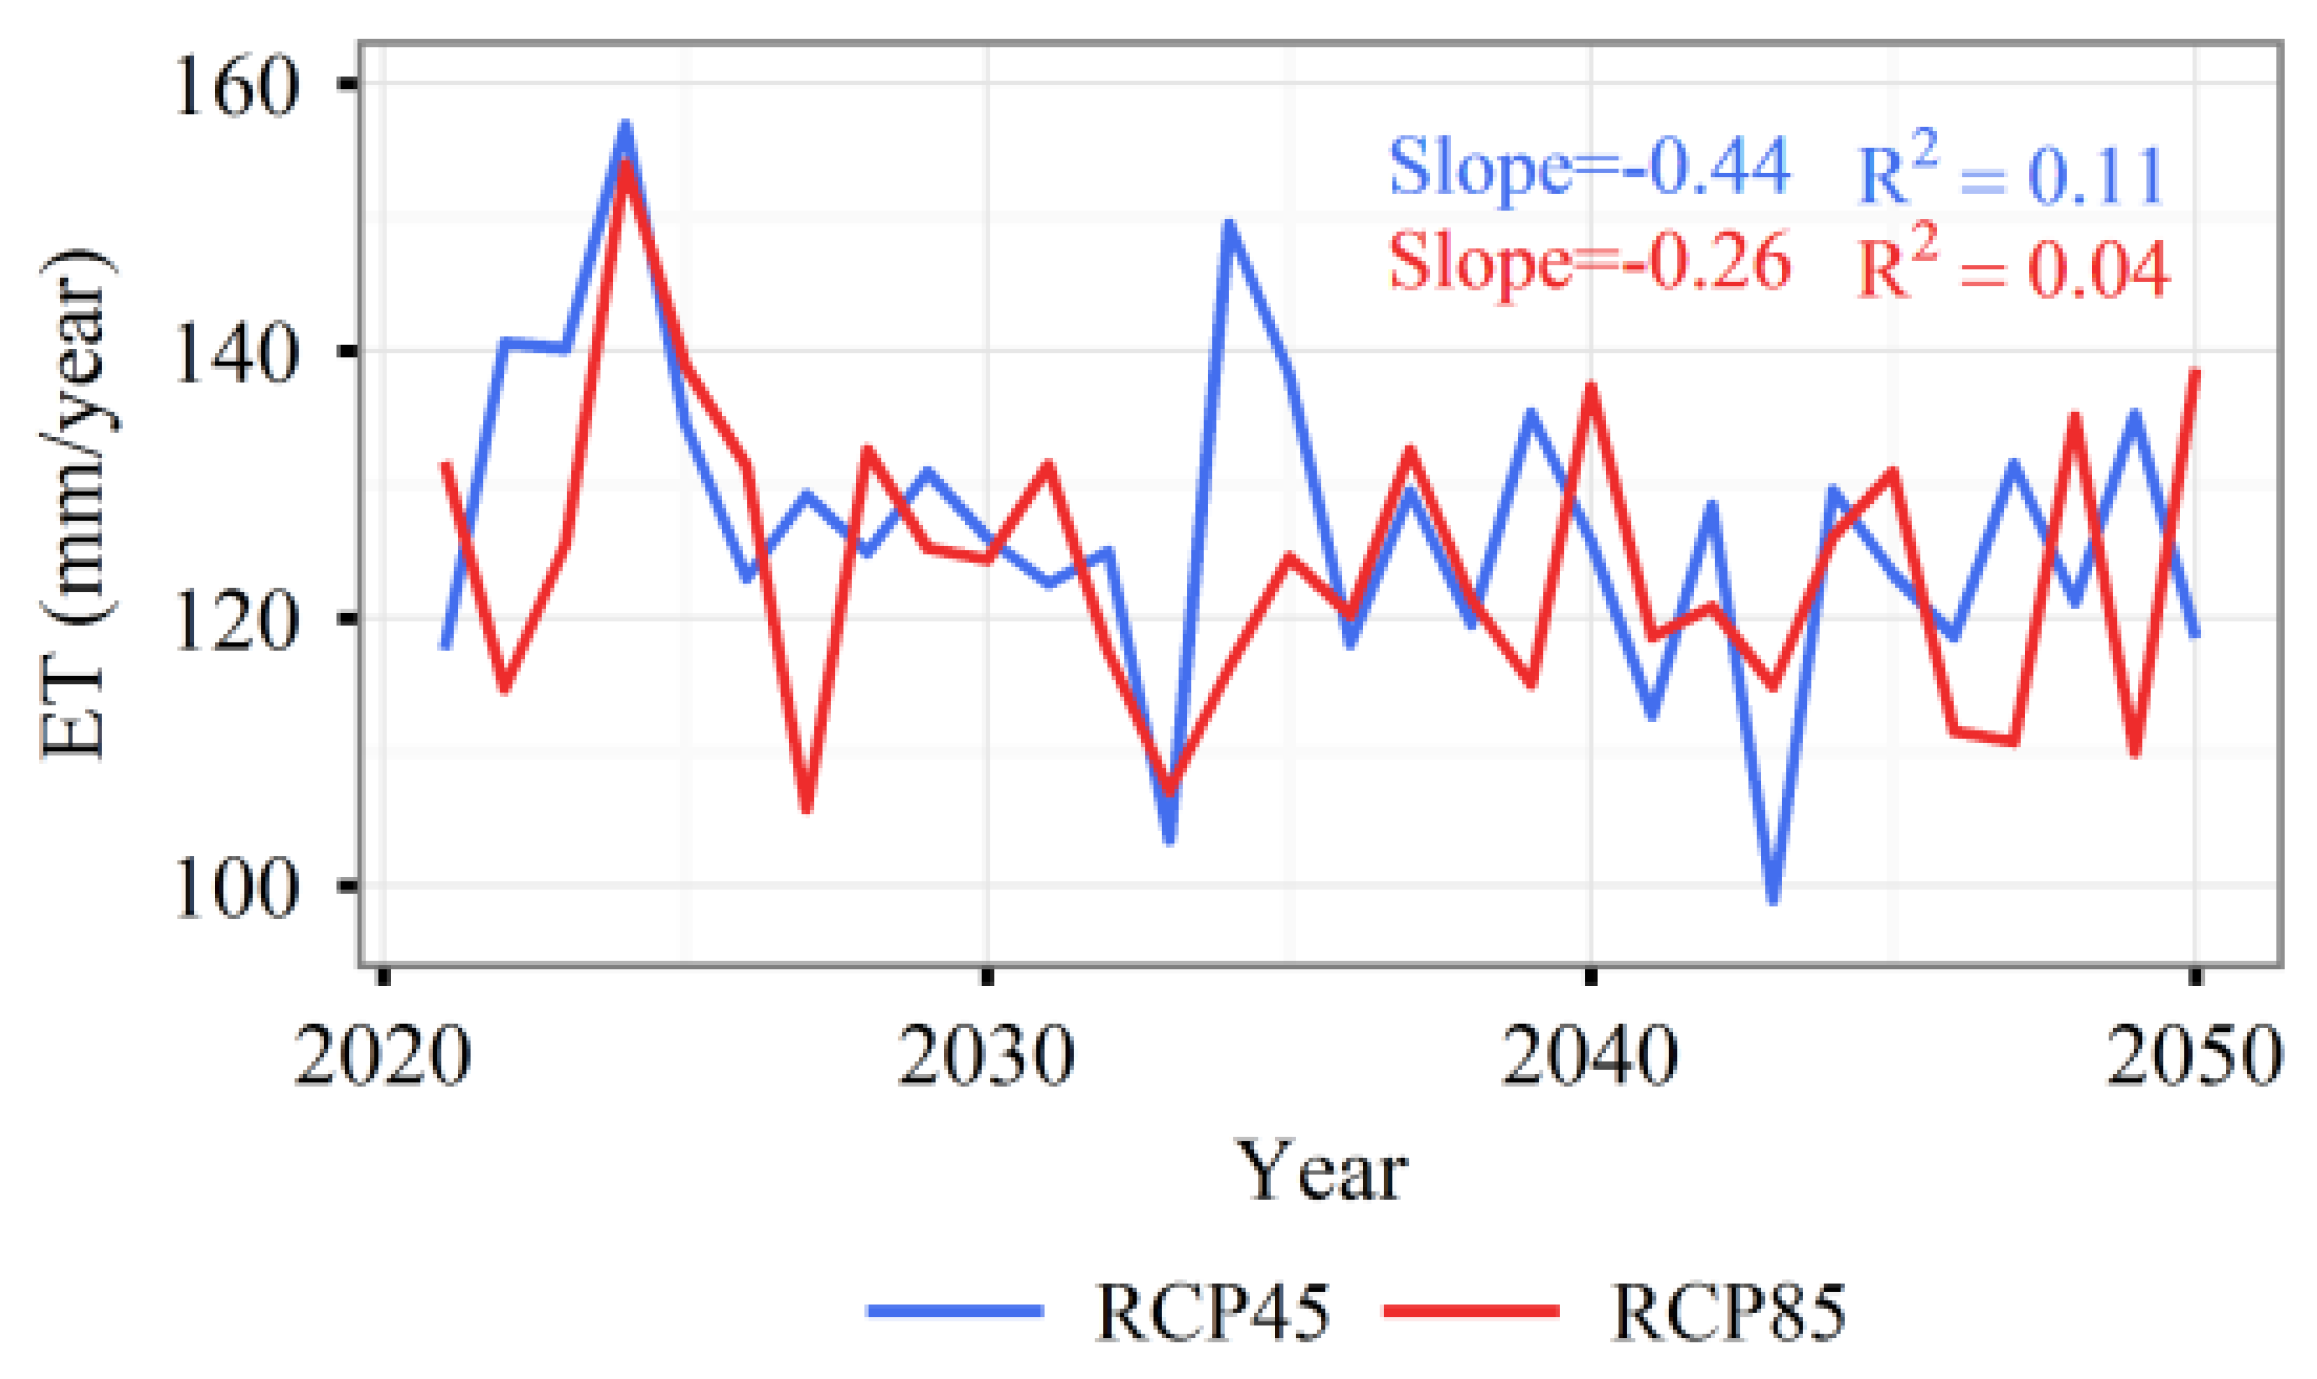
Figure 5 shows the temporal trend of predicted future evapotranspiration in Xinjiang during 2021–2050 under the two scenarios. The mean annual regional evapotranspiration was estimated at the value of 127 (11.9) mm/year under the RCP4.5 scenario and 124 (11.1) mm/year under the RCP8.5 scenario. The regional evapotranspiration exhibited a large inter-annual variability under both scenarios, ranging from 100 mm/year to 160 mm/year, and no significant trend was determined during the study period (p > 0.05). Compared with the referenced historical period (1996–2005), the annual mean evapotranspiration during 2041–2050 will decrease by 0.3 mm under the RCP4.5 scenario and by 0.4 mm under the RCP8.5 scenario, respectively.
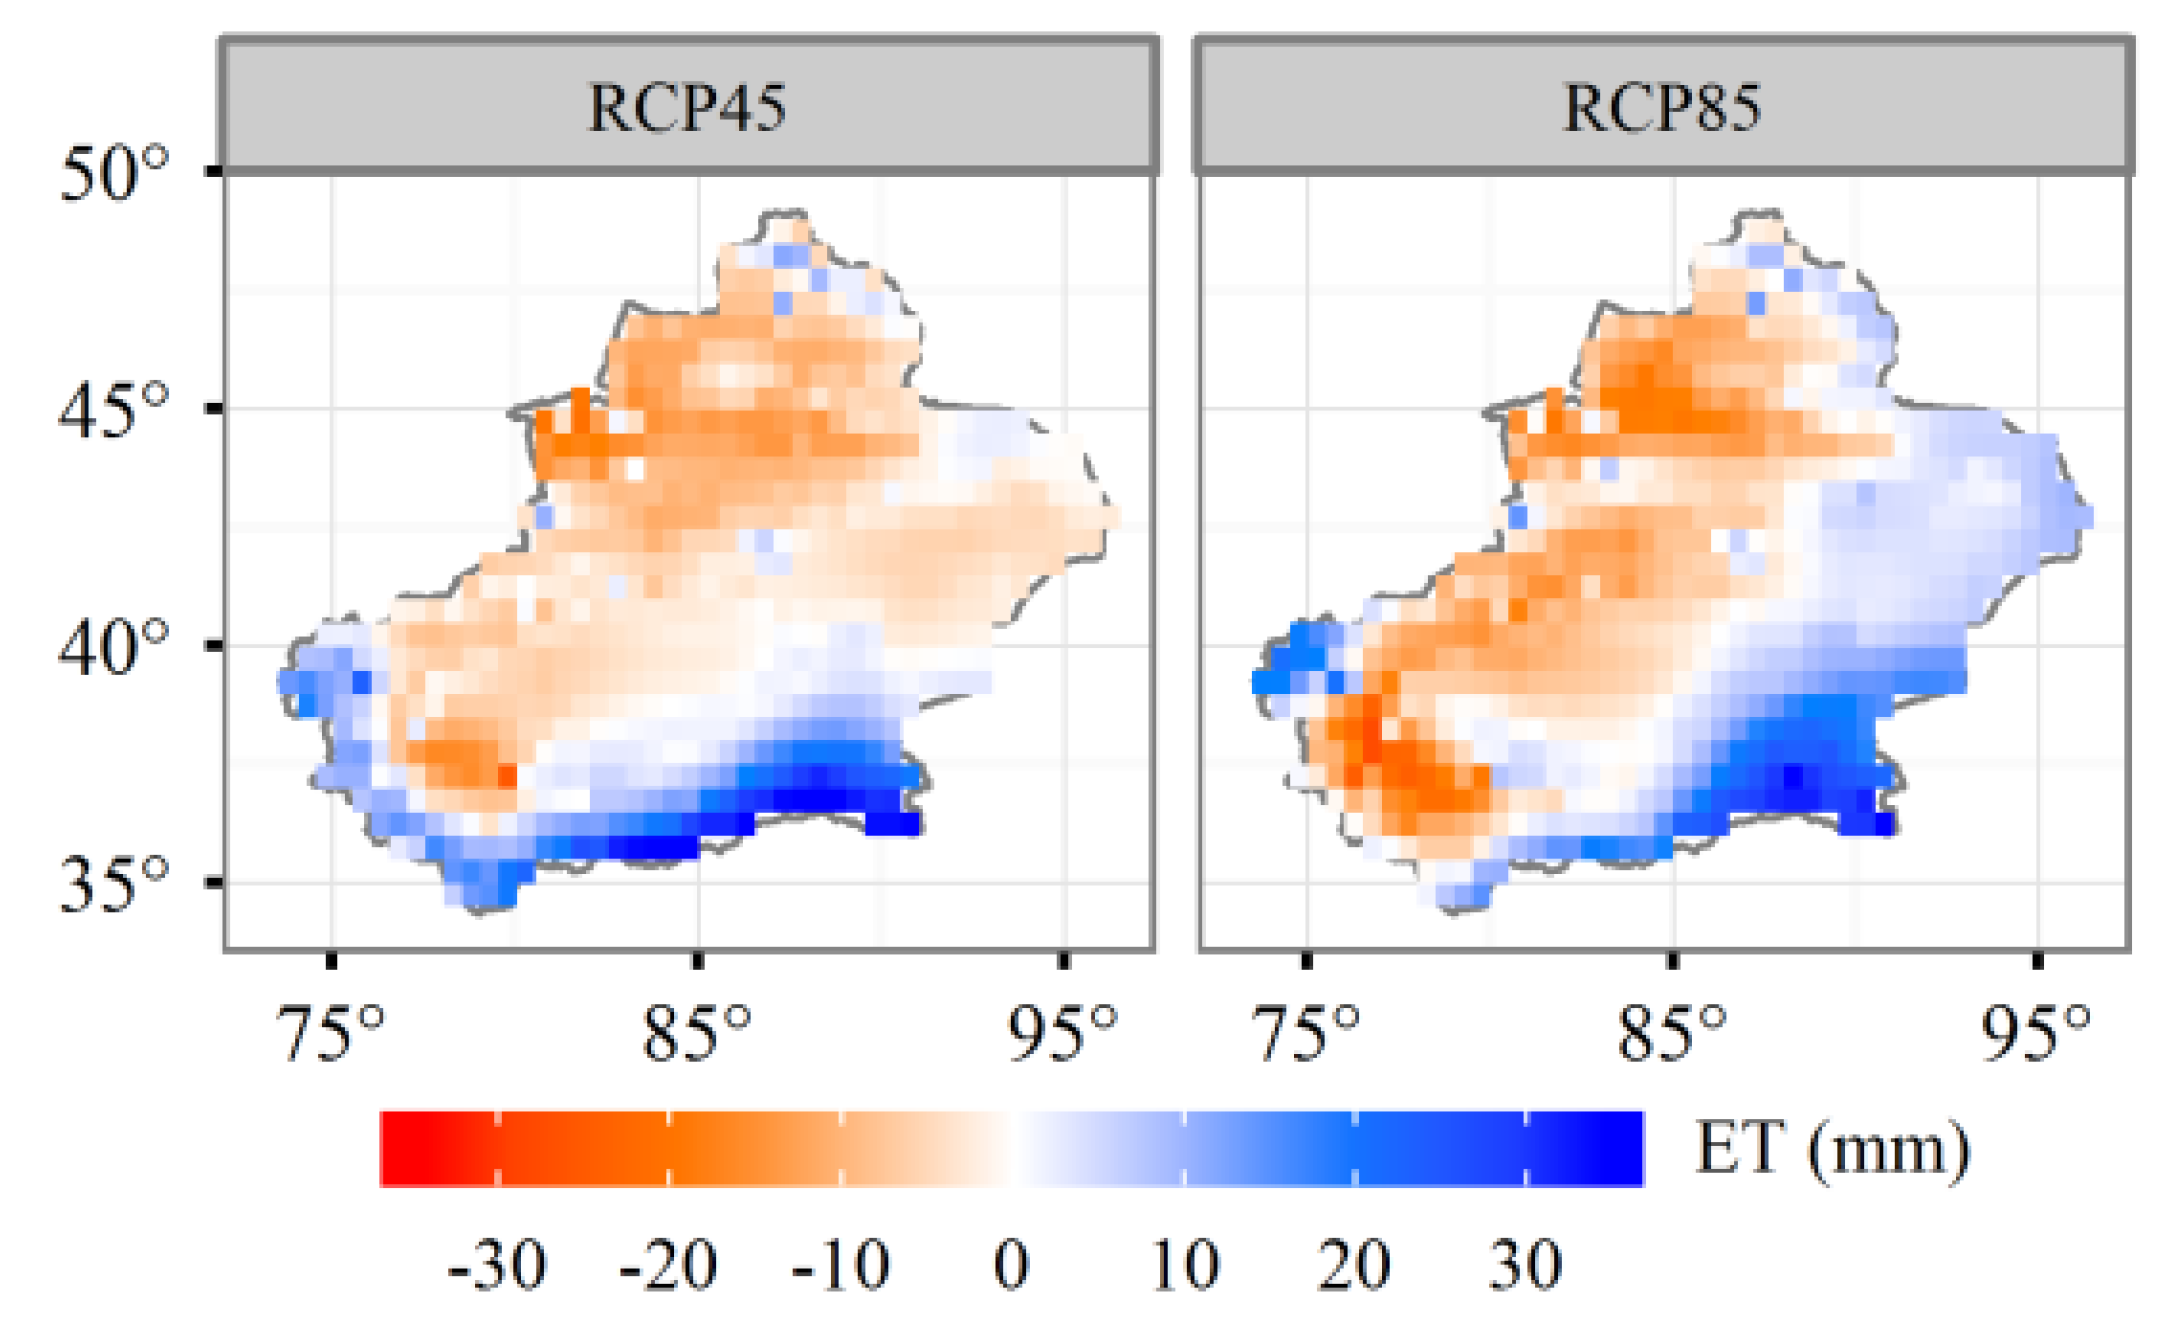
The spatial pattern changes of evapotranspiration are shown in Figure 6, which is similar with the patterns of changes in precipitation. Opposite signs of difference values occurred under both scenarios; positive values appeared in the eastern and southern areas and negative values occurred in the western area. In the central region of Xinjiang, evapotranspiration showed less variability than the other regions.
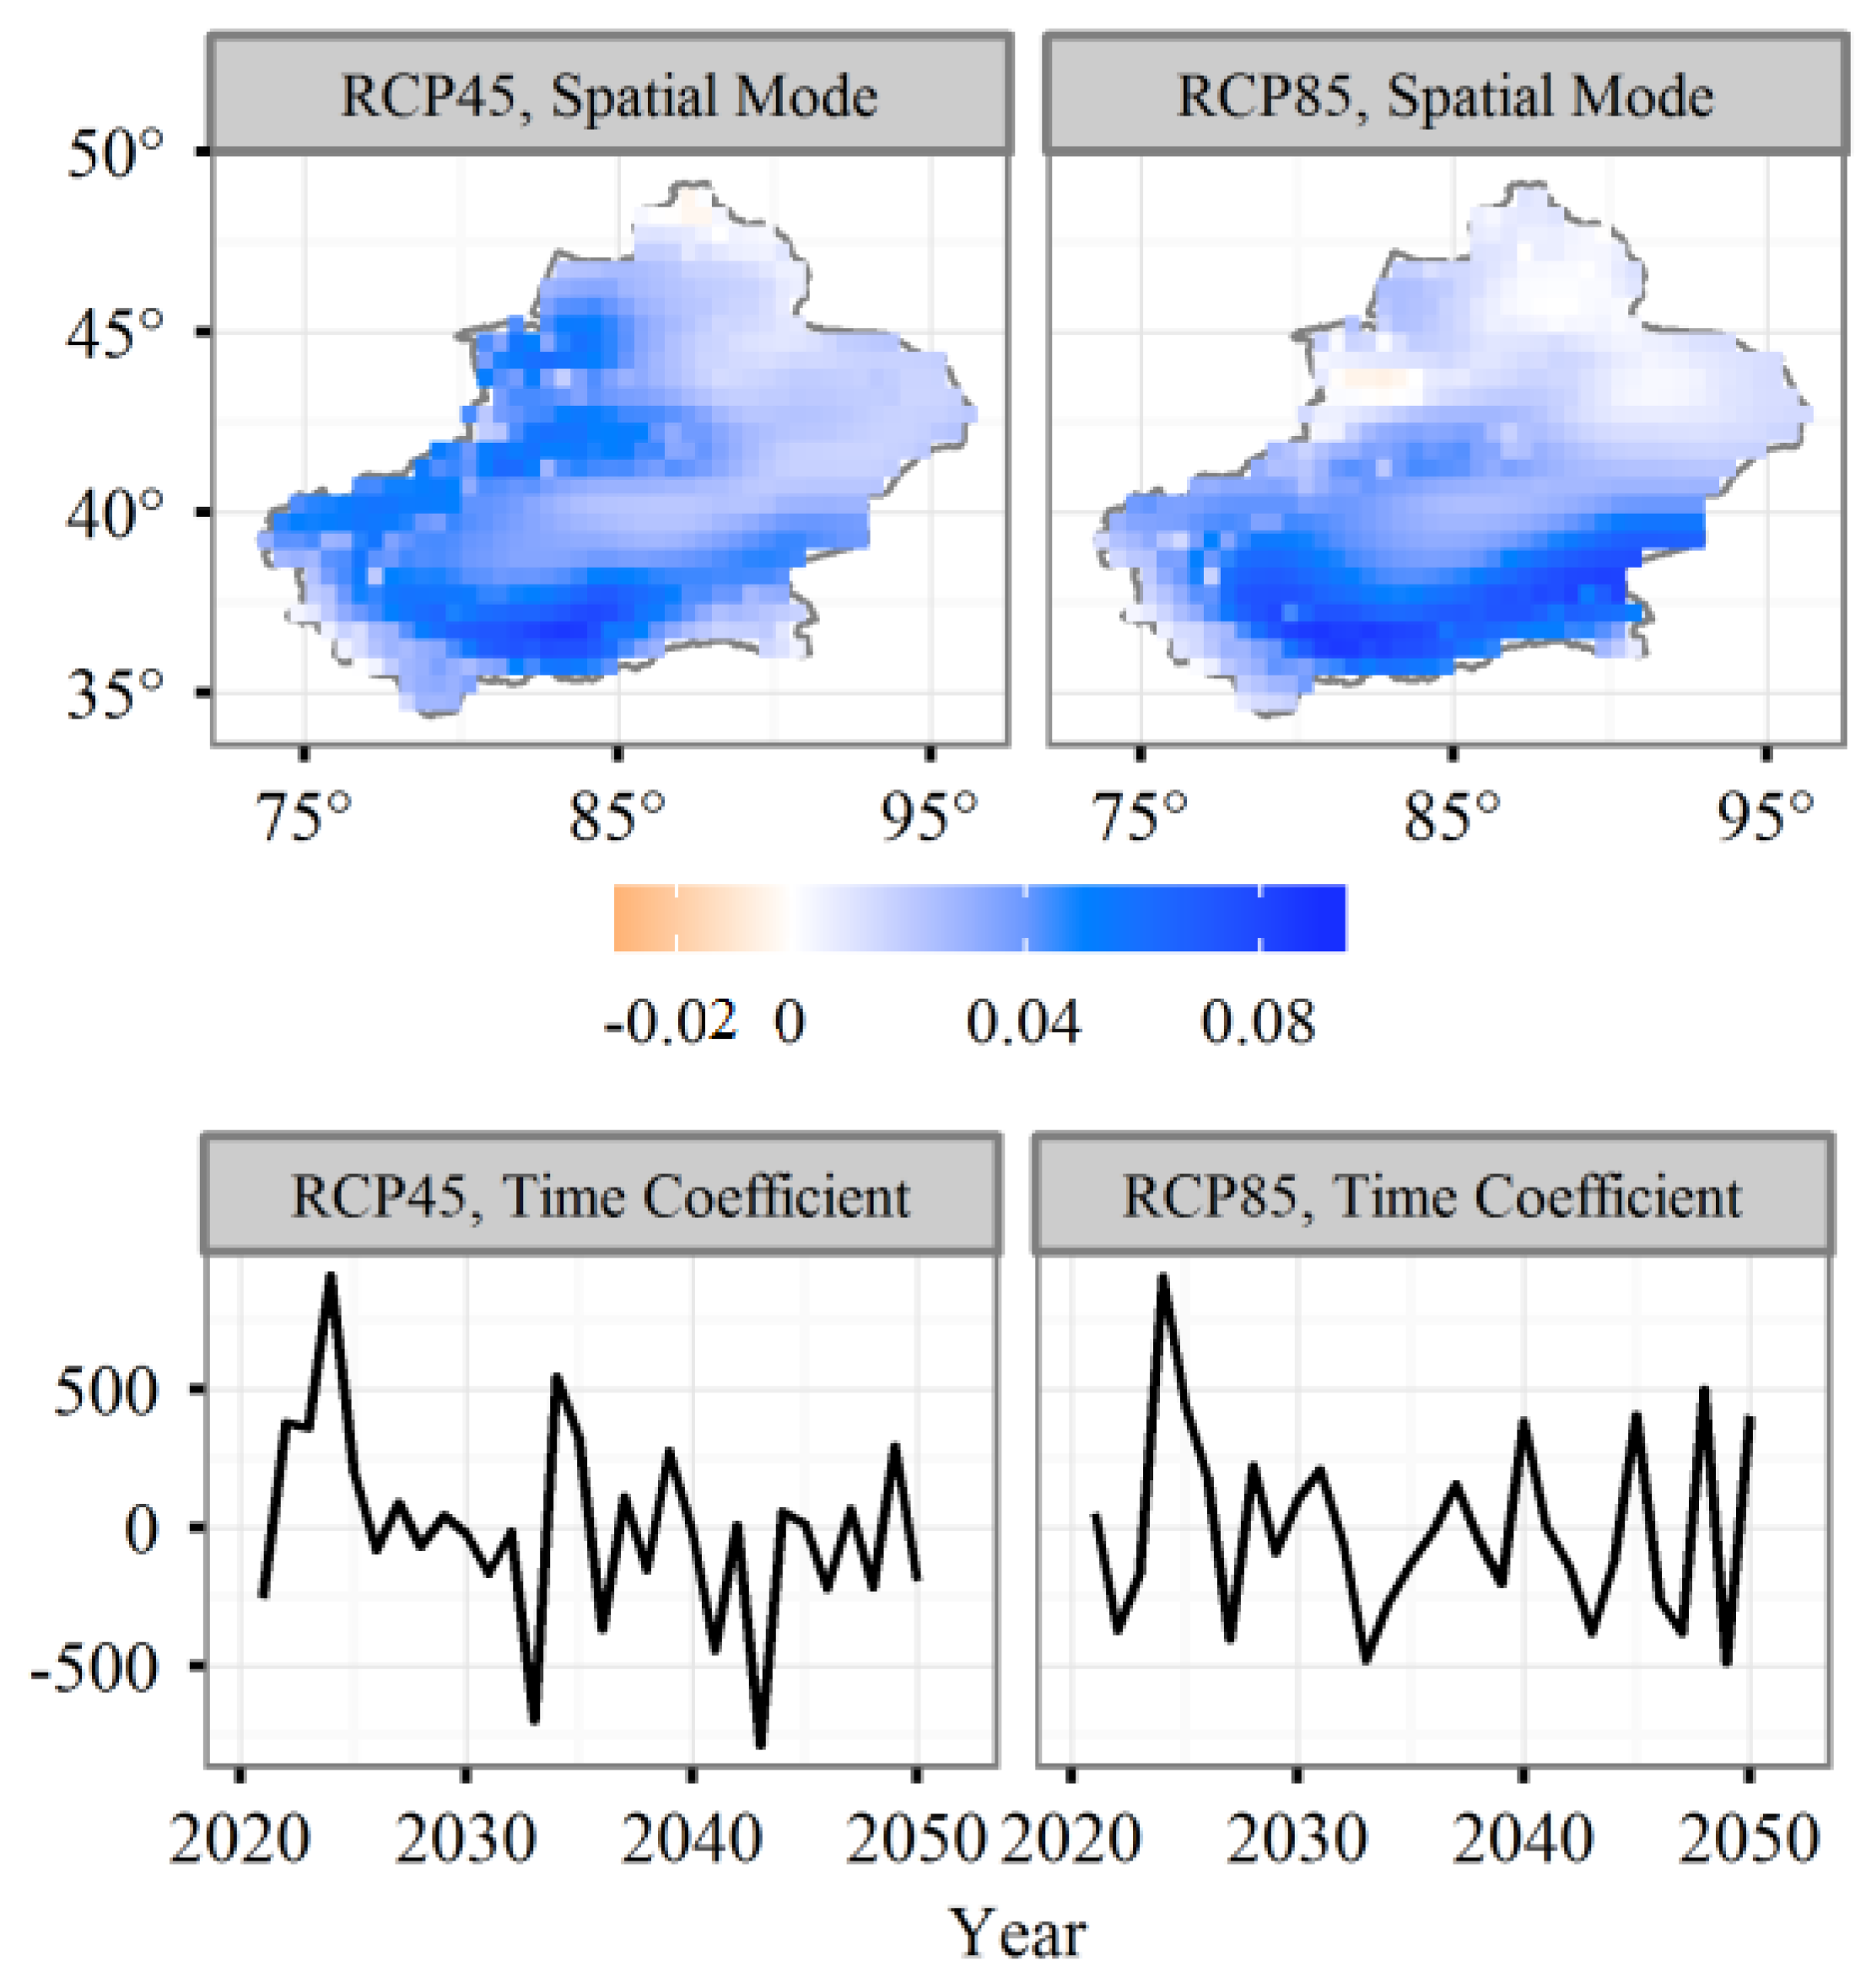
In order to further investigate the spatially coherent patterns of temporal variations of regional evapotranspiration, the first EOF spatial mode and corresponding time coefficients was analyzed (Figure 7). Under the RCP4.5 scenario, the first EOF spatial mode represents 36.1% of total variance in evapotranspiration, and almost the entire region showed positive values, which indicates a uniform variation. It should be noted that higher positive values occurred in Tianshan and Kunlun Mountains areas, implying that evapotranspiration varied more significantly in these high-altitude areas. In Figure 3, the time coefficients showed a large inter-annual variability, demonstrating a high comparability with the temporal changes of annual mean evapotranspiration. The first EOF spatial mode for RCP4.5 was comparable with that for RCP8.5, which explains about 36.4% of total variance in evapotranspiration. Similarly, relatively strong variations occurred in the Tianshan and Kunlun Mountain areas and weak positive areas were distributed in the Taklimakan desert and Gurbantunggut desert areas. The corresponding time coefficients also showed a strong inter-annual evapotranspiration variation during the period of 2021–2050.
3.3. Evapotranspiration Changes Related to Precipitation and Temperature
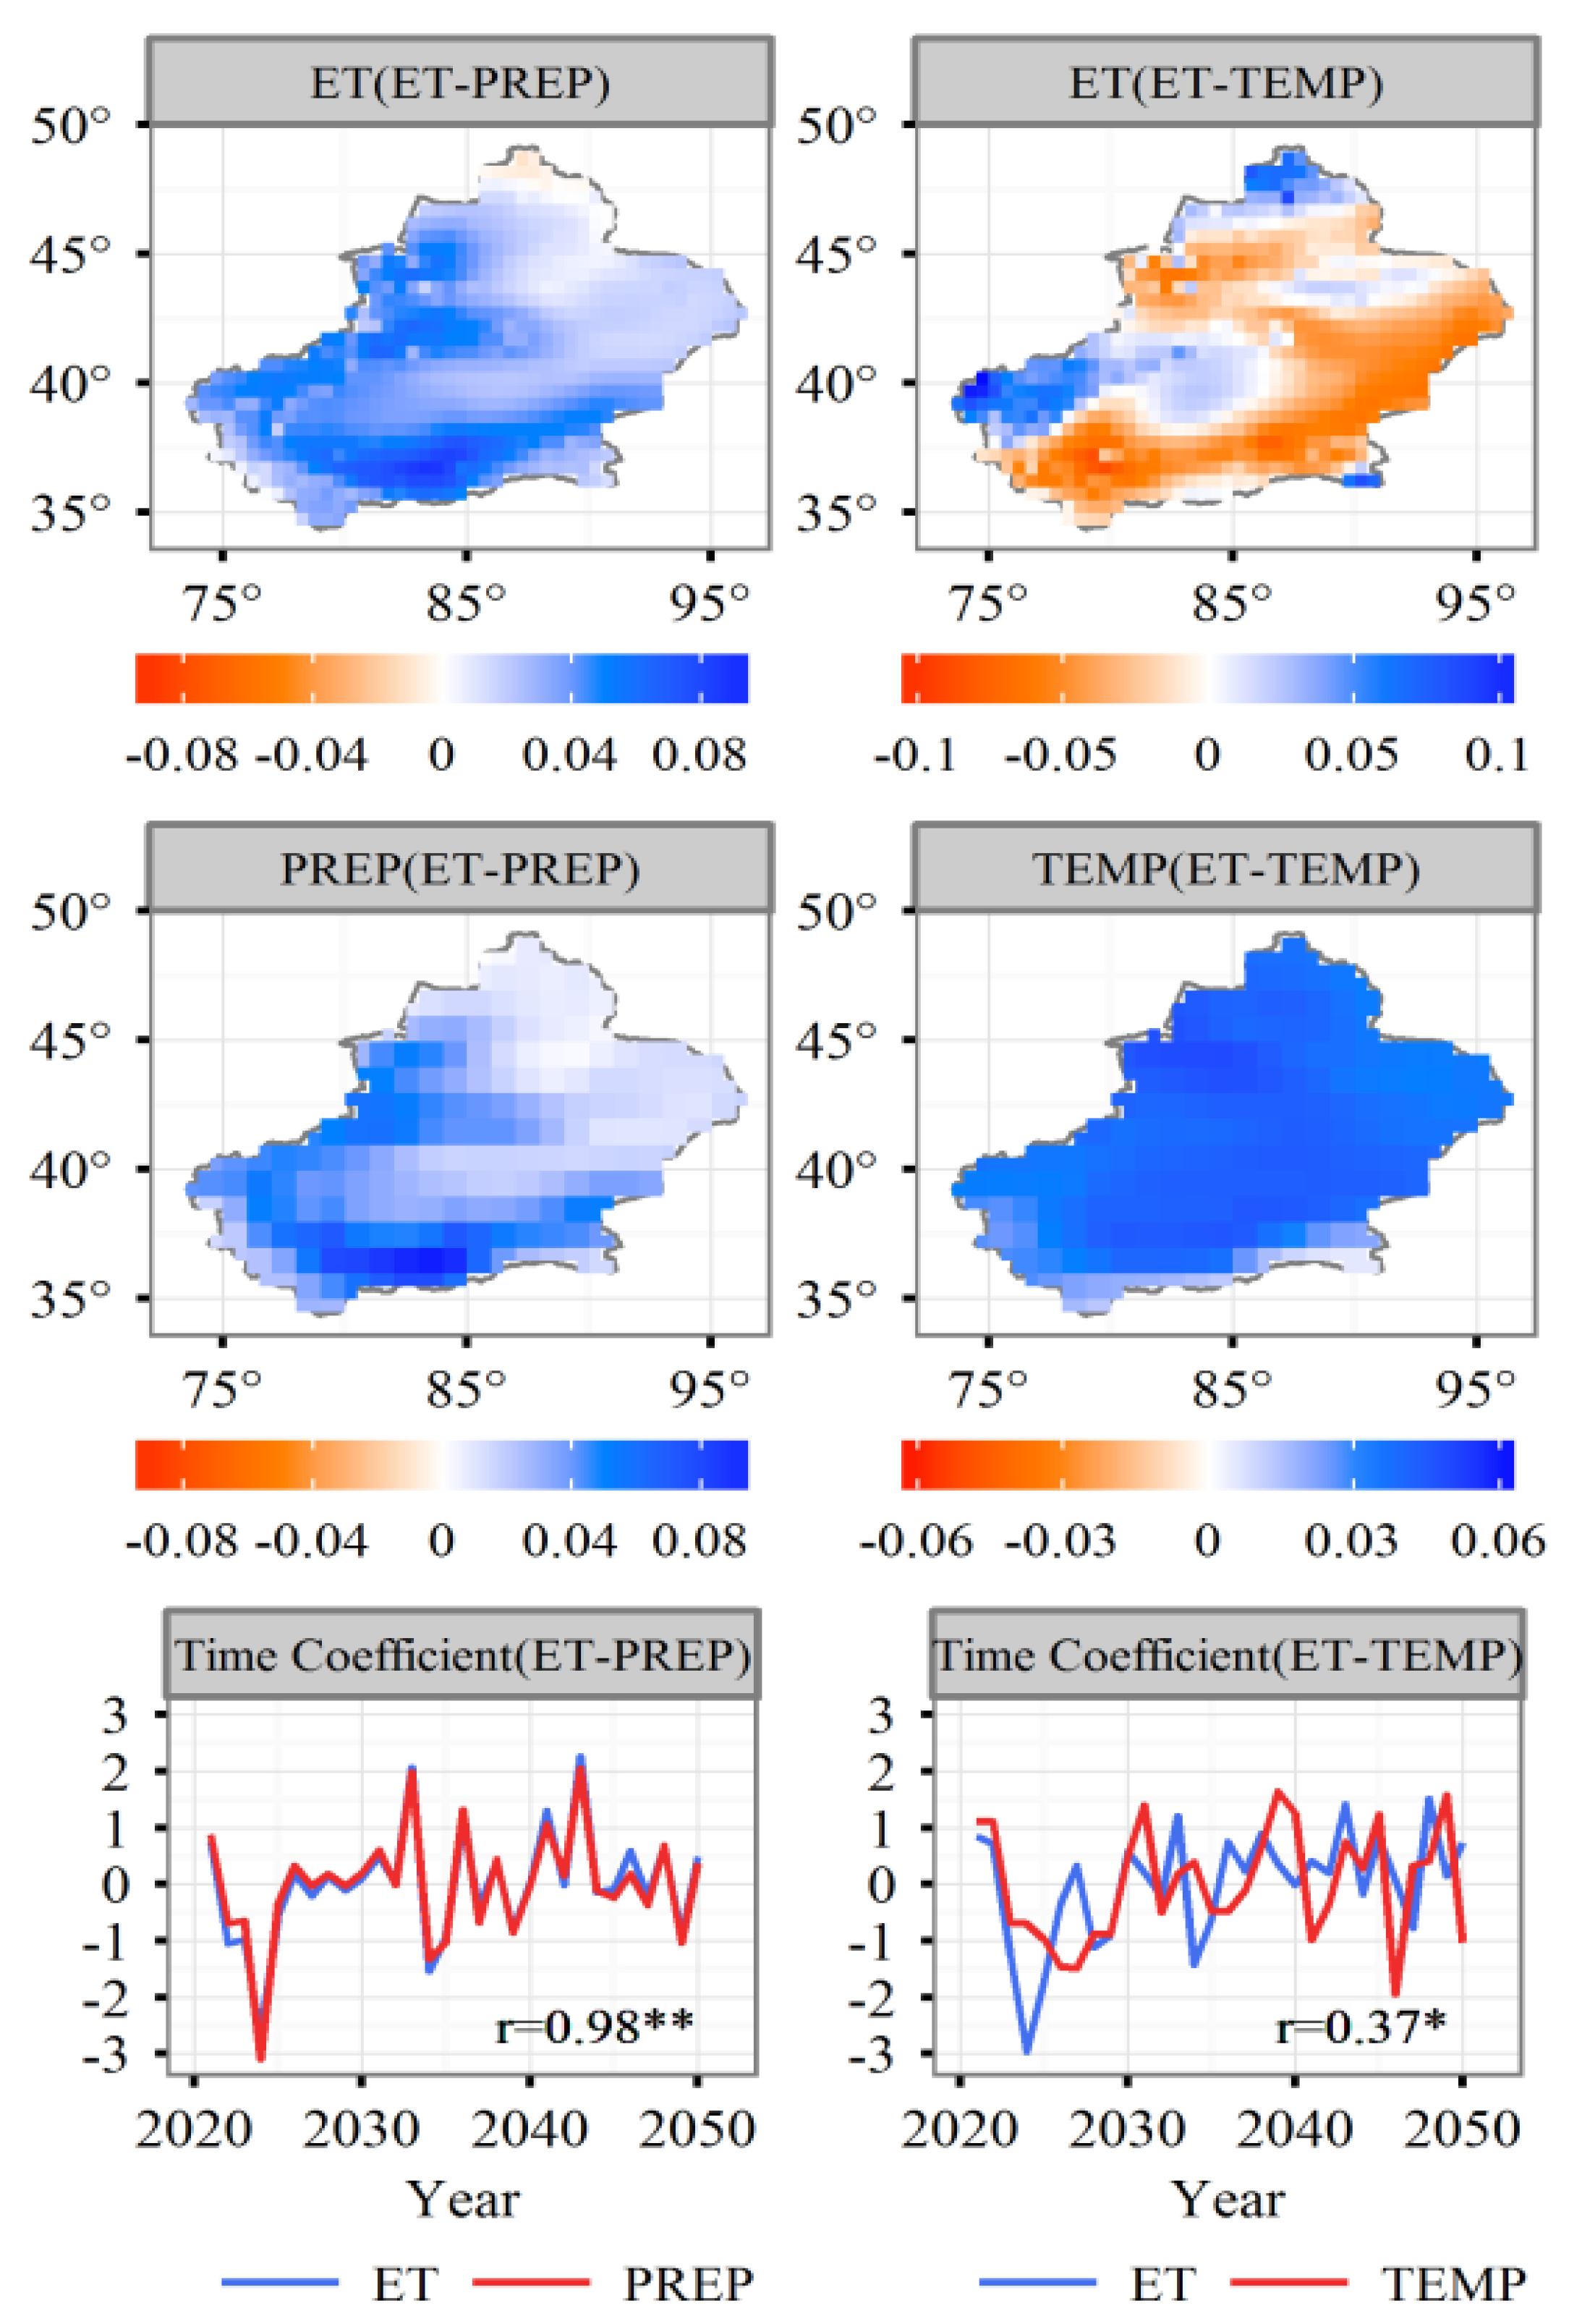
In this section, SVD analysis is used to examine inter-annual variations of evapotranspiration linked to changes in temperature and precipitation during 2021–2050. Figure 8 shows the spatial structures and corresponding time coefficients of the first paired modes of evapotranspiration-precipitation and evapotranspiration-temperature under the RCP4.5 scenario. The first spatial mode of evapotranspiration-precipitation explains about 74.2% of the total squared covariance between the two fields, with a correlation of 0.98 between the two time series of coefficients. The spatial patterns of evapotranspiration fields were characterized by high positive values in the Tianshan and Kunlun Mountain areas and small values in the Taklimakan desert and Gurbantunggut desert, which is similar to the corresponding precipitation fields. The strong relationship of covariance between evapotranspiration and precipitation indicates that more precipitation will yield more evapotranspiration. The first paired spatial mode of evapotranspiration-temperature under RCP4.5 explained 67.9% of covariability, with a correlation of 0.37 between two time series of coefficients. The evapotranspiration patterns showed an obvious separation that positive evapotranspiration anomalies were found in southeastern areas and negative evapotranspiration anomalies were mainly distributed in northwestern Xinjiang. For the temperature fields, almost the entire region showed positive anomalies, which indicates a uniform variation for the temperature. The features of evapotranspiration and temperature for the first mode revealed that the higher temperature will give rise to a reduction of evapotranspiration in southeastern parts of Xinjiang in the future period of 2021–2050.
The spatial patterns of evapotranspiration-precipitation and evapotranspiration–temperature under the RCP8.5 scenario were similar to those under RCP4.5 (Figure 9). The first spatial mode can explain about 67.7% of covariability for evapotranspiration-precipitation and 81.3% for evapotranspiration-temperature. The correlation between the two time series of coefficients was 0.99 for evapotranspiration-precipitation and 0.51 for evapotranspiration-temperature, respectively. Overall, SVD analyses under both scenarios suggested that the changes in evapotranspiration were more closely associated with the local precipitation variability than with local temperature variability.
4. Discussion
Evapotranspiration is the highest outgoing water flux in the hydrological cycle and is of vital importance in assessing the effects of climate change in water availability in Xinjiang. Based on the simulation of global evapotranspiration, Pan, et al. [36] reported that decreased evapotranspiration would mainly take place in regions in Central and Western Asia during the 2090s. Jun et al. [18] also found that the deficit of available water resources would lead to a negative global land surface evapotranspiration trend. This simulation is close to our study in that the annual mean evapotranspiration during 2041–2050 will decrease by 0.3 mm under RCP4.5 scenario and by 0.4 mm under RCP8.5 scenario, relative to 1996–2005. However, the predictive values of evapotranspiration decreases are small and did not show significant trends, which may be the result of the relatively short study period. As a consequence of global warming, the enhanced water cycles have been reported at regional and global scales, and the intensification of water cycles has been expected to continue for the rest of 21st century [37,38]. Under the warming trend, the proportion of glacial melt water has enhanced, which is associated with the increase of runoff from 41.5% to 46.5% over the past 50 years [39,40], which will exert impacts on hydrology and water resources. Due to less water dissipated and more water recharged by glacial melt water, water resources will become more available for agriculture development.
Experimental and model-based studies have shown that Xinjiang has been experiencing a transition from a warm-dry to a warm-wet climate [16,41]. The rate of increased temperatures was likely to maintain the recent rate of near future temperatures found under the low and middle emission scenarios [42]. It has been partly verified in our study that the temperature will continue to increase before the middle of 21st century. However, the precipitation did not show a significant trend under either scenario. The spatial patterns of precipitation changes showed an obvious relation with the longitude, which was characterized by a wet trend in eastern and southern areas and a dry trend in western areas. The CCSM-based spatial changes of precipitation in this study are in concordance with previous studies that showed that precipitation will increase in Eastern Tianshan Mountain regions, and will reduce in the Western Tianshan Mountain and Taklimakan desert regions [15,41,42]. The projection of air temperature change is relatively reliable, while that of precipitation change is highly variable [16]. The changes in precipitation are much more complex and variable than those in temperature. Such changes in climate would exert a profound effect on evapotranspiration, which are demonstrated in our study. Similar to previous studies in this region, results showed that the evapotranspiration is influenced, to a large extent, by precipitation [10,11]. Based on SVD analysis, our results show that the changes in evapotranspiration are closely linked to local precipitation changes. In terms of spatial structure of evapotranspiration changes, strong variations of evapotranspiration occurred in the Tianshan and Kunlun Mountain areas and weak variations distributed in the Taklimakan and Gurbantunggut deserts, which is similar to the spatial structures of precipitation rather than the temperature, implying that precipitation plays a dominant role in determining the spatial changes of evapotranspiration.
It is common to find that the GCM data could better simulate temperature than precipitation, particularly in the spatial distributions. Moreover, the GCM projected temperature indicated steadier increasing trends than precipitation. The simulated largest deviation from precipitation always appears in a region with greatly undulating terrain (e.g., Tianshan, Pamir, and Karakoram Mountain regions of Xinjiang) [43]. With the sparse distribution of meteorological stations in the high mountains, the limited interpolation of climate factor might cause uncertainty in spatial and temporal climate change, especially for precipitation. Regarding precipitation, the spatial and temporal variabilities are mainly dependent on meteorological and topographic factors [43]. Such great biases for different GCM scenarios would be major limitations of this study. The appropriate downscaling methods are important for a simulation of climate variables, which should be applied in the next study. In order to effectively minimize uncertainty related to the selection of the climate model, there are many downscaling GCM technologies. For example, Luo et al. [42] used downscaling approaches based on the median of ensemble GCMs to reduce uncertainty in Xinjiang; Su et al. [44] used a dynamic downscaling technology to minimize uncertainty in the Tarim River basin of Xinjiang. Combining GCMs with remote sensing data would also be an effective method for local climate change research.
Model structures and special representations of hydrological processes may cause different results when compared with other land surface models. Kingston, et al. [45] has indicated that differences in evapotranspiration with a change signal of over 100% are found, and the choice of evapotranspiration method can determine the projection direction of future water resources. Other factors such as carbon dioxide, nitrogen deposition, ozone pollution, and nitrogen fertilizer application may affect the evapotranspiration, which are not involved in this study. However, previous studies have indicated that such factors may not be as important as climate variability in regional scale simulations [20,22]. In addition, the high percentage of captured covariance between evapotranspiration and precipitation suggest that the climate forcing dataset, particularly for the precipitation, is a primary factor in controlling evapotranspiration estimates. Although precipitation in this region under different scenarios presents distinct changing patterns, the low resolution of climate projections from one global climate model in this study (1.25° × 0.9°) may not reveal topography related details and effects clearly. Shi et al. [16] reported that, due to various uncertainties such as man-made increases of greenhouse gases, non-human or natural factors (e.g., solar activity change) also may have contributed to recent climate change. The results of numerical climate simulations could be very variable. Therefore, further work is required to detect, assess, and understand multi-model ensembles of projections of future climate datasets to reduce uncertainties.
Our results indicated that predicted evapotranspiration under the two RCP scenarios (RCP4.5 and RCP8.5) showed decreasing trends in the Taklimakan and Gurbantunggut deserts, which were similar to the corresponding precipitation. It implied that these two deserts will become drier in the future. The desert vegetation here might be more fragile and unstable. Water use efficiency of agricultural irrigation should be improved and agricultural planting structure should also be optimized in the agricultural oases around deserts. Therefore, available water resources should be partitioned into ecological water for natural vegetation in the downstream desert.
5. Conclusions
In this study, CoLM, including local ecological processes of arid regions, was used to forecast evapotranspiration changes under middle and high GCM emission scenarios in the future period of 2021–2050. Our results suggested that the spatial and temporal changes in the predicted evapotranspiration under the two RCP scenarios (RCP4.5 and RCP8.5) was similar when compared to the greater variations in high mountain ranges and lesser variations distributed in lowlands. The significantly increased temperature might not change the spatial pattern of evapotranspiration in the future, but the precipitation changes in the mountains would be more sensitive to that of evapotranspiration than in the arid regions of Xinjiang.
By assessing the effects and possible influences of precipitation and temperature changes on evapotranspiration variations using the SVD technique, this study revealed the high percentage of captured covariance between evapotranspiration and precipitation, as well as the strong correlation found in the time series between them, and strongly suggested that the precipitation would be the most important factor for affecting the evapotranspiration trend. Therefore, assessing and understanding multi-model ensembles of future climate projections and datasets is vitally important when determining a reasonable future simulation of evapotranspiration.
Author Contributions
Formal analysis, X.Y.; Funding acquisition, J.B.; Supervision, J.B.; Visualization, X.Y.; Writing—original draft, X.Y.; Writing—review & editing, J.B.
Funding
This research was funded by Key Laboratory Project of Xinjiang Uygur Autonomous Region, China [2016D03004].
Conflicts of Interest
The authors declare no conflict of interest.
References
- Wang, B.; Zhang, M.; Wei, J.; Wang, S.; Li, S.; Ma, Q.; Li, X.; Pan, S. Changes in extreme events of temperature and precipitation over Xinjiang, Northwest China, during 1960–2009. Quat. Int. 2013, 298, 141–151. [Google Scholar] [CrossRef]
- Su, H.; Shen, Y.; Han, P.; Li, J.; Lan, Y.-C. Precipitation and its impact on water resources and ecological environment in Xinjiang region. J. Glaciol. Geocryol. 2007, 29, 343–350. [Google Scholar]
- Jia, B.Q.; Zhang, Z.Q.; Ci, L.J.; Ren, Y.P.; Pan, B.R.; Zhang, Z. Oasis land-use dynamics and its influence on the oasis environment in Xinjiang, China. J. Arid Environ. 2004, 56, 11–26. [Google Scholar] [CrossRef]
- Li, B.F.; Chen, Y.N.; Chen, Z.S.; Li, W.H. Trends in runoff versus climate change in typical rivers in the arid region of Northwest China. Quat. Int. 2012, 282, 87–95. [Google Scholar] [CrossRef]
- Xue, Y.; Han, P.; Feng, G. Change trend of the precipitation and air temperature in Xinjiang since recent 50 years. Arid Zone Res. 2002, 20, 127–130. [Google Scholar]
- Hu, Z.; Zhou, Q.; Chen, X.; Qian, C.; Wang, S.; Li, J. Variations and changes of annual precipitation in central asia over the last century. Int. J. Clim. 2017, 37, 157–170. [Google Scholar] [CrossRef]
- Liljedahl, A.; Hinzman, L.; Harazono, Y.; Zona, D.; Tweedie, C.; Hollister, R.D.; Engstrom, R.; Oechel, W. Nonlinear controls on evapotranspiration in arctic coastal wetlands. Biogeosciences 2011, 8, 3375–3389. [Google Scholar] [CrossRef] [Green Version]
- Anderson, M.C.; Allen, R.G.; Morse, A.; Kustas, W.P. Use of landsat thermal imagery in monitoring evapotranspiration and managing water resources. Remote Sens. Environ. 2012, 122, 50–65. [Google Scholar] [CrossRef]
- Oki, T.; Kanae, S. Global hydrological cycles and world water resources. Science 2006, 313, 1068–1072. [Google Scholar] [CrossRef] [PubMed]
- Liu, B.; Ma, Z.; Feng, J.; Wei, R. The relationship between pan evaporation and actual evapotranspiration in Xinjiang since 1960. Acta Geogr. Sin. 2008, 63, 1131–1139. [Google Scholar]
- Yuan, X.; Bai, J.; Li, L.; Kurban, A.; De Maeyer, P. The dominant role of climate change in determining changes in evapotranspiration in Xinjiang, China from 2001 to 2012. PLoS ONE 2017, 12, e0183071. [Google Scholar] [CrossRef] [PubMed]
- Chen, X.; Li, B.; Li, Q.; Li, J.; Abdulla, S. Spatio-temporal pattern and changes of evapotranspiration in arid central asia and Xinjiang of China. J. Arid Land 2012, 4, 105–112. [Google Scholar] [CrossRef]
- Stocker, T. Climate Change 2013: The Physical Science Basis: Working Group I Contribution to the Fifth Assessment Report of the Intergovernmental Panel on Climate Change; Cambridge University Press: Cambridge, UK, 2014. [Google Scholar]
- Hu, Z.; Zhang, C.; Hu, Q.; Tian, H. Temperature changes in central asia from 1979 to 2011 based on multiple datasets. J. Clim. 2014, 27, 1143–1167. [Google Scholar] [CrossRef]
- Li, L.; Bai, L.; Yao, Y.; Yang, Q. Projection of climate change in Xinjiang under ipcc sres. Resour. Sci. 2012, 34, 602–612. (In Chinese) [Google Scholar]
- Shi, Y.F.; Shen, Y.P.; Kang, E.; Li, D.L.; Ding, Y.J.; Zhang, G.W.; Hu, R.J. Recent and future climate change in Northwest China. Clim. Chang. 2007, 80, 379–393. [Google Scholar] [CrossRef]
- Zhang, K.; Kimball, J.S.; Nemani, R.R.; Running, S.W.; Hong, Y.; Gourley, J.J.; Yu, Z. Vegetation greening and climate change promote multidecadal rises of global land evapotranspiration. Sci. Rep. 2015, 5, 15956. [Google Scholar] [CrossRef] [PubMed]
- Jung, M.; Reichstein, M.; Ciais, P.; Seneviratne, S.I.; Sheffield, J.; Goulden, M.L.; Bonan, G.; Cescatti, A.; Chen, J.Q.; de Jeu, R.; et al. Recent decline in the global land evapotranspiration trend due to limited moisture supply. Nature 2010, 467, 951–954. [Google Scholar] [CrossRef] [PubMed] [Green Version]
- Yang, K.; Wu, H.; Qin, J.; Lin, C.; Tang, W.; Chen, Y. Recent climate changes over the tibetan plateau and their impacts on energy and water cycle: A review. Glob. Planet. Chang. 2014, 112, 79–91. [Google Scholar] [CrossRef]
- Yang, Q.; Tian, H.; Li, X.; Tao, B.; Ren, W.; Chen, G.; Lu, C.; Yang, J.; Pan, S.; Banger, K. Spatiotemporal patterns of evapotranspiration along the north american east coast as influenced by multiple environmental changes. Ecohydrology 2015, 8, 714–725. [Google Scholar] [CrossRef]
- Shi, X.; Mao, J.; Thornton, P.E.; Huang, M. Spatiotemporal patterns of evapotranspiration in response to multiple environmental factors simulated by the community land model. Environ. Res. Lett. 2013, 8, 024012. [Google Scholar] [CrossRef]
- Liu, M.; Tian, H.; Lu, C.; Xu, X.; Chen, G.; Ren, W. Effects of multiple environment stresses on evapotranspiration and runoff over eastern China. J. Hydrol. 2012, 426–427, 39–54. [Google Scholar] [CrossRef]
- Liu, M.; Tian, H.; Chen, G.; Ren, W.; Zhang, C.; Liu, J. Effects of land-use and land-cover change on evapotranspiration and water yield in China during 1900–2001. J. Am. Water Resour. Assoc. 2008, 44, 1193–1207. [Google Scholar] [CrossRef]
- Jing, C.Q.; Li, L.; Chen, X.; Luo, G.P. Comparison of root water uptake functions to simulate surface energy fluxes within a deep-rooted desert shrub ecosystem. Hydrol. Process. 2014, 28, 5436–5449. [Google Scholar] [CrossRef]
- Li, L.; Van der Tol, C.; Chen, X.; Jing, C.; Su, B.; Luo, G.; Tian, X. Representing the root water uptake process in the common land model for better simulating the energy and water vapour fluxes in a central asian desert ecosystem. J. Hydrol. 2013, 502, 145–155. [Google Scholar] [CrossRef]
- Xu, H.; Li, Y.; Xu, G.; Zou, T. Ecophysiological response and morphological adjustment of two central Asian desert shrubs towards variation in summer precipitation. Plant Cell Environ. 2007, 30, 399–409. [Google Scholar] [CrossRef] [PubMed]
- Li, L.; Wang, Y.; Yu, Q.; Pak, B.; Eamus, D.; Yan, J.; Gorsel, E.; Baker, I.T. Improving the responses of the australian community land surface model (cable) to seasonal drought. J. Geophys. Res. Biogeosci. 2012, 117. [Google Scholar] [CrossRef]
- Li, C.; Zhang, C.; Luo, G.; Chen, X. Modeling the carbon dynamics of the dryland ecosystems in Xinjiang, China from 1981 to 2007—The spatiotemporal patterns and climate controls. Ecol. Model. 2013, 267, 148–157. [Google Scholar] [CrossRef]
- Dai, Y.J.; Dickinson, R.E.; Wang, Y.P. A two-big-leaf model for canopy temperature, photosynthesis, and stomatal conductance. J. Clim. 2004, 17, 2281–2299. [Google Scholar] [CrossRef]
- Bonan, G.B. A Land Surface Model (Lsm Version 1.0) for Ecological, Hydrological, and Atmospheric Studies: Technical Description and User’s Guide; NCAR Tech. Note NCAR/TN-417+STR; Atmospheric Research: Boulder, CO, USA, 1996. [Google Scholar]
- Dickinson, E.; Henderson-Sellers, A.; Kennedy, J. Biosphere-Atmosphere Transfer Scheme (Bats) Version 1e as Coupled to the Ncar Community Climate Model; NCAR Tech. Note NCAR/TN-387+STR; Atmospheric Research: Boulder, CO, USA, 1993. [Google Scholar]
- Philip, J.R. Evaporation, and moisture and heat fields in the soil. J. Meteorol. 1957, 14, 354–366. [Google Scholar] [CrossRef]
- Hao, L.; Pan, C.; Liu, P.L.; Zhou, D.C.; Zhang, L.X.; Xiong, Z.; Liu, Y.Q.; Sun, G. Detection of the coupling between vegetation leaf area and climate in a multifunctional watershed, Northwestern China. Remote Sens. 2016, 8. [Google Scholar] [CrossRef]
- Li, J.; Fan, K.; Zhou, L.M. Satellite observations of el nino impacts on eurasian spring vegetation greenness during the period 1982–2015. Remote. Sens. 2017, 9, 628. [Google Scholar] [CrossRef]
- Bretherton, C.S.; Smith, C.; Wallace, J.M. An intercomparison of methods for finding coupled patterns in climate data. J. Clim. 1992, 5, 541–560. [Google Scholar] [CrossRef]
- Pan, S.; Tian, H.; Dangal, S.R.; Yang, Q.; Yang, J.; Lu, C.; Tao, B.; Ren, W.; Ouyang, Z. Responses of global terrestrial evapotranspiration to climate change and increasing atmospheric CO2 in the 21st century. Earth's Future 2015, 3, 15–35. [Google Scholar] [CrossRef]
- Durack, P.J.; Wijffels, S.E.; Matear, R.J. Ocean salinities reveal strong global water cycle intensification during 1950 to 2000. Science 2012, 336, 455–458. [Google Scholar] [CrossRef] [PubMed]
- Betts, R.A.; Boucher, O.; Collins, M.; Cox, P.M.; Falloon, P.D.; Gedney, N.; Hemming, D.L.; Huntingford, C.; Jones, C.D.; Sexton, D.M. Projected increase in continental runoff due to plant responses to increasing carbon dioxide. Nature 2007, 448, 1037–1041. [Google Scholar] [CrossRef] [PubMed]
- Gao, X.; Ye, B.S.; Zhang, S.Q.; Qiao, C.J.; Zhang, X.W. Glacier runoff variation and its influence on river runoff during 1961–2006 in the Tarim River Basin, China. Sci. China Earth Sci. 2010, 53, 880–891. [Google Scholar] [CrossRef]
- Chen, Y.; Li, Z.; Fan, Y.; Wang, H.; Deng, H. Progress and prospects of climate change impacts on hydrology in the arid region of Northwest China. Environ. Res. 2015, 139, 11–19. [Google Scholar] [CrossRef] [PubMed]
- Mannig, B.; Muller, M.; Starke, E.; Merkenschlager, C.; Mao, W.Y.; Zhi, X.F.; Podzun, R.; Jacob, D.; Paeth, H. Dynamical downscaling of climate change in central Asia. Glob. Planet. Chang. 2013, 110, 26–39. [Google Scholar] [CrossRef]
- Luo, M.; Liu, T.; Frankl, A.; Duan, Y.C.; Meng, F.H.; Bao, A.M.; Kurban, A.; De Maeyer, P. Defining spatiotemporal characteristics of climate change trends from downscaled gcms ensembles: How climate change reacts in Xinjiang, China. Int. J. Clim. 2018, 38, 2538–2553. [Google Scholar] [CrossRef]
- Zhu, B.; Xue, L.; Wei, G.; Zhang, L.; Chen, X. Cmip5 projected changes in temperature and precipitation in arid and humid basins. Theor. Appl. Climatol. 2018, 1, 1–12. [Google Scholar] [CrossRef]
- Su, B.D.; Jian, D.N.; Li, X.C.; Wang, Y.J.; Wang, A.Q.; Wen, S.S.; Tao, H.; Hartmann, H. Projection of actual evapotranspiration using the cosmo-clm regional climate model under global warming scenarios of 1.5 °C and 2.0 °C in the Tarim River Basin, China. Atmos. Res. 2017, 196, 119–128. [Google Scholar] [CrossRef]
- Kingston, D.G.; Todd, M.C.; Taylor, R.G.; Thompson, J.R.; Arnell, N.W. Uncertainty in the estimation of potential evapotranspiration under climate change. Geophys. Res. Lett. 2009, 36, 1437–1454. [Google Scholar] [CrossRef]
Figure 1.
The topography (a); land use cover (b); mean annual temperature (c); and mean annual precipitation (d) of study area. The mean annual temperature and precipitation during 1996–2005 with a spatial resolution of 0.5° × 0.5° was developed by the China National Meteorological Information Center.

Figure 2.
The flowchart of this study.

Figure 3.
Temporal changes in temperature (a) and precipitation (b) during 2021–2050 under Representative Concentration Pathways (RCP4.5) and RCP8.5 scenarios (* p < 0.1, ** p < 0.05).
Figure 3.
Temporal changes in temperature (a) and precipitation (b) during 2021–2050 under Representative Concentration Pathways (RCP4.5) and RCP8.5 scenarios (* p < 0.1, ** p < 0.05).

Figure 4.
Spatial variations in temperature (top) and precipitation (bottom) during 2041–2050, compared to the historical period during 1996–2005 under RCP4.5 and RCP8.5 scenarios.
Figure 4.
Spatial variations in temperature (top) and precipitation (bottom) during 2041–2050, compared to the historical period during 1996–2005 under RCP4.5 and RCP8.5 scenarios.

Figure 5.
Temporal variations in evapotranspiration during 2021–2050 under RCP4.5 and RCP8.5 scenarios.
Figure 5.
Temporal variations in evapotranspiration during 2021–2050 under RCP4.5 and RCP8.5 scenarios.

Figure 6.
Spatial variations in evapotranspiration during 2041–2050, compared to the historical period during 1996–2005 under RCP4.5 (left) and RCP8.5 scenarios (right).
Figure 6.
Spatial variations in evapotranspiration during 2041–2050, compared to the historical period during 1996–2005 under RCP4.5 (left) and RCP8.5 scenarios (right).

Figure 7.
The first leading spatial mode (top) and associated time coefficients (bottom) of evapotranspiration obtained from Empirical Orthogonal Function (EOF) analyses under RCP4.5 and RCP8.5 scenarios.
Figure 7.
The first leading spatial mode (top) and associated time coefficients (bottom) of evapotranspiration obtained from Empirical Orthogonal Function (EOF) analyses under RCP4.5 and RCP8.5 scenarios.

Figure 8.
The first leading pair of spatial mode and associated time coefficients of Evapotranspiration (ET) under RCP4.5 scenario obtained from Singular Value Decomposition (SVD) analyses (* p < 0.1, ** p < 0.05).
Figure 8.
The first leading pair of spatial mode and associated time coefficients of Evapotranspiration (ET) under RCP4.5 scenario obtained from Singular Value Decomposition (SVD) analyses (* p < 0.1, ** p < 0.05).

Figure 9.
The first leading pair of spatial mode and associated time coefficients of evapotranspiration under RCP8.5 scenario obtained from SVD analyses (** p < 0.05).
Figure 9.
The first leading pair of spatial mode and associated time coefficients of evapotranspiration under RCP8.5 scenario obtained from SVD analyses (** p < 0.05).

© 2018 by the authors. Licensee MDPI, Basel, Switzerland. This article is an open access article distributed under the terms and conditions of the Creative Commons Attribution (CC BY) license (http://creativecommons.org/licenses/by/4.0/).
Share and Cite
MDPI and ACS Style
Yuan, X.; Bai, J. Future Projected Changes in Local Evapotranspiration Coupled with Temperature and Precipitation Variation. Sustainability 2018, 10, 3281. https://doi.org/10.3390/su10093281
AMA Style
Yuan X, Bai J. Future Projected Changes in Local Evapotranspiration Coupled with Temperature and Precipitation Variation. Sustainability. 2018; 10(9):3281. https://doi.org/10.3390/su10093281
Chicago/Turabian StyleYuan, Xiuliang, and Jie Bai. 2018. "Future Projected Changes in Local Evapotranspiration Coupled with Temperature and Precipitation Variation" Sustainability 10, no. 9: 3281. https://doi.org/10.3390/su10093281
Note that from the first issue of 2016, this journal uses article numbers instead of page numbers. See further details here.