The Impact of Immigrant Diversity on Wages. The Spanish Experience


Department of Economics and Institute of International Economics, Campus Riu Sec, Universitat Jaume I, 12071 Castellon, Spain
*
Author to whom correspondence should be addressed.
Sustainability 2018, 10(9), 3312; https://doi.org/10.3390/su10093312
Submission received: 25 July 2018
/
Revised: 9 September 2018
/
Accepted: 10 September 2018
/
Published: 17 September 2018
(This article belongs to the Special Issue Economic Geography: Location, Innovation and Sustainable Development)
Abstract
:The massive waves of migration that have emerged as part of the recent globalization process have attracted increasing attention in the field of economic geography. Traditionally, empirical research on this issue has focused on the possible substitution effect between native and foreign workers in the labour market. However, this evaluation omits the potential positive spillovers derived from a greater cultural diversity related to immigration. The aim of this work is to fill this gap by analysing the impact that immigrant diversity has on wages in Spain. To do so, we built three different indexes that measure cultural diversity across the Spanish regions. We control for the problem of potential simultaneity between migration and wages using instrumental variable techniques. We also consider the role of the increasing entry of foreigners coming from developed economies and other local factors. The results confirm that a greater diversity of immigrants’ birthplaces is associated with higher wages for both natives and the total population. Moreover, our findings reveal the importance of skilled labour (national or foreign), to encourage workers’ productivity and to ensure sustainable economic development.
JEL Classification:
F63; J61; C26; O4; R231. Introduction
During the last few decades, international migration has experienced great changes. According to Arango [1], migration has become more global and diverse in terms of origin and destination countries. For this author, Asia, Africa and Latin America have replaced Europe as the leading regions of origin of migrants. In this sense, the case of Spain is especially outstanding. From the end of the twentieth century to the early years of the twenty-first century, this country has gone from being a net source of migrants to a net recipient, becoming one of the main target countries for immigrants in Europe. In 2017, Spain represented the fourth European country in number of immigrants (after Germany, the United Kingdom and France), with a total population of immigrants of nearly six million and the percentage of immigrants in the total population exceeding 12% [2].
Coinciding with the Spanish economic “boom”, the entry of migrants into the country was remarkable. Spain went from having a total foreign population of 2% in the year 2000 to approximately 12% in 2011 [3]. The economic expansion and the creation of new jobs attracted a massive number of immigrants seeking employment opportunities [4]. For nearly a decade, Spain’s GDP grew yearly by an average 3.9%, which meant a drop in the unemployment rate from 20.6% in 1997 to 8.2% in 2007. However, the economic crisis that started in 2008 and manifested in Spain primarily as an employment crisis led to a radical change in the Spanish migration model [5]. The proportion of immigrants coming for economic reasons, the so-called “labour immigration”, (according to the International Organization for Migration (www.iom.int), international labour migration is defined as the movement of people from one country to another for the purpose of employment.) became less relevant and the weight of immigration from developed countries motivated by socioeconomic reasons increased [1,4]. Regional location preferences also varied during this period, with coastal provinces (including Cantabria and Andalusia) playing a more important role in the attraction of immigrants [6]. Similarly, the variety of immigrants’ countries of birth differs geographically. Regions such as Madrid, Catalonia, the Valencian Community and Andalusia clearly show a higher diversity of immigrants’ birthplaces. In the case of Madrid and Catalonia, this was probably due to the large supply of work available in different sectors and with different skill requirements. For the Valencian Community and Andalusia, the relevance of both the tourist sector and an intensive agriculture, together with the good weather, may explain this higher diversity of immigrants in terms of country of origin [7]. The aim of this work is precisely to analyse how this migrant diversity affected real wages at a regional level in Spain from 2008 to 2016.
Given the recent concern in the European political debate about the effects that the entry of new residents can have on economic and social aspects, it seems relevant to investigate to what extent greater birthplace diversity may influence real wages. The literature on this topic suggests that there may be a positive correlation between immigrant diversity and productivity or wages [8,9,10]. For Lewis and Peri (2014) [11], immigrant diversity may increase worker productivity by enabling the combination of different skills, ideas and perspectives. According to Hong and Page [12], the diversity of human capital increases creativity and helps members to solve problems and generate new ideas. Conversely, other authors argue that the relationship between immigrant diversity and productivity may be ambiguous. For instance, Lee [13], who examined the cultural diversity within the groups of workers of a company, argued that this group-level diversity may lead to lower confidence among workers and poor communication between people, either by discrepancies in the language, misunderstandings or discriminatory attitudes, as some individuals may subconsciously favour members of their own nationality.
Empirically, we go further into this debate in several ways. For the first time, (i) three immigrant diversity indexes, as proposed by Kemeny and Cooke [10] and Alesina et al. [11], have been implemented for the case of Spanish regions to analyse the connections between immigrant diversity and real wages. We did so by focusing on the years after the economic crisis that began at the end of 2007, thus taking into account the changes that occurred in the immigration patterns with the new macroeconomic scenario. The specific case of Spain is of special relevance given the importance of the so-called “permanent tourists” during this period [6]. This phenomenon might indeed mitigate the effects on wages of a greater cultural diversity, thus leading to ambiguous results, since it would be reasonable to expect that many of these immigrants never participate in the labour market. Considering this fact, (ii) we analyse, as a novelty, the impact on real wages of a higher percentage of immigrants coming from developed countries. This allows us to evaluate to what extent a greater share of immigrants coming from countries with a higher income or even a greater level of knowledge, on average, leads to increases in real wages even once we discount the potential positive spillovers derived from a higher cultural diversity. (iii) We further control for other local characteristics such as human capital or the proportion of young population in a region. Additionally, (iv) we face the problem of potential endogeneity using Instrumental Variables (IV) regression techniques. As previously mentioned in the literature, regions with higher wages can also be those that attract more immigrants from different backgrounds [9], thus giving rise to a potential endogeneity problem. To deal with this, we based our work on Gagliardi [14] and Ottaviano and Peri [9] and calculated the “predicted” change in the number of immigrants in each region during the period analysed as an instrumental variable. Finally, (v) to enrich our analysis, but also with a comparative purpose, we analyse whether the spillover effects of higher migration diversity are also felt by the foreign population. With this aim, we estimate an additional model to explain wages of the total population, including natives and foreigners, instead of considering only the nationals’ wages. To do so, we used a database on the 17 Spanish regions (Autonomous Communities) between 2008 and 2016 from the Spanish National Statistics Institute (INE) and the Ministry of Education, Culture and Sports.
The results obtained are in line with those from previous studies, confirming the positive and significant effect of greater diversity of immigrants’ birthplace on real wages. Moreover, this outcome holds in both cases: when we consider the native workers’ wages and when we add foreigners’ wages. We also verify the beneficial impact on real wages of higher immigration coming from developed countries. This illustrates the limitations of ignoring the relevance of heterogeneity of human capital when analysing the economic effects of migration. Finally, our outcomes confirm the beneficial impact of a higher rate of young population and skilled labour on wages.
The rest of the paper is organized as follows. Section 2 reviews the literature on the economic consequences of immigrant diversity. Section 3 shows the construction and analytical decomposition of our immigrant diversity indexes. Section 4 provides some stylized facts analysing the relation between immigrant diversity and wages for the Spanish case. Section 5 explains the data source and the econometric model, including the description of the variables and the theoretical model used to design and interpret our estimation strategy. Section 6 presents the estimation results. Finally, Section 7 concludes with a policy discussion and Section 8 presents some limitations and suggestions for future research on the topic.
2. Immigration Diversity and Wages: An Overview of the Literature
The economic effects of immigration have been widely analysed in many empirical papers. Motivated by a growing concern in modern economies about a substitution effect from more expensive native workers to cheaper immigrant workers, attention has been paid primarily to the impact of immigration on the labour market of destination regions. Questions such as whether immigrants harm or improve the employment conditions and opportunities of native workers have been analysed in depth in the literature, with evidence yielding a mixed and confusing set of results (see [15]). For some authors, this ambiguity indeed reflects a non-significant effect of migration on the receiving economy [16,17].
After the recent waves of immigrants to the Organization for Economic Cooperation and Development (OECD) countries, migration has become a phenomenon that concerns many countries in the developed world [18]. Therefore, it is not surprising to find that a significant number of studies that analyse this phenomenon focus on the macroeconomic effects of this movement using time-series or panel data analysis. For Ortega and Peri [19], for instance, migration in the OECD countries during the period 1980 to 2005 increased employment and capital stock, although the effects on total factor productivity are negligible. Boubtane et al. [20], however, showed a significant relationship between immigration and GDP per capita for 22 OECD countries over the period 1987–2009. Using time-series analysis, Morley [21] found a long-run causality from GDP per capita to immigration but not the other way around. Other authors, such as Zorlu and Hartog [22], Longhi et al. [23] and Ottaviano and Peri [24] have considered that the work offered to natives involves jobs in which they could be replaced by immigrants and so, as a consequence of the arrival of large numbers of immigrants, competitiveness and wages can be reduced.
In recent years, and probably motivated by the greater availability of data, a new perspective, focused on the heterogeneity of immigrants, has been incorporated into this debate, namely, the possibility that greater diversity might have positive effects on workers’ productivity and wages in destination markets. In Table 1, we present a detailed list of papers that analyse the impact of immigrant diversity on regional economic performance.
According to this literature, people born in different countries complement each other in the labour market, and thus immigrant diversity could increase the competitiveness of workers by enabling the combination of different skills, ideas and perspectives. The seminal paper on this matter is Ottaviano and Peri [9]. By using panel data from different American Metropolitan Statistical Areas (MSAs) through cultural heterogeneity indexes, these authors confirmed the positive impact of immigration on wages. The Fractionalization Index calculated by Ottaviano and Peri [9] had previously been used by Alesina et al. [8], who built a Herfindahl index of population diversity based on people’s birthplaces to determine the relationship between diversity migration and wages. However, this index has some limitations. According to Alesina et al. [25] and Kemeny and Cooke [10], it can be biased by the presence of a larger proportion of immigrants in a region. To overcome these limitations, we used two additional indexes: the Entropy Index, first used by Taagepera and Ray [26], and the Alesina Index, proposed by Alesina et al. [25].
Other authors who highlight the favourable effect of immigrant diversity in terms of economic development and wages are Kemeny and Cooke [10] and Bove and Elia [27]. They first found that urban immigrant diversity produces positive and nontrivial spillovers. Similarly, Bove and Elia, after studying the diversity of immigrants through indexes of fractionalization and polarization for different countries in the period between 1960 and 2010, claimed that there is a positive effect between immigrant diversity and greater GDP growth per capita, especially in developing countries. For some authors, such as Wadhwa et al. [28], this positive correlation is further magnified if only skilled immigrants are considered.
Although, as mentioned above, many empirical works emphasize the possibility of a positive relationship between migration diversity and economic development, the evidence on this matter remains quite ambiguous. For instance, Longhi [29] argued that the positive correlation between diversity in English local authority districts and workers’ wages found in cross-sections disappears when we consider panel estimations. Other works find a negative influence of diversity on productivity, thus contemplating the relationship between natives and foreigners as more of a substitution than of a complementary nature. According to this literature, cultural diversity at the group level may lead to lower confidence among workers and poor communication between people, due to discrepancies in the language, misunderstandings or discriminatory attitudes, as some individuals may subconsciously favour members of their own nationality [13]. Borjas and Doran [30] claimed that researchers whose mathematical research programmes included Soviet researchers underwent a reduction in productivity and significantly reduced their number of publications.
Related to this approach are also those works that analyse the spillovers of immigrant diversity in terms of innovation, ideas generated and economic performance. According to Lewis and Peri [11], the evidence suggests that the entry of foreigners into the labor market induces a greater specialization of national workers, which favors the exchange of ideas and innovation, leading to important productivity gains. Using data from more than 200 British firms, Gagliardi [14] showed how an increase in the stock of human capital due to the arrival of skilled immigrants fosters innovation, giving rise to an increase in the level of knowledge which is accessible to local firms through the labour market. Similarly, for Hong and Page [12], the diversity of human capital increases creativity and helps members to solve problems and generate new ideas. More generally, Akay et al. [31] show how ethnic diversity positively influences the well-being of German natives through greater productivity and social capital. They also find that the beneficial influence of ethnic diversity is stronger for immigrant groups that are culturally and economically closer to Germany.
Finally, an issue that has been underexplored within this literature is whether highly productive workers have a particular preference for diversity [32,33]. If that is the case, there might be a problem of reverse causality and endogeneity, since more productive regions can also attract more immigrants from a wider range of nationalities. As an exception, we can mention the following studies that analyse the relationship between diversity migration and labour productivity considering the possibility of a reverse causality: Bakens et al. [34], Trax et al. [35] and Kemeny and Cooke [10]. In this paper, we seek to contribute to this strand of the literature by investigating to what extent greater immigrant diversity influences wages in Spain at a regional level, taking the potential reverse causality and other relevant factors into account.
3. Measuring Immigration Diversity
To measure the diversity of immigrants, we use several indexes based on the Herfindahl diversity index. As Parrotta et al. [36] mentioned, the Herfindahl index allows us to combine two measures within one single index: the “richness”, or number of categories within the region, and the “equitability”, or evenness of the individual categories. In particular, this work uses three indexes as proposed by Kemeny and Cooke [10] in which the diversity of immigrants is measured according to their place of birth: the Fractionalization Index (FI), Entropy Index (EI), and Alesina Index (AI). Each index captures diversity in a different way, giving more weight to the share of immigrants or to the variety (number of birthplaces).
Most of the empirical studies on immigrant diversity employ the Fractionalization Index [8,9,25,27] This index, based on the Herfindahl Index, measures the probability that two migrants, randomly selected from the population of a specific host region, were born in different countries. Specifically, this index can be written as,
where s (0 ≤ s ≤ 1) is the proportion of residents in a region who were born in country r and R represents the maximum number of countries captured in the population. In our case R = 114 including natives. When the index is close to zero, this indicates low diversity, while the closer it is to one, the higher the heterogeneity of the population of the region will be, having as its maximum value .
As an alternative to the FI, Kemeny and Cooke [10] used the Entropy Index, which has also been used by authors such as Wang [37], Sturgis et al. [38] and Wright et al. [39] (entropy, as a mathematical construct, was first introduced into social sciences by Theil [40,41] to solve political problems involving the distribution of seats and votes among various parties and then by Taagepera and Ray [26] as an index of concentration). Like the Fractionalization Index, it measures the probability that two randomly selected individuals were born in different countries. However, for these authors, this index provides a more accurate measure of diversity when the groups of different nationalities are of different sizes.
The Entropy Index reaches its maximum value, when , in the case that the population is totally heterogeneous. Conversely, EI reaches its minimum value, when which implies complete homogeneity or no diversity, with all population members in the same group.
Finally, we use the Alesina Index [25], as proposed by Kemeny and Cooke [10]. As these authors explained, the FI can be biased by the presence of a large proportion of immigrants in a region even if those immigrants do not come from a wide range of countries of origin. That is, this index gives greater weight to depth than to breadth. To overcome this limitation, Alesina et al. [25] suggest measuring diversity strictly among those born abroad in a given place, instead of capturing heterogeneity among all individuals: natives and immigrants. Namely, it captures all residual diversity from differences between immigrants only.
where indicates the share of natives.
In contrast to the first two indexes, which are estimated for the entire population, the AI will not be influenced by the large number of natives in each region as it uses a measure of immigrant-only fractionalization. This approach is able to solve the extent to which the effects arise due to the sole presence of foreign-born individuals, instead of its heterogeneity.
4. Immigration, Birthplace Diversity and Wages: The Case of Spain
Large-scale migration inflows are a relatively recent phenomenon in Spain. Indeed, until the last two decades of the previous century, this country was eminently a source of emigrants [42]. At the beginning of the 20th century, Spain was behind the most developed European countries in terms of industrialization and urban development which led many Spaniards to emigrate to South American countries and North Africa [6,43]. Throughout the 1960s and 1970s, and after the Spanish Civil War, when over 500,000 people left the country given the poor economic conditions and political restrictions in Spain, mass emigration to Europe took place [43].
However, this trend changed dramatically from the early 1990s, and most remarkably after 1997, when immigration flows in Spain began to increase significantly [40]. For nearly a decade, Spain’s GDP grew yearly by an average 3.9%, which meant a drop in the unemployment rate from 20.6% in 1997 to 8.2% in 2007. In just a few decades, fuelled by this economic “boom”, Spain shifted from being a sending country to a receiving country in terms of migration, becoming one of the main destinations for international migration [44]. As can be seen in Figure 1, in 1998 the foreign population represented only 1.6% of the total population, while by 2018 this percentage remains around 7% [2]. The percentage of immigrants in the total population reached a peak of 12.2% during the years 2010 and 2011, even after the beginning of the global crisis in 2008.
During the expansion, immigrants—mostly Europeans, closely followed by Latin Americans and Africans (Moroccans)—moved to Spain in search of more and better employment opportunities without drawing any kind of distinction between the types of position they could be employed in [6,42]. Moreover, despite its low importance until the end of the 20th century, as of 2008, the presence of Asians, especially those from China, increased notably [45]. The beginning of the crisis led to a sudden shift in this trend. As shown in [6], in this period immigrants in Spain coming from developing economies (with a medium or low human development index (HDI)) decreased considerably with respect to those from developed economies (with a high human development index), these latter representing an even greater weight in total migration. Connected with this behaviour were also the new locational preferences and the nature and heterogeneity of immigrants across regions.
In the years before the economic crisis, the vast majority of migrants in Spain were young and came from less developed countries, probably motivated by the hope of finding a new or better job. Therefore, they tended to choose regions with greater economic activity as their destination, and thus they were distributed in cities along the Mediterranean coast in the central and northern regions with higher employment rates and immigrant incomes [6]. In contrast, after the financial crisis, the number of new residents in Spain rapidly decreased and the decision to relocate to Spanish provinces seemed to be determined more by non-economic factors, such as good weather or a better lifestyle. Consequently, there was a greater presence of immigrants from countries with a high human development index located in the coastal regions [6]. Nevertheless, in some regions, such as Andalusia, the migration of non-skilled labourers to work in agricultural areas still predominates.
Concerning the birthplace diversity of immigrants, as can be seen in Figure 2, where we represent the different diversity indexes as computed in the previous section, these significantly vary among regions. We observe a wider range of immigrant in Madrid and Catalonia. According to Otero (2010) [7], this is because their capital cities, Madrid and Barcelona, respectively, are important financial and business centres in Europe. Moreover, due to the large supply of the tertiary sector in these regions, the presence of Ibero-Americans and Africans is also quite significant. If we focus on the Valencian Community and Andalusia, we observe that both regions also have high diversity indexes. There is an important presence of foreigners from the European Union in the two regions. One of the reasons that leads a variety of citizens to migrate to these regions is the good weather and the tourist facilities. In the case of Andalusia, there is also a strong presence of individuals from Africa, especially those with low qualifications, who seek jobs in intensive agriculture. Ibero-Americans are concentrated in Alicante and those from non-EU Europe are more common in Castellón and Valencia (both of them in the Valencian Community). In these regions, the Romanian population is particularly relevant. They mostly arrived before the crisis in search of job opportunities in the construction and tourism sectors. The high diversity of immigrants found in the Balearic and Canary Islands is probably due to the large supply of work found in the services sector, given the great importance that the tourism sector has in both cases. However, in regions such as Extremadura, Asturias or Navarra, there seems to be less diversity in terms of immigrants’ birthplace.
As mentioned previously, the purpose of this paper is to analyse how the degree of immigrant heterogeneity, in terms of birthplace, influences wages across regions. As the economic literature has highlighted, several factors enhance regional productivity and wages. According to Aguayo and Guisán [46], not only physical and human capital determine the level of productivity of a region, but also greater social capital, which includes elements of social trust, political trust and other positive elements that generate a social environment to support productive initiatives and cooperation. In this study, we use real wage per capita as a proxy of worker productivity. In Figure 3, we can observe significant differences in wages between Spaniards and non-nationals. The native population has the highest wages, followed by European citizens, since migrant flows of skilled workers usually predominate among European countries [47]. Among non-nationals, those from Latin America seem to be among the lowest paid.
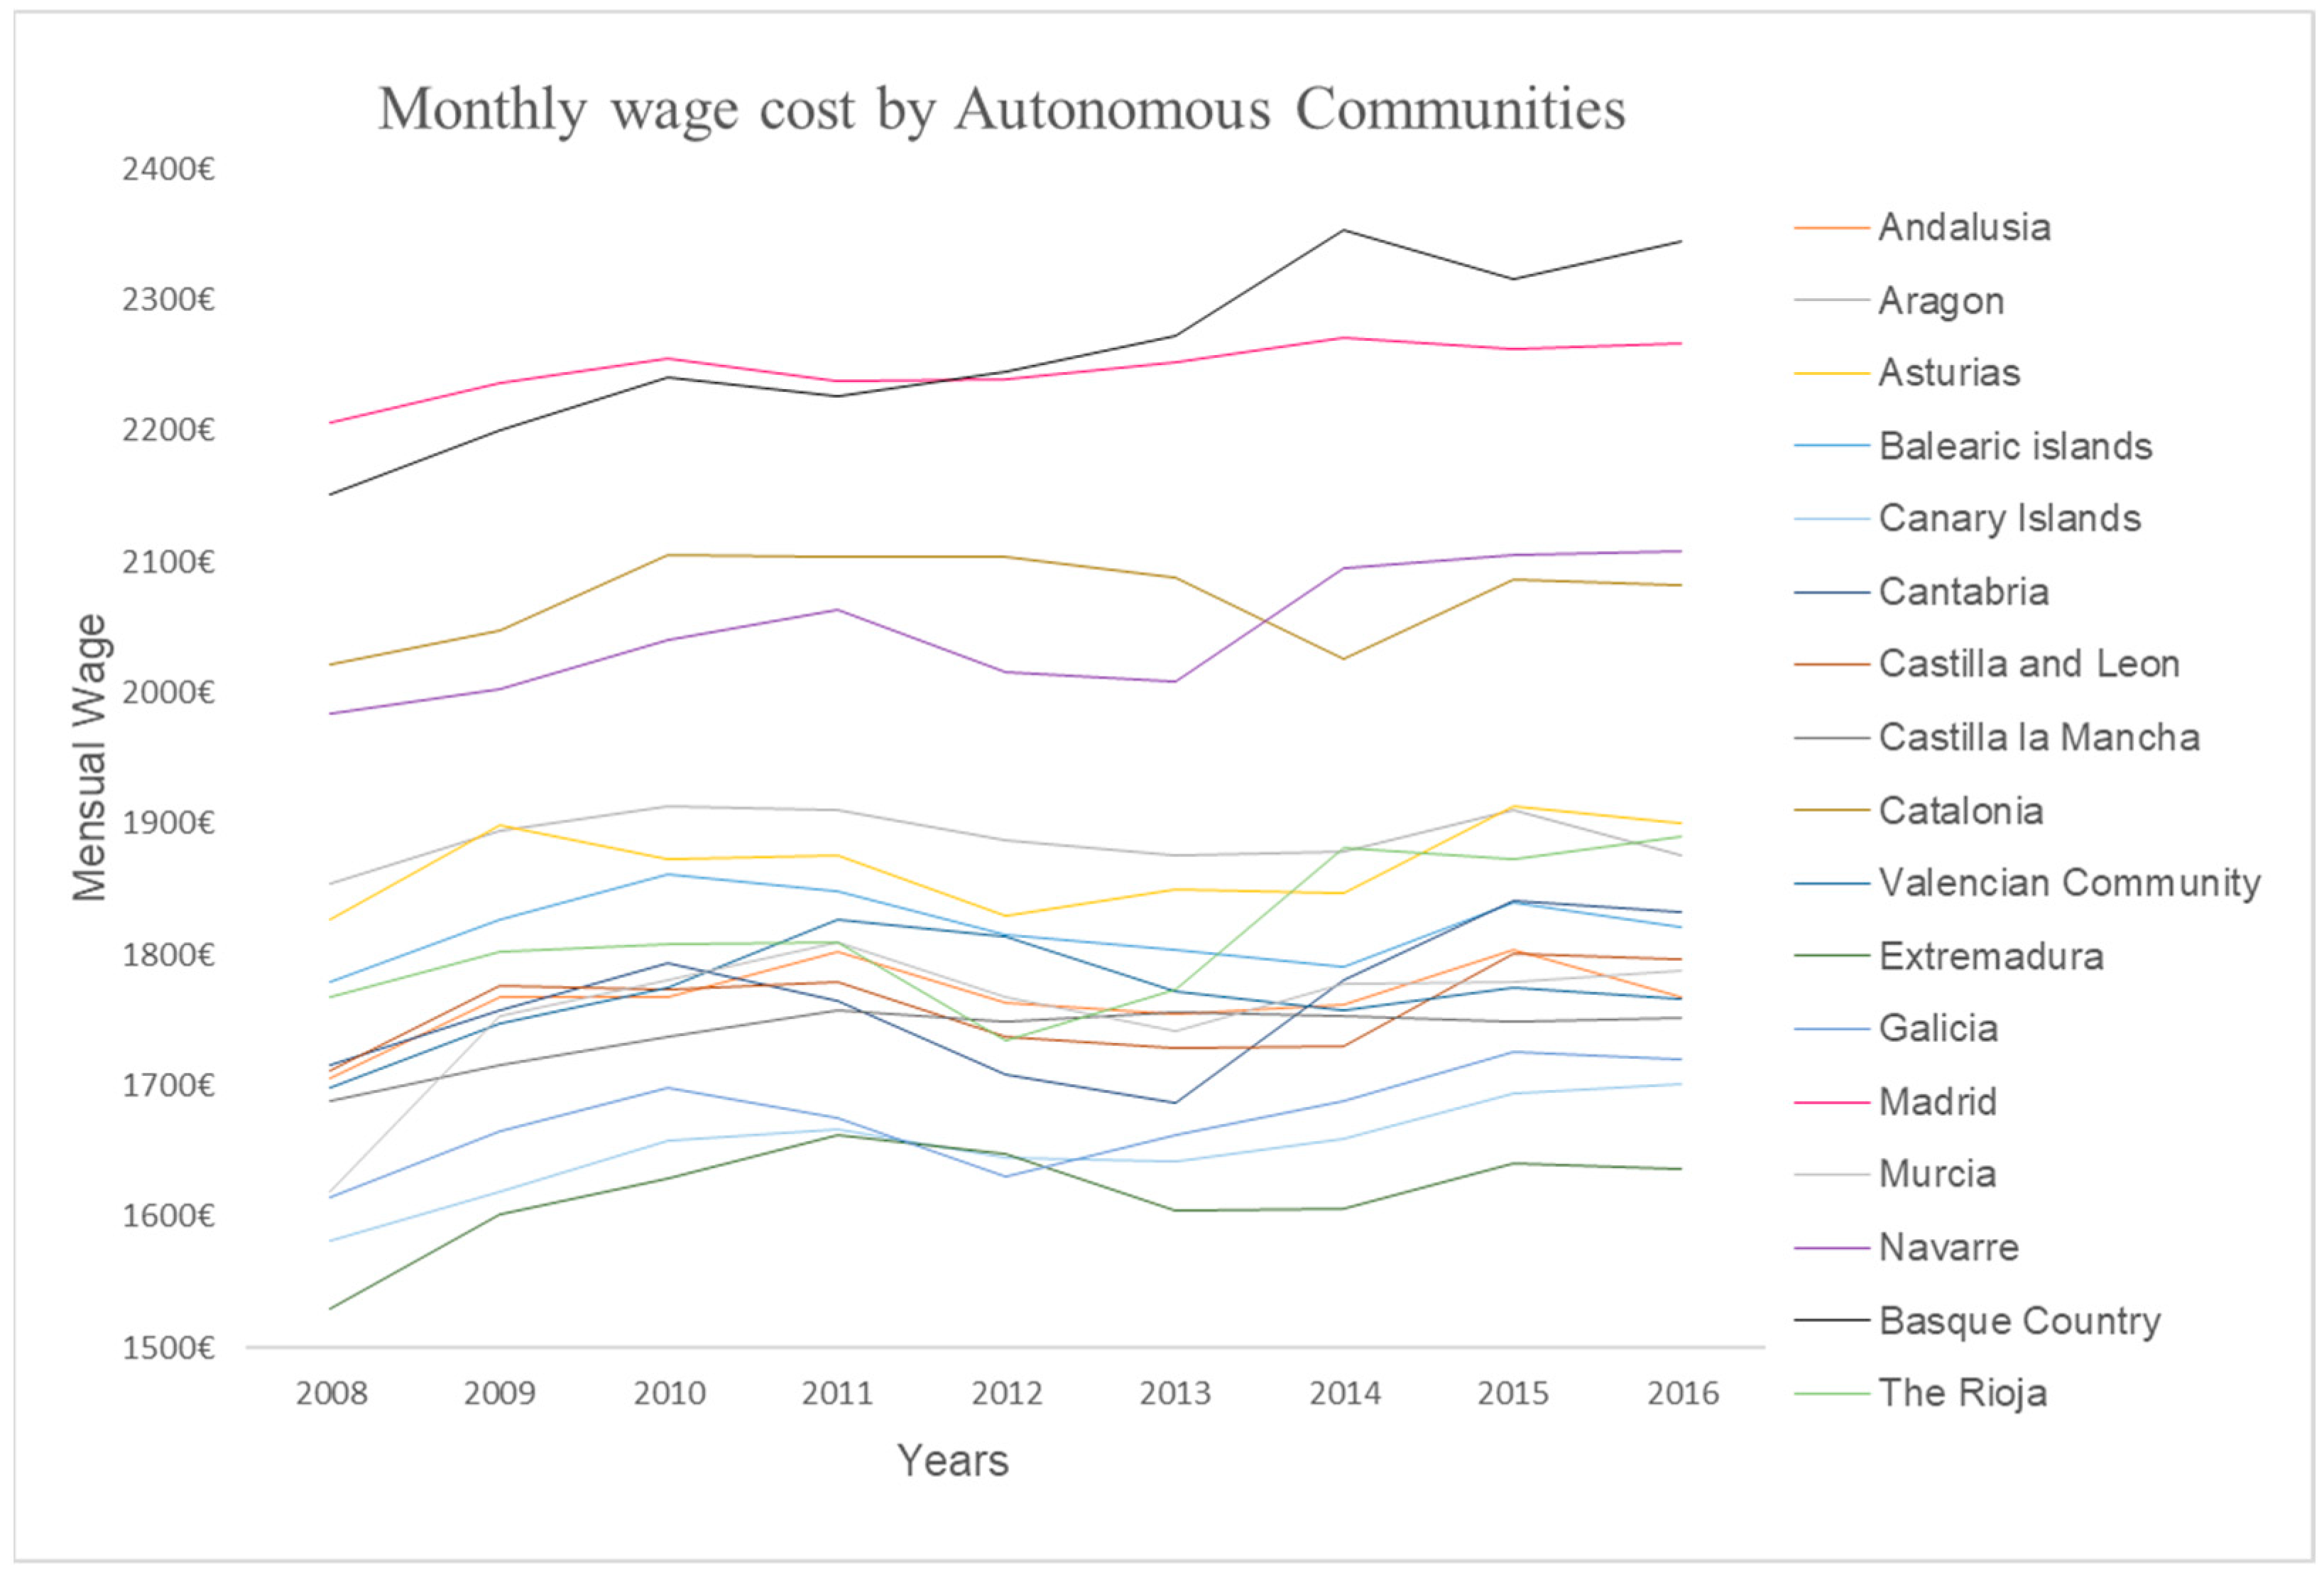
However, considering the average wage of the entire population, we observe that it changes significantly across regions and over time (see Figure 4). Throughout the entire sample period, wages are higher in the Basque Country, Navarre, Madrid and Catalonia. These last two regions coincide with those with the highest index of immigrant diversity (see Figure 2). In addition, regions with low wages are those in which the supply of unskilled labour is higher due to the relevance of agriculture. Accordingly, we find lower wages in Extremadura, Galicia, Castilla and León, Castilla La Mancha and Andalusia, regions with high agricultural and livestock activity.
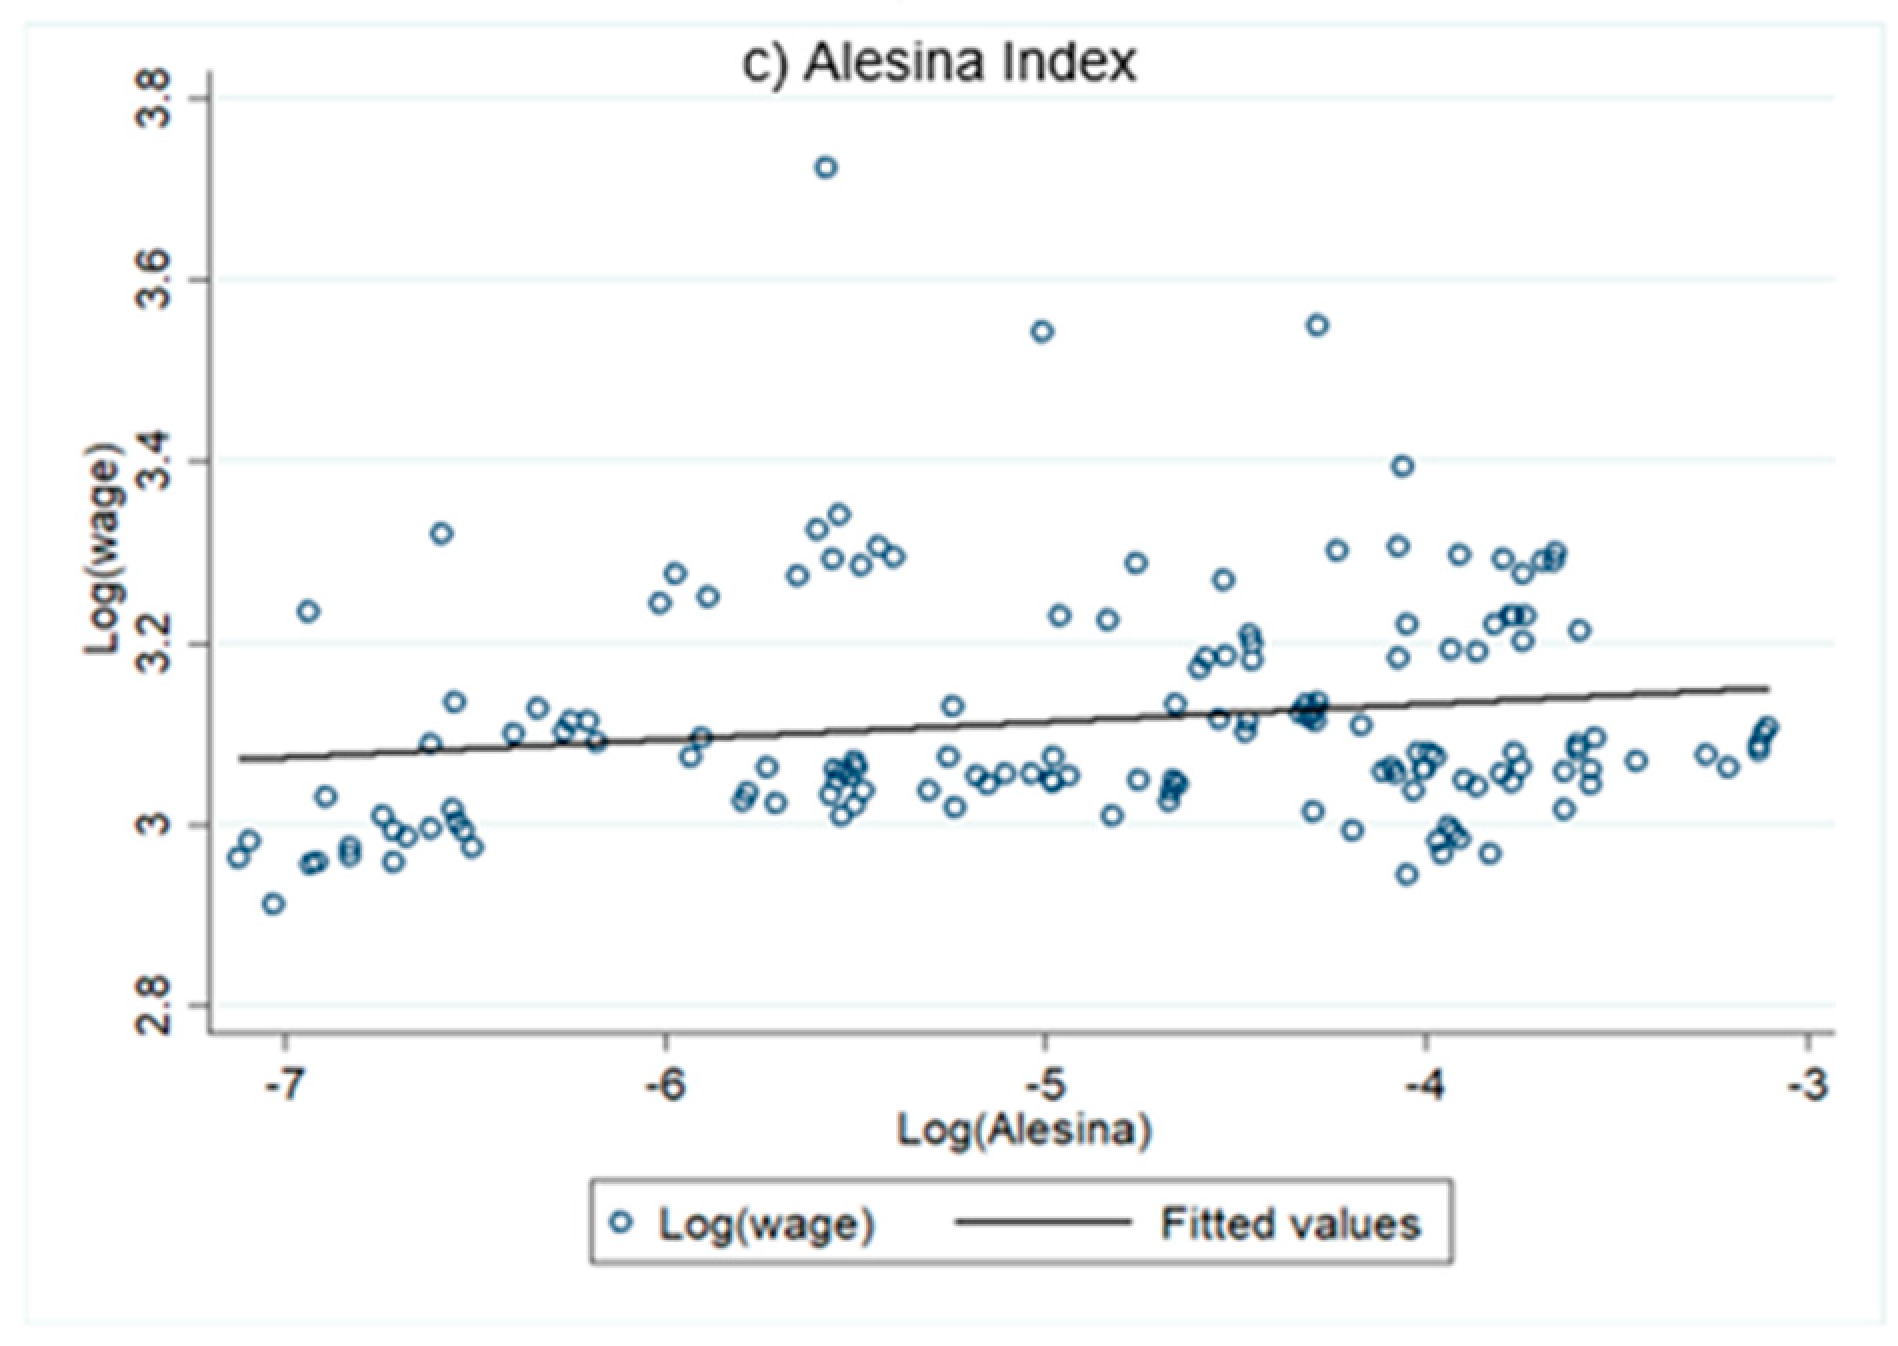
The foregoing stylized facts reveal that there has not only been a change in the migration inflows of Spain—it has gone from being a sending country to a receiving country—but also a qualitative change in terms of the diversity of the new residents. In general, as the descriptive evidence shows, those regions where we find higher wages or per capita income are also those with a greater presence of different nationalities. However, this is not always so, as in the case of Andalusia or the Valencian Community, with high rates of cultural diversity but levels of income per capita below the average. This is probably the reason why, although we find a positive correlation, on average, as shown by the upward slopes shown in Figure 5, where the log of wage is represented with respect to the different diversity indexes, this relationship is not too pronounced. In fact, the correlation coefficients obtained between the diversity indexes and wages do not exceed 0.2 in any case.
5. Data and Econometric Model
5.1. Data and Variables
In order to analyse the effect that the diversity of immigration has on wages in Spain, we used information from the 17 Spanish regions (Autonomous Communities) covering the period from 2008 to 2016. The sample period was selected with the purpose of evaluating the connections between immigrants’ diversity and wages both during the crisis and afterwards.
Generally, the analysis of the existence of spillovers from immigrant diversity is not an easy task, given the restrictions in terms of data availability. In our case, we built a database using data from both INE and the EDUCAbase (from the Ministry of Education, Culture and Sports), which has allowed us to carry out the study at a NUTS 2 level. Table 2 contains a detailed explanation and the source of the variables used.
Following previous literature, we employ national real wages as our dependent variable. This variable can also be interpreted in terms of productivity, as in other works that analyse the economic impact of immigrant diversity [9,10]. Particularly, on the one hand, we employ the average annual gross wages per Autonomous Community. On the other hand, in order to see if the spillover effects of a greater cultural variability extend also to non-national workers, we define the real wages of the total population, that is, considering both immigrants and nationals.
As our main regressor, the diversity of migration has been computed here by three different indexes: Fractionalization Index, Entropy Index and Alesina Index, which have been calculated as explained earlier in Section 3. Consistent with previous literature, several characteristics of the region were considered as additional control variables. In line with Ottaviano and Peri [9], we include total population to capture the scale of the region. Moreover, following Gagliardi [14], the proportion of young population has been included as an additional regressor. According to the United Nations [2], young people are a positive force for productivity when they are provided with the knowledge and opportunities necessary to thrive, because they have skills acquired during their education that allow them to contribute to economic productivity. Furthermore, we introduce the unemployment rate of the natives to capture the employment opportunities offered by each region as in Gagliardi [14]. The weight of this variable is especially relevant for the so-called labour immigrants.
Finally, given the relevance that human capital has on productivity and wages, as initially highlighted in the seminal paper by Lucas [48], in this work, we consider both national human capital and imported human capital. The first is proxied by the share of population that has reached high educational levels (for the coding of the variable “high education” in the Labour Force Survey of the National Institute of Statistics, until 2013, the National Classification of Education 2000 (CNED-2000) was applied, which is compatible with the International Standard Classification of Education 1997 (ISCED-97). As of 2014, the new National Classification of Education 2014 has been applied (CNED-2014), compatible with the International Standard Classification of Education 2011 (ISCED-2011; source: Ministry of Education, Culture and Sports). The information is found in EDUCAbase, a database provided by the Spanish Ministry of Education, Culture and Sports that collects the data from the exploitation of the educational variables of the Labour Force Survey offered by the INE. This survey represents a synthesis of information based on the educational variables of the Labour Force Survey and the Community Labour Force Survey). This variable has also been used by Bove and Elia [27] and Alesina et al. [25]. Similarly, Saks et al. [49] found a robust positive relation between higher education and an increase in productivity and wages. Nonetheless, as mentioned by Nathan [50], this higher human capital may also be due to the entrance of skilled migration. According to this author, the arrival of skilled people has a significant and positive impact on the labour market of the destination countries. In our work, this variable is proxied by the percentage of immigrants that arrived from countries with high or very high levels of HDI as a proxy of skilled immigrants. In Table A1 and Table A2 in the Appendix, we present the main statistics and correlation matrix of these variables. As can be appreciated, we obtain a high positive correlation between higher education and the share of immigrants coming from countries with a high HDI, indicating that those regions with more national skilled workers also attract immigrants from more developed countries.
5.2. Estimation Methodology
For the estimation of the wage variations derived by a higher birthplace diversity, we employed a panel data methodology. This allowed us to account for both time effects and unobserved individual heterogeneity. As previously mentioned, to do so, we used data from the 17 Spanish Autonomous Communities (NUTS 2) during the period between 2008 and 2016.
Following the recent literature, we analyse how birthplace diversity affects wages, after controlling for other regional factors such as total population, young population, share of population with higher education, natives’ unemployment and the share of immigrants arriving in each region from countries with a high or very high level of human development. More specifically, the estimated equation takes the following form:
where c stands for each Autonomous Community and t denotes time, specifically, each year analysed; indicates the average real wage of the national population of each region; represents the different indexes we have used to measure diversity; where indicates each of the three indexes calculated; and indicate the population and young population enumerated in each region; shows us what percentage of the total population has higher education; constitutes the unemployment rate of the natives; and finally allows us to control for what proportion of the foreigners come from countries with a high and very high HDI. All of these variables are expressed in natural logarithms. Thus, the coefficients that accompany the explanatory variables will indicate the elasticity of the dependent variable with respect to the independent variables.
Let represent time-invariant permanent differences across regions, and let be the time effects that affect the regions identically in each period. Finally, is the random error term with a mean of zero, which is assumed to be independent across countries and over time.
The decision as to whether to consider unobserved region-specific effects as fixed or random is made based on the Hausman test. Fixed effects allow for unobservable factors, i.e., omitted variables that can be correlated with the explanatory variables, which vary between the individual entities and do not change over time, whereas random effects indicate that the exact value at the origin that each individual may have is not sure, but it is considered that it will probably gravitate around a central value. Hausman illustrated that the difference between the coefficients of fixed and random effects might be used to prove the null hypothesis that the random error term and the explanatory variables are not correlated (from modern econometrics, it is known that if the individual effects are not correlated with the other regressors in the model, as established under the null hypothesis in the Hausman test, both random and fixed effects are consistent and random effects are efficient. However, when individual effects and the explanatory variables are correlated, the fixed effect model is consistent, but not the random effects model. See Greene [51] for more details.). Moreover, an autocorrelation test proposed by Wooldridge [52] (for a more extensive discussion of this test, see Wooldridge [52]) was used to test autocorrelation problems in the models. The null hypothesis of this test is that there is no autocorrelation; if it is rejected, it can be concluded that it exists.
Given that our estimations may also be affected by an endogeneity problem and reverse causality, we also estimated the model using IV regression techniques. The plausibility of both the potential positive impact of an increase in the migration diversity on productivity and the possibility of regions with a higher productivity attracting immigrants from a greater number of countries has been documented in the literature [9]. As authors such as Kemeny and Cooke [10] have explained, more productive regions can also attract a wider range of immigrants of different nationalities. That is, regions may experience an increase in the average wage due to a positive economic shock, which attracts immigrants disproportionately and, therefore, leads to an increase in diversity. If these two bidirectional causalities occur, the measured impact of diversity on wages and incomes would be biased upwards [9]. A similar explanation is given by Gagliardi [14] for the study of the causal relationship between skilled migration and innovation. However, it is also possible that a positive effect of migration on wages may be reduced by the fact that inflows of immigrants occurred in regions where these potential positive effects are offset by their initial poor economic conditions (as shown in some regions of Spain), leading to a downward bias. In any case, the potential interconnection between migration and wages, whatever the sign, makes it necessary to consider the likelihood of a reverse causality in our analysis. To overcome this problem we employ instrumental variables estimation. This is a method widely used among economists that requires finding an exogenous variable (the instrument) whose exogenous changes affect diversity in a regions but not wages. That is, the IV technique aims to isolate changes in salary that are exclusively due to greater cultural diversity.
6. Main Results
6.1. Fixed Effects Estimation
Table 3 presents the estimates of Equation (4) using the fixed effects (FE) estimation methodology. As can be seen at the bottom of this table, the Hausman test statistic suggests that in all cases the fixed effects model is preferred to the random effects model. In addition, from the Wooldridge test for autocorrelation, we can conclude that the data do not have first-order autocorrelation.
The coefficients in Table 3 are shown sequentially for the three alternative measures of migration diversity (FI, EI and AI, respectively). The most outstanding result of these regressions refers to the significance of the indexes of cultural diversity in the three regressions. This result is consistent with our main hypothesis of the existence of positive spillovers in terms of higher wages from greater heterogeneity of immigrants. Specifically, the estimated coefficients imply that, on average, an increase in the Fractionalization Index of 10% leads to a rise in the wage of nationals of 1.49%, keeping other regional factors constant. A higher impact is seen with the Entropy Index, as an increase by 10% will predict a growth in the wages of nationals of 1.96%, ceteris paribus. However, this effect is significantly smaller when we consider the Alesina Index. In this case, a higher index, around 10%, implies an increase of 0.8% in wages. The smaller value of this last index may be explained by the very nature of the Alesina Index. As shown previously, this index calculates the diversity strictly among those born abroad in a given place, instead of capturing heterogeneity among all individuals.
Coefficients on other control variables show the expected signs. We find that, except for population and unemployment, all of them have a significant effect on productivity. The lack of significance of the population may be due to the inclusion of other variables, such as a young population, that may capture, in some way, the scale of the region. As can be seen in Table 3, the results from all the regressions suggest a positive and significant influence of a greater proportion of young population on real wages. Specifically, an increase of 10% in the rate of young population in each region increases the average wage for nationals above 8%. Similarly, our estimates verify the beneficial impact of skilled labour on wages. In particular, an increase of 10% in the share of the population with higher education will result in a rise in wages by 3%. The presence of migrants arriving from countries with a high or very high HDI also appears to be positively correlated with wages of native-born workers. According to our estimates, with a share of 10 higher, real wages will increase by approximately 4%. In contrast, the unemployment rate for natives seems to have a non-significant influence on wages of nationals. Following the recommendations of an anonymous referee, to avoid an omitted variables problem, we have also estimated the model including GDP per capita, as a determinant of real wage. However, probably due to the high correlation of this variable with unemployment (with a correlation coefficient of −0.7034), the GDP per capita is not significant in our regression. Nonetheless, the sign and the statistical significance of the rest of the control variables remains unchanged. The results are available upon request.
Next, we estimate whether these productivity spillovers, and hence the salary improvements for national workers derived from a greater cultural variety, extend to non-national workers too. To do so, we re-estimated the previous model using the total wage of the population as a dependent variable, considering the earnings from both immigrants and nationals. Accordingly, the estimated equation now takes the following form:
where represents the real wage of the total population and the subscripts and the rest of the variables have the same definition as previously in Equation (4). According to the results of the Hausman test, the coefficients have been estimated once again through the FE methodology. The estimates are presented in Table 4.
In general, the estimates obtained in these regressions confirm our previous outcomes, although now only two of the three diversity indexes (EI and AI) are significant. The lack of significance of the FI might be justified by the fact that, as pointed out in the literature, the Fractionalization Index might be overrated due to the presence of a large proportion of immigrants in a region, even when these immigrants do not come from a wide range of countries of origin. Thus, we can conclude that the salary benefits from a greater diversity of immigrants in terms of their birthplace are not limited to the national population, but also affect non-native workers.
Note, however, that although the sign of the coefficient on indexes is similar to those previously estimated, the estimated values are now slightly lower and somewhat less significant, revealing a lesser forcefulness of this effect in the case of non-national workers. Increases in the Fractionalization Index and in the Entropy Index of 10% are associated with an increase in the average wage of the total population of 1.34% and 1.82% respectively, whereas the same increase in the Alesina Index will imply a rise in wages of 0.73%.
The estimates for the other control variables confirm the beneficial influence that a greater young and skilled population has on real wages; as well as the positive productivity spillovers of an increase in immigration from countries with a high or very high HDI. Regarding the unemployment rate of natives, we found an expected significant influence. The estimated coefficients indicate a decrease of approximately 0.8% in total wages due to a rise of 10% in the unemployment rate. Finally, as can be seen at the bottom of the table, in all cases, the Wooldridge test for autocorrelation shows us that data do not have first-order autocorrelation.
6.2. Endogeneity and Instrumental Variable (IV) Approach
As mentioned above, the FE estimation takes into account unobserved heterogeneity among regions; however, it does not consider a potential simultaneity problem or reverse causality. Nonetheless, as pointed out by Cadena and Kovak [53] and Lewis and Peri [11], among others, the location of immigrants is not a random selection. In contrast, this may depend on the local economic outcomes. Consequently, whenever the amount of diversity of immigrants in a region and its economic performance are interrelated, we need to be cautious in our estimations in order to avoid biased estimates. To solve this, we employ two-stage regression techniques by using an instrumental variable (IV) whose exogenous variation affects migration diversity in a region, but not total worker productivity. Doing this, we try to capture the source of correlation between cultural diversity and wages that is due exclusively to the influence of diversity on wages [9]. Although the endogeneity of immigrant diversity is clear from a theoretical point of view, we check this fact empirically through the Wu–Hausman endogeneity test (to compute this test, we add the residuals from the reduced form of the endogenous variables as an additional regressor in the structural equations). The results of this test are shown in Table A3 from the Appendix (under the null hypothesis of no endogeneity, ordinary least squared (OLS) estimation is consistent and efficient, while two-stage regression is also consistent, but inefficient. However, if endogeneity exists, an IV estimation methodology is required to guarantee consistent estimations.) As can be seen, the outcomes obtained confirm that the diversity indexes are endogenous in the three regressions. Accordingly, to deal with the problem of endogeneity, we next estimate our model using two-stage fixed effects (2SFE) methodology with an instrumental variable.
Traditionally, two kinds of instruments have been used to address the concern of endogeneity of migration. The first based on accessibility measures as ports or land borders (see, Ottaviano and Peri [9], among others). This, however, does not seem appropriate for the Spanish case currently given the great advances and cost lowering of national transport, which allows people to move easily across the country. The second type of instruments is built according to the procedure often referred to as “shift-share methodology” (Card [54]). The intuition behind this instrument relies on the fact that the initial share of immigrants by country of origin can be considered a good predictor of subsequent migration inflows, as migrants tend to be attracted to regions where other immigrants from the same country locate (Gagliardi, [14]). As shown by Alamá et al. [6], network or agglomeration effects play an important role in the attraction of immigrants in Spain. Accordingly, we can “predict” the immigrant composition of an Autonomous Community based on the current total immigration rate and the shares of immigrants from each region at the beginning of the period. In this line, the instrument used in our regressions is a type of diversity index constructed as the “predicted” change in the number of immigrants from each country in each region during the period 2008–2016. This instrument was initially proposed by Ottaviano and Peri (2006) [9], which later became a standard instrument in literature, as in the case of Gagliardi [14]. As mentioned by Ottaviano and Peri [6], by definition, this index does not depend on any regional economic shock in the current period.
First, the growth rate of immigration is calculated for each group of immigrants according to their birthplace (this has been calculated year by year since 2009; it does not have information for 2007). Thus, using the same notation as in Section 3, we have:
where is the growth rate of immigrants born in country r, represents the previous period t, and represents the current period.
Second, from the above equation, we calculate the “attributed” share of people born in country r and residing in an Autonomous Community c in year t:
As a final stage, we obtain a diversity index, div, through the attributed share of foreign-born individuals:
As Ottaviano and Peri (2006) [9] explained, the variable div is independent of any specific shock in a region during the period, since the attributed diversity for each Autonomous Community in year t is built using the participation of the Autonomous Community in year t − 1 and the national growth rates of of each group of immigrants (consequently, 17 observations corresponding to the year 2008 have been lost). Thus, this variable would meet the exogeneity requirements needed for a good instrument. However, an additional criterion is necessary for an instrument: to be relevant. To confirm the relevance of this instrument, Table 5 presents the estimates of the first stage regression and the results of tests of both underidentification and weak identification. To test whether the equation is identified, i.e., that the excluded instruments are relevant, we display the Kleibergen–Paap [55] rk statistic. The Stock–Wright [56] S statistic is employed to test weak identification. As can be seen at the bottom of the table, the results obtained confirm that the instrumental variable, div, is relevant and does not suffer from weak identification problems given that both tests are rejected at the 5% level in all cases. The explanatory power of the instrument in the diversity regressions is also confirmed through the F tests of excluded instruments. In conclusion, we can say that the connection between predicted diversity and the different diversity indexes are significant. Accordingly, our instrument should plausibly increase (decrease) when the cultural diversity goes up (down) or vice versa. Therefore, to the extent that the predicted diversity does not depend on regional wages in the current period (by definition), div can be considered a reasonably acceptable instrument for cultural diversity in the estimation of wages.
Subsequently, Table 6 illustrates the estimations of the second stage. As in the fixed effects regressions, the three diversity indexes (FI, EI and AI) are now positive and statistically significant in the explanation of the average wage, suggesting that an increase in the diversity of immigrants is associated with higher real wages. In particular, similarly to the FE estimates, we find that when the Fractionalization Index rises by 10%, wages of nationals go up 8.36%. In the regression of the Entropy Index, outcomes are similar with a coefficient of 7.86%. The effect that an increase in the Alesina Index has on wages is lower than those obtained with the previous indexes, but higher than that achieved through the regression with fixed effects. Additionally, the results of the 2SFE regressions confirm the expected benefits derived by a higher rate of young and educated population as well as the benefits for national workers of a higher proportion of skilled immigrants.
Next, for the purpose of comparison, and to obtain a broader view of the impact of a greater cultural diversity on the labour market, we perform a similar analysis considering the wages of total workers (including non-native ones) as a dependent variable. Similarly, the problem of a non-random selection in the location of immigrants is analysed through the Wu–Hausman endogeneity test. The results in Table A4 from the Appendix confirm the endogenous nature of the three diversity indexes in the explanation of the total wages. Accordingly, we estimate the model by 2SFE using the predicted change in the number of immigrants coming from each country as the instrumental variable. The validity of this instrument has been previously confirmed by the Kleibergen–Paap [55] rk, the Stock–Wright [56] S and the F statistic tests of underidentification, weak identification and excluded instruments (see Table 5). The estimates in Table 7 support our suspicions that the beneficial effect of greater diversity in the workers’ compensations also affects non-native workers. As before, the three diversity indexes are positive and statistically significant (although these coefficients are not directly comparable due to differences in the number of observations in both regressions.). Furthermore, the roles of the other control variables in the explanation of total wages are similar to those obtained previously.
To sum up, our estimates consistently confirm that immigrant diversity is positively associated with wages (for natives and non-natives) in Spain. These outcomes are robust to the unobserved regional heterogeneity. In addition, in this work, the risk of a potential reverse causality bias between the economic conditions of a region and its cultural diversity is taken into consideration through instrumental techniques which provide us reasonably robust results in this matter. Finally, we prove the important role of an increase in a young and skilled workforce, whether native or foreign, to encourage productivity and regional development.
6.3. A Robustness Analysis: The Extended Model
In this section, we present an alternative model that includes the following as potential factors of real wages: proportion of total immigrants and its interactions with cultural diversity (instead of considering only the immigrants from countries with a high or very high HDI). The estimates of the covariates of these extended regressions for national and total wages are shown in Table 8 and Table 9, respectively.
The results obtained confirm that cultural diversity is positively and significantly related with wages (for natives and for the total population). Moreover, the estimates on the other explanatory variables are in line with our previous findings. We obtain similar outcomes when we drop share of HDI from the regressions, as suggested by an anonymous referee (See Table A5 and Table A6 from the Appendix) (according to this anonymous referee, given that the share of immigration from countries with a high or very high HDI potentially relies on some of the characteristics on which cultural diversity depends, its inclusion might bias the regression coefficients). However, now, in this extended model, the coefficient on the share of total immigrants suggests that a higher proportion of total immigrants in a region negatively influences wages. Nevertheless, this negative connection between the share of immigrants and wages is partially mitigated by the higher cultural diversity linked with the greater representation of non-natives. The positive coefficient on the interaction terms implies that in regions where immigration is relatively overrepresented, the associated greater cultural variety compensates for the harmful effect of total migration.
7. Conclusions
Despite its late incorporation into the massive waves of worldwide immigration, Spain has become one of the biggest recipients of immigrants in Europe. The importance that this phenomenon has had in recent times, particularly in the developed world, has fuelled the debate about immigrants’ economic effects. Traditionally, the literature in this regard has paid special attention to the potential substitution effect from more expensive native workers to a cheaper workface made up of immigrants. However, more recently, and probably motivated by the greater availability of data and a broader view of the phenomenon, a new perspective focusing on the diversity of immigrants has been incorporated into this debate. According to this literature, birthplace diversity may increase productivity and hence real wages by enabling the combination of different skills, ideas and perspectives.
The aim of this work is to provide a robust estimation of the impact of immigrant diversity on real wages in Spain at a regional level. Specifically, we try to analyse how birthplace diversity has affected workers’ compensation in this economy during the period from 2008 to 2016. The relevance of immigration, in terms of quantity, as well as the particular pattern of migration during this period, with an increasing number of immigrants coming from developed countries, makes the analysis of the connection between cultural diversity and wages in this economy of special interest.
To study this question, we based our analysis on three different diversity indexes: the first, the Fractionalization Index, reflects the likelihood that two randomly selected immigrants from a region were born in two different countries. The second, the Entropy Index, provides a more accurate measure of diversity when the constituent groups are of different sizes. Finally, the third, the Alesina Index, measures diversity strictly among those born abroad in a given place, instead of capturing heterogeneity among all individuals, natives and immigrants. In contrast to most of the previous literature and following the recommendations of Kemeny and Cooke [10], we take into account the potential simultaneity between migration heterogeneity and economic performance by estimating the model through instrumental variable techniques. We instrumentalize the cultural diversity using information on the “predicted” change in the number of immigrants from each country in each Autonomous Community, as proposed by Ottaviano and Peri [9]. Finally, we estimate an extended model showing the important role of total immigrants and its linkages with cultural diversity in the determination of wages.
As in previous empirical works for other countries and regions [9,10,11,27,29], our findings suggest a positive and significant correlation between immigrant diversity and real wages in the Spanish regions. Moreover, in our case, this result remains when the wages of the total population (without distinguishing between natives and immigrants) are considered. These outcomes are robust to both the unobserved regional heterogeneity and the presence of a two-way connection between wages and immigrant diversity. Moreover, our findings remain valid for alternative model specifications. Therefore, we can conclude that despite the sui generis nature of recent immigration in Spain, with a high participation of so-called permanent tourists, the cultural variability is also manifested here as something beneficial for native and non-native workers. We further prove that skilled labour and a greater proportion of immigrants coming from countries with a high or very high human development index are positively related with greater real wages. Thus, for a definitive evaluation of the total impact that heterogeneous immigration may have on recipient economies, policy makers should take into account the effect that these international movements have on cultural diversity as well as the implications on the level of skilled labour that emerge from the inflows of new workers.
8. Limitations and Future Research
Despite the consistency of the results, this research is not free from certain limitations. These limitations lead us to be cautious in the interpretation of our findings, and provide us with a stimulus to strive for stronger overall evidence about the impact that the inflows of heterogeneous immigrants have on productivity and wages.
Concerning the diversity indexes used in this paper, a few considerations must be discussed, as Alesina et al. [25] suggested. First, there is a limitation because illegal immigration is not captured in the statistical data measured. Second, diversity has been defined according to the place of birth of the immigrants and, therefore, according to this definition, a small child who immigrates with his or her parents will be considered an immigrant despite receiving the education and culture of the host country. A third limitation refers to the fact that our diversity indexes do not allow us to account for immigrant heterogeneity in terms of race, ethnicity or religion, among others. Because official data do not collect data by race, ethnicity or religion, we do not have the possibility of obtaining more specific conclusions concerning the linkages between cultural diversity and the diverse groups of immigrants.
A lack of information has also prevented us from a deeper analysis related to the potential positive spillovers resulting from greater knowledge. In a novel way, in this paper, we have proxied foreign skilled labour through the percentage of immigrants coming from countries with a high or very high HDI. However, given the important role of human capital in the determination of wages and the fact that more highly skilled labour may also come from the entry of more trained foreign workers, when data availability allows, more specific research should address this question.
Author Contributions
Conceptualization, M.D.G.-F. and M.A.; Methodology, M.D.G.-F. and M.A.; Formal Analysis, M.D.G.-F.; Writing-Original Draft Preparation, M.D.G.-F.; Supervision, M.A.; Funding Acquisition, M.A.
Funding
This research received funding from University Jaume I, Grant number UJI-B2016-53.
Conflicts of Interest
The authors declare no conflicts of interest.
Appendix A

Table A1.
Main statistics.
| Variable | Obs | Mean | Std. Dev. | Min | Max |
|---|---|---|---|---|---|
| Wage | 153 | 3115 | 0.125 | 2910 | 3723 |
| Fractionalization | 153 | −1749 | 0.517 | −2799 | −0.949 |
| Entropy | 153 | −0.534 | 0.462 | −1521 | 0.216 |
| Alesina | 153 | −4870 | 1090 | −7120 | −3103 |
| Population | 153 | 0.626 | 0.899 | −1153 | 2134 |
| Young population | 153 | −3071 | 0.125 | −3359 | −2787 |
| High education | 153 | 2806 | 0.406 | 1684 | 3576 |
| Native unemployment | 153 | −1466 | 0.200 | −1891 | −0.721 |
| Share HDI | 153 | −0.344 | 0.129 | −0.709 | −0.148 |
| Predicted diversity | 136 | −7967 | 0.546 | −9312 | −6810 |
Source: authors’ own elaboration based on INE data.
Table A2.
Correlation matrix.
| Wage | Population | Young Population | High Education | Natives Unemploy | ShareHDI | |
|---|---|---|---|---|---|---|
| Wage | 1.000 | |||||
| Population | 0.147 | 1.000 | ||||
| Young population | −0.357 | 0.1785 | 1.000 | |||
| High education | 0.666 | −0.075 | −0.307 | 1.000 | ||
| Native unemploy | −0.384 | 0.283 | 0.297 | −0.216 | 1.000 | |
| Share HDI | −0.416 | 0.04 | −0.100 | 0.619 | 0.124 | 1.000 |
Source: authors’ own elaboration based on INE data.
Table A3.
Estimation results of the Wu–Hausman endogeneity test from the reduced form regression of wages.
Table A3.
Estimation results of the Wu–Hausman endogeneity test from the reduced form regression of wages.
| (1) | (2) | (3) | |
|---|---|---|---|
| Fractionalization | Entropy | Alesina | |
| Residuals1 | −0.217 ** | ||
| (0.0908) | |||
| Residuals2 | −0.202 ** | ||
| (0.0847) | |||
| Residuals3 | −0.0942 ** | ||
| (0.0398) | |||
| Fractionalization | 0.126 | ||
| (0.0830) | |||
| Entropy | 0.106 | ||
| (0.0760) | |||
| Alesina | 0.0533 | ||
| (0.0361) | |||
| Population | 0.0337 * | 0.0345 * | 0.0343 * |
| (0.0195) | (0.0199) | (0.0196) | |
| Young population | −0.200 | −0.0457 | −0.127 |
| (0.267) | (0.207) | (0.240) | |
| High education | −0.0504 | 0.0298 | −0.0104 |
| (0.183) | (0.150) | (0.168) | |
| Native unemployment | −0.155 *** | −0.175 *** | −0.164 *** |
| (0.0512) | (0.0471) | (0.0492) | |
| Share HDI | −0.0707 | −0.0685 | −0.0698 |
| (0.101) | (0.102) | (0.102) | |
| Constant | 2.988 *** | 3.466 *** | 3.329 *** |
| −1.028 | (0.868) | (0.892) | |
| Observations | 136 | 136 | 136 |
| Number of regions | 17 | 17 | 17 |
Note: standard errors in parentheses. *** p < 0.01, ** p < 0.05, * p < 0.1.
Table A4.
Estimation results of the Wu–Hausman endogeneity test from the reduced form regression of total wages.
Table A4.
Estimation results of the Wu–Hausman endogeneity test from the reduced form regression of total wages.
| (1) | (2) | (3) | |
|---|---|---|---|
| Fractionalization | Entropy | Alesina | |
| Residuals1 | −0.230 ** | ||
| (0.0910) | |||
| Residuals2 | −0.216 ** | ||
| (0.0850) | |||
| Residuals3 | −0.100 ** | ||
| (0.0399) | |||
| Fractionalization | 0.122 | ||
| (0.0832) | |||
| Entropy | 0.100 | ||
| (0.0764) | |||
| Alesina | 0.0511 | ||
| (0.0363) | |||
| Population | 0.0338 * | 0.0347 * | 0.0344 * |
| (0.0196) | (0.0202) | (0.0198) | |
| Young population | −0.195 | −0.0351 | −0.121 |
| (0.267) | (0.208) | (0.241) | |
| High education | −0.0923 | −0.00999 | −0.0520 |
| (0.183) | (0.150) | (0.168) | |
| Native unemployment | −0.168 *** | −0.189 *** | −0.177 *** |
| (0.0513) | (0.0473) | (0.0493) | |
| Share HDI | −0.0442 | −0.0398 | −0.0428 |
| (0.102) | (0.103) | (0.102) | |
| Constant | 2.953 *** | 3.459 *** | 3.295 *** |
| (1.031) | (0.872) | (0.894) | |
| Observations | 136 | 136 | 136 |
| Number of regions | 17 | 17 | 17 |
Note: standard errors in parentheses. *** p < 0.01, ** p < 0.05, * p < 0.1.
Table A5.
Estimation results of wage using IV through 2SFE. Reduced model.
| (1) | (2) | (3) | |
|---|---|---|---|
| Fractionalization | Entropy | Alesina | |
| Fractionalization | 0.487 * | ||
| (0.292) | |||
| Entropy | 0.566 | ||
| (0.346) | |||
| Alesina | 0.251 | ||
| (0.156) | |||
| Population | −0.0300 | −0.675 | −0.674 |
| (0.0797) | (0.619) | (0.628) | |
| Young population | 0.653 *** | 0.822 *** | 0.839 *** |
| (0.134) | (0.162) | (0.169) | |
| High education | 0.275 *** | 0.273 *** | 0.266 *** |
| (0.0558) | (0.0525) | (0.0555) | |
| Native unemployment | −0.0984 | −0.0879 | −0.0980 |
| (0.0616) | (0.0628) | (0.0644) | |
| Constant | 6.598 *** | 6.932 *** | 7.915 *** |
| (0.656) | (0.883) | (1.385) | |
| Observations | 136 | 136 | 136 |
| Number of regions | 17 | 17 | 17 |
| Regional FE | YES | YES | YES |
| Year FE | YES | YES | YES |
Note: standard errors in parentheses. *** p < 0.01, ** p < 0.05, * p < 0.1.
Table A6.
Estimation results of total wage using IV through 2SFE. Reduced model.
| (1) | (2) | (3) | |
|---|---|---|---|
| Fractionalization | Entropy | Alesina | |
| Fractionalization | 0.513 * | ||
| (0.305) | |||
| Entropy | 0.592 * | ||
| (0.353) | |||
| Alesina | 0.263 * | ||
| (0.159) | |||
| Population | −0.0337 | −0.655 | −0.654 |
| (0.0857) | (0.631) | (0.642) | |
| Young population | 0.704 *** | 0.864 *** | 0.882 *** |
| (0.137) | (0.165) | (0.173) | |
| High education | 0.254 *** | 0.254 *** | 0.246 *** |
| (0.0569) | (0.0535) | (0.0568) | |
| Native unemployment | −0.114 * | −0.106 * | −0.116 * |
| (0.0630) | (0.0640) | (0.0659) | |
| (0.0728) | (0.0730) | (0.0840) | |
| Constant | 6.787 *** | 7.056 *** | 8.086 *** |
| (0.688) | (0.899) | (1.416) | |
| Observations | 136 | 136 | 136 |
| Number of regions | 17 | 17 | 17 |
| Regional FE | YES | YES | YES |
| Year FE | YES | YES | YES |
Note: standard errors in parentheses. *** p < 0.01, ** p < 0.05, * p < 0.1.
References
- Arango, J.; Bonifazi, C.; Finotelli, C.; Peixoto, J.; Sabino, C.; Strozza, S.; Triandafyllidou, A. The Making of an Immigration Model: Inflows, Impacts and Policies in Southern Europe; The Hellenic Foundation for European Foreign Policy (ELIAMEP): Athens, Greece, 2009; p. 9. [Google Scholar]
- Department of Economic and Social Affairs, U.N. Youth Population Trends and Sustainable Development 2015. Available online: http://www.un.org/esa/socdev/documents/youth/fact-sheets/YouthPOP.pdf (accessed on 9 April 2018).
- Martí Romero, J. The Remarkable Case of Spanish Immigration. Available online: http://bruegel.org/2015/12/the-remarkable-case-of-spanish-immigration/ (accessed on 11 September 2018).
- Alamá, L.; Alguacil, M.; Bernat, S. Location determinants of migrant inflows: The Spanish case. In Identity and Territorial Character. Re-Interpreting Local-Spatial Development; Dasí, J.F., Ed.; Universitat de València: Valencia, Spain, 2014; pp. 81–97. [Google Scholar]
- Parella, S.; Petroff, A. Migración de Retorno a España: Salidas de Inmigrantes y Programas de Retorno en un Contexto de Crisis. Available online: https://www.raco.cat/index.php/AnuarioCIDOBInmigracion/article/viewFile/288374/376476 (accessed on 12 September 2018).
- Alamá-Sabater, L.; Alguacil, M.; Bernat-Martí, J.S. New patterns in the locational choice of immigrants in Spain. Eur. Plan. Stud. 2017, 25, 1834–1855. [Google Scholar] [CrossRef]
- Otero Ochaita, J. La diversidad histórica de España: Su imagen en la Enseñanza Secundaria. In Estado y Nación en la España Contemporánea. Ministerio de Educación, Cultura y Deporte; Secretaría General Técnica; Centro de Publicaciones: Madrid, Spain, 2010. [Google Scholar]
- Alesina, A.; Alesina, A.; Devleeschauwer, A.; Easterly, W.; Kurlat, S.; Wacziarg, R. Fractionalization. J. Econ. Growth 2003, 8, 155–194. [Google Scholar] [CrossRef] [Green Version]
- Ottaviano, G.I.P.; Peri, G. The economic value of cultural diversity: Evidence from US cities. J. Econ. Geogr. 2006, 6, 9–44. [Google Scholar] [CrossRef]
- Kemeny, T.; Cooke, A. Spillovers from immigrant diversity in cities. J. Econ. Geogr. 2018, 18, 213–245. [Google Scholar] [CrossRef]
- Lewis, E.; Peri, G. NBER Working Paper Series Immigration and the Economy of Cities and Regions. 2014. Available online: http://www.nber.org/papers/w20428 (accessed on 2 May 2018).
- Hong, L.; Page, S.E. Groups of diverse problem solvers can outperform groups of high-ability problem solvers. Proc. Natl. Acad. Sci. USA 2004, 101, 16385–16389. [Google Scholar] [CrossRef] [PubMed] [Green Version]
- Lee, N. Cultural Diversity, Cities and Innovation: Firm Effects or City Effects? Spatial Economics Research Centre (SERC): London, UK, 2013. [Google Scholar]
- Gagliardi, L. Does skilled migration foster innovative performance? Evidence from British local areas. Pap. Reg. Sci. 2015, 94, 773–794. [Google Scholar] [CrossRef]
- Borjas, G.J. The Labor Demand Curve is Downward Sloping: Reexamining the Impact of Immigration on the Labor Market. Q. J. Econ. 2003, 118, 1335–1374. [Google Scholar] [CrossRef] [Green Version]
- Smith, J.P.; Edmonston, B. The Immigration Debate; National Academies Press: Washington, DC, USA, 1998. [Google Scholar]
- Friedberg, R.M.; Hunt, J. The Impact of Immigrants on Host Country Wages, Employment and Growth. J. Econ. Perspect. 1995, 9, 23–44. [Google Scholar] [CrossRef] [Green Version]
- Boubtane, E.; D’albis, H.; Coulibaly, D. Immigration Policy and Macroeconomic Performance in France 2015. Available online: http://cerdi.org/production/show/id/1662/type_production_id/1 (accessed on 17 March 2018).
- Ortega, F.; Peri, G. The Causes and Effects of International Labor Mobility: Evidence from OECD Countries 1980–2005. Available online: http://mpra.ub.uni-muenchen.de/19183/ (accessed on 17 March 2018).
- Boubtane, E.; Coulibaly, D.; Rault, C. Immigration, Growth, and Unemployment: Panel VAR Evidence from OECD Countries. LABOUR 2013, 27, 399–420. [Google Scholar] [CrossRef] [Green Version]
- Morley, B. Causality between economic growth and immigration: An ARDL bounds testing approach. Econ. Lett. 2005, 90, 72–76. [Google Scholar] [CrossRef]
- Zorlu, A.; Hartog, J. The effect of immigration on wages in three european countries. J. Popul. Econ. 2005, 18, 113–151. [Google Scholar] [CrossRef] [Green Version]
- Longhi, S.; Nijkamp, P.; Poot, J. Joint impacts of immigration on wages and employment: Review and meta-analysis. J. Geogr. Syst. 2010, 12, 355–387. [Google Scholar] [CrossRef] [Green Version]
- Ottaviano, G.I.P.; Peri, G. Rethinking the effect of immigration on wages. J. Eur. Econ. Assoc. 2012, 10, 152–197. [Google Scholar] [CrossRef]
- Alesina, A.; Harnoss, J.; Rapoport, H.W. Immigration, Diversity and Economic Prosperity June 2013. Available online: http://www.migrationpolicycentre.eu/immigration-diversity-and-economic-prosperity/ (accessed on 17 March 2018).
- Taagepera, R.; Lee Ray, J. A Generalized Index of Concentration. Sociol. Methods Res. 1977, 5, 367–384. [Google Scholar] [CrossRef] [Green Version]
- Bove, V.; Elia, L. Migration, Diversity, and Economic Growth. World Dev. 2017, 89, 227–239. [Google Scholar] [CrossRef]
- Wadhwa, V.; Saxenian, A.; Rissing, B.; Gereffi, G. Skilled Immigration and Economic Growth. Appl. Res. Econ. Dev. 2008, 5, 6–14. [Google Scholar]
- Longhi, S. Impact of cultural diversity on wages, evidence from panel data. Reg. Sci. Urban Econ. 2013, 43, 797–807. [Google Scholar] [CrossRef]
- Borjas, G.J.; Doran, K.B. The Collapse of the Soviet Union and the Productivity of American Mathematicians. Q. J. Econ. 2012, 127, 1143–1203. [Google Scholar] [CrossRef] [Green Version]
- Akay, A.; Constant, A.; Giulietti, C.; Guzi, M. Ethnic diversity and well-being. J. Popul. Econ. 2017, 30, 265–306. [Google Scholar] [CrossRef]
- Kemeny, T.; Storper, M. Specialization and Regional Economic Development 2012. Available online: http://eprints.lse.ac.uk/58538/1/__lse.ac.uk_storage_LIBRARY_Secondary_libfile_shared_repository_Content_SERC discussion papers_2012_sercdp0121.pdf (accessed on 23 April 2018).
- Moretti, E. Real Wage Inequality. Am. Econ. J. Appl. Econ. 2013, 5, 65–103. [Google Scholar] [CrossRef] [Green Version]
- Bakens, J.; Mulder, P.; Nijkamp, P. Economic impacts of cultural diversity in the netherlands: Productivity, utility, and sorting. J. Reg. Sci. 2013, 53, 8–36. [Google Scholar] [CrossRef]
- Trax, M.; Brunow, S.; Suedekum, J. Cultural diversity and plant-level productivity. Reg. Sci. Urban Econ. 2015, 53, 85–96. [Google Scholar] [CrossRef] [Green Version]
- Parrotta, P.; Pozzoli, D.; Pytlikova, M. Does Labor Diversity Affect Firm Productivity? Available online: https://papers.ssrn.com/sol3/papers.cfm?abstract_id=2173663 (accessed on 11 September 2018).
- Wang, Y.; Wang, Y. Decomposing the entropy index of racial diversity: In search of two types of variance. Ann. Reg. Sci. 2012, 48, 897–915. [Google Scholar] [CrossRef]
- Sturgis, P.; Brunton-Smith, I.; Kuha, J.; Jackson, J. Ethnic diversity, segregation and the social cohesion of neighbourhoods in London. Ethn. Racial Stud. 2014, 37, 1286–1309. [Google Scholar] [CrossRef] [Green Version]
- Wright, R.; Ellis, M.; Holloway, S.R.; Wong, S. Patterns of Racial Diversity and Segregation in the United States: 1990–2010. Prof. Geogr. 2014, 66, 173–182. [Google Scholar] [CrossRef] [PubMed]
- Theil, H. Economics and Information Theory; North Holland: Amsterdam, The Netherlands, 1967. [Google Scholar]
- Theil, H. Statistical Decomposition Analysis; North Holland: Amsterdam, The Netherlands, 1972. [Google Scholar]
- Izquierdo, M.; Jimeno, J.F.; Lacuesta, A. Spain: From immigration to emigration? Banco España Working Papers 1503; Banco de España: Madrid, Spain, 2015; p. 40. [Google Scholar]
- Bover, O.; Velilla, P. Migration in Spain: Historical Background and Current Trends’ 1999. Available online: https://papers.ssrn.com/sol3/papers.cfm?abstract_id=219871 (accessed on 11 May 2018).
- González-López, J.R.; de las Mercedes Lomas-Campos, M.; de los Ángeles Rodríguez-Gázquez, M. Evolución de la Inmigración en Europa y España Durante los Siglos XX y XXI. Revis. CUIDARTE 2010, 1. [Google Scholar] [CrossRef] [Green Version]
- Delle Femmine, L.; Alameda, D. Inmigrantes: La Metamorfosis de España. Available online: https://elpais.com/internacional/2017/02/27/actualidad/1488194732_820452.html (accessed on 12 September 2018).
- Aguayo, E.; Guisán, M.C. Salario, empleo y productividad de la economía española en 1965–2008. Estudios Econ. Desarro. Int. 2008, 8, 99–124. [Google Scholar]
- Mahroum, S. Europe and the Immigration of Highly Skilled Labour. Int. Migr. 2001, 39, 27–43. [Google Scholar] [CrossRef]
- Lucas, R.E. On the mechanics of economic development. J. Monet. Econ. 1988. [Google Scholar] [CrossRef]
- Saks, Y.; Rycx, F.; Tojerow, I. Does Education Raise Productivity and Wages Equally? The Moderating Roles of Age, Gender and Industry 2015. Available online: http://ftp.iza.org/dp9043.pdf (accessed on 9 April 2018).
- Nathan, M. Same difference? Minority ethnic inventors, diversity and innovation in the UK. J. Econ. Geogr. 2015, 15, 129–168. [Google Scholar] [CrossRef]
- Greene, W.H. Econometric Analysis; Prentice Hall: Upper Saddle River, NJ, USA, 2012. [Google Scholar]
- Wooldridge, J.M. Econometric Analysis of Cross Section and Panel Data’ 2002. Available online: https://jrvargas.files.wordpress.com/2011/01/wooldridge_j-_2002_econometric_analysis_of_cross_section_and_panel_data.pdf (accessed on 10 May 2018).
- Cadena, B.C.; Kovak, B. Immigration, Internal Migration, and Local Labor Market Adjustment During the Great Recession. Available online: http://econ-server.umd.edu/~davis/eventpapers/KovakImmigration.pdf (accessed on 11 September 2018).
- Card, D. Immigrant inflows, native outflows and the local labor market impacts of higher immigration. J. Labor Econ. 2001, 19, 22–61. [Google Scholar] [CrossRef]
- Kleibergen, F.; Paap, R. Generalized reduced rank tests using the singular value decomposition. J. Econ. 2006, 133, 97–126. Available online: https://ideas.repec.org/a/eee/econom/v133y2006i1p97-126.html (accessed on 13 August 2018). [CrossRef] [Green Version]
- Stock, J.H.; Wright, J.H. GMM with Weak Identification. Econometrica 2000, 68, 1055–1096. [Google Scholar] [CrossRef] [Green Version]
Figure 1.
Immigrant population in Spain in the total population 1998–2016. Source: authors’ own elaboration based on Spanish National Statistics Institute (INE) data.
Figure 1.
Immigrant population in Spain in the total population 1998–2016. Source: authors’ own elaboration based on Spanish National Statistics Institute (INE) data.

Figure 2.
(a) Maps of the diversity indexes by regions in 2008; (b) maps of the diversity indexes by regions in 2016. Source: authors’ own elaboration based on INE data.
Figure 2.
(a) Maps of the diversity indexes by regions in 2008; (b) maps of the diversity indexes by regions in 2016. Source: authors’ own elaboration based on INE data.


Figure 3.
Average annual wage in Spain by nationalities. Source: authors’ own elaboration based on INE data.
Figure 3.
Average annual wage in Spain by nationalities. Source: authors’ own elaboration based on INE data.

Figure 4.
Monthly wage by regions. Source: Authors’ own elaboration based on INE data.

Figure 5.
Relationship between birthplace diversity and real wages. Source: Authors’ own elaboration based on INE data.
Figure 5.
Relationship between birthplace diversity and real wages. Source: Authors’ own elaboration based on INE data.


Table 1.
Overview of studies on the impact of migrant diversity on economic performance.
| Authors | Year of Publication | Focus | Data | Years | Diversity Measure | Results |
|---|---|---|---|---|---|---|
| Alesina, Devleeschauwer, Easterly, Kurglat, Wacziarg | 2003 | Effects of ethnic, linguistic, and religious heterogeneity on the quality of institutions and growth. | 190 countries | Data from different sources between 1960–1995 | Ethnic, linguistic, and religious fractionalization | Ethnic and linguistic fractionalization variables, more so than religious ones, are likely to be important determinants of economic success, both in terms of GDP growth, other measures of welfare and policy quality and the quality of institutions. |
| Hong and Page | 2004 | Analyze if groups of diverse problem solvers can outperform groups of high-ability problem solvers | Three different group composition (Result of computational experiments) | - | Demographic characteristics, cultural identities and ethnicity, and training and expertise | When selecting a problem-solving team from a diverse population of intelligent agents, a team of randomly selected agents outperforms a team comprised of the best-performing agents. |
| Ottavino, Peri | 2006 | Economic consequences, specifically productivity, of the growing diversity of American cities | 160 Standard MSA’s from USA | 1970–1990 | Percentage of foreign-born and a fractionalization index | Higher wages and higher rents for US natives are significantly correlated with higher diversity |
| Wadhwa, Saxenian, Rissing and Gereffi | 2008 | Relation between highly skilled immigrants to USA engineering and technology-related industries nationwide. | 28.000 engineering and technology companies in USA | 1995–2005 | Birthplace of the key founders of the companies | Skilled immigrants have contributed significantly to the USA economic growth over time as those firms in which the founders were both skilled immigrants and Americans contributed substantially both to job and wealth creation in the USA. |
| Borjas, Doran | 2012 | Effect on productivity on those mathematicians whose research overlapped with that of the Soviets. | Works published by mathematicians in the USA in one of the 63 different fields in which at least one author of the Soviet Union. | 1970–1989 | Mathematicians in the USA born in the Soviet Union. | Those mathematicians whose research programs involved Soviet researchers suffered a reduction in productivity and their publications were considerably reduced. |
| Alesina, Harnoss and Rapopot | 2013 | Impact on the economic prosperity of the birthplace diversity | Immigration data from 195 countries | 1990–2000 | Birthplace diversity index | The diversity of skilled immigration relates positively to economic development |
| Bakens, Mulder and Nijkamp | 2013 | Impact of cultural diversity on local economies | 61.738 individual workers/homeowners | 1999–2008 | Cultural fractionalization | There is a negative impact of cultural diversity on local housing markets likely driven by a causal effect between the presence of immigrants and neighborhood quality that outweighs a positive effect of immigrant-induced diversity in consumption goods. |
| Gagliardi | 2013 | Effect of an increase in the stock of human capital due to skilled immigration on the innovative performance of recipient economies. | 211 British firms in two periods | 2002–2004 and 2004–2006 | British travel to work areas (TTWAs) as key to address the impact of immigration | Those areas experiencing the most inflows of skilled immigrants are those benefiting from the availability of these new sources of individual incorporated knowledge. |
| Lee | 2013 | Two effects: a firm effect, with diversity at the firm level improving knowledge sourcing or ideas generation, and a city effect, where diverse cities helping firms innovate. | 2.223 SMEs in UK | 2004, 2005 | Share of the members or directors of companies that were born outside the United Kingdom | Average city diversity is unimportant compared to firm level diversity. Diverse firms in London tend to innovate more while those in other large cities innovate relatively less. |
| Longhi | 2013 | Impact that cultural diversity has on individual wages in England | 353 English districts | 2002–2007 | Ethnic fractionalization | Cultural diversity is positively associated with wages, but only when cross-section data are used, while panel data estimations show no impact of diversity. |
| Lewis and Peri | 2014 | Effect that immigration has on urban and regional economies focusing on productivity and labor markets. | Depending on the estimation (for USA): 284 Metropolitan, 50 states, 333 occupations or seven schooling groups. | 2011 | Immigrants’ share of employment | Immigration is associated with higher wages and with higher productivity as it induces natives to specialization in more complex jobs, which complement immigrants’ skills. |
| Trax, Brunow and Suedeskum | 2015 | Effect that cultural diversity has on total factor productivity | 11.343 establishment-year observations (7.241 manufacturing and 4.102 service observations) | 1999–2008 | The share of foreigners in a plant of total workforce and cultural fractionalization | Larger share of foreign workers (either in the establishment or in the region) does not affect productivity, but there are spillovers associated with the degree of fractionalization of the group of foreigners into different nationalities. |
| Bove and Elia | 2017 | Relation between cultural diversity and economic growth | Migrant stock data from 135 countries | 1960–2010 | Index of fractionalization and polarization | Both indices have a distinct positive impact on real GDP pc. The effect of diversity seems to be more consistent in developing countries. |
| Kemeny and Cooke | 2017 | Effect of immigrant diversity on productivity. Diversity impact at both city and workplace scales. | Employer–employee data from 29 states of USA | 1991–2008 | Fractionalization index, Entropy index, Alesina index | Immigrant diversity in USA cities and workplaces has an independent positive influence on workers productivity. Moreover, the authors conclude that spillovers from immigrant diversity are consistent across workers occupying different positions in the labor market. |
Source: authors’ own elaboration.
Table 2.
Definition and data sources.
| Variable | Description | Data Source |
|---|---|---|
| Wage | Log of the average annual gross salary per Autonomous Community | Active population survey available in the Spanish National Institute of Statistics (INE) |
| Fractionalization | Log of a birthplace index based on Kemeny and Cooke [10] | Author’s calculations based on INE |
| Entropy | Log of a birthplace index based on Kemeny and Cooke [10] | Author’s calculations based on INE |
| Alesina | Log of a birthplace index based on Kemeny and Cooke [10] | Author’s calculations based on INE |
| Population | Log of total population by Autonomous Community | Statistics of the continuous register available in INE |
| Young Population | Log of the share of young population, considering as young population those aged between 15 and 29 years | Statistics of the continuous register available in INE |
| High Education | Log of the share of population that has superior studies to the 2nd stage of Secondary Education | EDUCAbase database from the Ministry of Education, Culture and Sports |
| Natives Unemployment | Log of the unemployment rate of the native population by Autonomous Community | Active population survey available in INE |
| Share as per human development index (HDI) | Log of the share of immigrants that arrived in each Autonomous Community that come from countries with a high or very high level of human development. | Migration statistics available in INE and Human Development Reports of the United Nations Development Program |
| ldiv | Log of a birthplace index based on Ottaviano and Peri [9] | Author’s calculations based on INE |
Table 3.
Estimation results of wage using fixed effects estimation: 2008–2016.
| (1) | (2) | (3) | |
|---|---|---|---|
| Fractionalization | Entropy | Alesina | |
| Fractionalization | 0.149 * | ||
| (0.0879) | |||
| Entropy | 0.196 ** | ||
| (0.0971) | |||
| Alesina | 0.0813 ** | ||
| (0.0407) | |||
| Population | −0.0352 | −0.0430 | −0.0284 |
| (0.354) | (0.351) | (0.352) | |
| Young population | 0.803 *** | 0.813 *** | 0.816 *** |
| (0.124) | (0.122) | (0.123) | |
| High education | 0.302 *** | 0.301 *** | 0.299 *** |
| (0.0391) | (0.0388) | (0.0390) | |
| Native unemployment | −0.0685 | −0.0657 | −0.0687 |
| (0.0461) | (0.0460) | (0.0458) | |
| Share HDI | 0.380 ** | 0.397 *** | 0.398 *** |
| (0.150) | (0.147) | (0.148) | |
| Constant | 6.493 *** | 6.370 *** | 6.666 *** |
| (0.568) | (0.527) | (0.590) | |
| Observations | 153 | 153 | 153 |
| R-squared | 0.848 | 0.849 | 0.849 |
| Number of regions | 17 | 17 | 17 |
| Regional fixed effects (FE) | YES | YES | YES |
| Year FE | YES | YES | YES |
| Hausman test | 31.68 | 33.85 | 33.76 |
| (0.0045) | (0.0022) | (0.0022) | |
| Wooldridge test | 2.451 | 2.417 | 2.369 |
| for autocorrelation | (0.1370) | (0.1396) | (0.1433) |
Note: standard errors in parentheses *** p < 0.01, ** p < 0.05, * p < 0.1. For the Hausman test and the Wooldridge test for autocorrelation, we report the p-values in parentheses.
Table 4.
Estimation results of total wage using fixed effects estimation: 2008–2016.
| (1) | (2) | (3) | |
|---|---|---|---|
| Fractionalization | Entropy | Alesina | |
| Fractionalization | 0.134 | ||
| (0.0879) | |||
| Entropy | 0.182 * | ||
| (0.0971) | |||
| Alesina | 0.0733 * | ||
| (0.0408) | |||
| Population | 0.0733 | 0.0673 | 0.0796 |
| (0.354) | (0.352) | (0.352) | |
| Young population | 0.842 *** | 0.854 *** | 0.855 *** |
| (0.124) | (0.123) | (0.123) | |
| High education | 0.284 *** | 0.282 *** | 0.281 *** |
| (0.0391) | (0.0389) | (0.0391) | |
| Native unemployment | −0.0800 * | −0.0771 * | −0.0802 * |
| (0.0462) | (0.0460) | (0.0458) | |
| Share HDI | 0.420 *** | 0.441 *** | 0.437 *** |
| (0.150) | (0.147) | (0.148) | |
| Constant | 6.505 *** | 6.404 *** | 6.662 *** |
| (0.569) | (0.527) | (0.591) | |
| Observations | 153 | 153 | 153 |
| R-squared | 0.848 | 0.849 | 0.849 |
| Number of regions | 17 | 17 | 17 |
| Regional FE | YES | YES | YES |
| Year FE | YES | YES | YES |
| Hausman test | 33.03 | 35.58 | 35.30 |
| (0.0029) | (0.0012) | (0.0008) | |
| Wooldridge test | 1.306 | 1.301 | 1.275 |
| for autocorrelation | (0.2698) | (0.2709) | (0.2756) |
Note: standard errors in parentheses *** p < 0.01, ** p < 0.05, * p < 0.1. For the Hausman test and the Wooldridge test for autocorrelation, we report the p-values in parentheses.
Table 5.
Estimation results of first stage regression.
| (1) | (2) | (3) | |
|---|---|---|---|
| Fractionalization | Entropy | Alesina | |
| Predicted Diversity | 0.0725 *** | 0.0772 *** | 0.170 *** |
| (0.0237) | (0.0210) | (0.0512) | |
| Population | 0.872 ** | 0.823 ** | 1.761 ** |
| (0.372) | (0.330) | (0.804) | |
| Young population | −0.501 *** | −0.451 *** | −1.117 *** |
| (0.111) | (0.0988) | (0.241) | |
| High education | 0.0581 * | 0.0434 | 0.127 * |
| (0.0349) | (0.0310) | (0.0754) | |
| Native unemployment | −0.0174 | −0.0169 | −0.00496 |
| (0.0462) | (0.0409) | (0.0997) | |
| Share HDI | −0.747 *** | −0.607 *** | −1.526 *** |
| (0.122) | (0.108) | (0.263) | |
| Constant | −3.278 *** | −1.828 *** | −8.144 *** |
| (0.488) | (0.433) | (1.054) | |
| Observations | 136 | 136 | 136 |
| R-squared | 0.929 | 0.928 | 0.930 |
| Number of regions | 17 | 17 | 17 |
| Regional FE | YES | YES | YES |
| Year FE | YES | YES | YES |
| Kleibergen–Paap (KP) rk underidentification test | 17.28 | 12.01 | 12.78 |
| [0.000] | [0.001] | [0.001] | |
| Stock–Wright (SW) S weak identification test | 5.32 | 5.32 | 5.32 |
| [0.021] | [0.021] | [0.021] | |
| F test of excluded instruments | 9.36 | 13.47 | 11.00 |
| [0.003] | [0.000] | [0.001] |
Note: standard errors in parentheses. *** p < 0.01, ** p < 0.05, * p < 0.1. For the underidentification and weak identification tests, we present p-values in brackets.
Table 6.
Estimation results of wage using IV through two-stage fixed effects (2SFE).
| (1) | (2) | (3) | |
|---|---|---|---|
| Fractionalization | Entropy | Alesina | |
| Fractionalization | 0.836 * | ||
| (0.463) | |||
| Entropy | 0.786 * | ||
| (0.410) | |||
| Alesina | 0.357 * | ||
| (0.190) | |||
| Population | −0.560 | −0.478 | −0.460 |
| (0.632) | (0.573) | (0.580) | |
| Young population | 1.128 *** | 1.062 *** | 1.107 *** |
| (0.252) | (0.212) | (0.234) | |
| High education | 0.248 *** | 0.263 *** | 0.251 *** |
| (0.0606) | (0.0529) | (0.0573) | |
| Native unemployment | −0.0532 | −0.0544 | −0.0659 |
| (0.0659) | (0.0620) | (0.0629) | |
| Share HDI | 0.943 ** | 0.796 ** | 0.863 ** |
| (0.406) | (0.315) | (0.353) | |
| Constant | 9.097 *** | 7.791 *** | 9.264 *** |
| (1.783) | (1.082) | (1.797) | |
| Observations | 136 | 136 | 136 |
| Number of regions | 17 | 17 | 17 |
| Regional FE | YES | YES | YES |
| Year FE | YES | YES | YES |
Note: standard errors in parentheses. *** p < 0.01, ** p < 0.05, * p < 0.1.
Table 7.
Estimation results of total wage using IV through 2SFE.
| (1) | (2) | (3) | |
|---|---|---|---|
| Fractionalization | Entropy | Alesina | |
| Fractionalization | 0.889 * | ||
| (0.472) | |||
| Entropy | 0.836 ** | ||
| (0.415) | |||
| Alesina | 0.380 ** | ||
| (0.194) | |||
| Population | −0.524 | −0.437 | −0.418 |
| (0.644) | (0.580) | (0.590) | |
| Young population | 1.199 *** | 1.130 *** | 1.177 *** |
| (0.257) | (0.214) | (0.238) | |
| High education | 0.226 *** | 0.242 *** | 0.230 *** |
| (0.0618) | (0.0536) | (0.0584) | |
| Native unemployment | −0.0675 | −0.0688 | −0.0810 |
| (0.0672) | (0.0628) | (0.0640) | |
| Share HDI | 1.036 ** | 0.879 *** | 0.951 *** |
| (0.414) | (0.319) | (0.359) | |
| Constant | 9.394 *** | 8.006 *** | 9.572 *** |
| (1.818) | (1.096) | (1.830) | |
| Observations | 136 | 136 | 136 |
| Number of regions | 17 | 17 | 17 |
| Regional FE | YES | YES | YES |
| Year FE | YES | YES | YES |
Note: standard errors in parentheses. *** p < 0.01, ** p < 0.05, * p < 0.1.
Table 8.
Estimation results of wage using IV through 2SFE. Extended model.
| (1) | (2) | (3) | |
|---|---|---|---|
| Fractionalization | Entropy | Alesina | |
| Fractionalization | 3.24 * | ||
| (21.06) | |||
| Entropy | 3.984 * | ||
| (2.169) | |||
| Alesina | 2.741 * | ||
| (1.549) | |||
| Population | 0.00517 | −0.0542 | 0.290 |
| (0.0373) | (0.483) | (0.532) | |
| Young population | 0.577 *** | 0.872 *** | 0.802 *** |
| (0.164) | (0.154) | (0.150) | |
| High education | 0.424 *** | 0.303 *** | 0.303 *** |
| (0.0676) | (0.0457) | (0.0469) | |
| Native unemployment | −0.144 | −0.104 | −0.0898 |
| (0.0972) | (0.0648) | (0.0687) | |
| Immigrant share (IS) | −3.22 * | −2.750 * | −2.023 * |
| (17.73) | (1.602) | (3.026) | |
| Fractionalization *IS | 0.978 * | ||
| (0.529) | |||
| Entropy *IS | 0.193 ** | ||
| (0.0868) | |||
| Alesina *IS | 0.0439 * | ||
| (0.0225) | |||
| Constant | −7.703 | 1.781 | 6.871 *** |
| (7.710) | (2.733) | (0.831) | |
| Observations | 136 | 136 | 136 |
| Number of regions | 17 | 17 | 17 |
| Regional FE | YES | YES | YES |
| Year FE | YES | YES | YES |
Note: standard errors in parentheses. *** p < 0.01, ** p < 0.05, * p < 0.1. IS represents the percentage of immigrants in the population in each Autonomous Community (source: INE).
Table 9.
Estimation results of total wage using IV through 2SFE. Extended model.
| (1) | (2) | (3) | |
|---|---|---|---|
| Fractionalization | Entropy | Alesina | |
| Fractionalization | 3.04 * | ||
| (21.04) | |||
| Entropy | 4.213 * | ||
| (2.197) | |||
| Alesina | 2.923 * | ||
| (1.580) | |||
| Population | 0.00488 | −0.00571 | 0.366 |
| (0.0370) | (0.489) | (0.543) | |
| Young population | 0.587 *** | 0.882 *** | 0.806 *** |
| (0.164) | (0.156) | (0.153) | |
| High education | 0.414 *** | 0.293 *** | 0.292 *** |
| (0.0681) | (0.0463) | (0.0478) | |
| Native unemployment | −0.149 | −0.106 | −0.0908 |
| (0.0966) | (0.0656) | (0.0701) | |
| Immigrant share (IS) | −3.98 * | −2.995 * | −2.492 * |
| (17.72) | (1.622) | (3.087) | |
| Fractionalization *IS | 0.981 * | ||
| (0.528) | |||
| Entropy *IS | 0.178 ** | ||
| (0.0879) | |||
| Alesina *IS | 0.0347 * | ||
| (0.0229) | |||
| Constant | −8.121 | 1.314 | 6.684 *** |
| (7.706) | (2.768) | (0.848) | |
| Observations | 136 | 136 | 136 |
| Number of regions | 17 | 17 | 17 |
| Regional FE | YES | YES | YES |
| Year FE | YES | YES | YES |
Note: standard errors in parentheses. *** p < 0.01, ** p < 0.05, * p < 0.1. IS represents the percentage of immigrants in the population in each Autonomous Community (source: Institute National of Statistics, INE).
© 2018 by the authors. Licensee MDPI, Basel, Switzerland. This article is an open access article distributed under the terms and conditions of the Creative Commons Attribution (CC BY) license (http://creativecommons.org/licenses/by/4.0/).
Share and Cite
MDPI and ACS Style
Delgado Gómez-Flors, M.; Alguacil, M. The Impact of Immigrant Diversity on Wages. The Spanish Experience. Sustainability 2018, 10, 3312. https://doi.org/10.3390/su10093312
AMA Style
Delgado Gómez-Flors M, Alguacil M. The Impact of Immigrant Diversity on Wages. The Spanish Experience. Sustainability. 2018; 10(9):3312. https://doi.org/10.3390/su10093312
Chicago/Turabian StyleDelgado Gómez-Flors, María, and Maite Alguacil. 2018. "The Impact of Immigrant Diversity on Wages. The Spanish Experience" Sustainability 10, no. 9: 3312. https://doi.org/10.3390/su10093312
Note that from the first issue of 2016, this journal uses article numbers instead of page numbers. See further details here.