Article

Integrated Framework of Growth Management for Identification of Service Innovation Levels and Priorities

1
School of Economics and Management, Chang’an University, Middle section of the South Second Ring Road, Xi’an 710064, China
2
Department of Technology, College of Applied Science and Technology, Illinois State University, Turner 5100, Normal, IL 61790, USA
3
School of Civil Engineering, Chang’an University, No. 161, Chang’an Road, Xi’an 710061, China
4
School of Civil Engineering and Built Environment, Queensland University of Technology, Brisbane, QLD 4001, Australia
*
Authors to whom correspondence should be addressed.
Sustainability 2018, 10(9), 3319; https://doi.org/10.3390/su10093319
Submission received: 15 August 2018 / Revised: 10 September 2018 / Accepted: 11 September 2018 / Published: 17 September 2018
(This article belongs to the Collection Firm Size and Sustainable Innovation Management)

Abstract

:
Growth management depends on an accurate understanding of an organizations’ current situation within the market in which it operates. Literature indicates that there is still inefficiency in quantitatively diagnosing the driving factors of service innovation and growth management. The purpose of this research is to identify the levels and priorities of sustainable growth management strategies with detailed measurements for industrial service innovation. The research focuses on the construction industry as the case context to scrutinize and compare various indexes and policy platforms for the evaluation of service innovation and the development of a diagnostic framework. The paper further identified the developmental obstacles of service innovation from 585 survey responses from construction enterprise representatives from Shanghai, Beijing and Xi’an in China, using average score method and entropy weight method. The data analysis identified the service innovation level and development priorities for the enterprises can assist in determining sustainable service innovation paths. The research then combined the competitive advantage characteristics method using a cluster analysis to develop a growth management framework of service innovation in the construction industry. The research results indicated that the majority of analyzed enterprises were in the second phase of their development, with clear policy opportunities for increasing levels of service innovation. However, the results also indicate the majority of sample enterprises were not encouraging the efforts of employees to strive for innovation and were lacking appropriate investment funding towards service-related innovation. These two weaker aspects offer a starting point for firm-level managers to consider when aiming to improving service innovation. The paper contributes by advancing the quantitative evaluation of growth management policies for service innovation. Furthermore, it provides possible measures for improving service innovation with particular emphasis on service innovation in project-based construction enterprises. Finally, it offers a practical diagnostic tool to improve industry level growth via increased service innovation.

1. Introduction

Service innovation is an important business strategy for many enterprises. An increasing amount of attention has been paid to the development of innovation strategies, especially in traditional industries such as construction industries, with the intention to understand how enterprises initiate growth directions and sustain growth management through innovation [1,2,3,4]. In particular, innovation is considered essential for organizations to grow within the construction industry [5], where organizational growth occurs within an environment that is unique, dynamic and continuously evolving. There are also significant challenges that impact on the growth of a construction organization. These include a disjointed and fragmented production system, which is based on temporary projects, resulting in knowledge development and transfer discontinuities impacting on a construction organizations ability to tap into innovation knowledge [6].
The key of the growth and development of such enterprises should be service innovation, which is richer in content than monotonous technology innovation [7,8,9,10,11]. Enterprises and industries have introduced a variety of driving policies for service innovation. In consideration of labor productivity and contributions of science and technology, many driving organization policies do not reflect this emphasis on service innovation [11,12,13,14]. At present, there are significant amount of qualitative techniques driving service innovation policy [15]. However, there are limited techniques available to diagnose levels and priorities for service innovation using quantitative methods [16,17]. Quantitative approaches are able to support the needs of industry growth management and help organizations to stimulate their service innovation effectively [18]. From a practitioner or managerial perspective, there is an urgent need to investigate how to identify the countermeasures to further improve the competitive advantages of enterprises.
More recently, there has been increasing importance placed on service-dominant innovation and the focus on value co-creation within networked systems of increasing complexity. This has given rise to the meta-theoretical framework of Service-Dominant Logic (SDL) [19]. Simply, SDL positions services as central to all innovation processes and emphasizes individual value co-creation through service-for-service exchange. More recent SDL work has also highlighted the importance of governing institutions and their related systems as a coordination mechanism for service-for-service exchange [20]. As the understanding of service innovation has been traditionally based on interpretation through the lens of product innovation theory, SDL is argued to offer insight for innovation development in service-intensive industries [21].
As a key contribution of this paper, the research focuses on service innovation with particular emphasis on the project-based construction enterprises. Such project-based construction enterprises are argued to operate within a service-dominated industry. This service-dominant view suits the complexity of construction industry where production is project-based, service-intensive, with project outcomes delivered by multiple organizations.
There remains much debate in the innovation literature as to whether the construction industry is providing a product or a service. The commonly agreed view is that construction contractors, who are directly responsible for the management and delivery of construction projects, are the service providers, while the suppliers of equipment and materials provide the construction products [22].
As much of the existing innovation theory at enterprise-level has tended to focus on innovation in the context of manufacturing, learnings from this context are not readily transferable to service-dominated industries [21]. This research takes the perspective that such theory does not account for the complexities and unique innovation development challenges and opportunities in the construction industry context. The innovation challenges are further compounded by the fragmented nature of individual construction projects, the uniqueness in the specificity of project delivery and the complexity of the supply chain [23]. Thus, the research focuses on project-based construction organizations to test the refined framework, as construction organizations are uniquely positioned to capture the benefits of service innovation.
To address the gap in the literature on how practitioners can identify the countermeasures to further improve their competitive advantage, this research puts forward an integrated framework to identify the levels and priorities of growth management for service innovation in the construction industry. The broad research aim driving the study was to identify the development level of the service innovation in the construction industry and evaluate the appropriate policies for the promotion of service innovation. To address this aim, the authors first reviewed the nine most widely used innovation theories and chose the Innovation Policy Platform (IPP) proposed by World Bank Group and OECD [24] to synthesize eight key innovation evaluation systems. This integration allowed for the development of the new integrated framework and the corresponding index to investigate in the context of the construction industry. Furthermore, the authors adopted an enterprise Growth Management Model (GMM) using average-score and entropy-weight method for comparative analysis of development levels of industrial service innovation. Thirdly, based on the indexes of IPP, the authors used a competitive advantage identification method conforming to natural rule (a.k.a. the nature picks the victor from competition) to analyze the priorities of development levels [25,26,27,28]. As a result, the authors put forward pertinent improvement strategies for the industrial service innovation to promote growth management and confirmed the proposed framework could diagnose the development level of service innovation accurately via empirical analysis. The research takes a lead in studying the development and transformation of service innovation in the construction industry. It also provides a contribution in the consideration of service innovation and policy diagnostics in other industries of similar nature (e.g., other project-based industries).
A primary contribution of this paper is to incorporate the GMM, advantage-competitive thinking, into IPP to form an integrated framework of industrial service innovation. Growth can be achieved by the analysis of current situations, comparing differences between actual and benchmark levels, and accurate organization positioning. This motivates the research to pursue a deeper understanding of the identification mechanism for competitive advantage via service innovation. In addition, the research uncovers how service innovation was initiated, affected or strengthened by competitive advantage across different organizational development levels and priorities. Previous research has explored innovation using case studies of individual enterprises from a qualitative perspective [8,29,30]. Instead, this paper concentrates on a framework using quantitative methods to propose a diagnosis system of service innovation to analysis industrial growth management.
This paper is divided into the following four parts. First, a review of related literature is presented on service innovation, GMM, and competitive advantage analysis. Secondly, our methodology section outlines the average-score method, entropy method and competitive advantage analysis. Thirdly, the analysis of data is presented involving 585 valid survey responses from construction organization representatives to verify the research method and develop strategy to promote service innovation in the construction industry. Finally, key conclusions of the research are presented.

2. Literature Review

2.1. Index Analysis and Service Innovation Policies

Service innovation involves the development and design of products and services, production, operation, and sales [31]. The workflow, transfer mode, and operation system of services need to be developed to improve and enhance customer loyalty and create greater service value [31]. The form and mode of service innovation indicate that service innovation has the following characteristics: (1) service innovation can be regarded as the implementation of creative and ongoing activities by an organization [32], (2) service innovation and technology innovation are unified [18], (3) service is the application field of technological innovation, which must be customer oriented [18] and (4) service innovation must be integrated into technology innovation [18,33]. In other words, technology innovation can provide means and methods for the implementation of service innovation.
There are many indices available in the evaluation of organizational and industry innovation. Nine of the most widely used international innovation evaluation systems (and related indices) were selected based on their evaluation of innovation performance. As a starting point for this research, a comparison of the similarities and differences of these systems was conducted and through this comparison, identified seven common service innovation indicators derived from the Innovation Policy Platform (IPP) proposed by World Bank Group and OECD [24]. IPP is an Internet-based and interactive platform to provide users with knowledge, learning resources, design, implementation and evaluation of innovative policies. The platform assists users to measure and implement innovation systems, in addition to promotion of knowledge exchange and cooperation across countries and regions. Table 1 presents the Innovation Policy Platform (IPP) indicators used in this study.
Furthermore, Table 2 provides the comparison and summation across the nine selected international innovation evaluation systems. This highlights how the IPP platform indices are aligned with each system to validate the selected indicators for the research under study. These indicators were then used as the theoretical foundation to analyze growth management of industry service innovation in the following section.
As shown in Table 2, the IPP index was selected for the current research as it was deemed to cover the key indicators in comparison to other defined innovation evaluation systems. Thus, it is argued to be able to evaluate the innovation approaches of industries from multiple perspectives comprehensively. As a result of this review, IPP was selected as the evaluation system in this research and was adjusted to adapt to the specific methodology of GMM. Table 3 presents the outcome from a review of related literature, summarizes the indicators of service innovation according to IPP and provides a list of related literature that supports each indicator.

2.2. Growth Management Model (GMM)

Currently, there are challenges in the adoption of technological innovation in the construction industry [59,95,96]. With the urgent need for industry transformation, service innovation plays a crucial role. GMM uses data analysis tools such as the average score method and entropy weighted sum method to diagnose a system (via indicators) and determine the driving factors [97]. This study investigates the evaluation index system for service innovation in the construction industry and implements GMM to measure all the third level indexes in this evaluation system as shown in Table 3. The calculated result from the growth management modeling identifies the driving factors with accurate quantitative values. In this research, GMM is used to determine the level of industry service innovation for the construction industry (to be calculated by the scoring of 3rd level items). Furthermore, Competitive Advantage Analysis (CAA) is used to identify the major potential influencing factors across the 2nd level indicators and the 3rd level items within the IPP framework. This is the first time these models have been applied in combination to investigate service innovation growth levels and priorities in a construction industry context.

2.3. Competitive Advantage Analysis for Development Levels
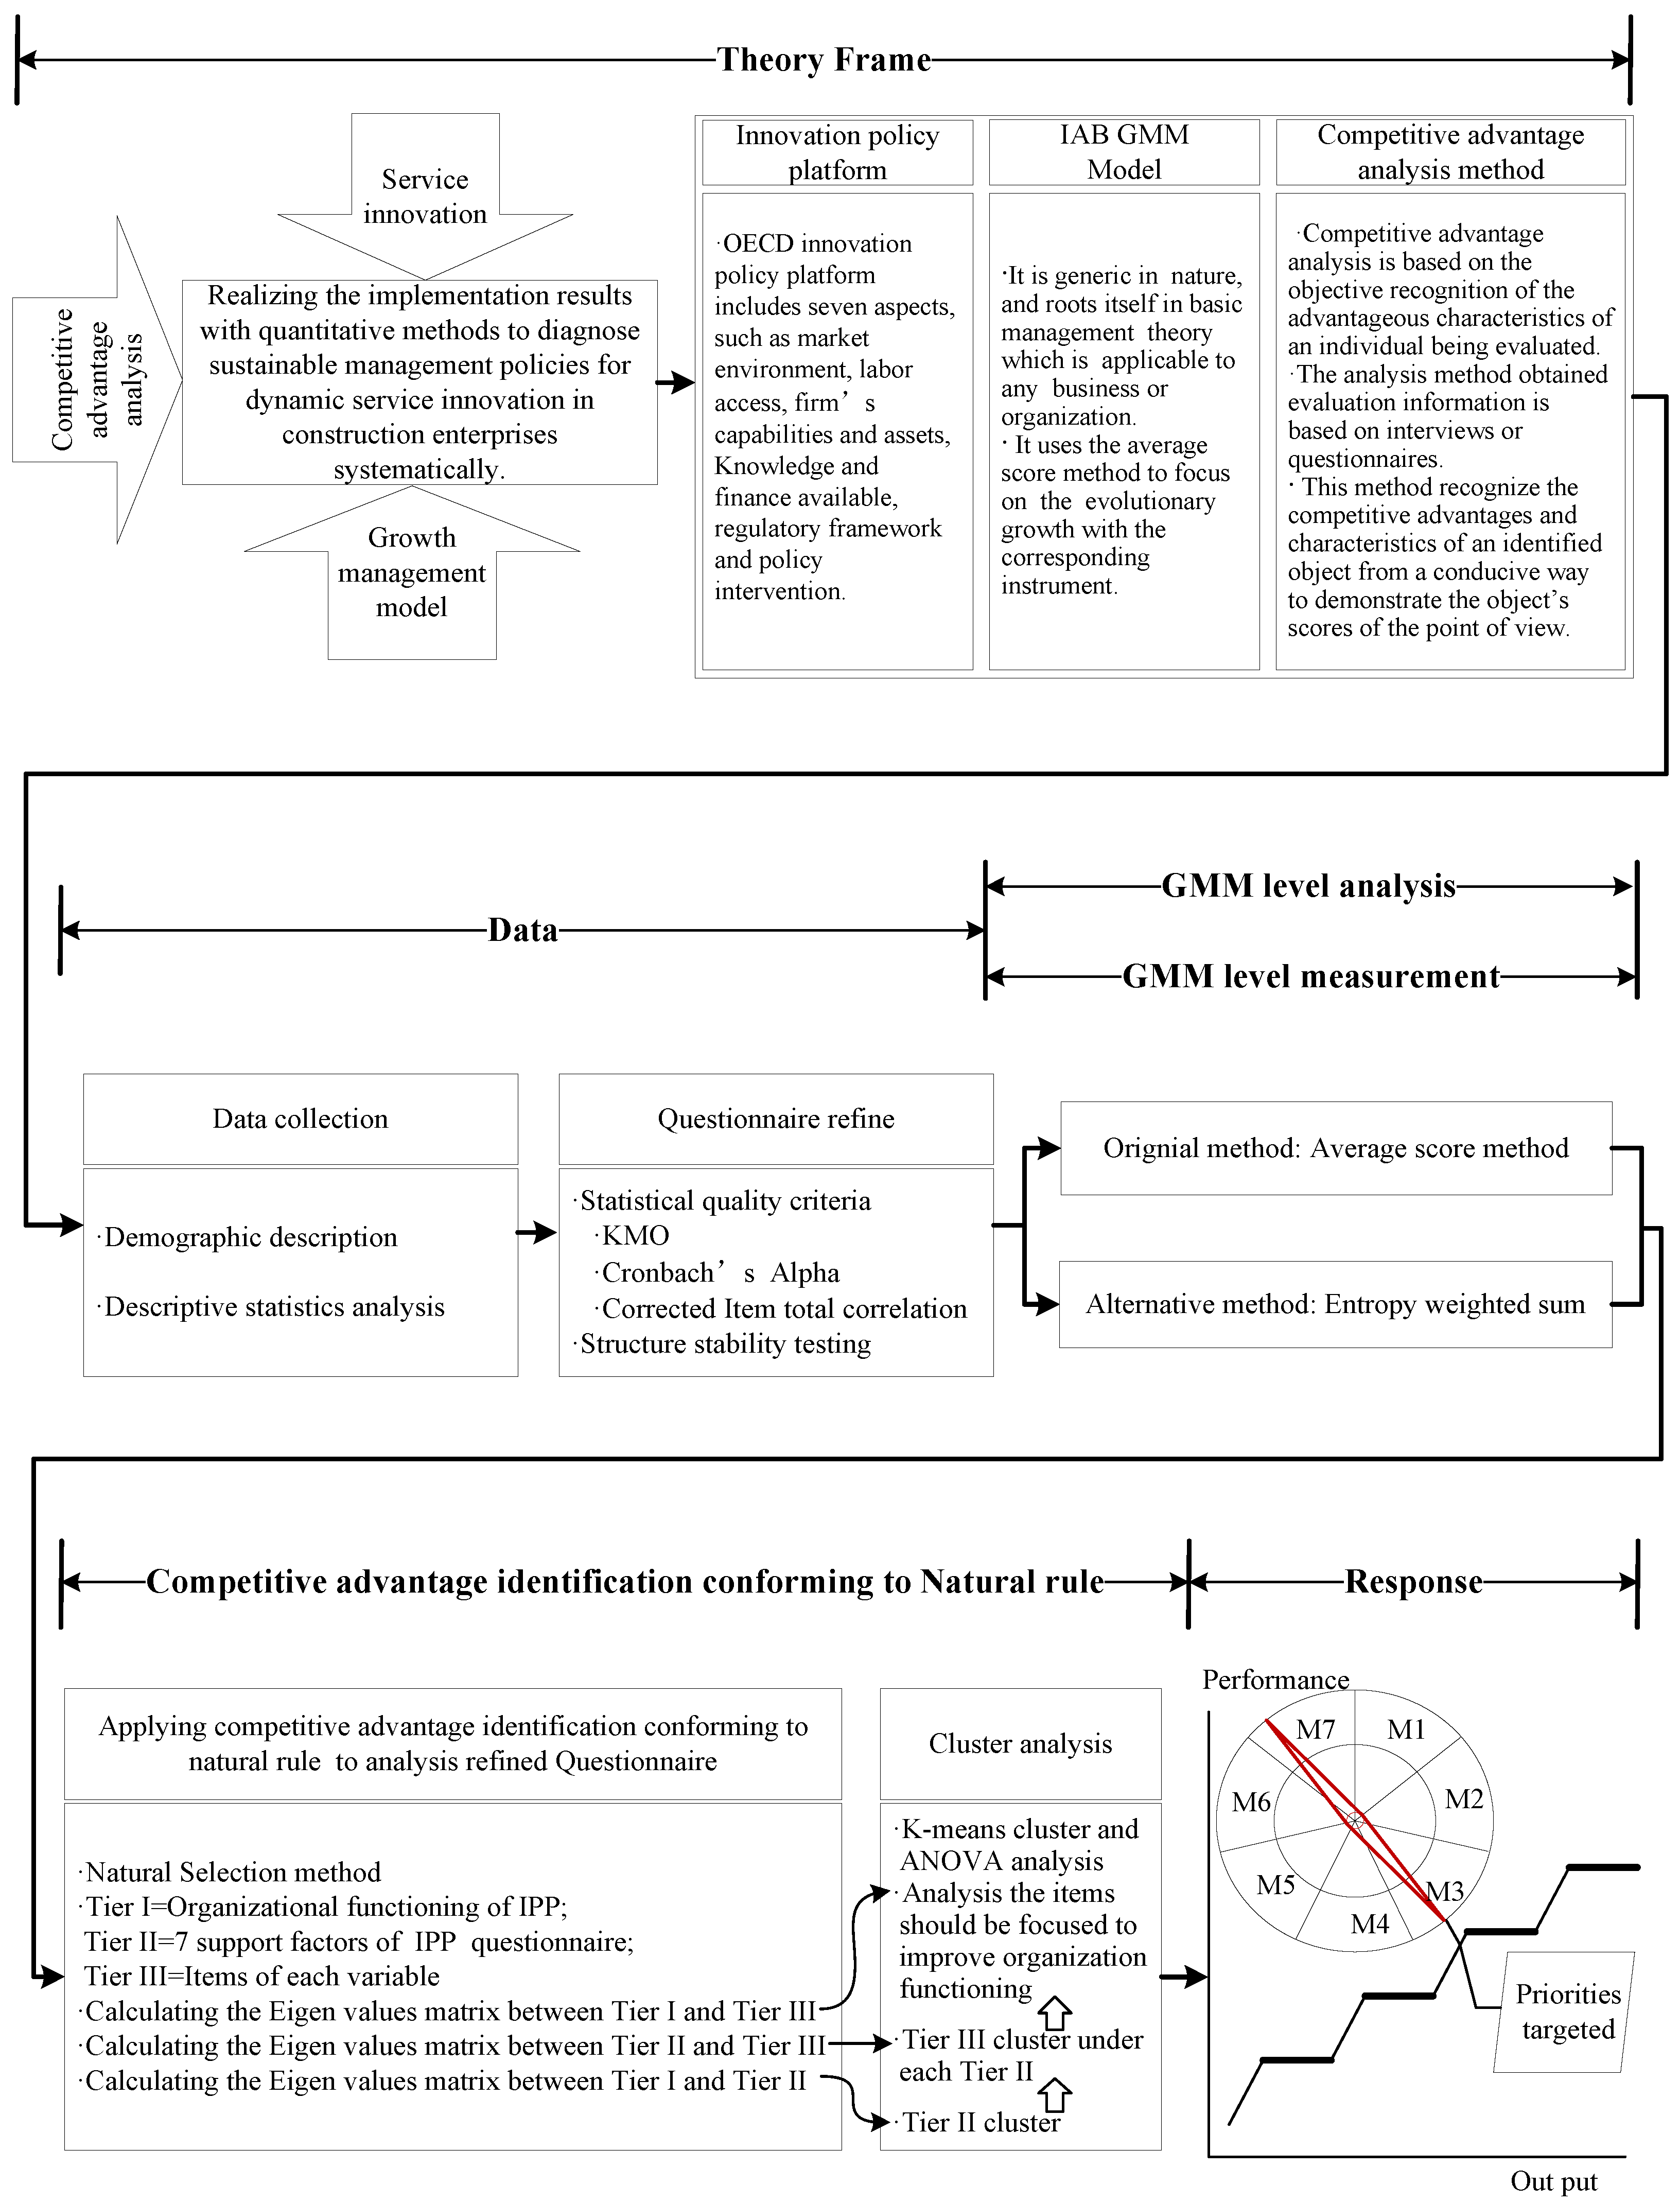
Enterprises can improve their competitive advantages through service innovations by recognizing their current growth levels and focusing on the priorities. Zhao (2006) put forward the ideology of competitive priorities and show the individual advantages in organizations [25,98]. In this research, competitive advantage analysis was based on the objective recognition of the advantageous characteristics from the perspective of the individual being evaluated. Thus, it uses the evaluation of a representative individual agent to express the evaluation of a group or organization. This is a democratic, agent-evaluation and pattern-analysis method, with the characteristics of objectivity, scientific nature, and easiness of acceptance [99]. The analysis facilitated the understanding of competitive advantage, and thus, the characteristics of the distribution across the group levels from surveyed opinions. Recent applications of the competitive advantage analysis method (from 2010) are shown in Table 4.
As presented in Table 4, the application areas of competitive analysis method are based on the characteristic model of individual advantages and group identification, which can be widely used for human-behavior identification for strengths and weaknesses. Additionally, the identification of enterprise performances and competitiveness for strengths and weaknesses can be used. Competitive advantage analysis method has the following advantages: (1) the main implementation process is objectively analyzed by a computer program, (2) the implementation process of the method; the view of each respondent is refined by the computer program to obtain the value structure. The views are expressed in quantitative form, which both embody the respect of every evaluation, and are more intuitive and easy to be understood. (3) The results are based on the respondent opinions of competitive advantage and thus, allows for the detailed data mining and information analysis from the most conducive perspective to reveal advantages of the phenomena under evaluation. Competitive advantage analysis reflects the competitive advantages of the target respondents and the analysis results are easy to be recognized by recipients [26,100,101,102].

3. Methodology

3.1. Level of Analysis

The proposed framework focuses on the current level and priorities of the industry development to determine whether there is opportunity to grow, which in turn will define the priorities areas to develop. Figure 1 presents the proposed framework. Using average score method (see Section 3.2) and entropy weight method (in Section 3.3), this framework first identifies the developmental level of service innovation in an enterprise or an industry. Based on the identification method of competitive advantages (see Section 3.4), this framework analyzed the strengths and weaknesses of business service innovation in the context of the construction industry. The framework then targeted the priorities to propose promotion strategies to facilitate improved business performance. Furthermore, the Response step of Figure 1 will clearly connect the analysis in Section 4 with the service innovation levels.
This study first developed a questionnaire survey using the indices presented in Table 3, to collect the scoring data from the construction industry for the policies pertaining to service innovation. Then, the study used the average score method and entropy weight method to quantitatively measure the overall performance level of the policies. After determining the overall level, the research focused on identifying the specific areas for improvement. The combination of CAA and cluster analysis was used to analyze the specific indicators of the Growth Management Framework (GMF) of industrial service innovation. Cluster analysis is a key component of the CAA method and allows for the grouping of the majority response to identify potential influencing factors. Cluster analysis was conducted to appropriate enterprise groupings (based on their representative responses) according to their particular level of development. The defined development levels were clustered according to four levels of construction organization maturity namely: ad hoc, defined, managed and controlled.
These levels were based on specific construction maturity categories defined by the Construction Supply Chain Maturity Model (CSCMM) [103]. This model represents four levels of construction organization maturity and defines organization growth levels in this research. This model was developed to enable construction organizations to assess construction organization’s maturity and improve the level of efficiency in relation to their construction supply chain. It assesses maturity across the four levels, along three dimensions (functional, project and firm) and according to four categories of assessment (process, technology, strategy and value) and has been adapted to define the construction enterprise development levels and related service innovation indicators. Specifically, for each index, the paper suggested a specific development level based on its value. In the data analysis, the research used a Likert five-level scale for the survey questionnaire options to assign points, as shown in Table 5.
To realize the level and priorities of growth management for identification of service innovation, the research used an integrated generation step. The specific calculation could be identified as follows: (1) the research used the Average Score Method to analyze the development level. Suppose that there was K = 5 (where A = 1 represents strong disagreement to E = 5 represents strong agreement) scaling of each indicator in each unit, then, there were 4 (K = 5) levels to be graded for the sample. The scope of each level is shown in Table 5. (2) Furthermore, the following provides detail on the entropy weight method used to analyze the development level. In this research, the authors processed m questionnaires with entropy weight method [104,105,106]. (3) Following the analysis of the development level, the authors combined the competitive advantage analysis (CAA) and cluster analysis method to identify the characteristics of the m questionnaires and classified them [26,27,100,101]. The specific formulation could see Section 3.1, Section 3.2 and Section 3.3.

3.2. Average Score Method to Analyze the Development Level

The following provides detail on the Average Score method used to analyze the development level. Suppose there are m units and n indicators to be evaluated to establish the sum in Equation (1),
Z F i = t = 1 n f s t
where s = 1, 2, 3, …, m; t = 1, 2, 3, …, n; Z F s = the score sum of the sth sample; f s t = the tth index score of the sth sample. Then, the average score of m units was calculated in Equation (2),
f = s = 1 m Z F s m
Suppose that there was K = 5 (where A = 1 represents strong disagreement to E = 5 represents strong agreement) scaling of each indicator in each unit, then, there were 4 (K = 5) levels to be graded for the sample. The scope of each level is shown in Table 5.

3.3. Entropy Weight Method to Analyze the Development Level

Furthermore, the following provides detail on the entropy weight method used to analyze the development level. In this research, the authors processed m questionnaires with entropy weight method [104,105,106]. Specific steps are as discussed follows:
1. n = number of indexes; entropy weight = { ω 1 , ω 2 , , ω n }
(1) Construction of judgment matrix
m = number of subjects evaluated,
R = judgment matrix,
R = ( r s t ) m × n   ( s = 1 ,   2 ;   m , t = 1 ,   2 , n )
where, r s t = Found evaluation index of the tth index of the sth subject.
(2) Analyzing standardized matrix B
B = ( b s t ) m × n   ( s = 1 ,   2 ;   m , t = 1 ,   2 , n )
Where ,   b s t = r s t r m i n r m a x r m i n
And r m a x , r m i n are the most satisfied and most dissatisfied.
When   the   index   is   positive :   b s t = r s t r m i n r m a x r m i n
When   the   index   is   negative :   b s t = r m a x r s t r m a x r m i n
(3) Calculation of entropy value
H t = ( s = 1 m f s t ln f s t ) / ln m   ( s = 1 ,   2 ;   m , t = 1 ,   2 , n )
where f s t = b s t / s = 1 m b s t . When f s t = 0 , ( ln f s t ) has no meaning. Hence the adjusted calculation of f s t is in Equation (6).
f s t = ( 1 + b s t ) / s = 1 m ( 1 + b s t )
(4) Calculation of entropy weight
w = ( ω t ) 1 × n ,   ω t = ( 1 H t ) / ( n t = 1 n H t )
Under the condition of t = 1 n ω t = 1 .
2. The final score of m questionnaires:
s f = i = 1 m ω i f i
where: f i is score of the ith index.

3.4. Competitive Advantage Identification Method Conforming to Natural Rule

Following the analysis of the development level, the authors combined the competitive advantage analysis and cluster analysis method to identify the characteristics of the m questionnaires and classified them [26,27,100,101].
(1) The competitive advantage model of the top level regarding foundational indices
According to the evaluation opinions of the ith evaluation person, the model for identifying the competitive characteristics of the subjects from the top level to the foundational level was calculated as follows:
min d i 2 ( x i , x ) = k = 1 m j = 1 p k w k j 2 ( x k j x i k j ) 2 s . t . k = 1 m j = 1 p k w k j = 1 w k j 0 ,   k = 1 ,   2 , m ;   j = 1 ,   2 , p k  
where k for the index number of the middle layer, p k is the number of indicators below the kth indicator.
(2) The competitive advantage identification model of the middle level to its foundational level indices
The model listed below is the competitive advantage characteristic analysis of the behavior subjects in the foundational level identified by the behavior subject in the middle layer from the point of view of the kth index.
min d i k 2 ( x i , x ) = j = 1 p k λ i k j 2 ( x k j x i k j ) 2 s . t . j = 1 p k λ i k j = 1 λ i k j 0 ,   j = 1 ,   2 , p k ;   i = 1 ,   2 , n  
where: ( y i k ) 2 = j = 1 p k ( λ i k j ) 2 ( x k j x i k j ) 2 . It is based on opinion of the ith evaluation person. In accordance with the idea of competitive advantages, a behavior subject is assessed in the middle layer for the kth indicator of its performance. The smaller the square value of the assessment score, the better the performance. The above calculation can traverse the middle layer for each index. The ideal value of the calculation result of evaluation is 0. Therefore, based on the opinions of the evaluation persons and from the perspective of the topmost level (i.e., the upper layer), the identification model of the competitive advantage characteristic analysis described as follows:
min z i 2 = k = 1 m μ i k 2 ( y i k ) 2 s . t . k = 1 m μ i k = 1 μ i k 0 ,   k = 1 ,   2 , m
where μ i k represents the weight of the kth indicate, based on the opinion of the ith evaluation person. Also w i k j = μ i k λ i k j .
(3)  w i k j = μ i k λ i k j , to calculate the characteristics of the indicators from the highest level to the middle layer.
The basic principle of the clustering was to build A = (number) pieces of samples or indexes respectively as different classes. Then the classes with attributes that are closest to each other (or similar to the greatest extent) would be combined into a new class. The total number of classes is no more than (A − 1). Next, the classes with attributes that are closest to each other were again combined. This process continues until all the samples are clustered into one class. Finally, after surveying the clustering process, the appropriate clustering stage are chosen to enable the completion of cluster. In practical applications, the last part is decided based on the specific purpose of the analysis, as well as the specific circumstances of the cluster, to set the number of clusters. Generally speaking, the weighted characteristics of competitive advantage represent the value structure of an evaluated person. Therefore, through systematic clustering of the weighted characteristic of competitive advantage, the authors were able to categorize the opinions from the respondents who hold the same or similar value structure. This is also refined the behavior modes based on value selection. In this study, SPSS22.0 software was used for cluster analysis.

4. Data Collection and Analysis

4.1. Data Collection

To investigate the implementation of service innovation in construction industry, this research used questionnaire survey for data collection. The survey targeted construction enterprises in Shanghai, Beijing and Xi’an cities of China. Construction enterprises from these cities were targeted because they represent the more developed regional construction sectors in China. As the capital city of China, Beijing is the political, cultural and educational center of the country. Furthermore, Shanghai is known as the economic center of the country. The data surveyed from the construction enterprises in the two cities are representative of the more developed domestic construction sectors in China. Furthermore, in 2017, Shaanxi Province ranked as 16th in output value across the regional construction industries of China, which was considered as middle ranking. Furthermore, Shaanxi Province was ranked the 8th in output growth across the regional construction industry in China in the same year. This province was selected for study because it represents the average development of the regional construction sectors and had relatively strong regional growth in China. Xi’an, as the capital of Shaanxi Province, is also considered as the center of northwest China. The construction enterprises in Xi’an city represent an average development level of service innovation of medium-size, regional construction enterprises. In 2017, with the support of China Construction Economic Association, a random selection of 1200 construction companies from the Beijing, Shanghai and Shaanxi Commercial/Industrial Telephone Directory were contacted. Telephone calls to the top administrator of each company were conducted to explain the purpose of the study and to solicit agreement for survey participation. Of the 1200 companies, 936 agreed to participate. Nine-hundred thirty-six questionnaires were then delivered to the top administrator in each company for distribution. The contents of the questionnaire are shown in Appendix A.1. A telephone follow-up was conducted within two weeks to check that the top administrator (i.e., general or deputy-general manager level) received the surveys for distribution. In many cases, the research organization sent representatives to meet the top administrators of the companies to explain how the data would be used, to answer any queries, and to collect the questionnaires once completed. Direct research representative contact is an important step to obtain high-quality data in China [107,108]. Table 6 presents a summary of the data collection process.
In summary, there were 936 questionnaires distributed in this research. A total of 775 questionnaires were returned with a positive response rate of 82.79%. After strict sorting, unqualified and uncompleted questionnaires were removed. In total, 585 qualified questionnaires were analyzed. In addition, to determine whether non-response bias was present in the study, the authors compared early respondents with late respondents across the key constructs. Chi-square tests showed that no significant differences existed between the early and the late respondents with regard to firm characteristics. In addition, t-test results indicated that there were no significant differences between the early and the late respondents on the measures of construction industry innovation management. Thus, non-response bias was deemed acceptable in this study. Table 7 presents the sample attributes by percentage of the 585 questionnaires collected.
The sample attributes are summarized as follows:
(1)
The sample projects were mainly building projects. According to the nature of their uses, buildings can be divided into industrial construction and civil construction in China. Civil construction can be subdivided into public buildings and residential buildings. According to Table 7, 60% of the sample consisted of civil construction projects.
(2)
Majority of respondents had higher education degrees. Hence, it can be argued they had a good understanding of service innovation and were more sensitive to the driving factors of innovation. They also had their own views in terms of service innovation.
(3)
The majority of the sample respondents were 35 years old and younger. The relatively young sample composition meant that generally the respondents had better ability to accept new technology and new ideas, in addition to bring innovative concepts and ideas to enterprises.
(4)
The sample composition was similar to the structure of the enterprises surveyed. From the positions of the people sampled, most of them were general staff, which was in accordance with the proportion of enterprise personnel. Hence, it is argued the survey results were representative of the enterprises surveyed.

4.2. Data Quality

4.2.1. Validity Test

Validity of this research was reflected by the values of KMO (Kaiser-Meyer-Olkin) test statistics [109]. The KMO statistics are between 0 and 1. If KMO value is close to 1, it means that the correlation between variables is strong. Hence the original variable is suitable for cluster analysis. Otherwise, the original variable is not suitable for factor analysis. Table 10 shows the commonly used KMO metrics [109].

4.2.2. Reliability Analysis

Cronbach’s α coefficient was used to measure the reliability of the questionnaire survey. To guarantee the reliability of the data in the research, the authors used the item-to-total coefficient of each question to delete those questions with item-to-total correlation less than or equal to 0.3. After testing the reliability of each dimension, the results are shown in Table 8. Question 4.1 was deleted from the questionnaire because its total correlation was 0.3. The overall Cronbach’s α and the Cronbach’s α of all remaining questions were greater than 0.9. In addition, the Item-to-Total Correlation of every item was greater than 0.3. Therefore, no further question was deleted from the questionnaire.

4.3. Research Results I—Average Method

After removing Question 4.1 from the questionnaire, the total number of indicators was 39. In Equation (1), m changed to 585; n changed to 39. So the updated classification is shown in Table 9. Using Equation (2), the average score of the questionnaire was 113.67, which was in the Second Level of Table 9 and the driving force was medium. Although most enterprises were still relatively modest in development, a few leading enterprises had higher service innovation levels.

4.4. Research Result II—Entropy Weight Method

The authors constructed the evaluation matrix and matrix standardization with Equations (3) and (4) using raw data, in which, n = 39 and m = 585. The authors then used Equations (5)–(7) to calculate standardization data. The results of entropy weights of indexes (or questions) are shown in Table 10.
Using Equation (8), the weighted average value of the sample was 2.838. Table 11 shows the statistics of the questionnaire for all levels.
After comparing the results of I and II, it clearly shows that the final grade of the sample was Level 2, calculated by both the average method and the entropy weight method. However, taking into consideration information objectivity, the entropy method was considered an alternative approach to the average method. It was determined the Entropy method was more objective and accurately targeted the specific influential factors at evolutionary growth levels within the proposed framework.

4.5. Research Results III—Competitive Advantage Analysis Method

Table 12 shows the clustering of the characteristics of the competitive advantages of the topmost levels to the various indicators in the middle layer. The authors divided the 585 questionnaires into four categories. The third category had 1, which was not significant, and hence removed. The second cluster accounted for the largest proportion, which was the most representative in the reflected weight ratio.
Table 12 shows the calculated weights of various indicators using the algorithm of competitive advantage analysis. The greater the weight of the indicators the more advantageous they were. The sum of the weights of all indices was very close to 1. The authors used 1 for the rest of the analysis, which turned out to have little influence on the results. Then the average weight of the 7 indicators would be 1/7 = 0.143. Taking 0.143 as the standard, if a weight was less than 0.143, the associated index was not a competitive advantage. The indicated area would need to be improved. If the weight of an index was small, there was increasing urgency for improvement. If the corresponding weight was greater than 0.143, the index had certain advantages. A high value of a weight indicated a greater advantage in the index.
As presented in Table 12, Level 2 captured the majority of respondents, highlighting this was the cluster level most of the construction enterprises were within from the sample. This stark result suggests majority of construction firms were limited in their development, suggesting need for significant improvement in their approach to service innovation and may explain the contextualized problem in the construction industry more explicitly. The questionnaire indicators M3 (0.205), M4 (0.146), and M6 (0.311) have certain advantages. Indicator M7 has the weight of 0.143 exactly, which indicates that it is in the middle level of development. All the rest indices were deemed to not have competitive advantage, especially index M2 (0.047) and M5 (0.055), which needed urgent improvement.
The authors performed the analysis of variance (ANOVA) on single factors of the indices across the 3 survey respondent roles in the middle layer (as shown in Appendix A.2). The concomitant probability of F statistic of M2 was 0. 864. The remaining concomitant probabilities were 0, which were less than the significant level of 0.01. This demonstrated that the differences between the four types of M2 indicators were not very significant; while the differences of other indicators were quite substantial. Clustering of characteristics showing the competitive advantages of the indicators in the middle layer.
As shown in Table 13, for M1 indicators, the authors divided the 585 questionnaires into two categories: Cluster 1 had 273 questionnaires; Cluster 2 had 312 questionnaires. The two clusters had little difference in the number of questionnaires. Therefore, the problems reflected in both clusters required attention. There were 6 fundamental layers under the middle layer of M1. Hence, the average weight of them was 1/6 = 0.167. The authors used the two clusters from Table 13 to analyze their opinions reflected by the dimensions of M1. The dimensions 1.1, 1.2, 1.3 and 1.4 of M1 were positive. However, the dimensions of 1.5 and 1.6 had certain deficiencies. Dimension 1.6 was particularly in urgent need for improvement. The Cluster 2 respondents believed that dimensions 1.5 and 1.6 of M1 had an advantage, while the rest of the indicators did not. In particular, dimensions 1.1 and 1.2 were in urgent need for improvement.
Using ANOVA analysis on single factors across the two clusters in Table 13 for the M1 measurements of the indicators, the authors found that the two clusters had the concomitant probabilities of F statistics as 0, which were less than the significant level of 0.01. As such, the two clusters had significant differences.
As shown in Table 13, for the sub-systems of M2, M3, M4, M5, M6 and M7, the average weights were calculated according to the number of questions in each sub-system. If a particular indicator had a cluster weight greater than the average weight of the specific sub-system, the respondents believed that the development of this indicator had apparent advantages. Otherwise, the indicator had weak development. For example, Cluster 1 of M2 believed that M2.1 had apparent advantages or was in good condition. However, the dimensions of M2.2 and M2.3 had deficiencies and needed improvement. Using ANOVA analysis, the authors found that the two clusters of M2 had the concomitant probabilities of F statistics as 0, which were less than the significant level of 0.01. The two clusters had significant differences. As shown in Table 13, for M2 indicators, the authors divided the 585 respondents into two categories: Cluster 1 had 358 questionnaires; Cluster 2 had 227 questionnaires. The number of respondents in Cluster 1 accounted for a larger proportion. Hence, it was relatively more representative. The same analysis criteria were used to identify the indicators or dimensions that had significant advantages in development and the dimensions that had the weakest development levels and needed urgent improvement.

4.6. Analysis

The results indicated that the sample enterprises implemented service-innovation-driven policies and most had modest development levels. Overall, the enterprises were well developed in M6 (regulatory framework for innovation in firms) category. Their development levels in M2 (Firms’ access to labor for innovation) and M5 (Firms’ access to finance for innovation) were weak and needed improvement. Regarding the remaining categories, the enterprises were normal and balanced in the development levels. In other words, the measured enterprises had certain service innovation abilities and were provided with access to innovation knowledge channels. This was particularly the case for the enterprises which had developed specific governance and regulations tailored to innovation development and staff input. However, for the enterprises with deficiencies in labor input and dedicated innovation support funding, improvement was needed.
Specifically, in all of the indicators of M1, the development levels of 1.1 (Industrial Specialization) and 1.2 (Technological Trajectories) relatively lagged behind. Additionally, indicators 1.5 (State of Competition) and 1.6 (Markets for Technology) were also lagging. These results suggest enterprises should increase investment in technology and specialization, develop new markets for innovative services to gain competitive advantage. The development levels of other aspects were relatively balanced, where enterprises were continuing to maintain. The fundamental indicators of M2 indicated that development strategies were neglecting the impact of indicator 2.2 (Employee Migration) on the service innovation of staff. If enterprises couldn’t provide attractive immigration policies for staff, some employees with immigration needs or having troubles with the complicated and cumbersome immigration procedures might leave. Therefore, enterprises, especially those with foreign employees, should pay attention to the immigration policies. Meanwhile, indicator 2.3 (Costs of Hiring and Firing) showed that the enterprises did not take into account the overhead costs of hiring new and capable employees or dismissing employees. The fundamental indicator 3.3 (Prototyping and Industrial Scale-Up) of M3 showed that the enterprises may not be fully recognizing the value of prototyping and scale up procedures. In M4, dimensions 4.4 (Interface with universities and public research institutes) and 4.5 (Technological co-operation between firms) had innovation limitations. To overcome the limitations, the enterprises could seek more external partnerships to share innovation knowledge and seek support from external research infrastructure for research and development. In M5, the enterprises used a variety of ways of financing, but mainly depended on corporate-retained earnings to invest in innovation. The development levels of the dimensions 5.2 (Debt financing) and 5.3 (Stock market financing) were deficient. In M6, if staff do not receive a strong level of support on their innovation development (as shown in indicator 6.1), that can have an impact on the enthusiasm of the staff to share new and innovative ideas. Meanwhile, there was not enough reasonable regulation on the innovative products in market (as shown in indicator 6.2). One result was the emergence of innovation “counterfeiting”. Motivation to innovative can be negatively affected by inadequate protection of intellectual property. In addition, enterprises should strengthen their focus on environmental protection and safety management (as shown in indicator 6.5) to stimulate innovation. As shown by the fundamental indicators of M7, the employees of the enterprises suggested that the government could promote technological innovation (as shown in indicator 7.4) and encourage innovative public procurement (as shown in indicator 7.5). The government had the ability to lead by example and promote innovation through public procurement policy. Once in place, government projects can also act as an incubator for innovative ideas.
To improve service innovation performance, construction enterprises could consider the following suggestions based on the research results:
(1) Enterprises should increase innovation investments from internal funding, which includes the following two aspects:
  • Enterprises should increase their R&D investment, including the potential for hiring more R&D personnel (as shown by indicators 2.2 and 2.3), providing more capital (as shown by indicators 5.2 and 5.3), greater investment in innovative construction processes such as modular construction and construction industrialization (as shown by indicator 3.3) [58,59] and offering training in these areas for site personnel. Furthermore, enterprises should develop dedicated innovation management systems (as shown by indicator 6.1). The systems are the most important aspect to create business environment for encouraging innovation.
  • Enterprises can explore different paths, through certain ways, to influence the external environment of enterprise-level innovation (as shown by indicators 1.5 and 1.6). The purpose is to transform the external environment to directly facilitate enterprise innovation [49].
(2) Enterprises should consider the benefits open-learning environments that facilitate innovation knowledge flow (as shown by indicators 1.1 and 1.2).
To meet the challenge and demand of the knowledge economy [43], it becomes an inevitable choice for enterprises to develop open innovation. Open innovation has been advocated in recent times to promote greater collaboration between construction firms (Rose and Manley, 2012). This is due to the emphasis of the open innovation approach on key feature of modern innovation processes—the openness of organizations to external ideas in the name of creativity, innovation and growth [110]. One way of doing this is to establish a free and open system to facilitate information sharing, communication and knowledge dissemination. It can promote the enterprises’ internal and external information and knowledge flows swiftly and smoothly. Such an approach can improve innovation knowledge sharing where stakeholder in the innovation process can jointly learn, through practice, interaction, error correction and reflection and gain key information feedback in a timely manner. In addition, enterprises should monitor construction industry development, collaborate with R&D institutes and universities, and focus on impact-efficiency factors to benefit from organizational growth [44].
(3) Enterprises need to pay attention to innovation and study the innovation market.
Enterprises need to further enhance the awareness of intellectual property and improve their abilities to use intellectual property rights [75]. Enterprises should use intellectual property rights as a major means of competition, combine intellectual property strategies and enterprise development strategies, and study and formulate the enterprise development strategies of service innovation according to their intellectual property advantages. Eventually, enterprises can establish their development directions and strategy targets. The considerations about intellectual properties are reflected by indicator 1.5. According to indicator 1.6 focusing on technology markets, enterprises should vigorously promote the industrialization of patent technology. After enterprises obtained intellectual property rights, they need to actively create conditions and increase investment to promote industrialization [48]. If an enterprise does not have internal conditions to develop their own intellectual property, they can accelerate the realization of industrialization through joint venture cooperation and technology sharing. Some projects may also be transferred outward through a specific technology market or licensed to use, to promote the flow and diffusion of knowledge.
(4) Enterprises should implement talent promotion strategies (as shown by indicators 2.2 and 2.3).
Enterprises need to focus on the cultivation of backbone talent who may have innovative skills, and rich practice experience [53,54]. Enterprises can also accelerate the development of service innovation experts, vigorously develop professionals for service innovation practice, introduce and cultivate high-level creative personnel, and facilitate managers for innovation management. Such efforts can be achieved through domestic and international training, international exchanges and cooperation, and focused talent recruitment, to strengthen high-level personnel training [52].
(5) Enterprises should build exchange platforms (as shown by indicators 4.4 and 4.5).
One suggestion is to build public sharing platform of technology resources, for example, develop a collaborative service network for scientific instruments and important facilities [111]; build a platform for personnel exchanges and learning [112]; establish a cross-regional mechanism for professionals to learn and exchange ideas [113]. The implications include encouraging technical personnel to study and improve their skills, improve the effectiveness of education and training, and comprehensive use of public resources.
Furthermore, it is recommended that intermediary service systems are developed that may include the establishment of external institutions for information consultation, investment and financing, and brokerage of science and technology. Such institutions serve as intermediaries to provide specialized services, particularly relating to innovation development. Industries should encourage internal R&D groups to cooperate and communicate with foreign multinational corporations, universities, research and development institutions through various forms of R&D entrustment, joint research and development, purchase of technology, introduction of professionals, and sharing of equipment and information resources [66]. Industries also should encourage enterprises to reach out to established international R&D institutions that specialize in specific science and technology areas [67]. Certain funds could be allocated to support technology research and development that comply with industry policy.
(6) Enterprises should establish and improve the environment of investment and financing for innovation and entrepreneurship (As shown by indicators 5.2 and 5.3).
At present, the major investment method used by Chinese financial industry on science and technology are corporate loans [71]. Bond financing, stock market financing, and other investment and financing methods are developing rapidly. It is recommended that the government should take action to expand the support for R&D and innovation activities from financial institutions. There are certain risks for enterprises to directly invest in R&D and innovation activities. Hence, the government can consider building financial support through incentives, such as direct funding or tax minimization. In addition, the government should learn from foreign experiences and make full use of government funded entities to provide financing and credit guarantees for innovative enterprises. Therefore, credit-guaranteed government institutions could actively cooperate with the construction businesses, to re-distribute risk and actively promote advanced international risk-sharing approaches [72].
(7) Enterprises should focus on innovation management and promote intellectual property rights (As shown by indicators 6.1 and 6.2).
The government should consider implementing systems to encourage intellectual property rights. The detailed measures include the following items: (a) the implementation of intellectual property strategy, in order to enhance the ability of scientific and technological innovation and industrial competitiveness. This can directly strengthen the creation, use, protection and management of intellectual property rights, and promote industrialization [75]; (b) strengthen the dominant position of enterprises to effectively manage innovation. It is important for the enterprise to consider construction market regulations. Governments should guide enterprises to increase investment in innovation in light of the regulatory environment, particularly in the acquisition of intellectual property rights as an important means to develop markets and enhance competitiveness [76,77,78,79]; (c) promote the application and transfer of intellectual property rights, industrialize patent technology, and enhance the application of enterprise trademarks. The government can improve the protection mechanism of intellectual property rights, by improving the related regulatory mechanisms. This may include the punishment of illegal crime and infringement of intellectual property rights according laws; (d) finally, governments should be encouraging environmental and safety innovation via regulations. Regulations can act as a driving force for technological change that has a direct positive influence of safety standards and environmental outcomes (Kemp, 1998). This is particularly relevant in the construction industry also targeted as a major environmental polluter, with its conversion processes taking place in a predominantly external and loosely controlled environment [114]. Environmental and safety regulations can encourage innovation and influence the direction of technological change [83], driving firms explicitly towards the development and use of innovative technologies which protect the environment or result in higher standards of safety (Kemp, 1998).
(8) Enterprises should strengthen public procurement (As shown by indicator 7.5).
Many countries attach great importance to the construction innovation market [89]. Government procurement has become widely adopted as a policy tool by many countries in stimulating the demand for innovation [115]. Measures can include (a) the establishment of comprehensive ‘innovation-friendly’ policy to guide in government procurement activities and exclusive enforcement agencies for non-compliance, (b) to establish a multi-level supervision system to enhance the efficiency of government procurement, and (c) to promote domestic innovation and Small to Medium Enterprise (SME) innovation through government procurement policy [91].
(9) Governments should be facilitating extension services to extend existing innovation of Construction Small to Medium Enterprises (SME’s) (As shown by indicator 7.4).
In summary, the technological trajectories and government promotion on technology innovation caught attention of the survey group. Hence, the following are suggestions from the analysis. (a) The government can support construction SME by diversifying innovative products and innovative technologies, and providing construction clients with more choices of products and technologies. Thus, it can break the dominate situation of certain technologies and products in a market and overcome the obstacles in commercialization of innovation developed by of industry-university collaborative research [90]. (b) Through the development of information-service platforms, such as community of practice forums or industry promotion events, where the government can vigorously promote cooperation and innovative products and processes, and construction clients can understand the performance advantages and the methods of use of new technology, products or processes [116]. This can increase the knowledge and confidence of clients regarding new-to-market innovation and technology. Again, this is particularly important due to the complex and fragmented supply chain in construction production [23]. (c) Finally, relevant government departments should pay attention to SME’s in the construction industry to advance construction enterprise awareness of the uses of technologies for the benefit of environmental protection and work safety [92]. By improving the environmental and safety targets for the built environment, can encourage greater uptake of innovative solutions.

5. Conclusions

This paper has proposed an integrated framework and used a new mixed method of (a) average score, (b) entropy weight method, (c) the competitive-advantage analysis conforming to natural rule, and (d) the cluster-identification method, to assess the growth management levels and priorities for industrial service innovation. This new mixed method approach makes improvements to the diagnosis field of service innovation and industry policy evaluation with the bottom-up communication. The research gathered data from the frontline staff, managerial teams and executive boards, and analyzed the most representative respondent opinions according to defined service innovators. This new approach provided the measures to further improve the competitive advantages of enterprises.
This research contributes to the existing literature on service innovation in the construction industry by considering project-based construction enterprises operating within a service-dominated industry [21]. It also considers aspects affected by internal and external factors prescribed by IPP and applied in a practical industry context. The framework for service innovation includes various related driving forces and considers the innovative development at both present level and future trajectory. It innovatively integrates the growth management model and the comparative advantage thinking into IPP [23] to systematically diagnose the growth management levels of service innovation for enterprises. The provided recommendations in promoting higher levels of service innovation can lead to the improvement of industry performance.
The samples of this study included the construction enterprises only from Beijing, Shanghai and Xi’an provinces in China. However, the proposed framework could be applied to measure a wide range of growth management issues relating to service innovation in other jurisdictions. Moreover, the model can be used as a basis for further extensions to experimental research, such as multi-period innovation policy management considering time-dependent demand and context constraints. Future research should examine the properties of this current research scale and possibly test the framework in the context of other industries and other developing countries. Such findings may allow the comparison between industries in both developing and developed countries. It is also expected that the scale should do equally well in other countries. Furthermore, a large-scale qualitative study could be conducted to further validate the individual factors from a wider range of industry perspectives (beyond the construction organization context). In this research, the data were collected through self-report of the key informants, which may also be another limitation of the study. Again, to address this limitation, future research should test the scales using data collected from a wider range of industry sources. The literature review in this paper summarizes the key elements of service-innovation evaluation systems and indicators. Based on the advances achieved in previous studies, more research attention will be helpful on the details and contrasts emerged in the academic debates. Nevertheless, the research presented in this paper provides a strong foundation to further refine the methods to diagnose and improve levels of service innovation, as a critical element of enterprise growth in service-related industries.

Author Contributions

J.Z. and H.L. conducted the interviews, analyzed the data, and contributed to drafting the paper. J.Z. and H.L. contributed to the concept and design of the paper. H.X. and R.T. provided feedback for the manuscript and edited the paper. S.P., Q.D. and W.J. assembled the data. J.Z., H.X. and R.T. were in charge of its final version. All authors reviewed the subsequent drafts for the entire paper in all its versions.

Funding

This research was funded by the National Natural Science Foundation of China [No. 71301013]; Humanty and Social Science Program Foundation of the Ministry of Education of China [No. 17YJA790091]; Shaanxi Social Science Fund [No. 2017S004, No. 2017Z028, No. 2016ZB017, No. 2016Z047 and No. 2014HQ10]; Xi’an Social Science Fund [No. 18J139]; Xi’an Construction Science and Technology Planning Project [No. SJW201705]; Xi’an Science Technology Bureau Fund (No. 201805070RK1SF4 (6)); Shaanxi Province Higher Education Teaching Reform Project [No. 17BZ017]; Education Funding of Master of Engineering Management in China [No. 2017-ZX-004]; Shaanxi Province Civil Engineering “first-class professional” project [No. 300103282803 and No. 0012-310628170124]; Special Fund for Graduate Student Education Reform of Central College, Chang’an University [No. 300111002005, No. 300103187091 and No. 310628161406]; Fundamental Research for Education Reform of Central College, Chang’an University [No. 300104282301, No. 300104282318, No. 300104282323, No. 310623172904, No. 310623171003 and No. 310623171633]; Fundamental Research for Funds for the Central Universities (Humanities and Social Sciences), Chang’an University [No. 300102418659]; Fundamental Research for Funds for the Central Universities, Chang’an University [No. 300102238201].

Acknowledgments

The authors gratefully acknowledge valuable suggestions by the expert panel, and give special thanks to design and construction professionals who completed the survey. The authors also wish to acknowledge two anonymous reviewers for their valuable suggestions.

Conflicts of Interest

The authors declare no conflicts of interest.

Appendix A

Appendix A.1. Questionnaire

This questionnaire is divided into two parts: the first volume is background data; the second part is the investigation of the development levels of service innovation. All questions are multiple choice questions. Please select the best option and place a “√” in front of it.
Part One: Background Information
(1)
What is the project type that you are working on now?
(A). Public building; (B). Residential Building; (C). Industrial buildings
(2)
What is your educational level is?
(A). Below undergraduate; (B). Undergraduate degree; (C). Graduate level or above
(3)
What is your age group?
(A). 35 years and younger; (B). Older than 35 years
(4)
What is your position?
(A). General Staff; (B). Project Manager; (C). Department manager; (D) Director; (E) Vice president or above
Part Two: The development levels of service innovation drivers in building enterprises
In the following questions, the letters A, B, C, D, and E have the following meanings
A: Strongly Disagree; B: Somewhat Disagree; C: Not Sure; D: Agree; E: Strongly agree
1 Firms’ market environment for innovation
1.1 The Construction industry is in a very high degree of specialization.ABCDE
1.2 You have clear understanding of the key factors in the transformation of the construction industry.ABCDE
1.3 Foreign companies enter supply market through import and export trades or direct investments.ABCDE
1.4 Innovative products and services are plenty in public procurement.ABCDE
1.5 Enterprises have high market shares.ABCDE
1.6 Innovative knowledge or technology can be diffused through market transactions.ABCDE
2 Firms’ access to labor for innovation
2.1 Enterprise has some highly educated employees or high-tech employees.ABCDE
2.2 Enterprise has considered the immigration-related needs of employees (especially the nonnatives).ABCDE
2.3 Enterprise has relative small overhead to hire or dismiss employees.ABCDE
3 Firms’ capabilities and assets for innovation
3.1 Enterprise has plenty investments in R & D and other innovative activities.ABCDE
3.2 Enterprise has design and construction capabilities.ABCDE
3.3 Enterprise has the abilities to design and industrialize equipment machinery production.ABCDE
3.4 Enterprise has a good production capacity.ABCDE
3.5 Enterprise has a good commercialization capability.ABCDE
3.6 Enterprise can identify innovative capacity needs and absorb the related applications.ABCDE
3.7 Enterprise often organizes learning activities for innovation topics.ABCDE
3.8 Enterprise has a good innovation management department or system.ABCDE
4 Firms’ access to knowledge for innovation
4.1 Enterprise has an industrial chain of design, production, sales and distribution.ABCDE
4.2 Enterprise can access useful information and has effective information communication technology (ICT).ABCDE
4.3 Enterprise can use external ideas, internal ideas, market and internal and external paths to promote technology.ABCDE
4.4 Enterprise often collaborates with high education or public research institutes for innovation.ABCDE
4.5 Enterprise often collaborates with other companies to innovate.ABCDE
4.6 Enterprise is willing to pay for innovative machinery and equipment.ABCDE
4.7 Enterprise pays attention to consumer opinions and recommendations in innovation process.ABCDE
5 Firms’ access to finance for innovation
5.1 Enterprise can use retained profit earnings as a way of investment of service innovation.ABCDE
5.2 Enterprise can use debt financing as a way of investment in service innovation.ABCDE
5.3 Enterprise can finance through the stock market as a way of investment in service innovation.ABCDE
5.4 Enterprise can finance through other ways for investment in service innovation.ABCDE
6 Regulatory framework for innovation in firms
6.1 Enterprise can protect the intellectual property rights and innovative products of employees.ABCDE
6.2 Enterprise has the promotion and suppression policies of innovative products.ABCDE
6.3 Enterprise has standards and norms for innovative products.ABCDE
6.4 Enterprise can enforce contracts signed with individuals or other companies and solve related problems in accordance with the contract. ABCDE
6.5 Enterprise has environmental and safety-related requirements, standards and specifications.ABCDE
7 Policy intervention on innovation in firms
7.1 Government can provide direct financial support through the issuance of grants, loans, subsidies and venture capital and seed funds. ABCDE
7.2 Government has tax incentives to support innovation activities.ABCDE
7.3 Government has debt and risk sharing plans for innovation through subsidized loans or credit guarantees.ABCDE
7.4 Government provides technical extension services for SMEs.ABCDE
7.5 Government has public procurement programs to support innovators.ABCDE
7.6 Government has the plans of regional clusters of enterprises and research institutes, such as high-tech areas, to promote innovation and development.ABCDE
7.7 Government has funding for development collaborations among enterprises, research institutes and universities.ABCDE

Appendix A.2. ANOVA Analysis of Middle-Layer Indices and Fundamental Indicators

Table A1. Single Factor ANOVA Analysis of Middle-Layer Indices.
ANOVA
ClusterErrorFSig.
Mean SquaredfMean Squaredf
M12.63830.05558147.8240.000
M20.00730.0305810.2460.864
M3200.43630.265581757.6500.000
M41.31330.11358111.6360.000
M50.01030.0105811.0050.390
M6204.28030.356581573.0720.000
M73.04430.13958121.9140.000
Note: The F tests should be used only for descriptive purposes because the clusters have been chosen to maximize the differences among cases in different clusters. The observed significance levels are not corrected for this and thus cannot be interpreted as tests of the hypothesis that the cluster means are equal.
Table A2. Single Factor ANOVA Analysis of Fundamental Indices under M1.
ANOVA
ClusterErrorFSig.
Mean SquaredfMean Squaredf
1.11.88710.02058396.3120.000
1.22.13810.018583116.1480.000
1.30.43810.01858324.1330.000
1..40.60010.02058329.8590.000
1.53.58410.015583235.7730.000
1.65.65910.011583506.1630.000
Note: The F tests should be used only for descriptive purposes because the clusters have been chosen to maximize the differences among cases in different clusters. The observed significance levels are not corrected for this and thus cannot be interpreted as tests of the hypothesis that the cluster means are equal.
Table A3. Single Factor ANOVA Analysis of Fundamental Indices under M2.
ANOVA
ClusterErrorFSig.
Mean SquaredfMean Squaredf
2.116.26810.019583868.1320.000
2.24.93410.030583165.5120.000
2.33.28410.032583102.2350.000
Note: The F tests should be used only for descriptive purposes because the clusters have been chosen to maximize the differences among cases in different clusters. The observed significance levels are not corrected for this and thus cannot be interpreted as tests of the hypothesis that the cluster means are equal.
Table A4. Single Factor ANOVA Analysis of Fundamental Indices under M3.
ANOVA
ClusterErrorFSig.
Mean SquaredfMean Squaredf
3.10.26920.01658216.3460.000
3.20.21120.01258217.4310.000
3.39.72620.015582630.9240.000
3.414.59520.019582764.4510.000
3.51.66320.05558230.0190.000
3.60.37420.01658223.4160.000
3.70.55720.02958219.0950.000
3.80.36020.02158217.4190.000
Note: The F tests should be used only for descriptive purposes because the clusters have been chosen to maximize the differences among cases in different clusters. The observed significance levels are not corrected for this and thus cannot be interpreted as tests of the hypothesis that the cluster means are equal.
Table A5. Single Factor ANOVA Analysis of Fundamental Indices under M4.
ANOVA
ClusterErrorFSig.
Mean SquaredfMean Squaredf
4.20.55310.02358324.4680.000
4.32.24310.020583113.1370.000
4.49.12510.033583279.1420.000
4.55.85510.035583169.5650.000
4.62.28510.021583108.4570.000
4.72.84910.02958396.7840.000
Note: The F tests should be used only for descriptive purposes because the clusters have been chosen to maximize the differences among cases in different clusters. The observed significance levels are not corrected for this and thus cannot be interpreted as tests of the hypothesis that the cluster means are equal.
Table A6. Single Factor ANOVA Analysis of Fundamental Indices under M5.
ANOVA
ClusterErrorFSig.
Mean SquaredfMean Squaredf
5.15.29110.026583201.3230.000
5.21.97110.02958368.5220.000
5.38.62410.024583353.5440.000
5.44.16310.030583138.6330.000
Note: The F tests should be used only for descriptive purposes because the clusters have been chosen to maximize the differences among cases in different clusters. The observed significance levels are not corrected for this and thus cannot be interpreted as tests of the hypothesis that the cluster means are equal.
Table A7. Single Factor ANOVA Analysis of Fundamental Indices under M6.
ANOVA
ClusterErrorFSig.
Mean SquaredfMean Squaredf
6.14.20320.017582242.7350.000
6.22.86620.017582170.3330.000
6.31.48720.03458244.0480.000
6.44.19120.021582200.9970.000
6.54.76220.022582212.7650.000
Note: The F tests should be used only for descriptive purposes because the clusters have been chosen to maximize the differences among cases in different clusters. The observed significance levels are not corrected for this and thus cannot be interpreted as tests of the hypothesis that the cluster means are equal.
Table A8. Single Factor ANOVA Analysis of Fundamental Indices under M7.
ANOVA
ClusterErrorFSig.
Mean SquaredfMean Squaredf
7.12.15510.02558386.0570.000
7.234.79610.0125832807.8600.000
7.32.25410.03358368.3810.000
7.40.47310.02358320.9380.000
7.50.45510.01858325.7500.000
7.60.56010.02258326.0450.000
7.70.67010.01558344.8830.000
Note: The F tests should be used only for descriptive purposes because the clusters have been chosen to maximize the differences among cases in different clusters. The observed significance levels are not corrected for this and thus cannot be interpreted as tests of the hypothesis that the cluster means are equal.

References

  1. Luchs, M.; Swan, K.S. Perspective: The emergence of product design as a field of marketing inquiry. J. Prod. Innov. Manag. 2011, 28, 327–345. [Google Scholar] [CrossRef]
  2. Zhang, J.; Jiang, Y.; Shabbir, R.; Zhu, M. How brand orientation impacts b2b service brand equity? An empirical study among chinese firms. J. Bus. Ind. Mark. 2016, 31, 83–98. [Google Scholar] [CrossRef]
  3. Miller, D.; Friesen, P.H. Innovation in conservative and entrepreneurial firms: Two models of strategic momentum. Strat. Manag. J. 1982, 3, 1–25. [Google Scholar] [CrossRef]
  4. Veugelers, R.; Cassiman, B. Make and buy in innovation strategies: Evidence from belgian manufacturing firms. Res. Policy 1999, 28, 63–80. [Google Scholar] [CrossRef]
  5. Manley, K.; McFallan, S. Exploring the drivers of firm-level innovation in the construction industry. Constr. Manag. Econ. 2006, 24, 911–920. [Google Scholar] [CrossRef] [Green Version]
  6. Rose, T.M.; Manley, K. Adoption of innovative products on australian road infrastructure projects. Constr. Manag. Econ. 2012, 30, 277–298. [Google Scholar] [CrossRef] [Green Version]
  7. Barras, R. Interactive innovation in financial and business services—The vanguard of the service revolution. Res. Policy 1990, 19, 215–237. [Google Scholar] [CrossRef]
  8. Alsaleh, Y.; Mahroum, S. A critical review of the interplay between policy instruments and business models: Greening the built environment a case in point. J. Clean. Prod. 2015, 109, 260–270. [Google Scholar] [CrossRef]
  9. Keeley, L.; Pikkel, R.; Quinn, B.; Walters, H. Ten Types of Innovation: The Discipline of Building Breakthroughs; John Wiley & Sons Inc.: Hoboken, NJ, USA, 2013; p. 257. [Google Scholar]
  10. Girardone, C. Innovation systems in the service economy: Measurement and case study analysis. Serv. Ind. J. 2002, 22, 180–182. [Google Scholar]
  11. Miles, I. Patterns of innovation in service industries. IBM Syst. J. 2008, 47, 115–128. [Google Scholar] [CrossRef]
  12. Gourville, J.T. Eager sellers and stony buyers: Understanding the psychology of new product adoption. Harvard Bus. Rev. 2006, 84, 98–106. [Google Scholar]
  13. Heidenreich, S.; Kraemer, T. Innovations—Doomed to fail? Investigating strategies to overcome passive innovation resistance. J. Prod. Innov. Manag. 2016, 33, 277–297. [Google Scholar] [CrossRef]
  14. Barczak, G.; Griffin, A.; Kahn, K.B. Perspective: Trends and drivers of success in npd practices: Results of the 2003 pdma best practices study. J. Prod. Innov. Manag. 2009, 26, 3–23. [Google Scholar] [CrossRef]
  15. Luchs, M.G.; Swan, K.S.; Creusen, M.E.H. Perspective: A review of marketing research on product design with directions for future research. J. Prod. Innov. Manag. 2016, 33, 320–341. [Google Scholar] [CrossRef]
  16. Kornish, L.J.; Ulrich, K.T. The importance of the raw idea in innovation: Testing the sow’s ear hypothesis. J. Mark. Res. 2014, 51, 14–26. [Google Scholar] [CrossRef]
  17. Dovgan, L.; Mokhonko, G. Strategic stability within the system of enterprise strategic management. Actual Probl. Econ. 2010, 115–122. [Google Scholar]
  18. Biemans, W.G.; Griffin, A.; Moenaert, R.K. Perspective: New service development: How the field developed, its current status and recommendations for moving the field forward. J. Prod. Innov. Manag. 2016, 33, 382–397. [Google Scholar] [CrossRef]
  19. Lusch, R.F.; Vargo, S.L.; Tanniru, M. Service, value networks and learning. J. Acad. Mark. Sci. 2010, 38, 19–31. [Google Scholar] [CrossRef]
  20. Vargo, S.L.; Lusch, R.F. Institutions and axioms: An extension and update of service-dominant logic. J. Acad. Mark. Sci. 2016, 44, 5–23. [Google Scholar] [CrossRef]
  21. Ordanini, A.; Parasuraman, A. Service innovation viewed through a service-dominant logic lens: A conceptual framework and empirical analysis. J. Serv. Res. 2011, 14, 3–23. [Google Scholar] [CrossRef]
  22. De Valence, G.; Ebooks Corporation. Modern Construction Economics; SPON Press: New York, NY, USA, 2011. [Google Scholar]
  23. Bygballe, L.E.; Ingemansson, M. The logic of innovation in construction. Ind. Mark. Manag. 2014, 43, 512–524. [Google Scholar] [CrossRef] [Green Version]
  24. Rubik, F.; Scholl, G. Integrated product policy (ipp) in europe—A development model and some impressions. J. Clean. Prod. 2002, 10, 507–515. [Google Scholar] [CrossRef]
  25. Zhao, X.-N.; Liu, B.-D.; Xu, H.-M. A study on the impact of the thought of conforming to the natural rule on the progress of human society. Sci. Technol. Dialectics 2006, 23, 32–35. [Google Scholar]
  26. Zhao, X.-N.; Zhang, L.-L.; Wang, F. Group identification on characteristics confirming to the natural rule of branch companies’ general managers in state-owned enterprises and management countermeasures. Manag. Rev. 2010, 22, 107–129. [Google Scholar]
  27. Zhao, X.-N.; Zhang, L.-L.; Wang, F. Research on method and application match better conforming of group behavior recognition to the natural rule. Oper. Res. Manag. Sci. 2010, 19, 84–91. [Google Scholar]
  28. Cui, X.-R. Research on Assessment Method of Enterprise Growth Basedon Concept of Conforming to Natural Rule; Northeastern University: Shenyang, China, 2011. [Google Scholar]
  29. Cai, L.; Yu, X.; Liu, Q.; Nguyen, B. Radical innovation, market orientation, and risk-taking in chinese new ventures: An exploratory study. Int. J. Technol. Manag. 2015, 67, 47–76. [Google Scholar] [CrossRef]
  30. Cai, L.; Liu, Q.; Zhu, X.; Deng, S. Market orientation and technological innovation: The moderating role of entrepreneurial support policies. Int. Entrep. Manag. J. 2015, 11, 645–671. [Google Scholar] [CrossRef]
  31. de Brentani, U. Innovative versus incremental new business services: Different keys for achieving success. J. Prod. Innov. Manag. 2001, 18, 169–187. [Google Scholar] [CrossRef]
  32. Blazevic, V.; Lievens, A. Managing innovation through customer coproduced knowledge in electronic services: An exploratory study. J. Acad. Mark. Sci. 2008, 36, 138–151. [Google Scholar] [CrossRef] [Green Version]
  33. Ettlie, J.E.; Rosenthal, S.R. Service versus manufacturing innovation. J. Prod. Innov. Manag. 2011, 28, 285–299. [Google Scholar] [CrossRef]
  34. Drache, D.; Jacobs, L.A. Linking Global Trade and Human Rights: New Policy Space in Hard Economic Times; Cambridge University Press: New York, NY, USA, 2014. [Google Scholar]
  35. Atkinson, R.D.; Nager, A. The 2014 State New Economy Index; Social Science Electronic Publishing: New York, NY, USA, June 2014. [Google Scholar]
  36. Adam, F. Measuring National Innovation Performance: The Innovation Union Scoreboard Revisited/by Frane Adam; Springer: Berlin, Germany, 2013. [Google Scholar]
  37. Gobble, M.M. The 2009 european innovation scoreboard: Eu lags us & japan while china closing gap with eu. Res. Technol. Manag. 2010, 53, 2–4. [Google Scholar]
  38. Midgley, D.; Ebooks Corporation. The Innovation Manual Integrated Strategies and Practical Tools for Bringing Value Innovation to the Market; John Wiley & Sons: Chichester, UK; Hoboken, NJ, USA, 2009. [Google Scholar]
  39. Corsi, P.; Neau, E.; Labonne, E.; Frisk, A.; Norman, J.; Andersson, M.; Dulieu, M. Innovation Capability Maturity Model; ISTE Wiley: London, UK, 2015. [Google Scholar]
  40. Konstadakopulos, D. Learning for Innovation in the Global Knowledge Economy: A European and South-East Asian Perspective; Intellect Books: Bristol, UK; Portland, OR, USA, 2004. [Google Scholar]
  41. Wang, Y.; Ye, Y. China National Innovation Index Report 2013; Chinese Academy of Science and Technology for Development, Ministry of Science and Technology of the People’s Republic of China: Beijing, China, 2013; pp. 1–82.
  42. Jo, Y.; Lee, C.-Y. Technological capability, agglomeration economies and firm location choice. Reg. Stud. 2014, 48, 1337–1352. [Google Scholar] [CrossRef]
  43. Kiskiene, A. Scientific knowledge and technology transfer policy in the eu. Econ. Bus. 2014, 26, 36–43. [Google Scholar] [CrossRef]
  44. Ruwanpura, J.; Mohamed, Y.; Lee, S.; Construction Institute; American Society of Civil Engineers. Construction research congress 2010 innovation for reshaping construction practice. In Proceedings of the 2010 Construction Research Congress, Banff, AB, Canada, 8–10 May 2010; American Society of Civil Engineers: Reston, VA, USA, 2010. [Google Scholar]
  45. Bathelt, H.; Malmberg, A.; Maskell, P. Clusters and knowledge: Local buzz, global pipelines and the process of knowledge creation. Prog. Hum. Geogr. 2004, 28, 31–56. [Google Scholar] [CrossRef]
  46. Pavitt, K.; Walker, W. Government policies towards industrial innovation: A review. Res. Policy 1976, 5, 11–97. [Google Scholar] [CrossRef]
  47. Jaffe, A.B.; Newell, R.G.; Stavins, R.N. A tale of two market failures: Technology and environmental policy. Ecol. Econ. 2005, 54, 164–174. [Google Scholar] [CrossRef] [Green Version]
  48. Dovey, K.; McCabe, B. The politics of innovation: Realising the value of intrapreneurs. Int. J. Learn. Intellect. Cap. 2014, 11, 185–201. [Google Scholar] [CrossRef]
  49. Eurich, M.; Weiblen, T.; Breitenmoser, P. A six-step approach to business model innovation. Int. J. Entrep. Innov. Manag. 2014, 18, 330–348. [Google Scholar] [CrossRef]
  50. Cadwallader, S.; Jarvis, C.B.; Bitner, M.J.; Ostrom, A.L. Frontline employee motivation to participate in service innovation implementation. J. Acad. Mark. Sci. 2010, 38, 219–239. [Google Scholar] [CrossRef]
  51. Qian, H. Talent, creativity and regional economic performance: The case of china. Ann. Reg. Sci. 2010, 45, 133–156. [Google Scholar] [CrossRef]
  52. Boss, R.W.; Dunford, B.B.; Boss, A.D.; McConkie, M.L. Sustainable change in the public sector: The longitudinal benefits of organization development. J. Appl. Behav. Sci. 2010, 46, 436–472. [Google Scholar] [CrossRef]
  53. Pedersen, P.J.; Pytlikova, M.; Smith, N. Selection and network effects—Migration flows into oecd countries 1990–2000. Eur. Econ. Rev. 2008, 52, 1160–1186. [Google Scholar] [CrossRef]
  54. Dumont, J.-C.; Lamaitre, G. Counting Immigrants and Expatriates in Oecd Countries. [Electronic Resource]: A New Perspective; OECD Publishing: Paris, France, 2006. [Google Scholar]
  55. França, C.L.; Broman, G.; Robèrt, K.-H.; Basile, G.; Trygg, L. An approach to business model innovation and design for strategic sustainable development. J. Clean. Prod. 2016. [Google Scholar] [CrossRef]
  56. Reim, W.; Parida, V.; Örtqvist, D. Product–service systems (pss) business models and tactics—A systematic literature review. J. Clean. Prod. 2015, 97, 61–75. [Google Scholar] [CrossRef]
  57. Gelbmann, U.; Hammerl, B. Integrative re-use systems as innovative business models for devising sustainable product–service-systems. J. Clean. Prod. 2015, 97, 50–60. [Google Scholar] [CrossRef]
  58. Castro-Lacouture, D.; Irizarry, J.; Ashuri, B.; American Society of Civil Engineers; Construction Institute. Construction research congress 2014 construction in a global network. In Proceedings of the 2014 Construction Research Congress, Atlanta, GA, USA, 19–21 May 2014; American Society of Civil Engineers: Reston, VA, USA, 2014. [Google Scholar]
  59. Akintoye, A.; Goulding, J.; Zawdie, G. Construction Innovation and Process Improvement; Wiley-Blackwell: Chichester, UK, 2012. [Google Scholar]
  60. Suarez-Varela, M.; Garcia-Valinas, M.D.; Gonzalez-Gomez, F.; Picazo-Tadeo, A.J. Ownership and performance in water services revisited: Does private management really outperform public? Water Resour. Manag. 2017, 31, 2355–2373. [Google Scholar] [CrossRef]
  61. Weigel, T.; Goffin, K. Creating innovation capabilities. Res. Technol. Manag. 2015, 58, 28–35. [Google Scholar] [CrossRef]
  62. Wilden, R.; Gudergan, S. The impact of dynamic capabilities on operational marketing and technological capabilities: Investigating the role of environmental turbulence. J. Acad. Mark. Sci. 2015, 43, 181–199. [Google Scholar] [CrossRef]
  63. Enkel, E.; Gassmann, O.; Chesbrough, H. Open r&d and open innovation: Exploring the phenomenon. R D Manag. 2009, 39, 311–316. [Google Scholar]
  64. Roth, G.; DiBella, A.J. Systemic Change Management: The Five Capabilities for Improving Enterprises, 1st ed.; Palgrave Macmillan: New York, NY, USA, 2015. [Google Scholar]
  65. Tomšič, N.; Bojnec, Š.; Simčič, B. Corporate sustainability and economic performance in small and medium sized enterprises. J. Clean. Prod. 2015, 108, 603–612. [Google Scholar] [CrossRef]
  66. Mao, Z.; Wang, G.; Li, X. Research on collaborative innovation system of automobile manufacturing supply-demand network. In Proceedings of the 2009 International Conference on Management and Service Science, Wuhan, China, 20–22 September 2009; pp. 1689–1693. [Google Scholar]
  67. Sroka, W.; JabŁOŃSki, A.; JabŁOŃSki, M. Cooperative business models in steel enterprises in poland. Metalurgija 2013, 52, 565–568. [Google Scholar]
  68. Aranha, E.A.; Garcia, N.A.P.; Corrêa, G. Open innovation and business model: A brazilian company case study. J. Technol. Manag. Innov. 2015, 10, 91–98. [Google Scholar] [CrossRef]
  69. Akkucuk, U. Handbook of Research on Developing Sustainable Value in Economics, Finance, and Marketing; IGI Global: Hershey, PA, USA, 2015. [Google Scholar]
  70. Guan, J.C.; Mok, C.K.; Yam, R.C.M.; Chin, K.S.; Pun, K.F. Technology transfer and innovation performance: Evidence from chinese firms. Technol. Forecast. Soc. Chang. 2006, 73, 666–678. [Google Scholar] [CrossRef]
  71. Kueh, Y.Y.; Chai, C.H.; Fan, G. Industrial Reform and Macroeconomic Instability in China; Oxford University Press: Oxford, UK, 1999. [Google Scholar]
  72. Branco, M.; Xiong, Y.; Czarnecki, K.; Küster, J.; Völzer, H. A case study on consistency management of business and it process models in banking. Softw. Syst. Model. 2014, 13, 913–940. [Google Scholar] [CrossRef]
  73. Kletzer, K.M. Sovereign Bond Restructuring: Collective Action Clauses and Official Crisis Intervention; Imf Working Papers: Washington, DC, USA, 2003. [Google Scholar]
  74. Tidd, J.; Bessant, J.R.; Pavitt, K. Managing Innovation: Integrating Technological, Market and Organizational Change; Wiley: Chichester, UK, 2005. [Google Scholar]
  75. Lee, C.-H.; Hwang, S.-Y.; Yen, I.L.; Yu, T.-K. A service pattern model for service composition with flexible functionality. Inf. Syst. E-Bus. Manag. 2015, 13, 235–265. [Google Scholar] [CrossRef]
  76. Xie, R.-H.; Yuan, Y.-J.; Huang, J.-J. Different types of environmental regulations and heterogeneous influence on “green” productivity: Evidence from china. Ecol. Econ. 2017, 132, 104–112. [Google Scholar] [CrossRef]
  77. Gillis, P.; Ebooks Corporation. The big four and the development of the accounting profession in china. In Studies in the Development of Accounting Thought v 16, 1st ed.; Emerald Group Publishing Limited: Bingley, UK, 2014. [Google Scholar]
  78. Jaumotte, F.; Pain, N. From innovation development to implementation evidence from the community innovation survey. In OECD Economics Department Working Papers; OECD Publishing: Paris, France, 2005. [Google Scholar]
  79. Ahn, S. Competition, innovation and productivity growth a review of theory and evidence. In OECD Economics Department Working Papers; OECD Publishing: Paris, France, 2002. [Google Scholar]
  80. Day, G.S. Closing the marketing capabilities gap. J. Mark. 2011, 75, 183–195. [Google Scholar] [CrossRef]
  81. Kozioł, L.; Kozioł, W.; Wojtowicz, A.; Pyrek, R. Diagnosis of innovation enterprises—Study theoretical and empirical results. Procedia Soc. Behav. Sci. 2015, 175, 137–145. [Google Scholar] [CrossRef]
  82. Organisation for Economic Co-Operation and Development. Environmental policy, technological innovation and patents. In OECD Studies on Environmental Innovation; OECD Publishing: Paris, France, 2008. [Google Scholar]
  83. Killip, G. Products, practices and processes: Exploring the innovation potential for low-carbon housing refurbishment among small and medium-sized enterprises (smes) in the uk construction industry. Energy Policy 2013, 62, 522–530. [Google Scholar] [CrossRef]
  84. Biegelbauer, P.; Borras, S. Innovation Policies in Europe and the Us: The New Agenda; Ashgate: Burlington, VT, USA, 2003. [Google Scholar]
  85. Cox, D.; Rigby, J. Innovation Policy Challenges for the 21st Century; Routledge: New York, NY, USA, 2013. [Google Scholar]
  86. Organisation for Economic Co-Operation and Development. Better policies to support eco-innovation. In OECD Studies on Environmental Innovation; OECD Publishing: Paris, France, 2011. [Google Scholar]
  87. Warwick, K. Beyond Industrial Policy: Emerging Issues and New Trends; OECD: Paris, France, 2013; p. 57. [Google Scholar]
  88. Shapiro, C. Competition policy and innovation. In OECD Science, Technology and Industry Working Papers; OECD Publishing: Paris, France, 2002. [Google Scholar]
  89. Blayse, A.M.; Manley, K. Key influences on construction innovation. Constr. Innov. 2004, 4, 143–154. [Google Scholar] [CrossRef] [Green Version]
  90. Cook, C.; Sirkkunen, E. What’s in a niche? Exploring the business model of online journalism. J. Media Bus. Stud. 2013, 10, 63–82. [Google Scholar] [CrossRef]
  91. Loader, K. Sme suppliers and the challenge of public procurement: Evidence revealed by a UK government online feedback facility. J. Purch. Supply Manag. 2015, 21, 103–112. [Google Scholar] [CrossRef]
  92. Webster, R.L.; Hammond, K.L. Using a market orientation model in measuring business school performance: Marketing department chair responses. Int. J. Bus. Mark. Decis. Sci. 2012, 5, 67–79. [Google Scholar]
  93. Aragon, C.; Aranguren, M.J.; Diez, M.-A.; Iturrioz, C.; Wilson, J.R. Participatory evaluation: A useful tool for contextualising cluster policy? Policy Stud. 2014, 35, 1–21. [Google Scholar] [CrossRef]
  94. Bruijn, T.J.N.M.D.; Norberg-Bohm, V. Industrial Transformation: Environmental Policy Innovation in the United States and Europe; MIT Press: Cambridge, MA, USA, 2005. [Google Scholar]
  95. Morledge, R.; Knight, A.; Grada, M. The Concept and Development of Supply Chain Management in the UK Constructi on Industry; John Wiley & Sons, Ltd., Publication: London, UK, 2009; p. 42. [Google Scholar]
  96. Kulatunga, U.; Amaratunga, R.; Haigh, R. Construction Innovation: A Literature Review on Current Research; Univ. of Salford: Salford, UK, 2006; pp. 654–662. [Google Scholar]
  97. McIntyre, C. A Framework for Understanding IAB Output and IAB Management. Available online: http://www.acce-hq.org/images/uploads/IAB_Growth_Management_Model_Version_3.pdf (accessed on 17 September 2017).
  98. Zhao, X.-N.; Wang, Q.; Zhu, C.-H. An objective individuality identification method on objective limited. Syst. Eng. Theory Methodol. Appl. 2006, 15, 459–474. [Google Scholar]
  99. Dyer, J.H.; Singh, H. The Relational View: Cooperative Strategy and Sources of Interorganizational Competitive Advantage. Acad. Manag. Rev. 1998, 23, 660–679. [Google Scholar] [CrossRef]
  100. Zhao, X.-N.; Zhu, C.-H. The Theory Method and Application of Conforming to Natural Rule; China Science Publishing: Beijing, China, 2012; p. 475. [Google Scholar]
  101. Zhao, X.-N.; Wen, X.; Wang, Y.-M. Evaluation method and application on regional innovation capability: Based on the analysis of individual advantage characteristic. Stud. Sci. Sci. 2009, 27, 473–480. [Google Scholar]
  102. Zhao, X.-N.; Wen, X.; Jia, J.-F. Research on the measuring models of person—Post matching and its application in organizations. Ind. Eng. Manag. 2008, 13, 112–117. [Google Scholar]
  103. Vaidyanathan, K.; Howell, G. Construction supply chain maturitymodel—Conceptual framework. In Proceedings of the International Group for Lean Construction (IGLC-15), East Lansing, MI, USA, 18–20 July 2007; pp. 170–180. [Google Scholar]
  104. Zhang, J.; Schmidt, K.; Li, H. Bim and sustainability education: Incorporating instructional needs into curriculum planning in cem programs accredited by acce. Sustainability 2016, 8, 525. [Google Scholar] [CrossRef]
  105. Zhang, J.; Schmidt, K.; Li, H. An integrated diagnostic framework to manage organization sustainable growth: An empirical case. Sustainability 2016, 8, 301. [Google Scholar] [CrossRef]
  106. Zhang, J.; Xie, H.; Schmidt, K.; Li, H. A new systematic approach to vulnerability assessment of innovation capability of construction enterprises. Sustainability 2016, 8, 17. [Google Scholar] [CrossRef]
  107. Deshpande, R. Developing a Market Orientation; Sage Publications: Thousand Oaks, CA, USA, 1999. [Google Scholar]
  108. Shu-Ching, C.; Quester, P.G. Developing a value-based measure of market orientation in an interactive service relationship. J. Mark. Manag. 2005, 21, 779–808. [Google Scholar]
  109. Davis, C. Spss Step by Step: Essentials for Social and Political Science/Cole Davis; Policy Press: Bristol, UK, 2013. [Google Scholar]
  110. Gassmann, O. Opening up the innovation process: Towards an agenda. R D Manag. 2006, 36, 223–228. [Google Scholar] [CrossRef]
  111. Zhang, J.; Xie, H.; Li, H. Competency-Based Knowledge Integration of BIM Capstone in Construction Engineering and Management Education. Int. J. Eng. Educ. 2017, 33, 2020–2032. [Google Scholar]
  112. Liu, W.; Xie, H.; Johnson, C. Influencing Factors and Effects on Comprehension of E-Reading. In Proceedings of the 2017 IEEE 2nd Information Technology, Networking, Electronic and Automation Control Conference (ITNEC), Chengdu, China, 15–17 December 2017; p. 1892. [Google Scholar]
  113. Xie, H.; Shim, Y.; Schmidt, K. Integrated Project Delivery and Team Work Design in Building Information Modeling Education. In Proceedings of the 11th BIM Academic Symposium & Job Task Analysis Review, Boston, MA, USA, 3–4 April 2017; p. 2351. [Google Scholar]
  114. Akmam Syed Zakaria, S.; Gajendran, T.; Rose, T.; Brewer, G. Contextual, structural and behavioural factors influencing the adoption of industrialised building systems: A review. Arch. Eng. Des. Manag. 2018, 14, 3–26. [Google Scholar] [CrossRef]
  115. Årdal, C.; Røttingen, J.-A. An open source business model for malaria. PLoS ONE 2015, 10, 1–15. [Google Scholar] [CrossRef] [PubMed] [Green Version]
  116. Pavitt, K. What we know about the strategic management of technology. Calif. Manag. Rev. 1990, 32, 17–26. [Google Scholar] [CrossRef]
Figure 1. Research framework and steps.
Sustainability 10 03319 g001
Table 1. Innovation Policy Platform (IPP) Indicators.
IDService Innovation Indicators
M1Firms’ market environment for innovation
M2Firms’ access to labor for innovation
M3Firms’ capabilities and assets for innovation
M4Firms’ access to knowledge for innovation
M5Firms’ access to finance for innovation
M6Regulatory framework for innovation in firms
M7Policy intervention on innovation in firms
Table 2. List of Innovation Evaluation Systems.
Innovation Evaluation SystemPublication Country or Org.YearMain Evaluation IndicatorsIndicator Related to IPPSource
NICIPorter and Stem1999Public innovation infrastructure, innovation environment of specific enterprise groups, quality of connection, other evaluation itemsM2, M3, M1, M4National Innovative Capability Index(NICI) [34]
NEIThe U.S.1999Knowledge Jobs, Globalization, Economic Dynamism, The Digital Economy, Innovation CapacityM4, M1, M3State New Economy Index (NEI) [35]
EISEU2000Innovation driving, knowledge creation, enterprise innovation, technology application, intellectual property rightsM4, M3, M1, M5, M7, M6European Innovation Scoreboard (EIS) [36,37]
BNCIUK2000Enterprise environment, resources, innovation process, achievementM1, M2, M3, M7UK National Competitiveness Index(BNCI) [36]
STIOECD2002Impact of knowledge of economic development; Impact of knowledge of economic globalization and internationalization of science and technology; and Impact of knowledge of economic growth and international competitivenessM1, M3, M2, M4, M5The Science and Technology Industry (STI) scoreboard sheet of Organization for Economic Cooperation and Development(OECD) [36]
ICIWorld Economic Forum (WEF)2003Institutional environment, human capital and social participation, regulatory and legal framework, R&D situation, the application of information communication technologyM7, M1, M2, M6, M3, M4Innovation Capacity Index (ICI) [38,39]
KSIAPEC2003Enterprise environment, information and communication technology (ICT) infrastructure construction, human resources development, innovation systemM1, M4, M3, M2Knowledge Economy State Index (KSI) of Asia-Pacific Economic Cooperation (APEC) [40]
EISSICMSTC2013Environment of scientific and technological progresses, input of science and technology activities, output of scientific and technological activities, industrialization of high and new technologies, economic developmentM1, M2, M3, M4Evaluation Index System of Science and Technology in China(EISSIC)by Ministry of Science and Technology of the People’s Republic of China (MSTC) [41]
CIIDSS-NBS2014Innovation environment, innovation input, innovation output and innovation performanceM1, M3, M4Chinese Innovation Index (CII)by Department of Social Science of National Bureau of Statistics (DSS-NBS) [41]
Table 3. Service Innovation Indicators for the Construction Industry (adapted from IPP).
1st Level2nd Level Indicators3rd Level ItemsRelated Literature
Service innovation indicators for construction industryM11.1 Industrial specialization[42,43]
1.2 Technological trajectories[44]
1.3 Access to foreign and domestic markets[40,45]
1.4 Public procurement for innovation[46,47]
1.5 State of competition[48]
1.6 Markets for technology[49]
M22.1 Skilled labor[50,51]
2.2 Migration[52]
2.3 Costs of hiring and firing[53,54]
M33.1 R&D and other investments in innovation[55,56]
3.2 Engineering & design capabilities[57]
3.3 Prototyping and industrial scale-up[58,59]
3.4 Production capabilities[60]
3.5 Commercialization capabilities[61]
3.6 Absorptive capacities[55,56]
3.7 Organizational learning capabilities of firms[62]
3.8 Innovation management in firms[55,56]
M44.1 Supply chains[63]
4.2 ICT access[64]
4.3 Open innovation[63,65]
4.4 Interface with universities and public research institutes[66]
4.5 Technological co-operation between firms[63,67]
4.6 Acquisition of machinery[64]
4.7 Consumers[63,68]
M55.1 Retained earnings and profits[69,70]
5.2 Debt financing[71]
5.3 Stock market financing[72]
5.4 Other types of finance[73,74]
M66.1 Intellectual property rights and innovation in firms[75]
6.2 Product market regulation[76,77,78,79]
6.3 Standards and certification[80,81]
6.4 Contract enforcement[82]
6.5 Environmental and safety regulations[83]
M77.1 Direct funding of firms’ R&D[84,85,86,87,88]
7.2 Fiscal measures[84,85]
7.3 Debt and risk sharing schemes[86,87,88]
7.4 Technology extension services[89,90]
7.5 Innovation procurement schemes[91,92]
7.6 Cluster policies[86,87,88,93]
7.7 Grants for collaborative R&D[94]
Table 4. Applications of Competitive Advantage Analysis method.
YearAuthorApplicationsResearch Method
2010Zhao et al. [26]Analysis of the competitive advantages of general managers of state-owned enterprisesAccording to the system for hierarchical description, the evaluation model of ideal solutions and cluster analysis method, the opinions of the research group were analyzed and extracted. The group-identification method was constructed for the characteristics and the level of competitive advantages.
2010Zhao et al. [27]Evaluation of the competence and performance of general managers of large state-owned enterprises, and the competency recognition of technical personnel in Nonferrous Metallurgy Design InstituteUsing the characteristics of competitive advantages as the breakthrough point, the paper built a group identification method of competitive advantages based on the recognition of quantitative behavioral characteristics. The study built the personnel classification method based on competitive characteristics and the position selection method based on competitive characteristics.
2011Cui [28]Performance evaluation of Electric power industry listed companyConstructs the most pessimistic econometric model of the enterprise growth. Obtained the weight structure of competitive advantage and growth potential. Mined the behaviors of the main body on the growth potential of competitive advantages. Provided support for the development of enterprises with improved directions and specific decision-making basis. At the same time, the introduction of the indicators of optimism and pessimism helped to achieve the effective comparison of different corporate growths.
2012Zhao and Zhu [100]Performance evaluation of industryBased on the qualitative and quantitative methods, built a set of characteristic analysis systems to study the market competitiveness of
2014Zhao et al. [101]The method was used to the regional innovation capability evaluation of 31 provinces of China.By analyzing the existing evaluation methodsused to evaluate the regional innovation capability, the paper adopts a new democratic evaluation method based on the analysis of individual advantage characteristic.
Table 5. Option Assignment Table.
OptionA. Strongly DisagreeB. Somewhat DisagreeC. NeutralD. Somewhat AgreeE. Strongly Agree
Points Assigned12345
LevelIIIIIIIV
Scope n   × [ 1 , 2 ) n   × [ 2 , 3 ) n   × [ 3 , 4 ) n   × [ 4 , 5 ]
DevelopmentAd-hocDefinedManagedControlled
Table 6. Survey Summary.
Investigation Time in 2017LocationDistributedResponseValidResponse Rate %Valid Rate %
April 2017ShanghaiN = 320N = 259N = 19080.973.4
May 2017BeijingN = 316N = 273N = 21386.478.0
May 2017Xi’anN = 300N = 243N = 18281.074.9
Table 7. Sample Attributes.
Sample AttributesTypePercentages (%)
Project TypePublic buildings26.6
Residential building32.7
Industrial buildings40.7
Education LevelBelow undergraduate27.5
Undergraduate49.2
Graduate or above23.3
Age Group35 years and younger65.8
Over 35 years of age34.2
PositionOrdinary Employees84.1
Project Manager8.9
Division Manager4.3
Chief inspector2.1
Vice president and above0.6
Table 8. Reliability Test and Analysis.
IndicatorsItemCronbach’s αCronbach’s α if Item DeletedItem to Total CorrelationDeleted
M11.1 Industrial specialization0.8920.8660.767
1.2 Technological trajectories0.8660.765
1.3 Access to foreign and domestic markets0.8620.793
1.4 Public procurement for innovation0.8620.784
1.5 State of competition0.8870.618
1.6 Markets for technology0.8900.593
M22.1 Skilled labor0.8460.8370.658
2.2 Migration0.7690.730
2.3 Costs of hiring and firing0.7440.756
M33.1 R&D and other investments in innovation0.8860.8610.793
3.2 Engineering & design capabilities0.8620.790
3.3 Prototyping and industrial scale-up0.8850.524
3.4 Production capabilities0.8930.432
3.5 Commercialization capabilities0.8900.473
3.6 Absorptive capacities0.8590.776
3.7 Organizational learning capabilities of firms0.8610.761
3.8 Innovation management in firms0.8600.773
M44.1 Supply chains0.8250.8520.300Deleted
4.2 ICT access0.7810.718
4.3 Open innovation0.7880.659
4.4 Interface with universities and public research institutes0.8010.574
4.5 Technological co-operation between firms0.8040.557
4.6 Acquisition of machinery0.7870.664
4.7 Consumers0.7950.618
M55.1 Retained earnings and profits0.8460.8210.645
5.2 Debt financing0.7900.717
5.3 Stock market financing0.7960.703
5.4 Other types of finance0.8080.674
M66.1 Intellectual property rights and innovation in firms0.8940.8470.844
6.2 Product market regulation0.9200.473
6.3 Standards and certification0.8450.848
6.4 Contract enforcement0.8520.820
6.5 Environmental and safety regulations0.8720.752
M77.1 Direct funding of firms’ R&D0.8670.8550.585
7.2 Fiscal measures0.8620.564
7.3 Debt and risk sharing schemes0.8560.576
7.4 Technology extension services0.8430.676
7.5 Innovation procurement schemes0.8400.696
7.6 Cluster policies0.8430.674
7.7 Grants for collaborative R&D0.8350.749
Table 9. Updated Average Classification and details of sample grading.
LevelLevel 1Level 2Level 3Level 4
Total Grade[37, 74][75, 116][117, 155][156, 195]
Level of Driving ForceAd hocDefinedManagedControlled
Quantity753379380
Percentage12.82157.60715.89713.675
Table 10. Entropy weight.
Index1.11.21.31.41.51.62.12.22.33.13.23.33.4
Entropy weight0.0460.0450.0240.0250.0170.0170.0180.0210.0230.0240.0220.0290.028
Index3.53.63.73.84.24.34.44.54.64.75.15.25.3
Entropy weight0.0300.0450.0460.0460.0190.0200.0300.0290.0210.0190.0150.0230.024
Index5.46.16.26.36.46.57.17.27.37.47.57.67.7
Entropy weight0.0180.0310.0160.0290.0280.0190.0180.0310.0190.0220.0230.0230.017
Table 11. Details of sample classification based on entropy weight method.
LevelLevel 1Level 2Level 3Level 4
Quantity683498385
Percentage11.62459.65814.18814.530
Table 12. Middle layer clustering results (weights).
IndicatorsCluster
1234
M1−1.0600.0930.0060.010
M2−0.0020.0470.0030.005
M3−1.1330.205−19.0927.591
M4−0.6610.1460.0000.023
M5−0.0030.0550.0050.008
M62.4800.31120.052−6.670
M71.3780.1430.0260.033
Number of respondents657414
Table 13. Clustering Results of the characteristics of competitive advantages.
SSItemCluster Weights
M1M1 Average Weight = 1/6 = 0.1671L*2L*
0.167-0.167-
1.1 Industrial specialization0.195M0.081D
1.2 Technological trajectories0.195M0.074D
1.3 Access to foreign and domestic markets0.177M0.123D
1.4 Public procurement for innovation0.195M0.131D
1.5 State of competition0.131D0.288M
1.6 Markets for technology0.107D0.304M
Number of people273312
Total number of people585
M2M2 Average Weight = 1/3 = 0.3331L*2L*
0.333-0.333-
2.1 Skilled labor0.557M0.215D
2.2 Migration0.215D0.403M
2.3 Costs of hiring and firing0.228D0.382M
Number of people358227
Total number of people585
M3M3 Average Weight = 1/8 = 0.1251L*2L*3L*
0.125-0.125-0.125-
3.1 R&D and other investments in innovation0.114D0.049D0.048D
3.2 Engineering & design capabilities0.103D0.039D0.053D
3.3 Prototyping and industrial scale-up0.096D0.572M0.035D
3.4 Production capabilities0.105D0.118D0.735M
3.5 Commercialization capabilities0.231M0.095D0.046D
3.6 Absorptive capacities0.106D0.037D0.022D
3.7 Organizational learning capabilities of firms0.129M0.043D0.028D
3.8 Innovation management in firms0.116D0.048D0.033D
Number of people40197
Total number of people585
M4M4 Average Weight = 1/6 = 0.1671L*2L*
0.167-0.167-
4.2 ICT access0.139D0.041D
4.3 Open innovation0.197M0.000D
4.4 Interface with universities and public research institutes0.121D0.518M
4.5 Technological co-operation between firms0.123D0.441M
4.6 Acquisition of machinery0.199M0.000D
4.7 Consumers0.222M0.000D
Number of people52065
Total number of people585
M5M5 Average Weight = 1/4 = 0.2501L*2L*
0.250-0.250-
5.1 Retained earnings and profits0.130D0.347M
5.2 Debt financing0.297M0.165D
5.3 Stock market financing0.427M0.150D
5.4 Other types of finance0.145D0.338M
Number of people152433
Total number of people585
M6M6 Average Weight = 1/5 = 0.2001L*2L*3L*
0.200-0.200-0.200-
6.1 Intellectual property rights and innovation in firms0.306M0.127D0.513M
6.2 Product market regulation0.009D0.191D0.261M
6.3 Standards and certification0.308M0.259M0.052D
6.4 Contract enforcement0.370G0.148D0.070D
6.5 Environmental and safety regulations0.007D0.274M0.105D
Number of people27725454
Total number of people585
M7M7 Average Weight = 1/7 = 0.1431L*2L*
0.143-0.143-
7.1 Direct funding of firms’ R&D0.000D0.219M
7.2 Fiscal measures1.000D0.120D
7.3 Debt and risk sharing schemes0.000D0.224M
7.4 Technology extension services0.000D0.103D
7.5 Innovation procurement schemes0.000D0.101D
7.6 Cluster policies0.000D0.112D
7.7 Grants for collaborative R&D0.000D0.122D
Number of people49536
Total number of people585
Notes: SS means Sub System. L* stands for development levels. D means Defined level; M means Managed level.

