A Model for External Walls Selection in Hot and Humid Climates

Department of Architecture, Eastern Mediterranean University, Famagusta, North Cyprus, via Mersin 10 Turkey
*
Author to whom correspondence should be addressed.
Sustainability 2019, 11(1), 100; https://doi.org/10.3390/su11010100
Submission received: 22 November 2018
/
Revised: 11 December 2018
/
Accepted: 21 December 2018
/
Published: 24 December 2018
(This article belongs to the Special Issue Sustainability in the Built Environment and Climate Change)
Abstract
:Literature review shows that, to date, no local based method has been developed for evaluation of optimal wall constructions in a hot and humid climate from architects’ point of view. Hence, this study aims at developing a multi factor optimization model (MFOM) for comparative selection of opaque wall construction in a hot and humid climate based on four main evaluation criterion namely energy efficiency, thermal comfort, moisture control, and cost efficiency. In order to indicate the application of the MFOM, a case study methodology was employed in Kish Island, Iran, which is characterized by a hot and humid climate. Both qualitative and quantitative research methods were employed in the research process including literature and field survey, computer simulation, thermal, moisture and economic analysis finalized with a simple multi attribute rating technique (SMART) grading the outputs for final assessment. According to the results, it can be deducted that the application of the MFOM has the potential to save cost and energy, improve the thermal quality of the indoor environment while predicting the possible construction hazards posed by condensation in hot and humid climates.
1. Introduction
Buildings, as one of the major consumers of the energy, account for around 40% of the primary global energy [1] and diffuse one-third of the CO2 emission throughout the world [2]. In this regard, implementing energy-efficient technologies are pivotal to reduce building energy consumption, particularly in regions with a severe climatic condition. Besides energy efficiency, another point that should be taken into account is providing thermal comfort for the building users. It is always believed that if the building uses a significant amount of energy, then it is optimal in terms of the thermal comfort whilst this is no guarantee of this claim. Therefore, the question arises as to which factors affect both energy optimization and thermal comfort in buildings? According to Cena and de Deer [3] the main factors in this connection are passive building design, mechanical design as well as user behavior. Apart from the role of users and mechanical designers, which are beyond this research objectives, the architect’s decisions in selection of broad and local based construction techniques and materials in hot and humid climate are among the most important factors that this study strives to deal with. Previous studies have proven that the optimal selection of building envelope can be significant in saving energy and optimizing it [4,5,6]. It also has proven that a considerable quantity of heat conduction in buildings is carried out through the external walls [7,8,9,10,11]. As an important component of the building, external walls play a significant role in conserving energy and maintaining thermal comfort for buildings’ occupants. Therefore, it seems that the strategic decisions for selecting the optimal wall constructions have wider effects on the actual performance of the building than the proposed analysis of energy in detail. It is worth mentioning that the amount of heat conduction through external walls is highly dependent on the incorporation and level of thermal insulation as well as the mass materials. Besides energy efficiency and thermal comfort, construction durability is another important factor that can be affected by the moisture penetration and condensation in hot and humid climate. The occurrence of condensation in a building not only threatens the construction durability, but it also increases the energy consumption and poses thermal discomfort, decreases the indoor air quality and affects the user’s health and well-being [12]. Therefore, building thermal analysis should consider both heat and moisture behavior at early stage of the design. It should be added that the levels of thermal insulation and the use of impermeable cladding materials also escalates condensation rate for external walls both internally and externally. In addition to energy efficiency, thermal comfort and construction durability, cost efficiency is another criterion expected to be provided by a building. In addition to the economy of energy, the life-cycle cost (LCC) is another economic criterion that should be taken into account in evaluating the walls performance. It is clear that the LCC represents the ratio of the initial cost of each wall to the life span that it is expected to be. Thus, the walls that preserve energy more would take less time and vice versa. This period is called time of amortization which is one of the key indicators in cost efficiency analysis. In view of walls LLC, it is important to consider the local materials and construction techniques in amortization calculations since the use of imported systems and materials can have a negative impact on the economic feasibility of the construction project. Moreover, with the emphasis on the use of the local construction techniques and materials, it can be assumed with confidence that the building is more consistent with climatic conditions. To this end, it was tried to make an effort on strategies and evaluation criterion that should be considered when selecting and evaluating the optimal wall constructions in a hot and humid climate. Reviewing the previous research works over external wall design in hot and humid climates shows that many methods use the passive design strategies and passive measures on thermal comfort and energy conservation, as Yao et al. [13] have highlighted in their research work. However, most of previous works addressed the subject from material and construction technique perspectives for energy conserving objectives. For instance, Saffari et al. [14] and Pisello et al. [15] found the incorporation of phase change materials (PCMs) and smart nano-composite in building external walls useful to provide passive cooling and reduce the amount of energy used for mechanical system. Wu et al. [16] investigated 14 different types of concrete blocks in a hot summer region of China and found them optimal for building envelope as energy efficient mass materials. Further, Radhi [17] proposed using autoclaved aerated concrete (AAC) blocks as an environmental friendly material and masonry construction technique for building external walls, which is able to isolate the building against excessive heat gain in overheated periods without the need for insulation materials. Abanto et al. [18] examined the thermal properties of adobe as a heavyweight material and traditional strategy of wall design in a hot and humid climate due to its high thermal conductivity and heat capacity. Sambu et al. [19] reported the energy efficiency potential of the multi-layered walls from the perspective of construction techniques and discussed how thickness of the walls layers improve their thermal capacity. Stazi et al. [20] examined a cavity wall construction (filled with a 5cm air gap) in a hot and humid climate for energy efficiency and reported that the results were satisfactorily. Hens et al [21] underlined the role of insulating materials to be filled into the cavity walls as a sustainable approach in humid climates for energy conservation in general and moisture control in particular. Moreover, Ozel [22], Ozel et al. [23], Pekdogan et al. [24], Asan [25], and Bond et al. [26] defined proper position, thickness, and distribution for insulation layer based on the cost and energy efficiency perspectives. Further, Hansen et al. [27], and Halwa et al. [28] emphasized the role of insulating building external walls as an effective passive strategy for saving energy in buildings in hot and humid climates. As it was stated by Aditya et al. [29] thermal insulation is an efficient technology for providing thermal comfort and energy savings in buildings by proper installation at different location of building external surfaces, and using energy efficient materials leads to control of heat exchange and reduction of energy costs in the building. To summarize, factors such as energy efficient and heat capacitive materials coupled with optimal construction techniques including the isolation of wall layers and their optimum thickness and configuration are the most important passive strategies used to optimize the building walls in hot and humid climate. In addition to passive strategies in general and energy efficiency in particular, the economic analysis and the LCC of external wall constructions were addressed by Hasan [30], Koyankli [31], Bollatturk [32], Dylewski et al. [33], Ozel et al [34], and Nyers et al [35], highlighting the significance of implementing optimum thickness and distribution of insulation layer for cost efficiency. Moreover, a number of studies have been conducted over moisture content and condensation of external wall construction [36,37,38,39,40,41,42] investigating the hygrothermal performance of solid, multi-layered and cavity wall constructions in different regimes and underlining the relationship between temperature and condensation occurrence. To summarize, reviewing the previous research works show that almost all of the stated studies have investigated the subject based on a single evaluation criteria, most of which have concentrated on the energy efficiency subjects. Accordingly, this study aims at developing a local-based comparative model for selection of opaque wall construction in hot and humid climate based on four main evaluation criteria, namely: energy efficiency, thermal comfort, moisture control, and cost efficiency. We believe that the necessity and inclusion of the four mentioned evaluation criterion can help to make better decisions for selection of the external walls in a hot and humid climate since none of the similar or related research works have presented a model for selection of an optimal wall construction. Moreover, with the emphasis on the necessity of life cycle cost (LCC) and economic analysis of any selected wall constructions, the present study developed a formula to assess amortization time period having more précised and accurate decision-making process. In view of that, the foremost questions that this study strives to deal with are:
- What evaluation criterion and methods of assessment should be incorporated in a model for selection of the optimal wall constructions in hot and humid climate?
- What systematic approach and methodology should architects follow for employing suitable wall constructions in hot and humid climate?
- How local construction techniques and materials influence selecting optimal wall constructions for maximum efficiency?
2. Evaluation Criterion Methods of Assessment
2.1. Energy Efficiency
By emergence of the energy codes and measurements, the energy performance of building directive (EPBD) 2010/31/EU aims at improving buildings energy performance, providing the sector with more efficient and accurate strategies. The European Committee For Standardization, the EN ISO 13790 standard [43], suggests using dynamic thermal simulation for building energy estimation to reduce the heat gains and heat loss in different periods of the year by applying a three dimensional model of a building and the context weather data. The key inputs of thermal calculations, the utilization factors depend on the ratio between the heat gains and heat losses, which are conventionally assessed through analytical expressions. Moreover, based on the EN ISO 13790 standard, it is suggested using computer programs in each phase of the dynamic thermal simulations for building energy estimation. Recent studies have made some efforts in calibrating the EN ISO 13790 policies to adopt or improve the methods based on the climatic condition since the characteristics of the climatic and its factors have direct impact on the variable and application of the simulation programs and results accuracy.
2.2. Thermal Comfort
The major thermal comfort indicators are the predicted mean voted (PMV) and predicted percentage of dissatisfied (PPD); they have been introduced by Fanger and suggested by ASHRAE standard 55 [44] and the ISO 7730 [45]. The heat exchange between human body and the environment is calculated through the PMV index; it is also used for response prediction. Air temperature, relative humidity, air velocity and mean radiant temperature are the objective factors for the inputs of the PMV and thermal insulation of the clothing and activity level of human body are the subjective factors. Thermal sensation scale interval for both ASHRAE standard 55 and ISO standard 7730 were +0.5 and −0.5 respectively. At least, 80% of the individuals would be satisfied with the thermal comfort and 20% would be displeased [46].
2.3. Moisture Control
There are several methods for predicting the risk of condensation in external surfaces of the building such as dew point and Kiper methods [47]. However, most of computer programs use Glaser diagram based on the ISO 13788 standard [48] for condensation analysis. Based on this method, the condensed water should not exceed 1.0 kg/m2, beyond which damage may occur in the form of yellowish, green or black spots separation on the interior surface of the building or more severely on exterior surfaces. Accordingly, the following variables should be taken into consideration for investigating the risk of condensation via Glaser diagram: maximum and minimum external and internal air temperatures, maximum mean monthly humidity, relative humidity, external and internal surface temperatures, condensation period (i.e., under-heated and/or overheated periods).
2.4. Cost Efficiency
As it was shortly explained in the introduction, one of the most applicable methods for calculating the building LCC is amortization period. The amortization period of a wall in a hot and humid climatic condition will be considered based on the wall with most cooling energy consumption (i.e., based on context climatic condition, and the heating energy consumption is not considerable). Using the convective heat transfer equations, the heat gain and loss from both sides of the walls are calculated to find the energy load, because of yearly HVAC consumption and the cost per 1 m2 area of the walls. Thus, the walls that preserve energy more would take less time and vice versa. This period is called the time of amortization [49], which is one of the key indicators in cost efficiency analysis. Accordingly, the key factors to evaluate the costs respectively are: Initial wall cost, annual HVAC energy cost, rate of interest, inflation, and the maintenance cost all influence the amortization period. Based on the stated parameters and their relationships, an equation was developed obtaining the cost coefficient of each wall construction as follow:
where (F) is the cost coefficient of each wall construction; (C) is the cost difference between any walls compared to the cheapest wall; (B) is the total annual saving of any wall compared to the most expensive wall. The obtained values should be used for the following equation calculating the amortization period as follow:
where (y) is amortization time of each wall; (F) is the value coefficient as explained above; (i) is yearly interest rate; (f) is inflation rate and (r) is the maintenance cost. It is worth mentioning that in most hot and humid regions with shorter buildings lifespan, the amortization period considers less than 10 years.
2.5. Multi-Criteria Evaluation
One of the aims of decision support methods is to assist the decision makers in obtaining the appropriate alternative with the desired criteria. One of the methods that could apply for the decision makers having variable evaluation criterion is Simple Multi Attribute Rating Technique (SMART). It is a multi-criteria evaluation, decision support method, developed by Edward and Barron in 1994 [50]. The method was proposed based on the theory that each alternative consists of some criteria that have values and each criterion has weights that describe its quality compared to other criteria. This weighting is used to assess the alternatives to obtain the best choice, grading them based on their performance rate. Accordingly, in grading process, the highest grade obtains by the alternative with highest performance and the grading will be followed by the alternatives with lower quality based on the evaluation criterion limits.
3. Methodology
A multi-factor optimization model (MFOM) for comparative selection of opaque wall construction in hot and humid climates was developed based on four main evaluation criterion, namely: energy efficiency, thermal comfort, moisture control, and cost efficiency. In view of thatdynamic thermal simulation was employed to calculate hourly data for energy consumption as well as thermal comfort assessments (i.e., PMV and discomfort hours) while a Glaser diagram for condensation analysis was considered using Design Builder as the main simulation tool. Design Builder software is used for building modeling from a variety of aspects, such as building physics and materials, cooling and heating systems, lighting systems, and hot water. It also has the ability to calculate the amount of daylight and even CFD modeling. Design Builder uses energy plus engine for delivering the outputs and is designed for three types of users including the energy assessors, architects, and engineers. The software was developed by the US Department of Energy, and is one of the most accurate software available. It calculates comfort condition for building occupants based on the most reliable comfort standards such as ASHRAE 55 [44] and ISO 7730 [45]. In addition to computer simulation, a formula was developed to calculate amortization time period for cost efficiency. Based on the results of a computer simulation and cost efficiency, the MFOM evaluates the performance of the walls and determines the most suitable cases using a simple multi attribute rating technique (SMART) grading the walls for the final assessment. In order to indicate the application of the MFOM in an actual condition, a case study methodology was employed in Kish Island, which is characterized by a hot and humid climate. The workflow diagram and its application in the case study is shown in Figure 1. To select the wall cases for simulation, the research methodology followed two approaches. The first one is selecting the walls based on the most frequently used cases in the context. In the second approach, by relying on the outcomes of the previous studies, broadly used construction techniques and materials, which were reported as efficient, are selected for the following phase. As a result, the combination of the outcomes of the first and second approaches forms the cases that supposed to be simulated. After energy, comfort, moisture, and economic analysis, a simple multi attribute rating technique (SMART) is applied, grading the walls based on their performances for the final assessment. The presented methodology can be considered as an appropriate approach selecting external walls by architects and/or constructors due to its systematic and step-by-step approach. As seen in the flow work (Figure 1) the phases are sequential and oriented systematically in a way that the data initiates and proceeds precisely in accordance with the evaluation criterion. Further, using a case study, the effectiveness of the MFOM examines and evaluates for the final assessment and decision-making process.
3.1. Context Climate Analysis
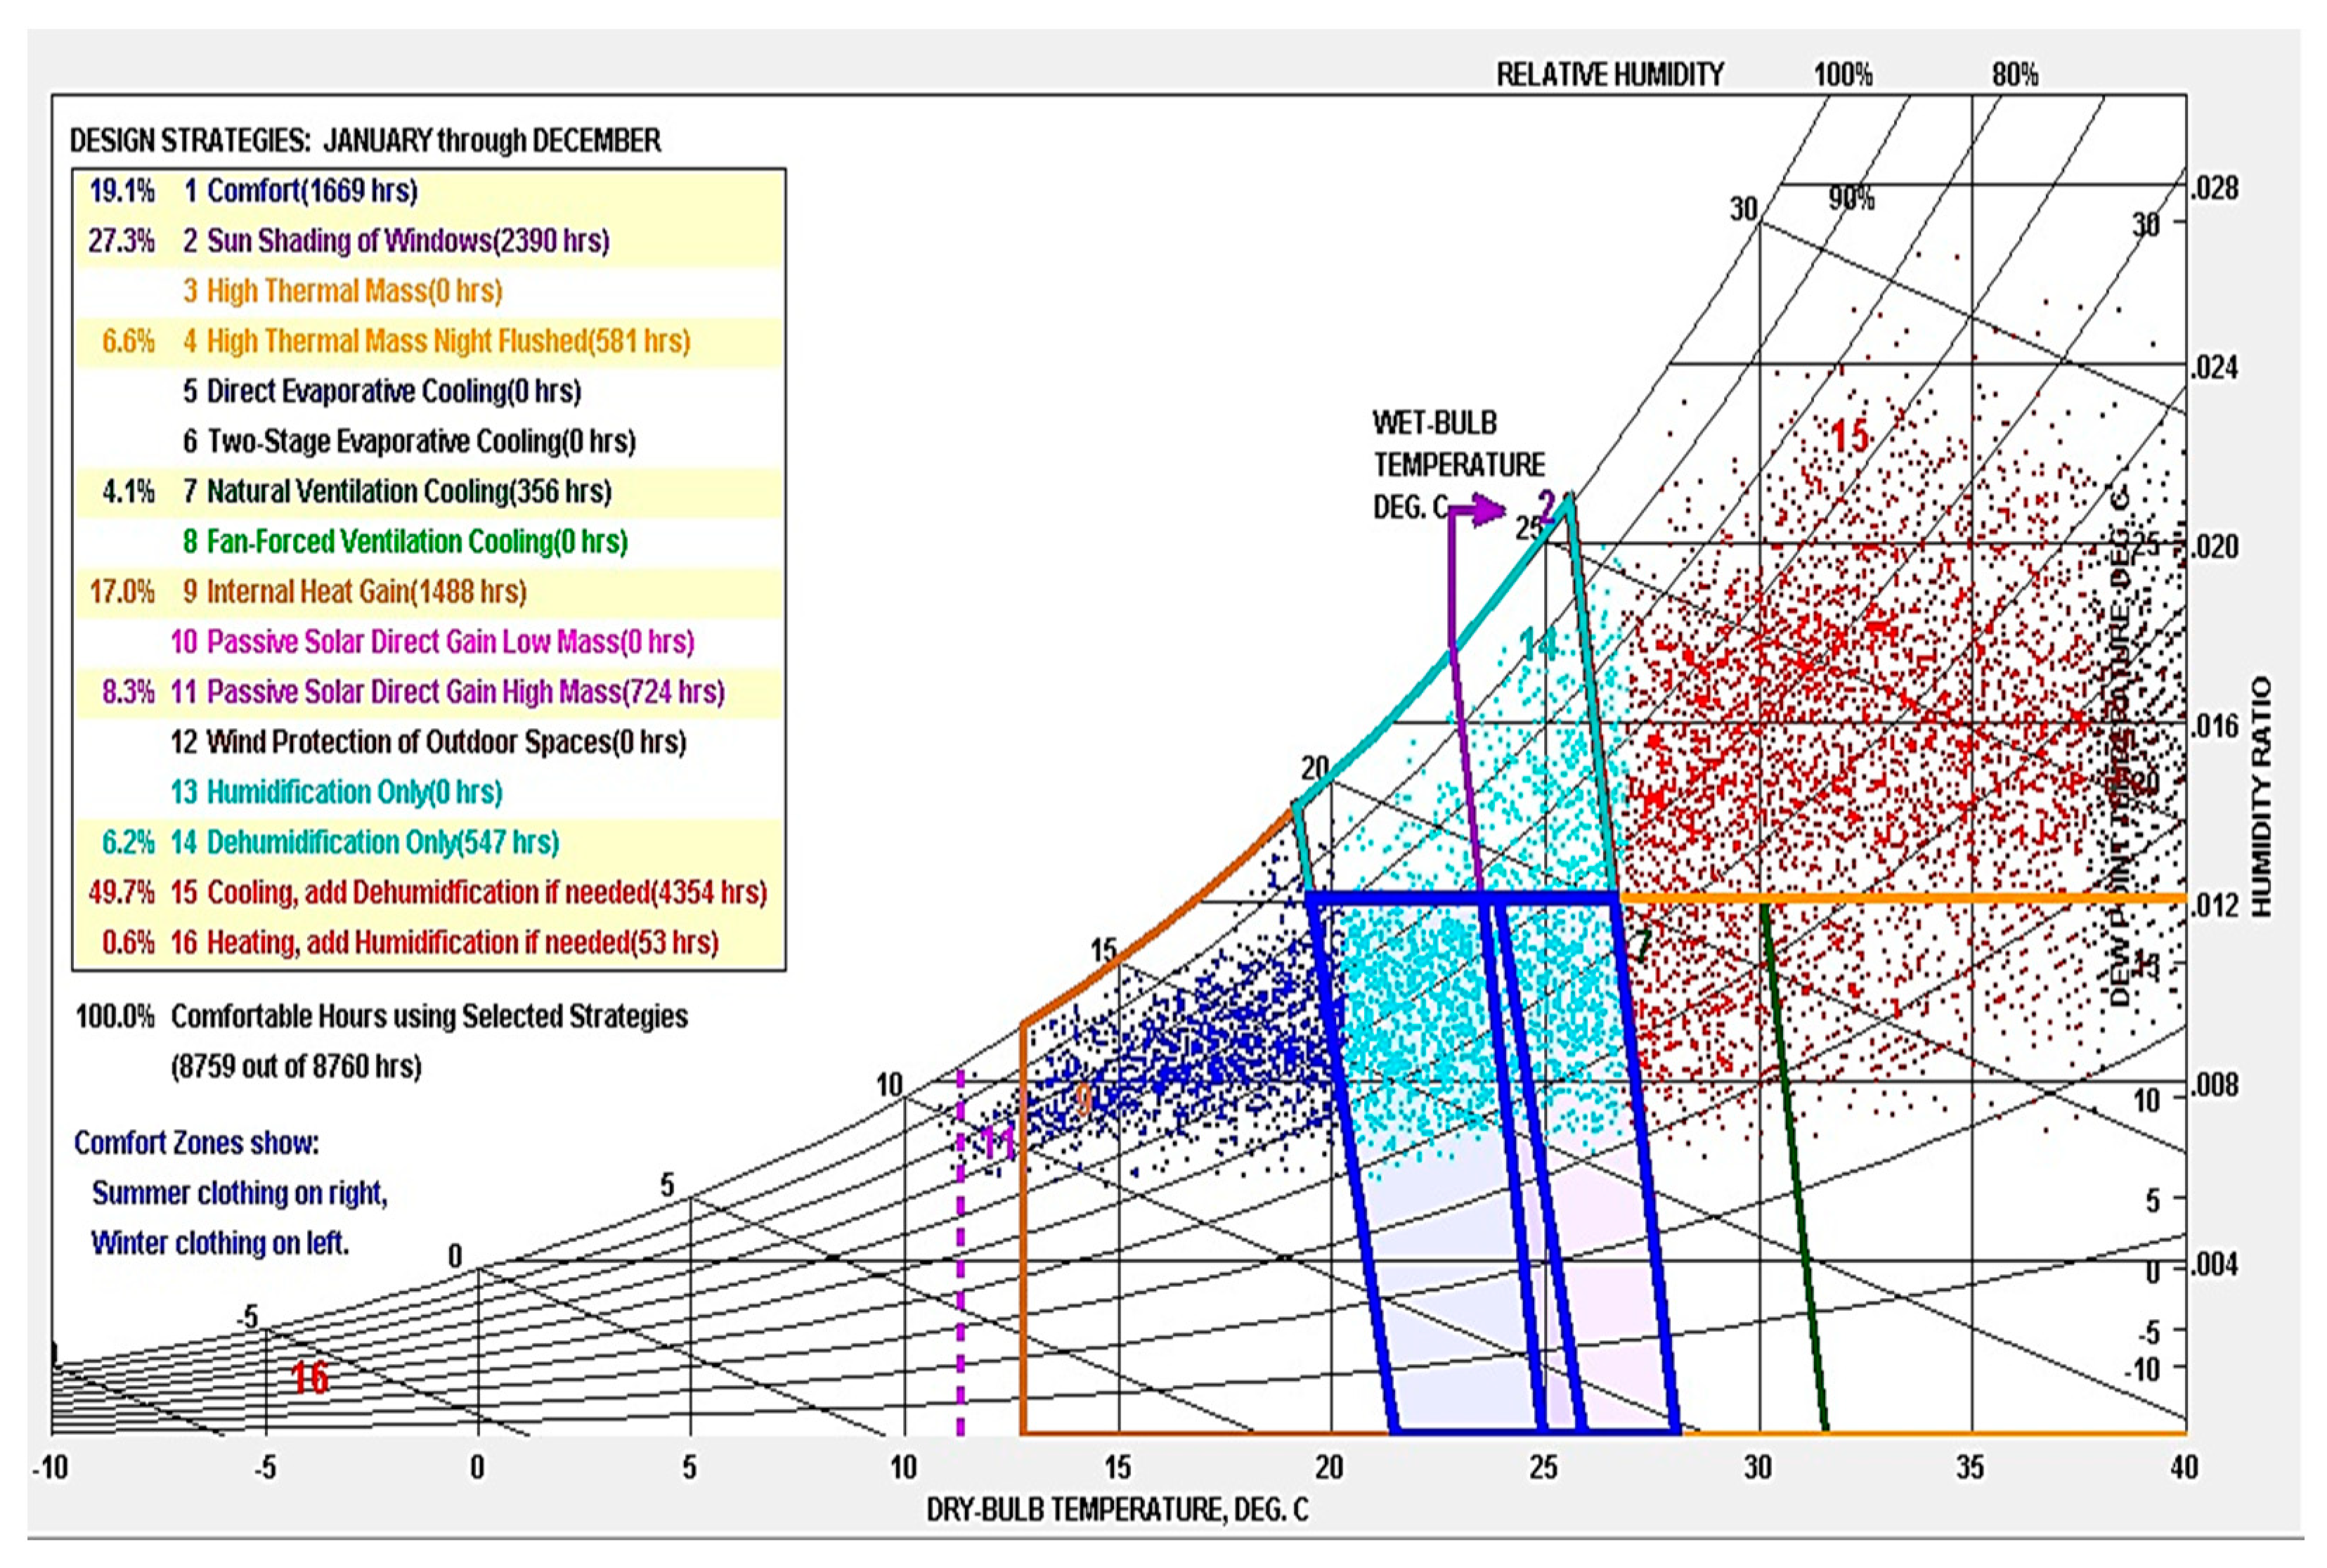
Kish Island is one of the Persian Gulf islands in Hormozgan Province, Southern Iran, characterized by a hot and humid climate having a longitude 53°58′ East and latitude 26°32′ North. The 10-year average temperature of Kish Island is 26.6 °C with 145 mm rainfall when in most days of year the temperature does not exceeds 35 °C. In July and August, air temperatures usually reach the highest levels and in January and February, it will remain at a minimum, which will provide the island with the most desirable weather conditions. From October through April, the weather is mild and ambient air temperature varies between 18 °C and 25 °C [51]. Climatic studies in Kish Island show that overheated periods decrease from the beginning of the October, and until April, a very pleasant weather is available. Since then, the heat is increasing and by the end of the summer (August in particular), it gradually reaches the highest level, which needs 24-hour cooling in the buildings. Using climate consultant (V.6) software [52], a comprehensive weather analysis was carried out using the “epw” file of the context, generated based on the latitude and longitude of Kish Island and arranged through metronome (V.7) software. The outputs of the climatic analysis containing Kish psychometric chart are shown in Figure 2. All weather and comfort analysis reports are based on the thermal comfort indices of ASHRAE standard 55 and current handbook of fundamental mode. It is worth mentioning that by following the colors of the polygons in psychometric chart and match with that of the legend, the active and passive design strategies for the context can be determined. Additionally, based on Costanzo and Donn [53] approach for climate analysis, Table 1 has been adopted taking into account the annual averages of context climate characteristics including dry bulb temperature, relative humidity, global horizontal radiation, and wind speed, obtained from “epw” file (via climate consultant software).
Defining Active and Passive Design Strategies
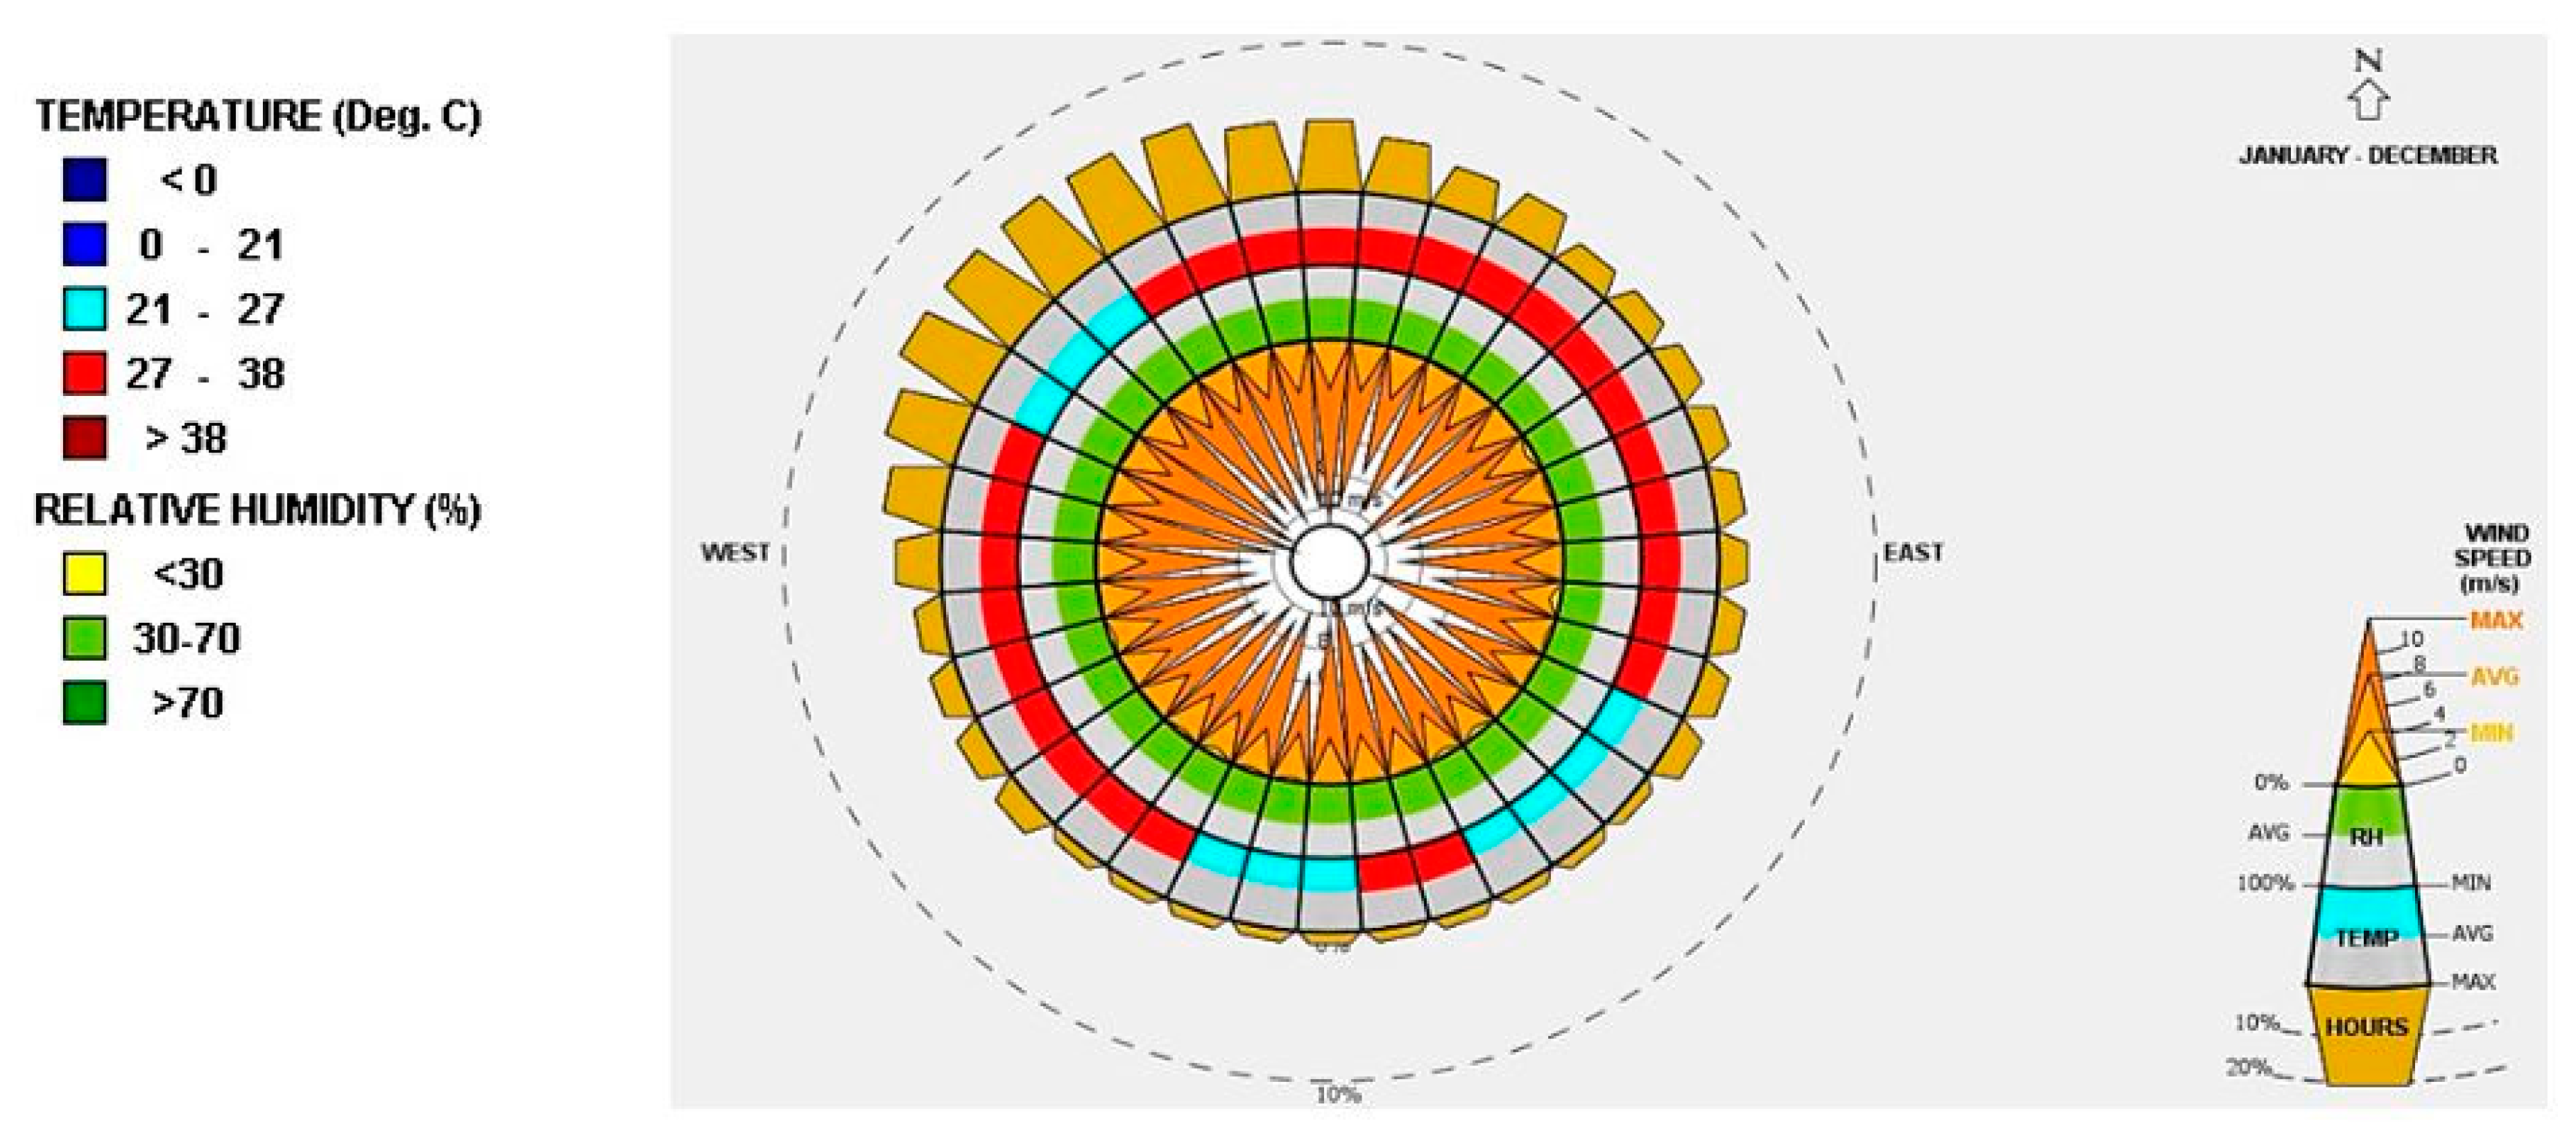
The climatic calendar of Kish Island (Figure 3) shows that the outside dry bulb temperature in 18% of the year-round is between 0 to 21 °C. It is additionally indicated that there is no specified time in a year that dropped into the comfort zone without any need of mechanical heating or cooling even a few hours. In December, the comfort condition reaches the maximum when only early in the morning there is a need of heating (from 7 pm to 9 pm). Furthermore, it is same in January and February when only a few hours more heating is needed (from 7 to 10 and 7 to 11, respectively). However, from May to September there is a need of cooling both for day and night time where 26% of the yearly temperature is between 21 °C to 27 °C. The critical condition is observed for 9% of the year-round when in July and August the temperature exceeds 38 °C in day time. Moreover, the wind rose chart of Kish Island (Figure 4) shows that, the northwest wind, at speeds of over 8 m/s with temperatures of 21 °C to 27 °C and humidity of 30% to 70%, are considered the dominant and pleasant winds in the Island. Hence, based on the psychometric chart of Kish Island besides climatic analysis, the passive and active design strategies that should be taken into consideration are shown in Table 2.
3.2. Field Survey
A field survey was conducted from September 2017 to February 2018, identifying the construction techniques and materials used in buildings external walls of Kish Island, Iran. Based on the observations, in most of building projects lightweight and masonry materials such as different types of brick (i.e., hollowed and lightweight) coupled with the cement blocks (i.e., pumice; and the lightweight types) were used. Moreover, building construction techniques are limited to concrete structures due to the climatic factors (i.e., excessive heat gain and moisture diffusion in all seasons). For selection of wall constructions, local market is more concentrated on lightweight concrete blocks with no insulation strategy. Three main types of residential buildings along with their construction details are selected as representatives of Kish Island constructions, presented in Table 3. Following the field survey, the residential buildings in Kish Island generally were categorized in three main types in terms of the height level namely villa, apartment and the towers. The height level and construction considerations for each category are presented in Table 4 and Table 5. Considering the implementation of construction techniques and the used materials in wall constructions of all three categories shows that the difference of materials and construction technique implementation is not significant and all three categories use approximately the same construction detail.
3.3. Localization
In many developed and developing countries, construction sector has already initiated and established sustainable standards in order to improve the thermal performance of buildings via compliance to building codes. In Iran, the Ministry of Housing and Urbanism devised Code No.19 in 1991 [54], which proposed a series of guidelines to improve the energy performance of the buildings either as mandatory or system performance method. In 2001, the code was totally revised in order to improve the methods and consideration. Based on the latest issue of code 19, external walls considerations should be as follow:
- Provide guidance for facilitating and matching the calculation method of the thermal insulation of the building envelope in accordance with the necessities;
- Adding technical data and numerical values needed to calculate the types of thermal bridges in the building external walls;
- Completion of the thermal data related to the materials and products used in the current construction of the country, as well as new products such as multilayered walls, passive wall systems, energy efficient coatings and, etc., to improve the thermal performance of the external walls of the buildings;
However, due to some deficiencies, the code remains inefficient and the stated points above are not taken into an account. Further, the guidelines are still far from broadly used codes such as LEED, BREEAM, CABSEE, GBCA, German regulation, etc. and needs to be improved. In this research, the foremost obstacles that code 19 faces with all revision efforts are:
- Lack of high level aims and objectives, addressing the characteristics of Iranian buildings;
- Non-separation of rules for buildings in different climatic condition of the country;
- Failure to implement thermal comfort strategies and lack of consideration on user comfort condition.
In accordance with the field surveying conducted in Kish Island (Table 3), although this region categorized by a severe climatic condition (i.e., hot and humid), almost none of the construction projects use thermal insulation and above stated strategies for energy efficiency and improving thermal quality of the indoor environments. Therefore, in this section, regarding the most commonly used wall constructions in the context (Figure 5), new alternatives are introduced because of localization process based on the outcomes of previous studies. It should be noted that localizing the suggested strategies through the literature should be based on the context construction limits including: prevalent materials and their thermo-physical properties as well as the allowable thickness of the wall constructions (i.e., thickness <25 cm). The numbers of localized wall cases and their thermal properties are presented in Figure 6 and Table 6 and Table 7, respectively.
3.4. Simulation Process
Dynamic thermal simulation was carried out using Design Builder (V.5.0) [55] as the main research tools The “epw” file of Kish Island was generated via Meteonorm software (V.7.1) [56] as the initial input using altitude and longitude of the context. The simulation inputs and their measures will be defined and set in the following section.
3.4.1. Inputs Setting
The modeling process of the case study was executed via 3D modeler of Design Builder software. Based on the outcomes of the climate analysis, defining the active and passive design strategies for improving the indoor thermal quality was done based on the outcomes of Table 2, occupancy patterns based on Table 3 and thermal properties of the selected walls materials based on Table 6 and Table 7 as the primary input setting of simulation process. With regard to the internal sources of the simulated model, three people were assumed as the flat occupants with activity level of (120 W/person) and the sensible heat gain of (0.5) as well as the work efficiency of (0.0) which means all produced energy by occupants body converted into the heat. As a plant, a split-system air conditioner was considered for heating, cooling and dehumidification. The heating and cooling set-point temperatures were fixed at 21 °C and 25 °C respectively as the common comfort temperatures for thermostat setting in the context, confirmed by the psychometric chart values. Accordingly, the ventilation set-point was fixed on 24 in the periods when natural ventilation is possible while infiltration rate was assumed to be 0.5 ACH. It should be noted that thermal comfort setting values were fixed in accordance with Design Builder default values which all are based on ASHRAE 55 handbook of fundamentals [44] EN 7730, ergonomics of the thermal environment [45] as well as indoor environmental input parameters for design and assessment of energy performance of buildings addressing indoor air quality [46], defined for residential buildings, as follow: metabolic rate: 1.2 met, external work: 0 W/m2, relative humidity: 50%, air velocity: 0 m/s. Further, the maximum and minimum clothing values for overheated and under-heated periods were assigned to the hottest and coldest months of the year (July and January, respectively), and for the remaining ten months, the clothing values were assumed to vary from 0.5 clo to 0.8 clo depending on the outdoor temperature. As the last point, the energy requirement of the simulated model was assumed equal to the amount of energy consumed by the HVAC system excluded from the auxiliary energy use.
3.4.2. Results Validation
In order to validate the simulation outputs, the results were compared to a weather data file prepared through the local weather station based in Kish Island airport as well as a short time weather monitoring file recorded by the authors from March 3 to March 10, 2018 through an automatic temperature and humidity data logger (i.e., Benetech; GM 1365) hanged on the central wall of the case study living room (Figure 7). The short time weather data file is necessary for simulation results validation to indicate the difference between the actual indoor weather condition and the indoor weather condition taken from software outputs (the “epw” weather file, which may give error to some extent). The results for this comparison is presented in Figure 8 and Figure 9.
3.4.3. Case Study Selection
Surveying the context, a two bedrooms 63 m2 flat in an apartment located in the center of the island was selected as the case study (Figure 10; marked with blue) to be simulated for wall evaluations. One of the most important reason why this flat was selected is that two of its dimensions are facing the outside and climatic factors so that this gives more critical condition compared to flats with three adiabatic walls. In addition, since the towers and villas have more window to wall ratio (WWR), it was preferred to simulate a flat with the least WWR for a sensible result. The thermos-physical properties of the case study components are presented in Table 5.
As it is shown in Figure 8 and Figure 9, the average difference between data logger outputs and Design Builder simulated outputs for indoor air temperature and relative humidity is about 2 °C and 18% respectively. In addition, when the results were compared to the local weather station and “epw” files (shown in Figure 9), the average difference was about 2.2 °C for indoor air temperature. A more detailed results validation is shown in Table 8, indicating the error percentage of data logger outputs and simulated outputs varies from 5.1% to 13.3%, which confirms that the results of the simulation are reliable. The error percentage is obtained from following relationship, developed by Mohammadi et al. [57]
Error = (Data Logger outputs − Simulated outputs/Data Logger outputs) × 100.
4. Final Assessment
4.1. Results
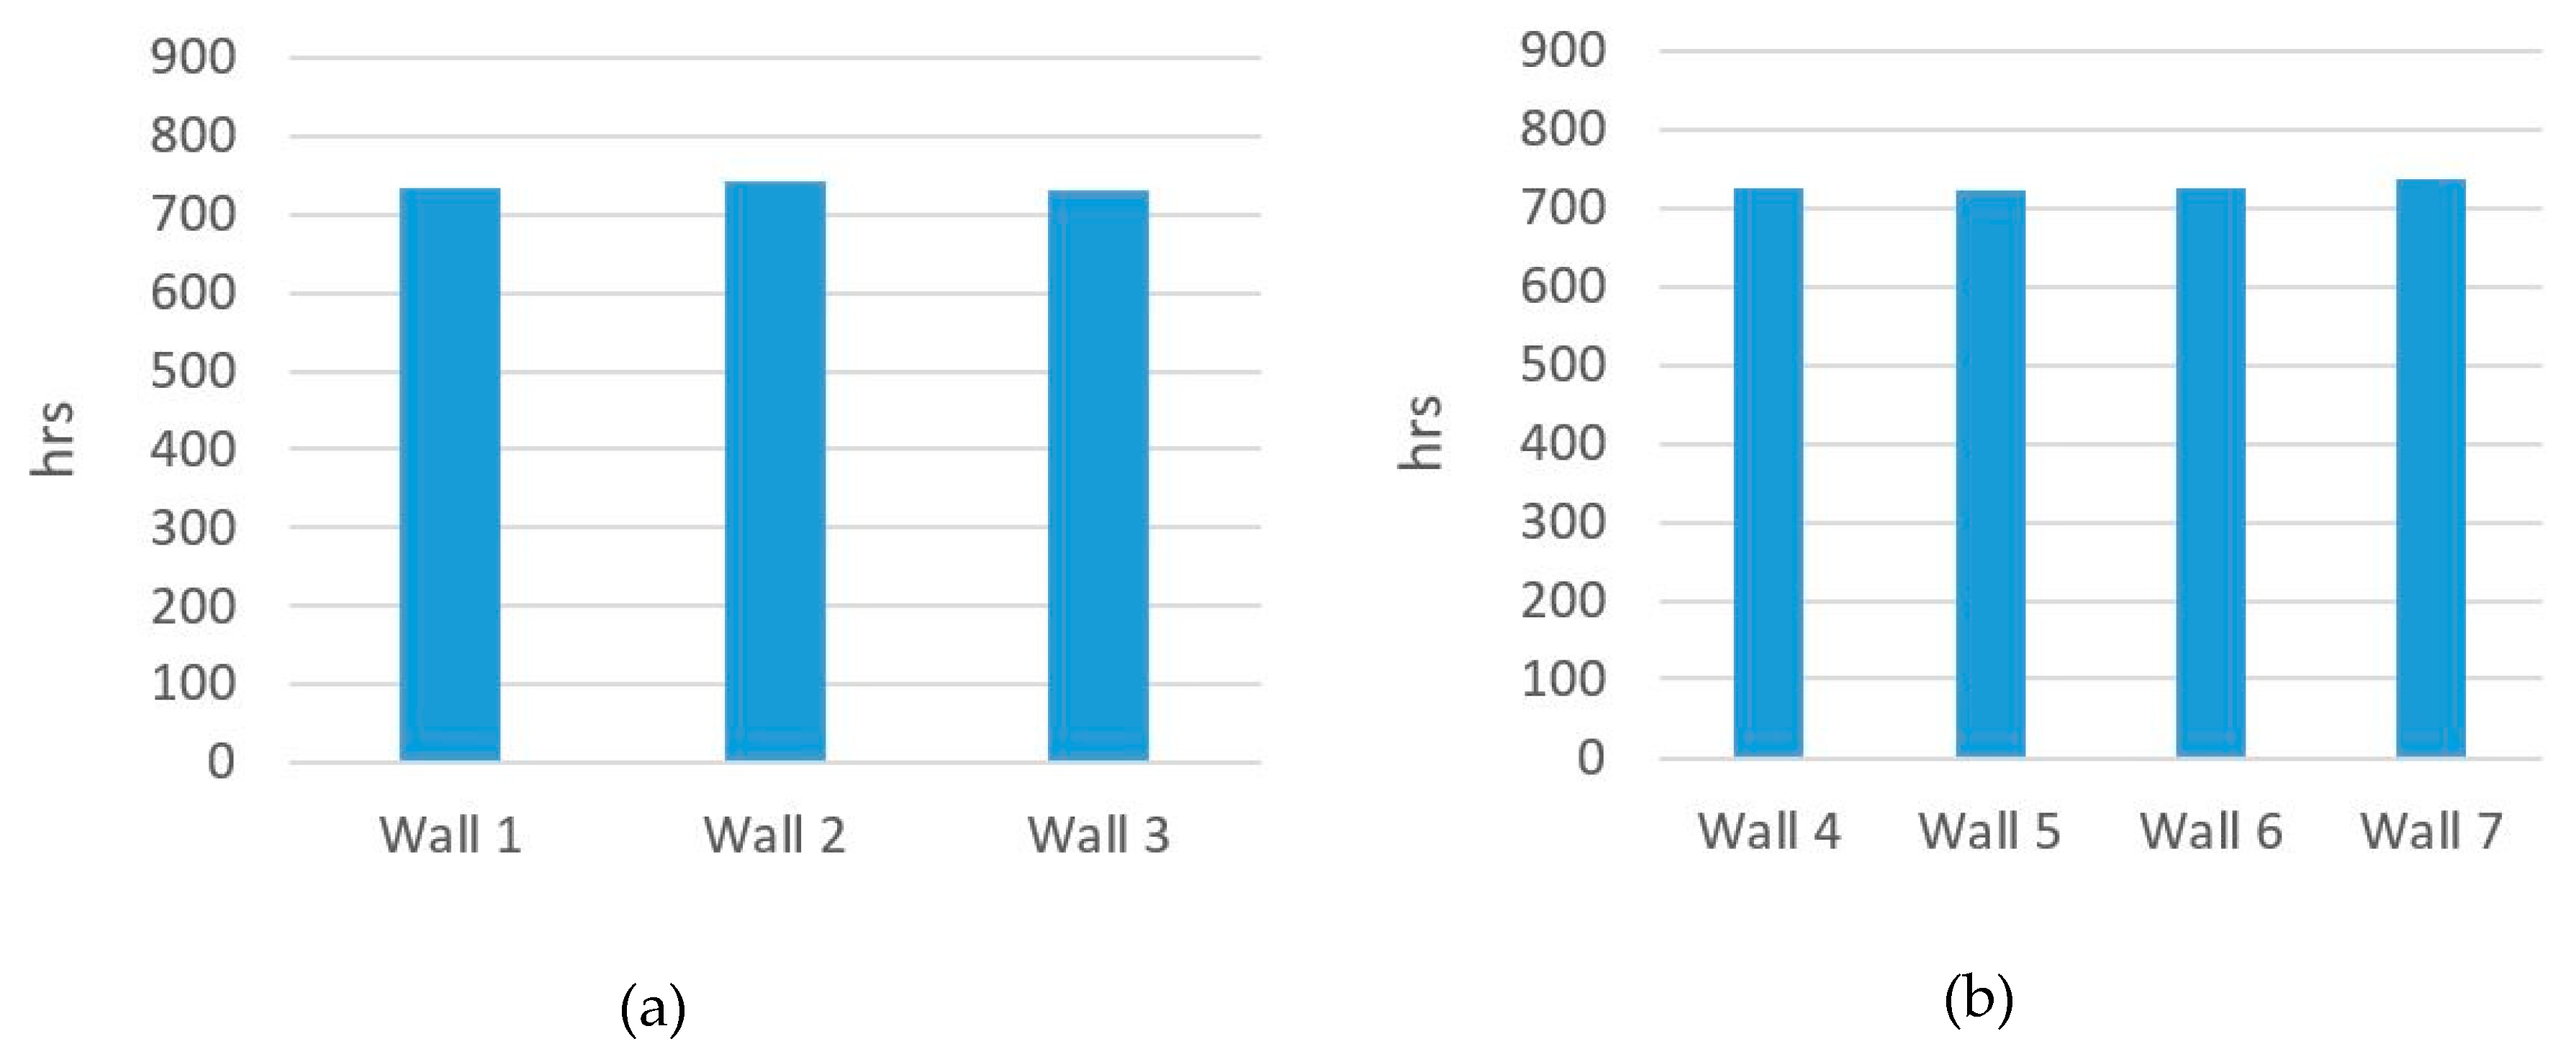
The dynamic thermal simulation results for wall constructions 1–3 (Figure 5) and 4–7 (Figure 6) in terms of annual HVAC energy consumption are demonstrated in Figure 11 and Figure 12, divided by the floor area, as well as for the PMV values demonstrated in Figure 13 and Figure 14. Further, the discomfort hours for the entire walls of 1–7 are shown in Figure 15 comparing the values for walls of the most frequently used with the localized cases. Based on the results in terms of heating energy consumption (Figure 11), wall 2 showed a greater performance compared to that of the walls 4, 6, 7, 1, 3, and 5, respectively. Additionally, based on the results for the cooling energy consumption shown in Figure 12, wall 5 showed the best performance followed by the walls 6, 4, 3, 2, and 1 respectively. Hence, in the contrary, wall 2 showed the worst performance among the entire walls with the highest quantity of cooling energy consumption (i.e., 81.0 kWh/m2). In addition to the HVAC energy consumption and according to the dynamic thermal simulation results for the PMV values shown in (Figure 13 and Figure 14), wall 5 provided the most comfort condition. It was followed by the walls 6, 4, 3, 1, and 7 respectively, while wall 2 provided the least comfort condition among the entire wall cases. Moreover, based on the results reporting the discomfort hours (Figure 15), wall 5 obtained the least discomfort hours; this is the opposite for wall 7. In addition to thermal comfort and energy consumption, the steady-state Glaser analysis for the entire wall cases was carried out via Design Builder software. The results indicating that a very little rate of condensation for walls 4 and 5 were observed in the under-heated periods (January and February) listed in Table 9, which is less than the limit (i.e., 1.0 kg/m2) and would be removed in overheated periods. Accordingly, the walls of 1, 2, 3, 6, and 7 with no condensation rate are not listed in Table 9. To finalize the moisture analysis, the entire wall cases are not at the risk for condensation.
As the last evaluation criterion and for the purpose of cost efficiency, the amortization period was calculated for walls 1–7 in accordance with the equations 1 and 2. The results are shown in (Figure 16) indicating that wall 1 amortized its LCC in the shortest run (i.e., 5.8 years) followed by walls 1, 6, 4, 3, 7, and 2, from 6.4 years to 8.5, respectively. As a consequence, since the amortization period for walls in the context were assumed to be 10 years (i.e., y < 10), the entire walls amortized their LCC in less than the expected period.
According to the results and due to the number of walls in this study as well as the fact that the entire walls are not at the risk of condensation, this criterion is not considered in the SMART assessment. The numbers of criterion are shown in Table 10 presenting the wall performances and their grades respectively. It is worth mentioning that due to the number of walls in this study, the highest grade that a wall can obtain is 7; the grades followed by the walls with lower quality (i.e., from 6 to 1) based on the remained evaluation criterion listed in the same table.
4.2. Discussion
The final assessment and overall grading of the SMART in terms of energy efficiency, thermal comfort and cost efficiency for the simulated wall constructions indicated that wall 5 obtained the highest grade; this is the opposite for wall 7, obtaining the lowest grade. Although wall 5 may have shown a weakened performance in one of the sub evaluation criteria (i.e., heating energy consumption) compared to that of the wall 2, since the MFOM is inherently comparative in which multiple evaluation factors are considered, the result is obtained generally, on aggregate. Based on the findings and in accordance with total grades presented in Table 10, most efficient walls were the ones formed during the localization process (i.e., walls 4–6). Even if the field study is characterized by a severe climate condition (hot and humid), the most commonly used wall constructions do not employ insulation, regardless of the code 19 guidelines. As a matter of the fact, lightweight wall materials in general and cement blocks in particular are recognized as energy efficient materials due to their high thermal resistance [58,59,60]. However, this is no guarantee for the maximum efficiency since the incorporation of insulation with such materials may have more potential for energy efficiency as well as improving thermal comfort condition as it has been investigated and proved by the results of this study. Therefore, it is necessary to consider the building codes and combine the guidelines with that of the broad and locally used materials [61] and construction techniques for the maximum efficiency. It is worth mentioning that besides benefiting from insulation potential for energy efficiency [62], generally, employing insulation in wall configuration escalates the risk for condensation [63] due to the physical properties of the insulating materials that are mostly porous (as also seen in the results of this study). Therefore, by using condensation analysis (which is one of the main evaluation criteria of the MFOM), the risk of condensation is predictable and can be dealt with, if the moisture quantity does not exceed the limit (i.e., 1.0 kg/m2). Further, the evaluation of the simulation results for thermal comfort showed that the obtained PMV values by the entire wall constructions are not always within an acceptable range (in January, July and August in particular). This may have been due to a number of reasons in accordance with simulation inputs and case study characteristics such as architectural design, the HVAC system efficiency, the determination of the heating and cooling set point temperatures as well as the PMV subjective parameters. Discussing with more detail, architectural design; building form, and openings configuration have a pivotal role in maintaining thermal comfort, benefiting from proper natural ventilation for buildings in hot and humid climate [64,65,66,67]. The lack of building provision with overhang and shading [64] as well as not using light-colored reflective materials in building envelope in order to reject the excessive solar gain in over heated periods [68] are of significant reasons to have discomfort condition within the buildings. Moreover, the HVAC system capacity and the plant function affecting the level of thermal comfort and PMV values while increasing the discomfort hours. Employing a single heating and cooling set point temperature as used in this study and also is the most frequently used method, may poses discomfort condition, while monthly set point temperatures are more preferred and recommended [69]. In addition to the set point temperatures and plant capacity, the level of clothing for building occupants and their external work have a drastic effect on the level of thermal comfort and PMV values [70]. For instance, in regions with defined adaptive comfort behaviors [71], the level of clothing considers less than that of the regions with no adaptive patterns [72]. Hence, the subjective parameters for the PMV calculations should not always consider a constant value; the option that most simulation software included, by default. As a consequence, coming up with such unexpected results (as far as this study came up with), the reasons can be investigated within the stated factors in general and for any case study in particular. Accordingly, the application of the MFOM in each and every case do not lead to the most optimal results without considering the factors discussed above, since thermal comfort (as one of the main evaluation criteria in this model) is in direct connection with user behavior [73,74,75], building characteristics and construction details [76].
5. Conclusions
The present study was carried out based on three main questions as follow:
- What evaluation criterion and methods of assessment should be incorporated in a model for selection of the optimal wall constructions in hot and humid climate?
- What systematic approach and methodology should architects follow for employing suitable wall constructions in hot and humid climate?
- How local construction techniques and materials influence selecting optimal wall constructions for maximum efficiency?
In view of answering the first question, the parameters affecting wall constructions performance in a hot and humid climate were first identified in introduction section and discussed in detailed. By reviewing the literature, the research gap was identified and the main evaluation criterion to be incorporated in a model for evaluating and selection of the optimal wall constructions in hot and humid climate were defined as: energy efficiency, thermal comfort, moisture control, and cost efficiency. Answering the second question, a step by step methodology (i.e., Section 3) was introduced in order to indicate the phase sequences of theoretical and analytical findings implementation in a systematic approach. Accordingly, a multi factor optimization model was developed and examined by a case study methodology indicating the developed model phase sequences. Regarding to the third and last question of the study, local construction type, techniques and materials in Kish Island were identified by means of a field survey, presented in Section 3.2 and Table 4 and Table 5. Linking the findings with the one and only construction code in Iran (i.e., code 19 [52]), the code deficiencies were highlighted, how most of highlighted guidelines over wall design do not observed and considered in the context constructions. Accordingly, the necessity of employing thermal insulation in wall constructions were highlighted and through a process of localization, the most frequently used wall cases (walls 1–3) were employed thermal insulation as the localized wall cases (walls 4–7). As a result, the combination of local construction techniques and materials with code 19 wall design guidelines is the certain answer for question 3, to be crystal cleared. Although the number of seven wall constructions was implemented to simulate and investigate their performances, most of which was important in this research is the methodology and the process of sequencing the phases in advancing a systematic model. It is therefore important to understand that the targeted simulation was carried out to emphasize on the phase sequences and validating the multi factor optimization model (MFOM) since the outcomes are not as important as the proof of the methodology and the developed model. Otherwise, the study could employ much more wall cases for a comprehensive simulation and a deeper research on heat and moisture performances of the walls in a hot and humid climate. The total achievements of this study are in two areas that can be exploited by groups of the experts. The first group includes architects and constructors in order to achieve a codified model and methodology for selecting the optimal wall constructions in a hot and humid climate. The second group includes technology designers, algorithm writers and energy-utilization software designer in building simulation field, using presented methodology to optimize the simulation process to be faster, immediate, and more accurate.
Author Contributions
Conceptualization, H.B. and P.H.; Formal analysis, H.B.; Funding acquisition, H.B. and P.H.; Investigation, H.B.; Methodology, H.B.; Project administration, P.H.; Resources, H.B.; Software, H.B.; Supervision, P.H.; Validation, H.B.; Writing—original draft, H.B.; Writing—review and editing, P.H.
Acknowledgments
The authors appreciate Department of Architecture at Eastern Mediterranean University.
Conflicts of Interest
The authors declare no conflicts of interest.
References
- Nejat, P.; Jomehzadeh, F.; Taheri, M.M.; Gohari, M.; Majid, M.Z.A. A global review of energy consumption, CO2 emissions and policy in the residential sector (with an overview of the top ten CO2 emitting countries). Renew. Sustain. Energy Rev. 2015, 43, 843–862. [Google Scholar] [CrossRef]
- Omer, A.M. Energy, environment and sustainable development. Renew. Sustain. Energy Rev. 2008, 9, 2265–2300. [Google Scholar] [CrossRef]
- Cena, K.; de Dear, R. Thermal comfort and behavioural strategies in office buildings located in a hot-arid climate. J. Therm. Biol. 2001, 26, 409–414. [Google Scholar] [CrossRef]
- Sozer, H. Improving energy efficiency through the design of the building envelope. Build. Environ. 2010, 45, 2581–2593. [Google Scholar] [CrossRef]
- Sadineni, S.B.; Madala, S.; Boehm, R.F. Passive building energy savings: A review of building envelope components. Renew. Sustain. Energy Rev. 2011, 15, 3617–3631. [Google Scholar] [CrossRef]
- Friess, W.A.; Rakhshan, K. A review of passive envelope measures for improved building energy efficiency in the UAE. Renew. Sustain. Energy Rev. 2017, 72, 485–496. [Google Scholar] [CrossRef]
- Ozel, M. Effect of insulation location on dynamic heat-transfer characteristics of building external walls and optimization of insulation thickness. Energy Build. 2014, 72, 288–295. [Google Scholar] [CrossRef]
- Baglivo, C.; Congedo, P.M.; Fazio, A.; Laforgia, D. Multi-objective optimization analysis for high efficiency external walls of zero energy buildings (ZEB) in the Mediterranean climate. Energy Build. 2014, 84, 483–492. [Google Scholar] [CrossRef]
- Hudobivnik, B.; Pajek, L.; Kunič, R.; Košir, M. FEM thermal performance analysis of multi-layer external walls during typical summer conditions considering high intensity passive cooling. Appl. Energy 2016, 178, 363–375. [Google Scholar] [CrossRef]
- Vollaro, R.D.L.; Guattari, C.; Evangelisti, L.; Battista, G.; Carnielo, E.; Gori, P. Building energy performance analysis: A case study. Energy Build. 2015, 87, 87–94. [Google Scholar] [CrossRef]
- Baglivo, C.; Congedo, P.M. High performance precast external walls for cold climate by a multi-criteria methodology. Energy 2016, 115, 561–576. [Google Scholar] [CrossRef]
- Wang, B.L.; Takigawa, T.; Yamasaki, Y.; Sakano, N.; Wang, D.H.; Ogino, K. Symptom definitions for SBS (sick building syndrome) in residential dwellings. Int. J. Hyg. Environ. Health 2008, 211, 114–120. [Google Scholar] [CrossRef] [PubMed]
- Yao, R.; Costanzo, V.; Li, X.; Zhang, Q.; Li, B. The effect of passive measures on thermal comfort and energy conservation. A case study of the hot summer and cold winter climate in the Yangtze River region. J. Build. Eng. 2018, 15, 298–310. [Google Scholar] [CrossRef]
- Saffari, M.; de Gracia, A.; Ushak, S.; Cabeza, L.F. Passive cooling of buildings with phase change materials using whole-building energy simulation tools: A review. Renew. Sustain. Energy Rev. 2017, 80, 1239–1255. [Google Scholar] [CrossRef]
- Pisello, A.L.; D’Alessandro, A.; Sambuco, S.; Rallini, M.; Ubertini, F.; Asdrubali, F.; Cotana, F. Multipurpose experimental characterization of smart nanocomposite cement-based materials for thermal-energy efficiency and strain-sensing capability. Sol. Mater. 2017, 161, 77–88. [Google Scholar] [CrossRef]
- Wu, F.; Zhu, J. Study on the construction of the database of energy-saving building wall’s thermal performance in Hangzhou. Energy 2012, 14, 943–948. [Google Scholar] [CrossRef]
- Radhi, H. Viability of autoclaved aerated concrete walls for the residential sector in the United Arab Emirates. Energy Build. 2011, 43, 2086–2092. [Google Scholar] [CrossRef]
- Abanto, G.A.; Karkri, M.; Lefebvre, G.; Horn, M.; Solis, J.L.; Gómez, M.M. Thermal properties of adobe employed in Peruvian rural areas: Experimental results and numerical simulation of a traditional bio-composite material. Case Stud. Constr. Mater. 2017, 6, 177–191. [Google Scholar] [CrossRef]
- Sambou, V.; Lartigue, B.; Monchoux, F.; Adj, M. Thermal optimization of multilayered walls using genetic algorithms. Energy Build. 2009, 41, 1031–1036. [Google Scholar] [CrossRef]
- Stazi, F.; Vegliò, A.; Di Perna, C.; Munafò, P. Experimental comparison between 3 different traditional wall constructions and dynamic simulations to identify optimal thermal insulation strategies. Energy Build. 2013, 60, 429–441. [Google Scholar] [CrossRef]
- Hens, H.; Janssens, A.; Depraetere, W.; Carmeliet, J.; Lecompte, J. Brick cavity walls: A performance analysis based on measurements and simulations. J. Build. Phys. 2007, 31, 95–124. [Google Scholar] [CrossRef]
- Ozel, M. Influence of glazing area on optimum thickness of insulation for different wall orientations. Appl. Therm. Eng. 2019, 147, 770–780. [Google Scholar] [CrossRef]
- Ozel, M.; Pihtili, K. Optimum location and distribution of insulation layers on building walls with various orientations. Build. Environ. 2007, 42, 3051–3059. [Google Scholar] [CrossRef]
- Pekdogan, T.; Basaran, T. Thermal performance of different exterior wall structures based on wall orientation. Appl. Therm. Eng. 2017, 112, 15–24. [Google Scholar] [CrossRef]
- Asan, H. Investigation of wall’s optimum insulation position from maximum time lag and minimum decrement factor point of view. Energy Build. 2000, 32, 197–203. [Google Scholar] [CrossRef]
- Bond, D.E.; Clark, W.W.; Kimber, M. Configuring wall layers for improved insulation performance. Appl. Energy 2013, 112, 235–245. [Google Scholar] [CrossRef]
- Hansen, T.K.; Bjarløv, S.P.; Peuhkuri, R.H.; Harrestrup, M. Long term in situ measurements of hygrothermal conditions at critical points in four cases of internally insulated historic solid masonry walls. Energy Build. 2018, 172, 235–248. [Google Scholar] [CrossRef]
- Halawa, E.; Ghaffarianhoseini, A.; Ghaffarianhoseini, A.; Trombley, J.; Hassan, N.; Baig, M.; Ismail, M.A. A review on energy conscious designs of building façades in hot and humid climates: Lessons for (and from) Kuala Lumpur and Darwin. Renew. Sustain. Energy Rev. 2018, 82, 2147–2161. [Google Scholar] [CrossRef]
- Aditya, L.; Mahlia, T.M.I.; Rismanchi, B.; Ng, H.M.; Hasan, M.H.; Metselaar, H.S.C.; Aditiya, H.B. A review on insulation materials for energy conservation in buildings. Renew. Sustain. Energy Rev. 2017, 73, 1352–1365. [Google Scholar] [CrossRef]
- Hasan, A. Optimizing insulation thickness for buildings using life cycle cost. Appl. Energy 1999, 63, 115–124. [Google Scholar] [CrossRef]
- Kaynakli, O. A review of the economical and optimum thermal insulation thickness for building applications. Renew. Sustain. Energy Rev. 2012, 16, 415–425. [Google Scholar] [CrossRef]
- Bolattürk, A. Determination of optimum insulation thickness for building walls with respect to various fuels and climate zones in Turkey. Appl. Therm. Eng. 2006, 26, 1301–1309. [Google Scholar] [CrossRef]
- Dylewski, R.; Adamczyk, J. Economic and environmental benefits of thermal insulation of building external walls. Build. Environ. 2011, 46, 2615–2623. [Google Scholar] [CrossRef]
- Özel, G.; Açıkkalp, E.; Görgün, B.; Yamık, H.; Caner, N. Optimum insulation thickness determination using the environmental and life cycle cost analyses based entransy approach. Sustain. Energy Technol. Assess. 2015, 11, 87–91. [Google Scholar] [CrossRef]
- Nyers, J.; Kajtar, L.; Tomić, S.; Nyers, A. Investment-savings method for energy-economic optimization of external wall thermal insulation thickness. Energy Build. 2015, 86, 268–274. [Google Scholar] [CrossRef]
- Sun, H.; Lauriat, G.; Nicolas, X. Natural convection and wall condensation or evaporation in humid air-filled cavities subjected to wall temperature variations. Int. J. Therm. Sci. 2011, 50, 663–679. [Google Scholar] [CrossRef] [Green Version]
- Wyrwał, J.; Marynowicz, A. Vapour condensation and moisture accumulation in porous building wall. Build. Environ. 2002, 37, 313–318. [Google Scholar] [CrossRef]
- Aelenei, D.; Henriques, F.M. Analysis of the condensation risk on exterior surface of building envelopes. Energy Build. 2008, 40, 1866–1871. [Google Scholar] [CrossRef]
- Liu, J.; Aizawa, H.; Yoshino, H. CFD prediction of surface condensation on walls and its experimental validation. Build. Environ. 2004, 39, 905–911. [Google Scholar] [CrossRef]
- Vereecken, E.; Van Gelder, L.; Janssen, H.; Roels, S. Interior insulation for wall retrofitting—A probabilistic analysis of energy savings and hygrothermal risks. Energy Build. 2015, 89, 231–244. [Google Scholar] [CrossRef]
- Ibrahim, M.; Wurtz, E.; Biwole, P.H.; Achard, P.; Sallee, H. Hygrothermal performance of exterior walls covered with aerogel-based insulating rendering. Energy Build. 2014, 84, 241–251. [Google Scholar] [CrossRef]
- Bliuc, I.; Lepadatu, D.; Iacob, A.; Judele, L.; Bucur, R.D. Assessment of thermal bridges effect on energy performance and condensation risk in buildings using DoE and RSM methods. Eur. J. Environ. Civil Eng. 2017, 21, 1466–1484. [Google Scholar] [CrossRef]
- European Standards. ISO 13790, Energy Performance of Buildings–Calculation of Energy Use for Space Heating and Cooling; International Standard Organisation (ISO): Geneva, Switzerland, 2008. [Google Scholar]
- The American Society of Heating, Refrigerating and Air-Conditioning Engineers (ASHRAE). Handbook of Fundamentals, American Society of Heating, Refrigeration and Air-Conditioning Engineers; ASHRAE: Atlanta, GA, USA, 2001. [Google Scholar]
- Standard 7730. Ergonomics of the Thermal Environment—Analytical Determination and Interpretation of Thermal Comfort Calculations of the PMV and PPD Indices and Local Thermal Comfort Criteria; The International Organization for Standardization (ISO): Geneva, Switzerland, 2005. [Google Scholar]
- European Standards. EN 15251, Indoor environmental input parameters for design and assessment of energy performance of buildings adressing indoor air quality. In Thermal Environment, Lighting and Acoustics; European Committee for Standardization: Brussels, Belgium, 2007. [Google Scholar]
- Lucas, F.; Adelard, L.; Garde, F.; Boyer, H. Study of moisture in buildings for hot humid climates. Energy Build. 2002, 34, 345–355. [Google Scholar] [CrossRef]
- European Standards. CEN 13788, Hygrothermal performance of building components and building elements. In Internal Surface Temperature to Avoid Critical Surface Humidity and Interstitial Condensation, Calculation Methods; European Committee for Standardization: Brussels, Belgium, 2001. [Google Scholar]
- Özdeniz, M.B.; Hançer, P. Suitable roof constructions for warm climates—Gazimağusa case. Energy Build. 2005, 37, 643–649. [Google Scholar] [CrossRef]
- Edwards, W.; Barron, F.H. SMARTS and SMARTER: Improved simple methods for multiattribute utility measurement. Organ. Behav. Hum. Decis. Proc. 1994, 60, 306–325. [Google Scholar] [CrossRef]
- Fazelpour, F.; Soltani, N.; Rosen, M.A. Feasibility of satisfying electrical energy needs with hybrid systems for a medium-size hotel on Kish Island, Iran. Energy 2014, 73, 856–865. [Google Scholar] [CrossRef]
- Climate Consultant Software. Available online: http://www.energy-design-tools.aud.ucla.edu/climate-consultant/ (accessed on 7 September 2018).
- Costanzo, V.; Donn, M. Thermal and visual comfort assessment of natural ventilated office buildings in Europe and North America. Energy Build. 2017, 140, 210–223. [Google Scholar] [CrossRef]
- Fayaz, R.; Kari, B.M. Comparison of energy conservation building codes of Iran, Turkey, Germany, China, ISO 9164 and EN 832. Appl. Energy 2009, 86, 1949–1955. [Google Scholar] [CrossRef]
- DesignBuilder. Advanced Modelling Tool for Buildings. Available online: https://www.designbuilder.co.uk/ (accessed on 7 September 2018).
- Meteonorm. Irradiation Data for Every Place on Earth. Available online: https://www.meteonorm.com/ (accessed on 7 September 2018).
- Mohammadi, A.; Saghafi, M.R.; Tahbaz, M.; Nasrollahi, F. The study of climate-responsive solutions in traditional dwellings of Bushehr City in Southern Iran. J. Build. Eng. 2018, 16, 169–183. [Google Scholar] [CrossRef]
- Reddy, B.V.; Jagadish, K.S. Embodied energy of common and alternative building materials and technologies. Energy Build. 2003, 35, 129–137. [Google Scholar] [CrossRef]
- Ünal, O.; Uygunoğlu, T.; Yildiz, A. Investigation of properties of low-strength lightweight concrete for thermal insulation. Build. Environ. 2007, 42, 584–590. [Google Scholar] [CrossRef]
- Al-Jabri, K.S.; Hago, A.W.; Al-Nuaimi, A.S.; Al-Saidy, A.H. Concrete blocks for thermal insulation in hot climate. Cem. Concr. Res. 2005, 35, 1472–1479. [Google Scholar] [CrossRef]
- Abokhamis Mousavi, S.; Hoşkara, E.; Woosnam, K.M. Developing a Model for Sustainable Hotels in Northern Cyprus. Sustainability 2017, 9, 2101. [Google Scholar] [CrossRef]
- Yuan, J. Impact of Insulation Type and Thickness on the Dynamic Thermal Characteristics of an External Wall Structure. Sustainability 2018, 10, 2835. [Google Scholar] [CrossRef]
- Barreira, E.; de Freitas, V.P. Experimental study of the hygrothermal behaviour of External Thermal Insulation Composite Systems (ETICS). Build. Environ. 2013, 63, 31–39. [Google Scholar] [CrossRef]
- Aflaki, A.; Mahyuddin, N.; Mahmoud, Z.A.C.; Baharum, M.R. A review on natural ventilation applications through building façade components and ventilation openings in tropical climates. Energy Build. 2015, 101, 153–162. [Google Scholar] [CrossRef]
- Lomas, K.J. Architectural design of an advanced naturally ventilated building form. Energy Build. 2007, 39, 166–181. [Google Scholar] [CrossRef]
- Gao, C.F.; Lee, W.L. Evaluating the influence of openings configuration on natural ventilation performance of residential units in Hong Kong. Build. Environ. 2011, 46, 961–969. [Google Scholar] [CrossRef]
- Kim, G.; Lim, H.S.; Lim, T.S.; Schaefer, L.; Kim, J.T. Comparative advantage of an exterior shading device in thermal performance for residential buildings. Energy Build. 2012, 46, 105–111. [Google Scholar] [CrossRef]
- Rosso, F.; Pisello, A.L.; Castaldo, V.L.; Ferrero, M.; Cotana, F. On Innovative Cool-Colored Materials for Building Envelopes: Balancing the Architectural Appearance and the Thermal-Energy Performance in Historical Districts. Sustainability 2017, 9, 2319. [Google Scholar] [CrossRef]
- Corgnati, S.P.; Fabrizio, E.; Filippi, M. The impact of indoor thermal conditions, system controls and building types on the building energy demand. Energy Build. 2008, 40, 627–636. [Google Scholar] [CrossRef]
- Nam, I.; Yang, J.; Lee, D.; Park, E.; Sohn, J.R. A study on the thermal comfort and clothing insulation characteristics of preschool children in Korea. Build. Environ. 2015, 92, 724–733. [Google Scholar] [CrossRef]
- Kim, J.; de Dear, R.; Parkinson, T.; Candido, C. Understanding patterns of adaptive comfort behaviour in the Sydney mixed-mode residential context. Energy Build. 2017, 141, 274–283. [Google Scholar] [CrossRef]
- O’Brien, W.; Gunay, H.B. The contextual factors contributing to occupants’ adaptive comfort behaviors in offices–A review and proposed modeling framework. Build. Environ. 2014, 77, 77–87. [Google Scholar] [CrossRef]
- Habibi, S. Micro-climatization and real-time digitalization effects on energy efficiency based on user behavior. Build. Environ. 2017, 114, 410–428. [Google Scholar] [CrossRef]
- Habibi, S. The promise of BIM for improving building performance. Energy Build. 2017, 153, 525–548. [Google Scholar] [CrossRef]
- Habibi, S. Smart innovation systems for indoor environmental quality (IEQ). J. Build. Eng. 2016, 8, 1–13. [Google Scholar] [CrossRef]
- Ascione, F.; Bianco, N.; De Masi, R.F.; Mauro, G.M.; Vanoli, G.P. Design of the building envelope: A novel multi-objective approach for the optimization of energy performance and thermal comfort. Sustainability 2015, 7, 10809–10836. [Google Scholar] [CrossRef]
Figure 1.
Multi factor optimization model workflow diagram. SMART: simple multi attribute rating technique.
Figure 1.
Multi factor optimization model workflow diagram. SMART: simple multi attribute rating technique.

Figure 2.
Kish psychometric chart (source: climate consultant software).

Figure 3.
Climate calendar of Kish Island (source: climate consultant software).

Figure 4.
Wind rose diagram of Kish Island (source: climate consultant software).

Figure 5.
Most commonly used wall constructions in Kish Island.

Figure 6.
Localized walls based on the outcomes of literature survey.

Figure 7.
Data logger location on the case study’s central wall.

Figure 8.
The comparison of data logger air temperature with Design Builder model.

Figure 9.
The comparison of local weather station air temperature with “epw” File.

Figure 10.
Case study exterior view (a); Case study architectural plan (b).

Figure 11.
Annual heating energy consumption for walls 1–3 (a); and walls 4–7 (b).

Figure 12.
Annual cooling energy consumption for walls 1–3 (a); and walls 4–7 (b).

Figure 13.
PMV values for walls 1–3.

Figure 14.
PMV values for walls 4–7.
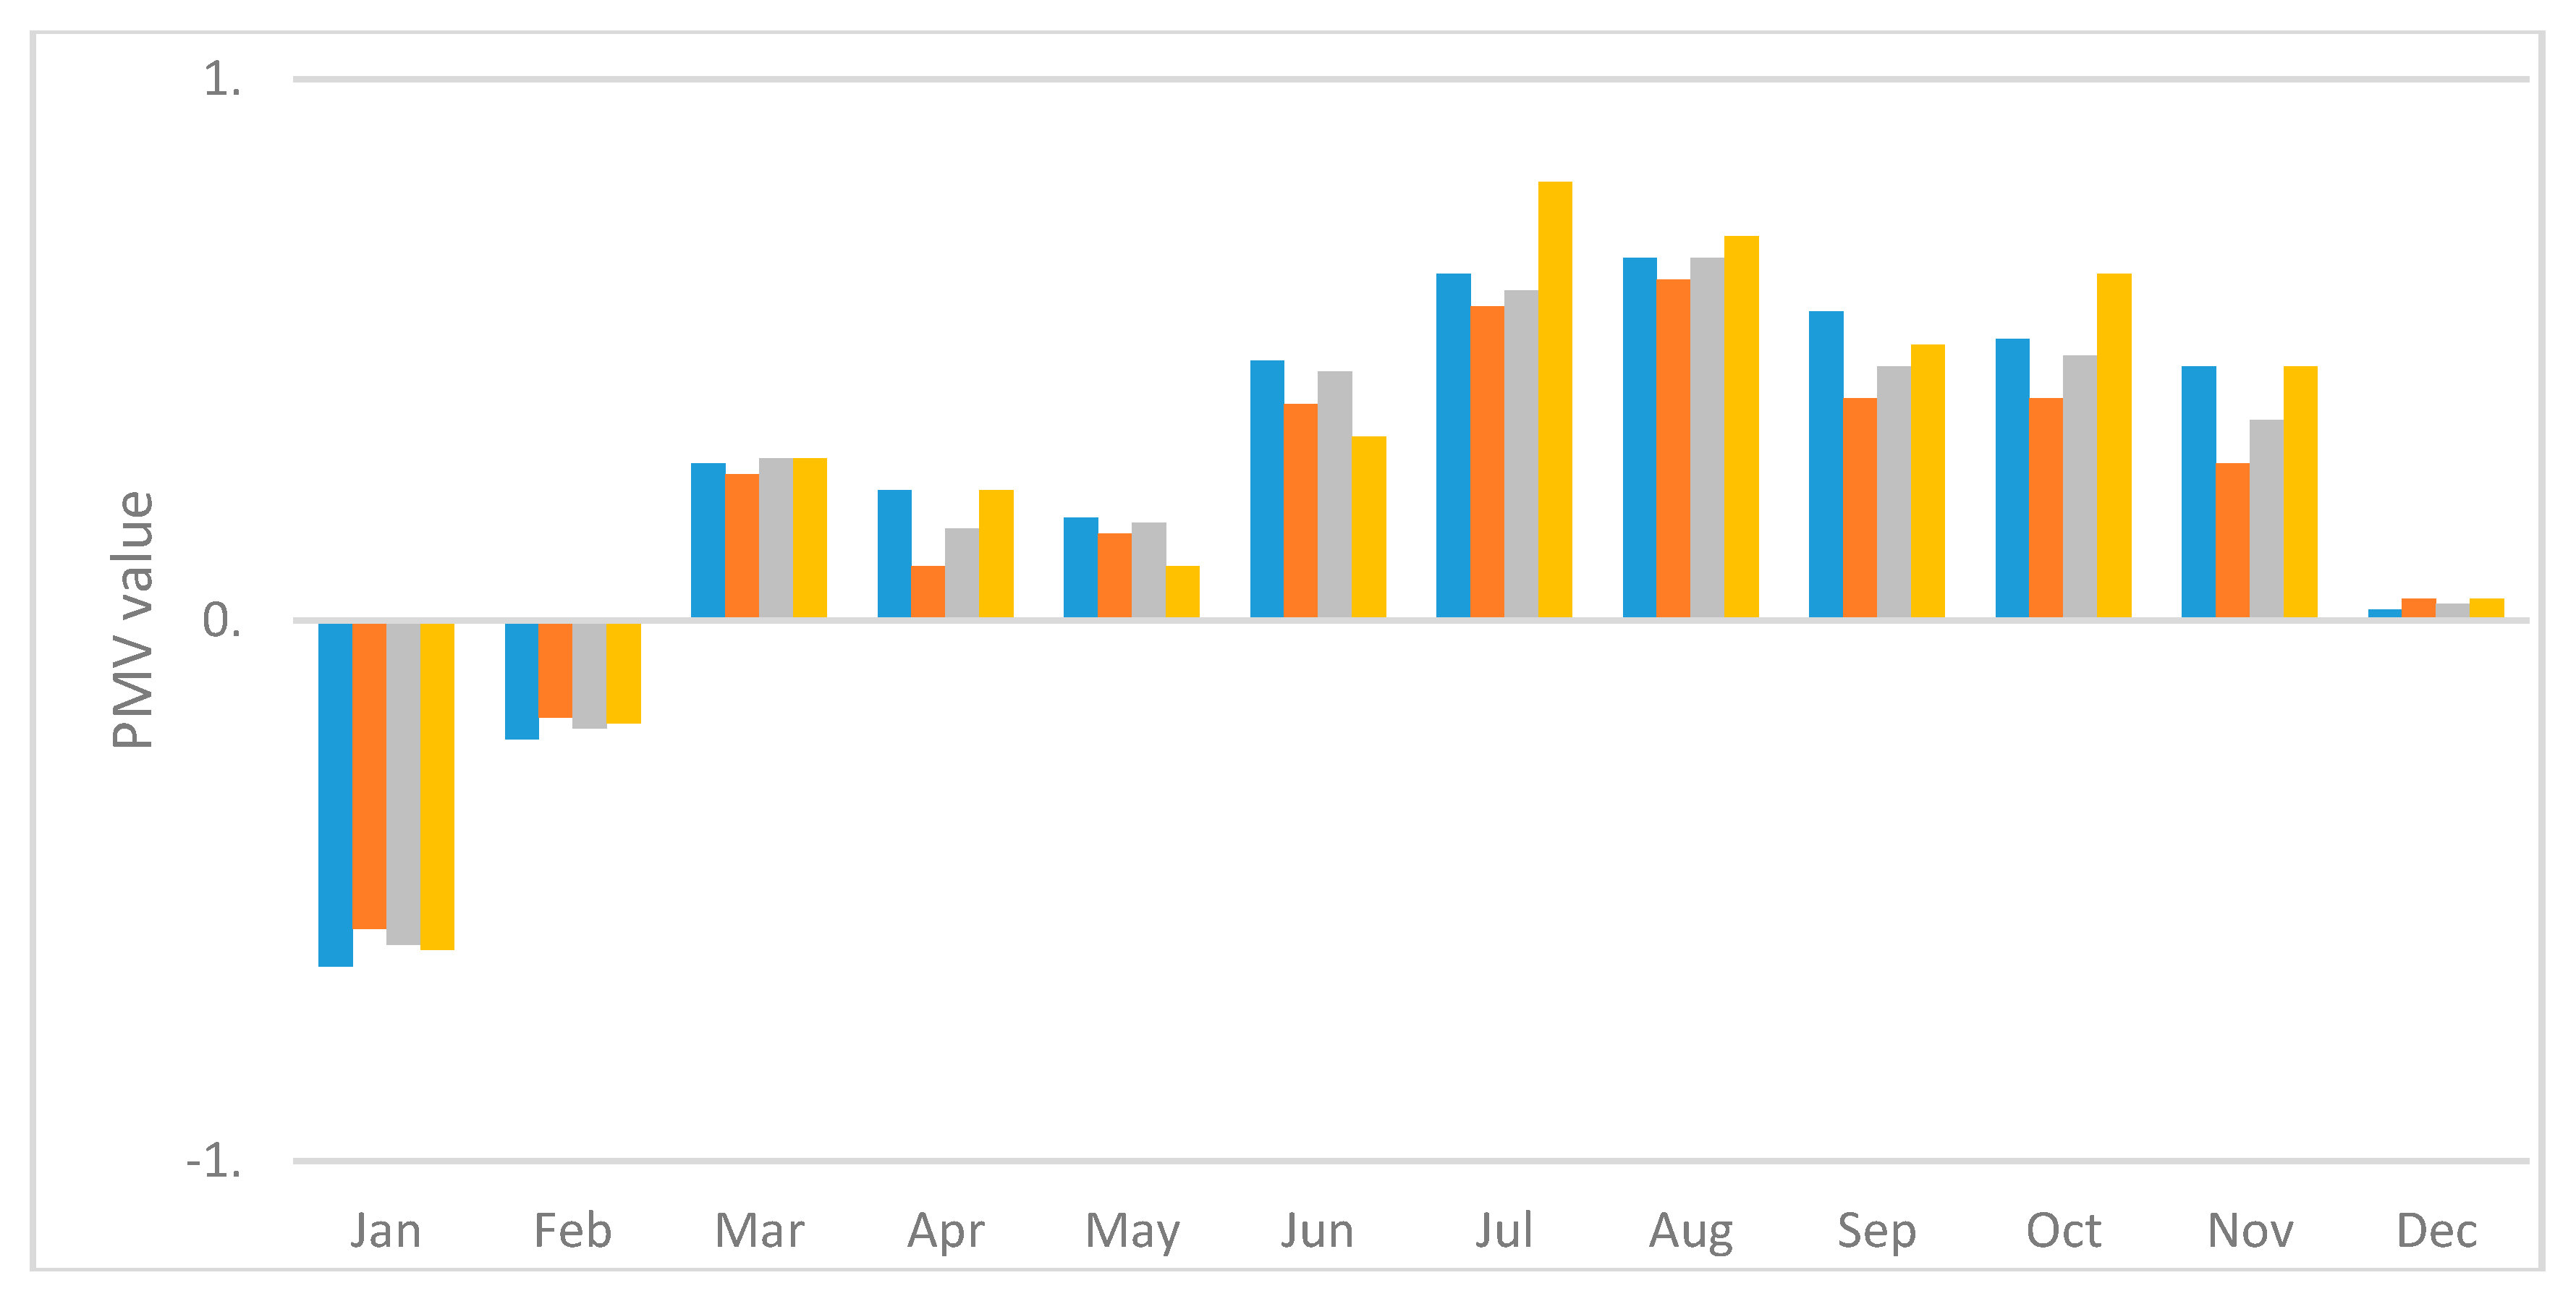
Figure 15.
Discomfort hours for walls 1–3 (a); and walls 4–7 (b).

Figure 16.
Cost efficiency results for walls 1–3 (a); and walls 4–7 (b).


Table 1.
Kish Island climate characteristics annual averages.
| Dry Bulb Temperature (C°) | Relative Humidity (%) | Global Horizontal Radiation (Wh/sq.m) | Wind Speed (m/s) |
|---|---|---|---|
| 27.2 | 55.6 | 434.6 | 2.4 |
Table 2.
Comfort strategies for Kish Island based on climate calendar and psychometric chart.
| Months | Active and Passive Strategies | ||||||
|---|---|---|---|---|---|---|---|
| Shading | Natural Ventilation | Air Conditioning | Dehumidification | Thermal Mass | Solar Gain | ||
| Heating | Cooling | ||||||
| Jan. | __ | (12 a.m.–4 p.m.) | (7–10 a.m.) | __ | × | × | × |
| Feb. | __ | (11 a.m.–5 p.m.) | (7–11 a.m.) | __ | × | × | × |
| Mar. | × | (8–11 a.m., 7 p.m.–1 a.m.) | × | E.N.V.P. * | × | × | __ |
| Apr. | × | (10 p.m.–10 a.m.) | __ | E.N.V.P. * | __ | × | __ |
| May | × | __ | __ | × | __ | __ | __ |
| Jun. | × | __ | __ | × | __ | __ | __ |
| Jul. | × | __ | __ | × | __ | __ | __ |
| Aug. | × | __ | __ | × | × | __ | __ |
| Sep. | × | __ | __ | × | × | __ | __ |
| Oct. | × | (12 p.m.–7 a.m.) | __ | E.N.V.P. * | × | × | __ |
| Nov. | × | (7 p.m.–3 a.m., 9–11 a.m.) | __ | E.N.V.P. * | × | × | __ |
| Dec. | __ | (12 a.m.–7 p.m.) | (7–9 a.m.) | __ | × | × | × |
* E.N.V.P. Excluding Natural Ventilation Periods.
Table 3.
Construction techniques and materials used in Kish Island.
| Project Sample | Structure | Structure Thickness | Wall Construction | Wall Material |
|---|---|---|---|---|
Apartment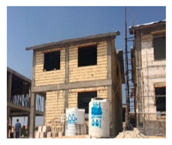 | Concrete | 25 cm | Masonry | Hollowed brick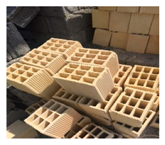 |
Tower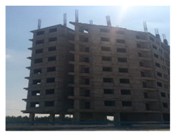 | Concrete | 20 cm | Lightweight | Pumic block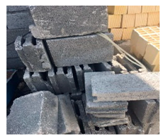 |
Villa | Concrete | 25 cm | Masonry | Concrete block |
Table 4.
Building typology in Kish Island.
| Building Category | Occupancy Hours | Height Level (HL) (Storey) |
|---|---|---|
| Villa | 24 | 1 > HL < 3 |
| Apartment | 24 | 3 > HL < 6 |
| Tower | 24 | 7 > HL < 21 |
Table 5.
The case study components’ thermo-physical properties.
| Components’ U-Value (W/m2 K) | ||||||
|---|---|---|---|---|---|---|
| Ceiling | Walls | Floor | Door | Window Glazing | Window Frame | Window Shading |
| 1.11 | 1.37 | 1.28 | 5.04 | 4.39 | 4.86 | 5.23 |
Table 6.
Thermal properties of walls opaque materials.
| Material | Density (kg/m3) | Conductivity (W/mK) | Specific Heat (kJ/kg K) | Vapour Diffusion (Factor) |
|---|---|---|---|---|
| 1. Gypsum | 1900 | 0.30 | 1200 | 11 |
| 2. Brick | 1800 | 0.39 | 920 | 8.0 |
| 3. Cement Plaster | 2000 | 1.60 | 837 | 6.8 |
| 4. Concrete Block | 700 | 0.18 | 1071 | 6.8 |
| 5. Pumice Block | 720 | 0.20 | 769 | 6.8 |
| 6. Extruded Polystyrene | 1400 | 0.70 | 837 | 59 |
| 7. Gypsum Board | 800 | 0.161 | 1088 | 11 |
Table 7.
Thermal Properties of the Air Gap.
| Material | Width (m) | Convection Coefficient (W/m2 °C) | Vapour Diffusion (Factor) |
|---|---|---|---|
| 8. Horizontal Flow Air | 0.02 | 1.66 | 1 |
Table 8.
The Average of the Data Logger and Simulated Indoor Temperature.
| Date | 3 Mar | 4 Mar | 5 Mar | 6 Mar | 7 Mar | 8 Mar | 9 Mar | 10 Mar |
|---|---|---|---|---|---|---|---|---|
| Data Logger (°C) | 23.2 | 23.4 | 23.3 | 23.3 | 23.5 | 23.7 | 23.9 | 23.9 |
| Simulated (°C) | 20.9 | 20.8 | 21.7 | 22.1 | 22.2 | 20.8 | 20.7 | 22.1 |
| Error (%) | 9.9 | 11.1 | 6.8 | 5.1 | 5.5 | 12.2 | 13.3 | 7.5 |
Table 9.
Condensation analysis for walls 1–7.
| Wall 4 | Wall 5 |
|---|---|
| Amount of Condensed Water: (0.24 kg/m3) | Amount of Condensed Water: (0.18 kg/m3) |
Table 10.
Walls grading based on the SMART.
| Wall No. | Criteria | |||||
|---|---|---|---|---|---|---|
| Energy Efficiency | Thermal Comfort | Cost Efficiency | ||||
| Heating | Cooling | PMV Value | Discomfort Hours | Amortization Time | Total Grade | |
| 1 | 4 | 3 | 3 | 2 | 6 | 18 |
| 2 | 7 | 1 | 1 | 3 | 1 | 13 |
| 3 | 6 | 4 | 4 | 4 | 3 | 21 |
| 4 | 1 | 5 | 5 | 5 | 4 | 20 |
| 5 | 5 | 7 | 7 | 7 | 7 | 31 |
| 6 | 2 | 6 | 6 | 6 | 5 | 25 |
| 7 | 3 | 2 | 2 | 1 | 2 | 10 |
© 2018 by the authors. Licensee MDPI, Basel, Switzerland. This article is an open access article distributed under the terms and conditions of the Creative Commons Attribution (CC BY) license (http://creativecommons.org/licenses/by/4.0/).
Share and Cite
MDPI and ACS Style
Boostani, H.; Hancer, P. A Model for External Walls Selection in Hot and Humid Climates. Sustainability 2019, 11, 100. https://doi.org/10.3390/su11010100
AMA Style
Boostani H, Hancer P. A Model for External Walls Selection in Hot and Humid Climates. Sustainability. 2019; 11(1):100. https://doi.org/10.3390/su11010100
Chicago/Turabian StyleBoostani, Haleh, and Polat Hancer. 2019. "A Model for External Walls Selection in Hot and Humid Climates" Sustainability 11, no. 1: 100. https://doi.org/10.3390/su11010100
Note that from the first issue of 2016, this journal uses article numbers instead of page numbers. See further details here.