Drought Under Global Warming and Climate Change: An Empirical Study of the Loess Plateau
by
 ,
,
Yang Li
1 ,
,
Zhixiang Xie
1,
Yaochen Qin
1,2,*,
Haoming Xia
1,
Zhicheng Zheng
1,
Lijun Zhang
1,
Ziwu Pan
1 and
Zhenzhen Liu
1 1
College of Environment and Planning, Henan University / Key Laboratory of Geospatial Technology for Middle and Lower Yellow River Regions, Kaifeng 475004, China
2
Henan Collaborative Innovation Center of Urban-Rural Coordinated Development, Zhengzhou 450046, China
*
Author to whom correspondence should be addressed.
Sustainability 2019, 11(5), 1281; https://doi.org/10.3390/su11051281
Submission received: 23 January 2019
/
Revised: 19 February 2019
/
Accepted: 19 February 2019
/
Published: 28 February 2019
(This article belongs to the Special Issue Sustainability in the Built Environment and Climate Change)
Abstract
:The Loess Plateau is located at the transition zone between agriculture and livestock farming; its spatial and temporal pattern of drought is the key for an appropriate adaptation to climate change. This study investigated monthly meteorological observation data of 79 meteorological stations from 1955 to 2014 to calculate the standardized precipitation evapotranspiration index at different time scales. The spatial and temporal characteristics and persistence of drought were analyzed. The results showed the following: (i) The drought trend is most apparent in spring (0.096/10a) and lower in summer (0.036/10a) and autumn (0.009/10a). (ii) A higher drought level indicates a lower frequency of droughts occurrence and vice versa. The frequency of light drought was highest (11.36%), while that of extreme drought was lowest (0.12%). (iii) The mean drought intensity was highest in summer, followed by spring, autumn, and winter. The drought intensity was mainly light, showing a pattern of severe drought in the northwest and light drought in the southeast. (iv) The Loess Plateau will continue a trend of drought in the future, but the season of the continuous intensity will differ. Droughts in spring and summer are highly persistent, autumn drought trends continue but may slow, and winter droughts become random events.
1. Introduction
The Intergovernmental Panel on Climate Change (IPCC) fifth assessment report pointed out that since the 1950s, the trend of global warming has become more apparent. The average increasing rate of the earth’s surface temperature is 0.12 °C/10 a, thus increasing the frequency and degree of meteorological disasters [1]. More than 45% of the world’s land is therefore threatened by drought [2]. The frequent occurrence of meteorological disasters causes severe losses of lives and reduces property security [3]. The study of dry and wet conditions of the earth’s surface has attracted increasing attention from the scientific community. Land aridification is most severe in Eurasia and Africa [4]. The characteristics of drought, such as wide range, high frequency, and long duration, have the most direct impact on agricultural activities and cause enormous losses. In recent years, the drought situation in northern China has increased in severity [5], and it has been predicted to worsen in the coming decades [6,7]. The Loess Plateau region is located in the transition zone between humid and semi-humid and arid and semi-arid regions, and, in China, this is an area where agriculture and livestock farming intersect. It is most significantly affected by climate change and a region with a very fragile ecological environment [8].
Scholars have presented theoretical and empirical studies on drought of the Loess Plateau. With regard to the spatial and temporal pattern of drought and its evolution, Sun et al. [9] studied the drought characteristics of the Shaanxi Loess Plateau over the last 40 years based on the standardized precipitation index (SPI) of 68 meteorological stations. Zhang et al. [10] used the comprehensive meteorological drought index (CI) to analyze the spatial and temporal variation characteristics of drought in the Loess Plateau region of Gansu province over the past 50 years from the perspective of drought rate, drought intensity, and drought frequency. Wang et al. [11] studied the evolution of soil drought using the modified Palmer drought index and extended the empirical orthogonal decomposition function (EEOF) based on 40 years of meteorological observation data from 51 stations on the Loess Plateau. Investigating drought periodicity and mutation year, Zhang et al. [12] used wavelet analysis, sliding t-test, and other methods to detect the occurrence cycle and mutation point of drought and waterlogging in the middle reaches of the Yellow River based on historical and data of 18 representative meteorological stations. Huang et al. [13] used both wavelet analysis and the Mann-Kendall (MK) test to identify and detect the periodicity and mutation of drought. With regard to the seasonal variation characteristics of drought, Xu et al. [14] used the relative humidity index to discuss and analyze the spatial and temporal variability in drought occurrence during the winter wheat growing season in the Huang-Huai-Hai region and their response to climate change. Ma et al. [15] used precipitation and temperature data from 12 meteorological stations on the Loess Plateau in Gansu province, and used the standardized precipitation evapotranspiration index (SPEI) to analyze the drought characteristics during seasons. Yao et al. [16] used a drought index based on relative humidity to study the spatial and temporal changes and the evolutionary characteristics of spring drought in the Loess Plateau from 1961 to 2010, and reported that the change of spring drought intensity presented apparent distribution characteristics of a strong central region and a weak peripheral region. The literature review showed that a number of studies investigated the annual climate change of the Loess Plateau [17,18]. However, most studies focus on analysis of the spatial and temporal characteristics of drought in the Loess Plateau, and only focus locally on the Loess Plateau, ignoring previous studies on multi-time-scale changes, spatial differentiation, and future trends of regional drought in the Loess Plateau.
The Palmer drought severity index (PDSI) [19], the SPI [20], and the SPEI [21] can be used to measure drought severity. Empirical studies showed that an increase in temperate significantly affects the degree of drought [22]. However, SPI only considers the precipitation factor, and as such ignores the influence of water balance and temperature, and, hence, fails to reflect the influence of temperature on the changing drought trend [23]. SPEI combines the advantages of PDSI and SPI, and is extremely sensitive to temperature, which exerts a large impact on drought, and can more objectively express the surface dry-wet change based on the difference between precipitation and evapotranspiration. Therefore, it is suitable for the study of drought characteristics in the context of the warming of the Loess Plateau [24,25]. Consequently, this study selected the SPEI as the index to measure the drought in the Loess Plateau, analyzed the spatial and temporal pattern of drought over the last 60 years from multiple time scales, and predicts the future drought development trend based on Hurst index. Analyzing the spatial and temporal changes of the frequency and intensity of drought is of great scientific significance not only to understand the regional response to global climate change, but also for a scientific assessment of the water situation in the Loess Plateau region, as well as for regional agricultural production, drought monitoring, and drought prevention.
2. Materials and Methods
2.1. Overview of the Study Area and Data Sources
The Loess Plateau is located in the hinterland of China, in the middle and upper reaches of the Yellow River and the Haihe river, covering seven provinces of China. The terrain is high in the northwest and low in the southeast, with a total area of about 6.44 × 10⁵ km2 [26] (Figure 1). The climate type is defined as continental monsoon, with an annual average temperature of 10–12 °C, and an annual total precipitation of 150–900 mm. The ecological environment of the Loess Plateau is extremely fragile due to the dual effects of natural factors and human activities. The monthly precipitation and temperature data of a total of 79 meteorological stations (Figure 1b) on the Loess Plateau and its surrounding areas were obtained from the monthly dataset of China’s surface climatic data, provided by the national meteorological information center (http://data.cma.cn/). The time series ranged from 1955 to 2014, covering a total of 60 years. The SPEI values of each meteorological station were calculated and the drought frequency and intensity of nearly 60 years in the Loess Plateau were calculated.
2.2. Methods
(1) Standardized Precipitation Evapotranspiration Index
SPEI is an index that combines precipitation, evaporation, and transpiration and enables a reasonable estimate of drought on multiple time scales. The calculation principle of SPEI characterizes the degree of drought in a region in which the difference between precipitation and evapotranspiration deviates from the average. The calculation formula is as follows [21]:
where K represents the modified coefficient calculated according to latitude, T represents the monthly average temperature, I represent the annual total heating index, and represents the coefficient determined by I.
The difference between monthly precipitation and potential evapotranspiration is:
where Pi represents the monthly precipitation and PETi represents the monthly potential evapotranspiration.
The three-parameter log-logistic distribution fitting formula of is as follows:
where α is the scale parameter, β is the shape parameter, γ is the origin parameter, f(x) represents the probability density function, and f(x) represents the probability distribution function.
SPEI’s normalized normal processing:
Here, when p ≤ 0.5, p = F(x); when p > 0.5, p = 1−F(x); the other parameters are C0 = 2.515517, C1 = 0.802853, C2 = 0.010328, d1 =1.432788, d2 = 0.189269, and d3 = 0.001308.
(2) Drought frequency
Drought frequency (Pi) represents the degree of drought frequency during a certain period of time at a meteorological station. The calculation formula is as follows:
where represents the number of years with meteorological data at a station; n represents the total number of years in which drought occurred in this station.
(3) Drought severity
The formula to calculate drought severity is as follows:
where represents the number of stations in which drought occurs, and SPEIi represents the absolute value of SPEI in which drought occurs. Combined with the actual situation of drought in the research area and relevant literature [27,28] criteria for the classification of drought levels in the Loess Plateau were defined (Table 1).
(4) Drought stations proportion
Drought station proportion uses the proportion of the number of stations with drought occurrence in the region to the total number of stations to evaluate the scope of the drought influence; the calculation formula is as follows:
where represents the number of stations where drought occurs and represents the number of meteorological stations in the study area. Pj represents the extent of occurrence of drought within a certain region, and indirectly reflects the impact degree of drought.
(5) Mann-Kendall (MK)
The MK test is a commonly used non-parametric trend test method to detect the changing trends in meteorological elements. The curve trend of UF and UB can be used to analyze the variation trend of SPEI, and the time of mutation and the range of significant changes can be defined. The formulas are as follows:
where SPEIi and SPEIj represent the SPEI of meteorological stations in the ith and jth years, n represents the length of the time series, and sgn is a symbolic function. Under the given significance level (p < 0.05/0.01), there is a significant change when |Z| ≥ 1.69/2.575.
(6) Hurst index
Hurst analysis was introduced by the British hydrologist Hurst [29], and has since been widely used to investigate the duration or anti-duration intensity of the change trend of time series of meteorological elements [30]. The calculation steps are as follows, for the time series of , i = 1,2,3,4,5,…,n:
Iuy87ywhere H is the Hurst index, and the logarithm of both sides of formula (18) is the empirical formula of Hurst. Based on the time series of SPEI and using the Hurst empirical formula to obtain a cluster of H values for least square fitting, the obtained slope of the line is the corrected Hurst index (H). The Hurst index H (0 < H < 1), 0.5 < H < 1, indicates that the future change of time series will be consistent with the changing trend in the past, and the closer the H value is to 1, the stronger the continuity will be. H = 0.5, this time series is a random event, and the changes before and after the time series of climate elements are independent. 0 < H < 0.5 indicates that future changes of the time series will show an opposite trend from the past, and the closer the H value is to 0, the stronger this anti-continuity will be.
3. Results
3.1. SPEI Multi-Time-Scale Feature Analysis
3.1.1. SPEI Seasonal Variation
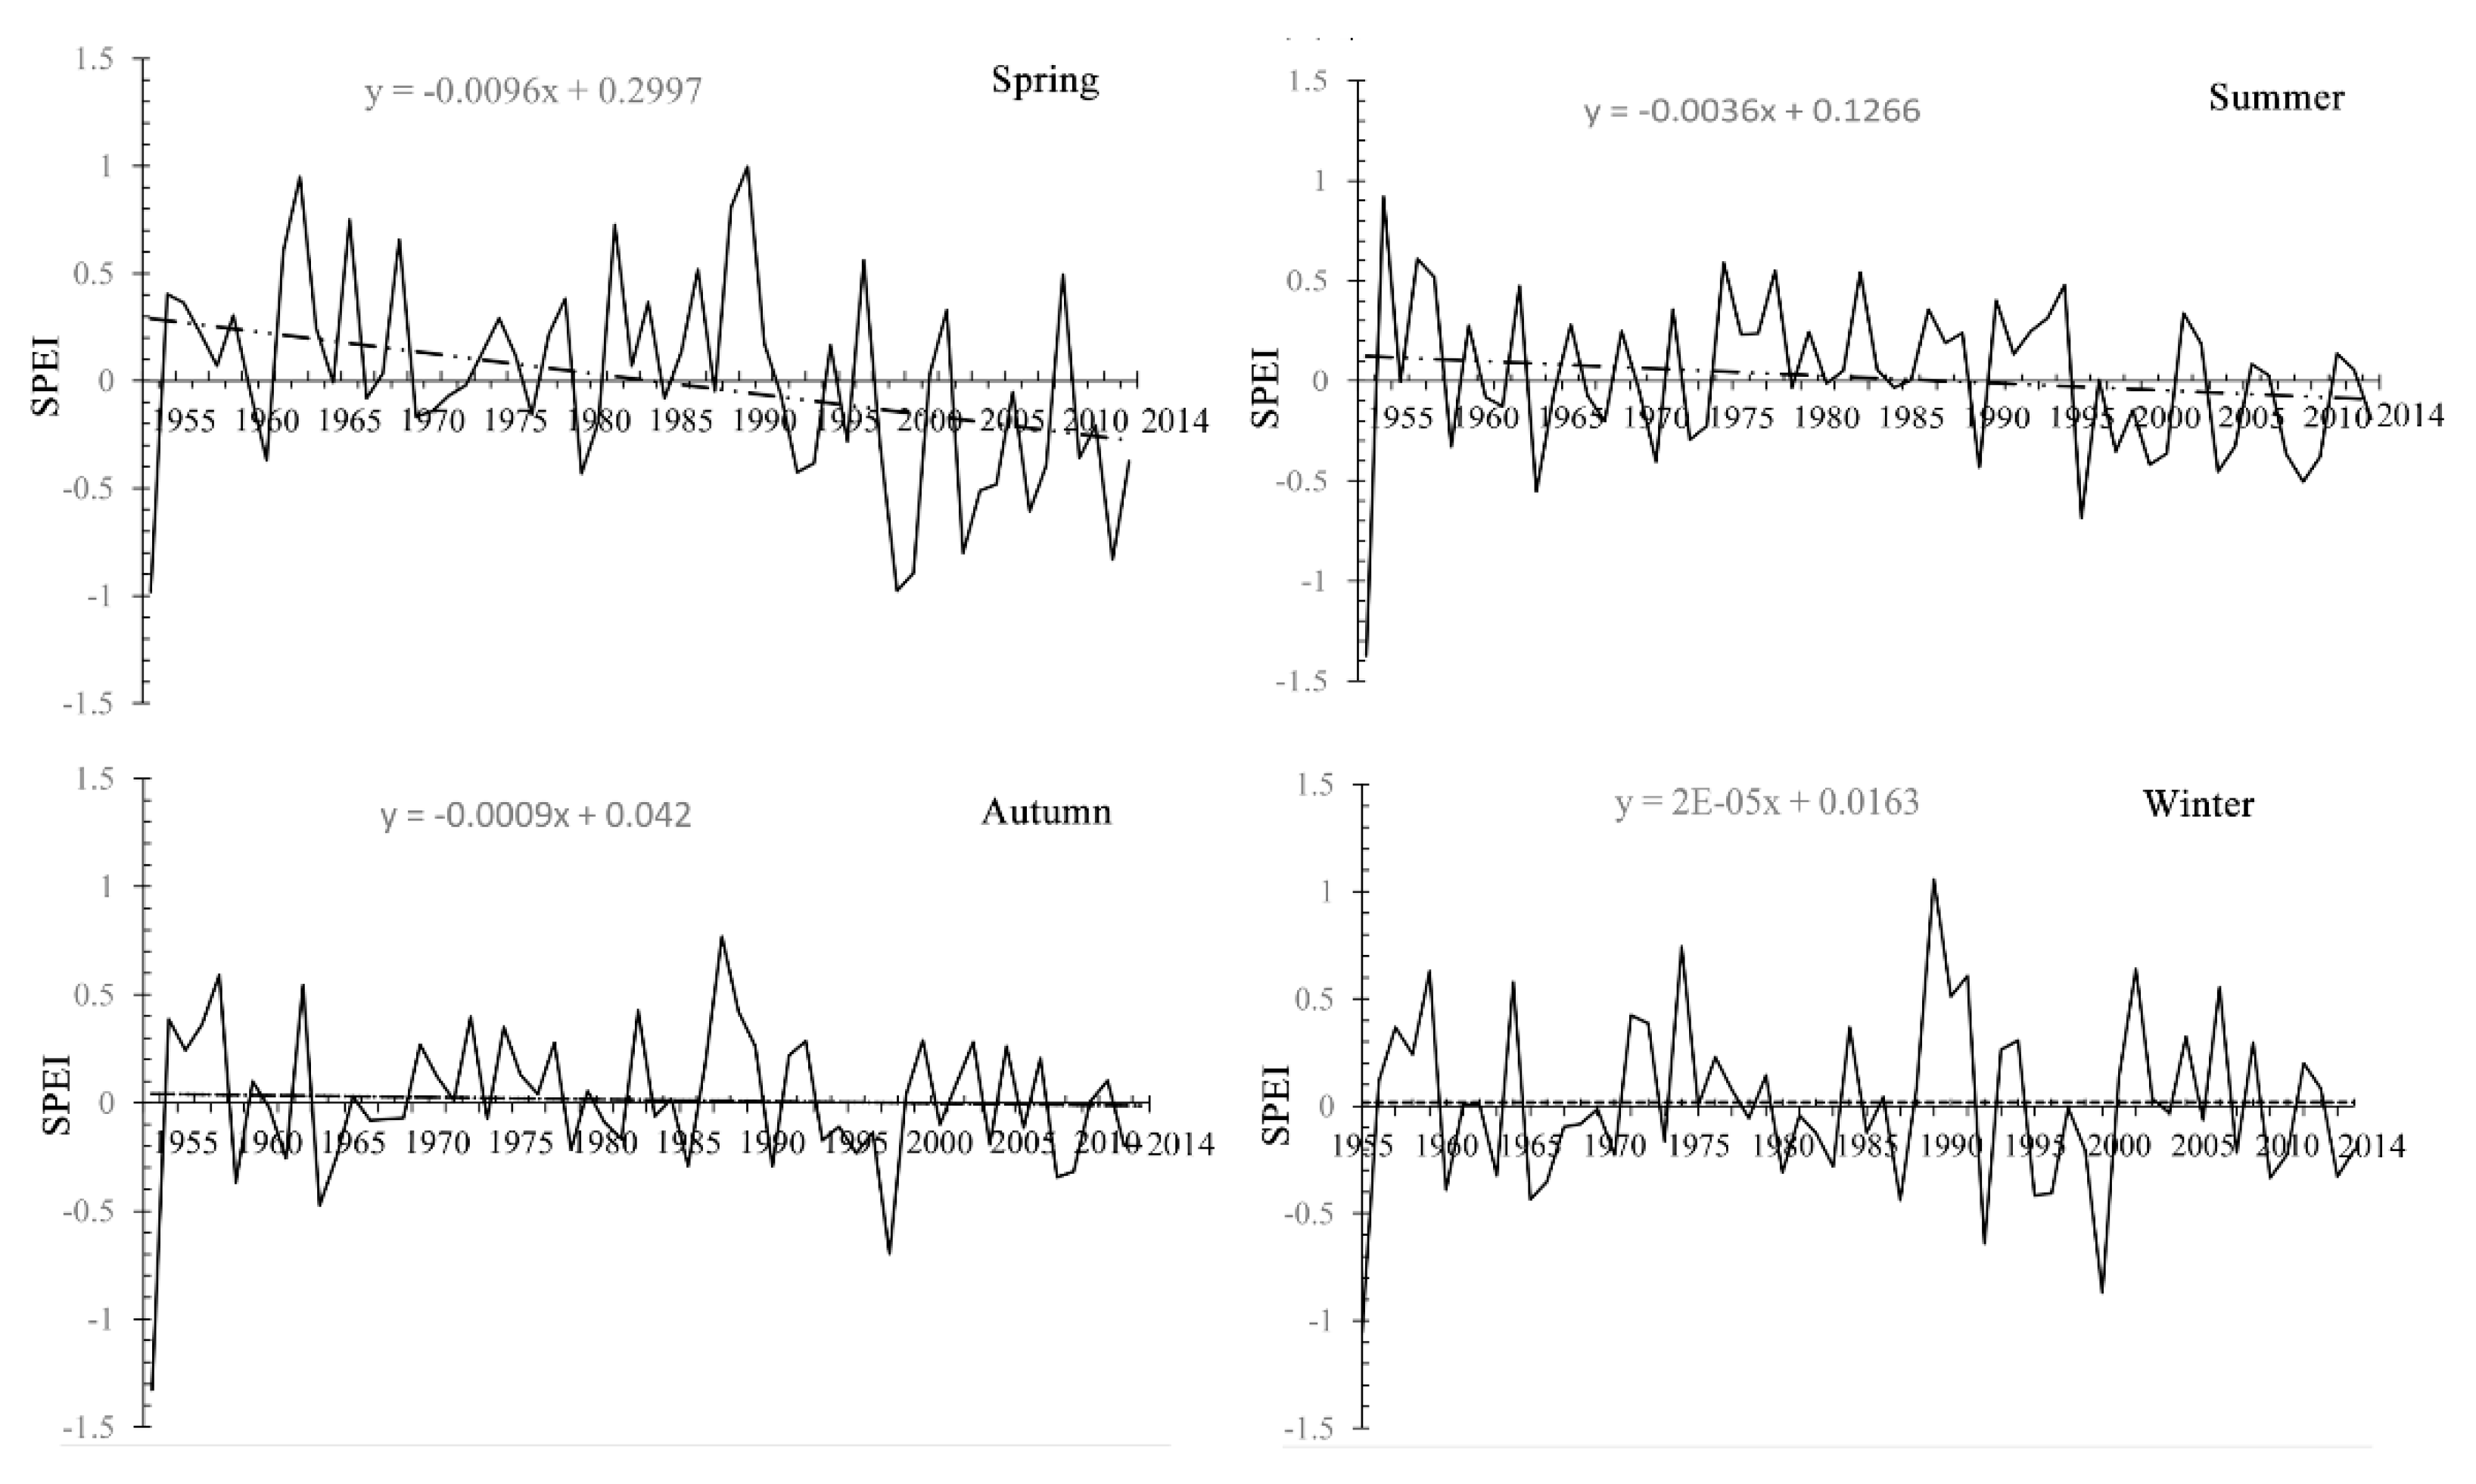
Due to the influence of the monsoon, the water and heat conditions of the Loess Plateau vary greatly during seasons; therefore, the analysis of the seasonal variation of SPEI can provide a more objective and in-depth understanding of the climate change in this region. SPEI below −0.5 indicates a year in which drought occurred (Table 1). According to the seasonal variation of SPEI on the Loess Plateau from 1955 to 2014 (Figure 2), the years with drought in spring were 1955, 1997, 1998, 1999, 2003, 2004, 2006, and 2012. In 1997, the smallest SPEI was detected, indicating that the drought was the most severe in that year, which was consistent with the continuous severe drought in the Yellow River basin in 1997, and the longest and highest times of flow interruption in the main flood season recorded in the Lijin station in the lower Yellow River [31]. The years with drought in summer were 1962 and 1995. The only year of autumn drought was 1996. The years of winter drought were 1992 and 1999. In general, the Loess Plateau shows a large fluctuation range in spring and winter, and remains relatively stable in summer and autumn; in spring, the trend was the most obvious, with a tendency rate of 0.096 10 a−1 (p < 0.01); in summer and autumn, the trend was lower, with tendencies of 0.036 10 a−1 and 0.009 10 a−1, respectively, but neither passed the significance test.
3.1.2. SPEI Monthly and Annual Variability Characteristics
According to the time series changes of the monthly SPEI scale (Figure 3a), the SPEI values is characterized by a general downward trend of −0.004 10 a−1 (p < 0.01), indicating that the drought on the Loess Plateau gradually increased from 1955 to 2014. Since 1997, the amplitude of the monthly SPEI fluctuations increased significantly, indicating that the moisture conditions fluctuated violently. The annual SPEI also exhibited an overall decreasing trend, with a trend rate higher than the monthly SPEI, reaching −0.137/10 a (p < 0.01). The fluctuation frequency of SPEI in a monthly time-scale was higher than the annual scale (Figure 3b), indicating that regional precipitation and temperature changes had significantly different effects on SPEI at different time scales. A larger time scale indicated a weaker impact of precipitation and temperature, while a shorter time scale indicated a stronger influence. The time series variation of the annual SPEI shows that the longtime sequence drought occurred from 1996 to 2014, which was a period of frequent droughts. According to the drought grading criteria (Table 1), light droughts occurred in 1966, 1998–2002, 2005–2007, and 2009 (SPEI < −0.5). The only year where moderate drought occurred (−1.5 < SPEI ≤ −1) was 1955, with the smallest SPEI value (the SPEI value generally maintained a downward trend −1.4), indicating the most severe drought. Figure 2c shows that the years with Pj ≥ 70% in the Loess Plateau during the recent 60 years were 1955, 1999, and 2000, respectively. Pj ≥ 50% indicates that more than half of the meteorological stations in the study area have regional drought [32], and the corresponding years were 1955, 1965, 1986, 1998, 1999, 2000, 2001, 2002, 2005, 2006, 2007, and 2010, which are 12 years in total. The average drought station proportion was 24.4%, and there were 17 years with a drought station proportion above 40%. The drought station proportion showed an obvious increasing trend, with an increasing rate of 0.056 10 a−1 (p < 0.01), indicating that the drought range of the Loess Plateau had a significant trend from 1955 to 2014.
3.1.3. Temporal Mutation Characteristics of Drought
The MK mutation test curve of SPEI changes in the Loess Plateau in spring (Figure 4a) shows that the Loess Plateau followed an obvious trend of drought since the early 1990s. In 2005, the UF curve exceeded the critical line (U0.05 = −1.96), indicating that the spring drought of the Loess Plateau was significantly intensified after 2005. The UF curve interested the UB curve in 1995, indicating that the drought in the early 1990s was a remarkable mutation, specifically beginning in 1995. The MK mutation test curve of SPEI variation in the Loess Plateau in summer (Figure 4b) showed an obvious trend of drought in 1996, and the intersection of UF and UB curves in 2002 and 2004 indicates this trend of drought has intensified significantly. However, the UF curve did not reach significance; therefore, the summer drought trend of the Loess Plateau was not significant. According to the MK mutation test curve of SPEI variation in the autumn of the Loess Plateau (Figure 4c), an obvious trend of drought has been found in autumn since 1975, and the UF curve exceeded the threshold in 1997, indicating a significant drought trend after 1997. At the same time, the UF curve and UB curve intersected in 1984, indicating that this year was a mutation year of autumn drought on the Loess Plateau. This is consistent with the results obtained by Zhao et al. [33] indicating that the temperature of the Loess Plateau increased significantly after 1997. The MK mutation test curve of SPEI variation in the Loess Plateau in winter (Figure 4d) shows that the UF and UB curves intersected many times, and the UF curve did not exceed the threshold, indicating that the dry and wet condition of the Loess Plateau fluctuated in winter. The MK mutation test curve of the annual SPEI variation in the Loess Plateau (Figure 4e) shows that the UF curve in the early 1990s followed a significant trend of drought, which is closely related to a significant increase of temperature in the early 1990s in the Loess Plateau. This indicates that drought is significantly affected by temperature. The UF curve exceeded the critical line in 2009, indicating that the Loess Plateau was significantly arid after 2009. The UF and UB curves intersected in 2000 and 2004, indicating a mutation change in the drought trend.
3.2. Analysis of Spatial Characteristics of Drought
3.2.1. Spatial Distribution of Drought Frequency
This enabled the effective identification of the spatial pattern of the frequency of drought in the Loess Plateau (Figure 5). Figure 5a–d shows that the areas with the highest drought frequency in spring are mainly distributed in Inner Mongolia, Shaanxi, and Shanxi provinces in the north of the Loess Plateau. Gansu province, Ningxia, and southern Shaanxi, followed by southern Shanxi, southeastern Shaanxi, and Henan province had the lowest drought frequency. The areas with high drought frequency in summer are mainly distributed in the northeast of the Loess Plateau, Inner Mongolia, the border area of Shaanxi and Shanxi provinces, and Henan, Shaanxi, and southern of Shanxi provinces. In autumn, arid regions are mainly distributed in Gansu province in the west of the Loess Plateau, and the lowest drought frequency was found for Henan province. In winter, the drought-prone areas are concentrated in the southwest margin of the Loess Plateau, mainly in the Qinling mountains, with the lowest drought frequency in Henan province, the south of Shanxi Province, and the southeast of Shaanxi province. Overall, Table 2 shows that the average drought frequency of the Loess Plateau is highest in spring (16.67%) and summer (14.32%), followed by autumn (14.14%), and winter (13.30%). The drought-prone provinces, mainly Inner Mongolia and Gansu, had a drought frequency of 16.89% and 16.20%, respectively, while Henan province had the lowest frequency of 5.6%.
Figure 5a–d shows that the western regions of Ningxia (12.15%), Shaanxi (12.05%), and Inner Mongolia (11.90%) have a higher frequency of light drought, while the eastern regions of Inner Mongolia (7.51%) and Gansu (7.43%) have a higher frequency of moderate drought. Most regions of Shanxi and Henan have a lower frequency of moderate drought. The areas with high probability for severe drought are mainly the north of Shaanxi, the southwest of Inner Mongolia, and the west of Ningxia. The frequency of extreme drought is extremely low in most areas of the Loess Plateau, with a 1–2% probability of extreme drought in Gansu province. In general, the frequency of drought in the northwest region of the Loess Plateau is higher than that in the southeast region, and high drought levels are concentrated in the western region, while the low drought levels are widely distributed throughout the entire Loess Plateau. A higher drought level indicates a lower frequency of occurrence, and a lower drought level indicates a higher frequency of occurrence. The frequency of light drought was highest (11.36%) and that of extreme drought was lowest (0.12%).
3.2.2. Spatial Distribution of Drought Intensity Levels
The spatial pattern of drought intensity in each season in the Loess Plateau was calculated based on the SPEI value (Figure 6a–d). Table 3 shows the statistical results of drought intensity for each province. The regions with higher drought intensity in spring were mainly distributed in Inner Mongolia, Ningxia, western and northern Shaanxi, and eastern Gansu. Of these, Ningxia, Inner Mongolia, and Shaanxi had higher drought intensities with averages of 0.89, 0.85, and 0.83 respectively. Henan province had the lowest drought intensity of 0.38. In summer, the drought intensity of the Loess Plateau is high and its affected range is large. Except for Henan province and a small part of Shanxi Province on the southeastern edge of the Loess Plateau, the drought intensities are relatively low. Inner Mongolia, Gansu, and Ningxia have the most severe droughts, with drought intensities of 0.93, 0.92, and 0.92, respectively. The intensity of drought decreased in autumn, mainly distributed in Ningxia, northern Shaanxi, central Inner Mongolia, and eastern Gansu. Gansu and Ningxia had the highest drought intensities (0.84 and 0.85, respectively), while Henan province and the eastern part of Shanxi Province had the lowest drought intensities (0.36 and 0.68, respectively). In winter, the drought intensity of the Loess Plateau is higher in the south, but lower in the middle and east. This may be due to the higher temperature in the southern Loess Plateau in winter, which accelerates the evaporation of water in the region and exacerbates drought. In general, the mean value of drought intensity in seasons was highest in summer (0.80), followed by spring (0.75), and autumn (0.72), and it was lowest in winter (0.62). The drought was most severe in Gansu (0.84) and Ningxia (0.83). The drought intensity in the northwest was higher than that in the southeast, and gradually decreased from northwest to southeast. The area with low drought intensity gradually increased from spring to winter.
Figure 6e–h shows the spatial pattern of different drought levels (light drought, moderate dryness, severe drought, and extreme drought) in the Loess Plateau. The regions characterized by the highest drought intensity under light drought level were concentrated in Inner Mongolia, Ningxia, western Gansu, Shaanxi, and northern Shanxi. The drought in Shaanxi and Inner Mongolia was the most severe, with average drought intensities of 0.75 and 0.74, respectively, while Henan had the lowest drought intensity with only 0.44. Compared to the light drought, the areas with high drought intensity under moderate drought level affected a smaller area, which was concentrated in Inner Mongolia, northern Shaanxi, northern Shanxi, and eastern Gansu. The area with the lowest drought intensity expanded from Henan province to the southeast of Shaanxi province. Under the severe drought level, the high value of drought intensity was distributed in Inner Mongolia, Ningxia, and northern Shaanxi. The areas with low drought intensity continued to expand westward, covering most of Shaanxi and eastern Gansu. The regions with high drought intensities under the extreme drought level were found in a small part of the eastern parts of Gansu and Qinghai. Regions with low drought intensity extended to most areas of the Loess Plateau, indicating that the probability of extreme drought on the Loess Plateau was extremely low and spatially concentrated in the interior of the Loess Plateau where extremely poor hydrothermal conditions are prevalent. In general, over the past 60 years, drought on the Loess Plateau has been dominated by light drought, with a spatial drought distribution similar to that of seasons. The provinces suffering the most severe droughts were Gansu province (0.92) and Ningxia province (0.89). The drought intensity shows a pattern of severe drought in the northwest and light drought in the southeast. With increasing drought intensity, the low value of drought intensity gradually expanded from the southeast to the northwest and covered most of the study area.
3.3. Persistence of Drought
According to the variation of SPEI in the Loess Plateau over the past 60 years, the R/S method was used to analyze the future variation trend of drought, and the obtained results are shown in Figure 7. The drought trend of the Loess Plateau in the future showed clear seasonal differences, indicating that the trend of the drought in each season was different. The Hurst indexes of SPEI in spring and summer were 0.82 and 0.80, respectively, both far exceeding 0.5. This shows a strong continuity, indicating that the existing warming trend (i.e., persistent drought) will continue. In autumn, the Hurst index of SPEI was 0.6, indicating a weak Hurst phenomenon and further indicating that the trend of drought in this region will continue in the future as a whole, while the extent of drought may be reduced in the future. In winter, the Hurst value will be 0.5, indicating that drought will be a random event in the future, and the time series of climate elements are not correlated. Overall, the Hurst index of interannual SPEI in the Loess Plateau is 0.82, indicating that the trend of drought may keep persistence in the future, but the intensity of persistence will differ in each season, and the trend during spring and summer probably will be more apparent, while the phenomenon of winter drought will be random.
4. Discussion
The drought in the early 1990s was a mutation phenomenon, specifically beginning in 1995. This result directly reflects that the abrupt change of temperature on the Loess Plateau has significantly increased since 1990 [26] and the abrupt change of precipitation in the mid-1980s or early 1990s has significantly decreased [34]. The mean drought frequency of the Loess Plateau was highest in spring (16.67%) and summer (14.32%), followed by autumn (14.14%), and winter (13.30%). The drought intensity was highest in summer (0.80), followed by spring (0.75), autumn (0.72), and winter (0.62). The results of the ranking of drought intensity in seasons that showed the highest frequency of spring drought on the Loess Plateau were consistent with the conclusions of relevant studies [35,36]. According to the research on drought frequency of the Yellow River basin [24], the seasonal ranking of drought intensity was consistent; however, the ranking of drought frequency is summer > spring > autumn > winter partially differs from the conclusion of this study. On the one hand, this could be ascribed to the different number and location of selected meteorological stations; on the other hand, these results are inconsistent with the research period and scope. The study found that the drought station proportion on the Loess Plateau showed a clear increasing trend, with an increasing rate of 0.056 10 a−1, indicating that the drought scope was continuously expanding. The Hurst index of interannual SPEI was 0.82, indicating that the drought trend of the Loess Plateau will be highly persistent in the future, which was consistent with the conclusion that the drought in the Yellow River basin was aggravated by the analysis of the spatial and temporal variation characteristics of drought with regard to drought scope, frequency, and trend [37,38]. In China, an average of 6.67–26.67 million hm2 of farmland is affected by drought every year (up to 40 million hm2) and the annual output of grain will be reduced significantly to 30 million t [39]. Therefore, future research needs to focus on the spatial pattern of drought during the crop growing season and its response to climate change, and explore the occurrence and evolution of agricultural drought under climate change and its impact on the net primary productivity of farmland, to provide a drought-resistant basis for agricultural production in the Loess Plateau from the perspective of meteorological drought.
5. Conclusions
This study used SPEI as the drought index, and quantitatively analyzed the spatial and temporal pattern of drought. Furthermore, its future trend was predicted from the aspects of inter-annual variation, seasonal variation, frequency, and intensity of drought. The following conclusions were obtained:
- (1)
- For the annual time scale of drought in the Loess Plateau, drought occurred in a long-term sequence from 1996 to 2014, which was a period of frequent drought. At seasonal scale, SPEI fluctuates widely in spring and winter, and remains relatively stable in summer and autumn. In spring, the tendency was most obvious (0.096/10 a). In summer and autumn, the tendency was lower, 0.036 10/a and 0.009/10 a, respectively; in winter, the trend was not obvious. On a monthly scale, SPEI maintained a decline rate of −0.004/10 a.
- (2)
- The average drought frequency of the Loess Plateau was highest in spring and summer, followed by autumn and lowest in winter. Drought events in Inner Mongolia and Gansu, had a drought frequency of 16.89% and 16.20% respectively, while Henan province had the lowest frequency of 5.6%. At each drought level, a higher drought level indicated a lower frequency of occurrence, and a lower drought level indicated a higher frequency of occurrence. The frequency of light drought was highest and that of extreme drought was lowest.
- (3)
- The mean drought intensity was highest in summer, followed by spring and autumn, and was lowest in winter. The seasonal drought intensity was highest in summer, followed by spring and autumn, and lowest in winter. The drought was most severe in Gansu and Ningxia. The drought intensity in the northwest was higher than in the southeast, and gradually decreased from northwest to southeast. Over the past 60 years, the loess plateau has been mainly affected by light drought, and provinces that suffered the most severe drought events were Gansu and Ningxia.
- (4)
- The interannual Hurst index of SPEI in the Loess Plateau was 0.82, indicating that the future trend of drought will continue, but the duration intensity of each season will differ. The Hurst indexes of SPEI in spring and summer were 0.82 and 0.80, respectively, indicating a strong persistence of drought. SPEI’s Hurst index was 0.6 for autumn, indicating that the trend toward drought continues but the extent decreased. In winter, the obtained Hurst value was 0.5, and winter drought will turn into a random event.
Author Contributions
Y.L. performed analysis, discussions, and developed the text. Y.L., Z.X. and Y.Q. designed the research. H.X., Z.Z. provided comments for the approaches and read the draft.
Funding
This research was supported and funded by the National Natural Science Foundation of China (No.41671536; No.41501588), and the International Cooperation Laboratory of Geospatial Technology for Henan province (No.152102410024).
Acknowledgments
The authors would like to give special thanks to the National Science and Technology Infrastructure of China, Data Sharing Infrastructure of Earth System Science -Data Center of Lower Yellow River Regions (http://henu.geodata.cn).
Conflicts of Interest
The authors declared no conflict of interest.
References
- Intergovernmental Panel on Climate Change. Climate Change 2013–The Physical Science Basis: Working Group I Contribution to the Fifth Assessment Report of the Intergovernmental Panel on Climate Change; Cambridge University Press: Cambridge, UK, 2014.
- Zhang, Q.; Zhang, L.; Cui, X.C.; Zeng, J. Progresses and Challenges in Drought Assessment and Monitoring. Adv. Earth Sci. 2011, 26, 763–778. [Google Scholar]
- Zhang, B.; Zhu, J.J.; Liu, H.M.; Pan, Q.M. Effects of extreme rainfall and drought events on grassland ecosystems. Chin. J. Plant Ecol. 2014, 38, 1008–1018. [Google Scholar]
- Fu, C.B.; Ma, Z.G. Global change and regional aridification. Chin. J. Atmos. Sci. 2008, 32, 752–760. [Google Scholar]
- Ma, Z.G.; Fu, C.B. Characteristics of aridification over northern China during 1951–2004. Chin. Sci. Bull. 2006, 51, 2429–2439. [Google Scholar] [CrossRef]
- Chen, H.P.; Sun, J.Q. Anthropogenic warming has caused hot droughts more frequently in China. J. Hydrol. 2017, 544, 306–318. [Google Scholar] [CrossRef]
- Wang, L.Y.; Yuan, X.; Xie, Z.H.; Wu, P.L.; Li, Y.H. Increasing flash droughts over China during the recent global warming hiatus. Sci. Rep. 2016, 6, 30571. [Google Scholar] [CrossRef] [PubMed] [Green Version]
- Hu, Q.; Pan, F.F.; Pan, X.B.; Zhang, D.; Li, Q.Y.; Pan, Z.H.; Wei, Y.R. Spatial analysis of climate change in Inner Mongolia during 1961–2012, China. Appl. Geogr. 2015, 60, 254–260. [Google Scholar] [CrossRef]
- Sun, Z.H.; Wang, Z.L.; Cao, X.M.; Yang, Q.; Liu, Z.C.; Lei, Y.P. Characteristics of drought change in the Loess Plateau Area of Shaanxi based on the Standardized Precipitation Index during 1971–2010. J. Desert Res. 2013, 33, 1560–1567. [Google Scholar]
- Zhang, T.F.; Zhang, B.; Zhang, M.; Liu, X.L.; Sun, L.W.; An, M.L. Spatiotemporal pattern of drought in Loess Plateau of Gansu Province, Northwest China in 1961–2010. Chin. J. Ecol. 2012, 31, 2066–2074. [Google Scholar]
- Wang, Y.R. Characteristics of soil drought at Loess Plateau of China. Arid Land Geogr. 2008, 31, 38–43. [Google Scholar]
- Zhang, J.; Man, Z.M.; Xiao, W.W.; Shen, Z.Z. Research on sequence reconstruction and characteristics diagnosis of droughts and floods in the Middle Yellow River since the Qing Dynasty: 1644–2009. Geogr. Res. 2013, 32, 1579–1590. [Google Scholar]
- Huang, S.Z.; Huang, Q.; Chang, J.X.; Zhu, Y.L.; Leng, G.Y.; Xing, L. Drought structure based on a nonparametric multivariate standardized drought index across the Yellow River basin, China. J. Hydrol. 2015, 530, 127–136. [Google Scholar] [CrossRef]
- Xu, J.W.; Ju, H.; Liu, Q.; Yang, J.Y. Variation of drought and regional response to climate change in Huang-Huai-Hai Plain. Acta Ecol. Sin. 2014, 34, 460–470. [Google Scholar]
- Ma, Q.; Zhang, B.; Wang, D.; Zhang, Y.Z.; Ji, D.M.; Yang, S.W. The temporal and spatial distribution of drought on the Loess Plateau based on the Standardized Precipitation Evapotranspiration Index from 1960 to 2012. Resour. Sci. 2014, 36, 1834–1840. [Google Scholar]
- Yao, Y.B.; Wang, J.S.; Wang, Y.; Yang, J.H.; Li, J.F.; Lei, J. Anomaly temporal-spatial distribution of spring drought on Loess Plateau in China. Plateau Meteorol. 2015, 34, 30–38. [Google Scholar]
- Yao, Y.B.; Wang, R.Y.; Yang, J.H.; Yue, P.; Lu, D.R.; Ju, G.; Wang, X.Y.; Liu, L.C. Changes in terrestrial surface dry and wet conditions on the Loess Plateau (China)during the last half century. J. Arid Land 2013, 5, 15–24. [Google Scholar] [CrossRef]
- Ren, J.Y.; Peng, S.Z.; Cao, Y.; Huo, X.Y.; Chen, Y.P. Spatiotemporal Distribution Characteristics of Climate Change in the Loess Plateau from 1901 to 2014. J. Nat. Resour. 2018, 33, 621–633. [Google Scholar]
- Palmer, W.C. Meteorological Drought Research; U S Weather Bureau: Washington, DC, USA, 1965; p. 45.
- Mckee, T.B.; Doesken, N.J.; Kleist, J. The relationship of drought frequency and duration to time scales. Bull. Am. Meteorol. Soc. 1993, 58, 174–184. [Google Scholar]
- Vicente-Serrano, S.M.; Beguería, S.; López-Moreno, J.I. A multiscalar drought index sensitive to global warming: The standardized precipitation evapotranspiration index. J. Clim. 2010, 23, 1696–1718. [Google Scholar] [CrossRef]
- Dubrovsky, M.; Svoboda, M.D.; Trnka, M.; Hayes, M.J.; Wilhite, D.A.; Zalud, Z.; Hlavinka, P. Application of relative drought indices in assessing climate-change impacts on drought conditions in Czechia. Theor. Appl. Climatol. 2009, 96, 155–171. [Google Scholar] [CrossRef]
- Zhang, Y.J.; Wang, C.Y.; Zhang, J.Q. Analysis of the spatial and temporal characteristics of drought in the North China plain based on standardized precipitation evapotranspiration index. Acta Ecol. Sin. 2015, 35, 7097–7107. [Google Scholar]
- Wang, F.; Wang, Z.M.; Yang, H.B.; Zhao, Y. Study of the temporal and spatial patterns of drought in the Yellow River basin based on SPEI. Sci. China Earth Sci. 2018, 61, 1098–1111. [Google Scholar] [CrossRef]
- López-Moreno, J.I.; Vicente-Serrano, S.M.; Zabalza, J.; Beguería, S.; Lorenzo-Lacruz, J.; Azorin-Molina, C.; Morán-Tejeda, E. Hydrological response to climate variability at different time scales: A study in the Ebro basin. J. Hydrol. 2013, 477, 175–188. [Google Scholar] [CrossRef] [Green Version]
- Liu, Y.F.; Yuan, Z.H.; Li, W.Z.; Kong, W.; Zhang, L.; Wu, L. Extreme and persistent analysis of drought-flood variation in the Loess Plateau during 1961–2013. Geogr. Res. 2017, 36, 345–360. [Google Scholar]
- Zhang, B.Q.; Zhao, X.N.; Jin, J.M.; Wu, P. Development and evaluation of a physically based multiscalar drought index: The standardized moisture anomaly index. J. Geophys. Res. Atmos. 2015, 120, 11575–11588. [Google Scholar] [CrossRef]
- Zhao, H.Y.; Gao, G.; An, W.; Zou, X.K.; Li, H.T.; Hou, M.T. Timescale differences between SC-PDSI and SPEI for drought monitoring in China. Phys. Chem. Earth Parts A/B/C 2017, 102, 48–58. [Google Scholar] [CrossRef]
- Hurst, E.H. Long-term storage capacity of reservoirs. Trans. Am. Soc. Civ. Eng. 1951, 116, 770–808. [Google Scholar]
- Ray, R.; Khondekar, M.H.; Ghosh, K.; Bhattacharjee, A.K. Scaling and nonlinear behaviour of daily mean temperature time series across India. Chaos Solitons Fractals 2016, 84, 9–14. [Google Scholar] [CrossRef]
- Liu, P.; Peng, M.X.; Zhou, K.J.; Qiu, S.H.; Wang, G.S. Analysis on Meteorological Contributing Factors of Arid during Flood Season in 1997 in the Yellow River Basin. Meteorol. J. Henan 2000, 3, 22–24. [Google Scholar]
- Huang, W.H.; Yang, X.G.; Li, M.S.; Zhang, X.Y.; Wang, M.T.; Dai, S.W.; Ma, J.H. Evolution characteristics of seasonal drought in the south of China during the past 58 years based on standardized precipitation index. Trans. Chin. Soc. Agric. Eng. 2010, 26, 50–59. [Google Scholar]
- Zhao, A.Z.; Liu, X.F.; Zhu, X.F.; Pan, Y.Z.; Zhao, Y.L.; Wang, D. Trend variations and spatial difference of extreme air temperature events in the Loess Plateau from 1965 to 2013. Geogr. Res. 2016, 35, 639–652. [Google Scholar]
- Wang, Q.X.; Fan, X.H.; Wang, M.B. Precipitation trends during 1961–2010 in the Loess Plateau region of China. Acta Ecol. Sin. 2011, 31, 5512–5523. [Google Scholar]
- Yao, Y.B.; Wang, R.Y.; Wang, J.S.; Wang, Y.; Yang, J.H.; Li, J.F.; Lei, J. Decadal Variation in Spring Drought for the Loess Plateau, China. Resour. Sci. 2014, 36, 1029–1036. [Google Scholar]
- Wang, X.F.; Hu, C.Y.; Wei, W.; Yu, Y. Temporal and Spatial Characteristics of Drought Based on Standardized Precipitation Index in Weibei Loess Plateau. Ecol. Environ. Sci. 2016, 25, 415–421. [Google Scholar]
- Peng, G.H.; Xia, J.; Ma, X.F.; Ma, J.Q. Analysis on Drought Frequency Distribution and Digital Characteristics of Number of Turns of the Yellow River Basin. Yellow River 2011, 33, 3–13. [Google Scholar]
- She, D.X.; Xia, J. The spatial and temporal analysis of dry spells in the Yellow River basin, China. Stoch. Environ. Res. Risk Assess. 2013, 27, 29–42. [Google Scholar] [CrossRef]
- Yao, G.Z.; Yuan, M. International experience and reference of drought early warning system construction. China Emerg. Manag. 2010, 43–48. [Google Scholar]
Figure 1.
Distribution of the study area in China (a) and meteorological stations in the Loess Plateau (b).
Figure 1.
Distribution of the study area in China (a) and meteorological stations in the Loess Plateau (b).

Figure 2.
Seasonal variations of SPEI on the Loess Plateau from 1955 to 2014.

Figure 3.
SPEI at the monthly (a) and annual scales (b) and drought station proportion (c).

Figure 4.
The Mann-Kendall test of drought in the Loess Plateau ((a) Spring, (b) Summer, (c) Autumn, (d) Winter, (e) Yearly).
Figure 4.
The Mann-Kendall test of drought in the Loess Plateau ((a) Spring, (b) Summer, (c) Autumn, (d) Winter, (e) Yearly).

Figure 5.
Drought frequency in different seasons and different drought levels of each meteorological station.
Figure 5.
Drought frequency in different seasons and different drought levels of each meteorological station.

Figure 6.
Drought intensity in different seasons and different drought levels of each meteorological station.
Figure 6.
Drought intensity in different seasons and different drought levels of each meteorological station.

Figure 7.
Interannual and seasonal Hurst index in the Loess Plateau from 1955 to 2014.


Table 1.
The drought level of SPEI in the Loess Plateau.
| Drought Level | No Dry | Light Drought | Moderate Dryness | Severe Dryness | Extremely Dryness |
|---|---|---|---|---|---|
| SPEI | −0.5 < SPEI | −1.0 < SPEI ≤ −0.5 | −1.5 < SPEI ≤ −1.0 | −2.0 < SPEI ≤ −1.5 | SPEI ≤ −2.0 |
Table 2.
Drought frequency of different seasons and different drought levels.
| Province | Area (104 km) | Spring (%) | Summer (%) | Autumn (%) | Winter (%) | Mean (%) | Light Drought (%) | Moderate Dryness (%) | Severe Dryness (%) | Extreme Dryness (%) | Mean (%) |
|---|---|---|---|---|---|---|---|---|---|---|---|
| Gansu | 10.92 | 16.23 | 15.28 | 17.11 | 16.19 | 16.20 | 11.63 | 7.43 | 1.62 | 0.51 | 5.30 |
| Shanxi | 0.01 | 16.22 | 14.88 | 14.40 | 12.75 | 14.56 | 11.47 | 5.58 | 1.30 | 0 | 4.59 |
| Henan | 1.81 | 18.30 | 7.03 | 5.71 | 5.60 | 9.16 | 9.06 | 3.36 | 0.36 | 0 | 3.20 |
| Nei Mongol | 15.53 | 18.88 | 17.83 | 15.53 | 15.31 | 16.89 | 11.90 | 7.51 | 2.23 | 0 | 5.41 |
| Ningxia | 5.25 | 17.05 | 14.40 | 16.76 | 14.62 | 15.71 | 12.15 | 6.51 | 2.75 | 0.12 | 5.38 |
| Qinghai | 3.38 | 12.62 | 15.92 | 15.10 | 14.77 | 14.60 | 11.27 | 4.03 | 2.33 | 0.22 | 4.46 |
| Shaanxi | 13.05 | 17.37 | 14.88 | 14.40 | 13.87 | 15.13 | 12.05 | 6.49 | 1.30 | 0 | 4.96 |
| Mean | 16.67 | 14.32 | 14.14 | 13.30 | 11.36 | 5.84 | 1.70 | 0.12 |
Table 3.
Drought intensity of different seasons and different drought levels.
| Province | Area (104 km) | Spring | Summer | Autumn | Winter | Mean | Light Drought | Moderate Dryness | Severe Dryness | Extreme Dryness | Mean |
|---|---|---|---|---|---|---|---|---|---|---|---|
| Gansu | 10.92 | 0.82 | 0.92 | 0.85 | 0.75 | 0.84 | 0.73 | 1.21 | 1.10 | 0.64 | 0.92 |
| Shanxi | 15.94 | 0.73 | 0.79 | 0.68 | 0.49 | 0.67 | 0.65 | 1.12 | 0.93 | 0.00 | 0.68 |
| Henan | 1.81 | 0.38 | 0.38 | 0.36 | 0.33 | 0.36 | 0.44 | 0.72 | 0.19 | 0.00 | 0.34 |
| Nei Mongol | 15.53 | 0.85 | 0.93 | 0.75 | 0.74 | 0.82 | 0.75 | 1.22 | 1.37 | 0.00 | 0.84 |
| Ningxia | 5.25 | 0.89 | 0.92 | 0.84 | 0.65 | 0.83 | 0.73 | 1.21 | 1.46 | 0.14 | 0.89 |
| Qinghai | 3.38 | 0.73 | 0.77 | 0.74 | 0.71 | 0.74 | 0.62 | 0.67 | 0.59 | 0.63 | 0.63 |
| Shaanxi | 13.05 | 0.83 | 0.87 | 0.82 | 0.69 | 0.80 | 0.70 | 1.17 | 1.05 | 0.00 | 0.73 |
| Mean | 0.75 | 0.80 | 0.72 | 0.62 | 0.66 | 1.05 | 0.96 | 0.20 |
© 2019 by the authors. Licensee MDPI, Basel, Switzerland. This article is an open access article distributed under the terms and conditions of the Creative Commons Attribution (CC BY) license (http://creativecommons.org/licenses/by/4.0/).
Share and Cite
MDPI and ACS Style
Li, Y.; Xie, Z.; Qin, Y.; Xia, H.; Zheng, Z.; Zhang, L.; Pan, Z.; Liu, Z. Drought Under Global Warming and Climate Change: An Empirical Study of the Loess Plateau. Sustainability 2019, 11, 1281. https://doi.org/10.3390/su11051281
AMA Style
Li Y, Xie Z, Qin Y, Xia H, Zheng Z, Zhang L, Pan Z, Liu Z. Drought Under Global Warming and Climate Change: An Empirical Study of the Loess Plateau. Sustainability. 2019; 11(5):1281. https://doi.org/10.3390/su11051281
Chicago/Turabian StyleLi, Yang, Zhixiang Xie, Yaochen Qin, Haoming Xia, Zhicheng Zheng, Lijun Zhang, Ziwu Pan, and Zhenzhen Liu. 2019. "Drought Under Global Warming and Climate Change: An Empirical Study of the Loess Plateau" Sustainability 11, no. 5: 1281. https://doi.org/10.3390/su11051281
Note that from the first issue of 2016, this journal uses article numbers instead of page numbers. See further details here.