Prediction of Confusion Attempting Algebra Homework in an Intelligent Tutoring System through Machine Learning Techniques for Educational Sustainable Development


Abstract
1. Introduction
ASSISTments (ITS)
- ▪
- Can we categorize which machine learning algorithms are the best fit to classify mastery skill learning confusion among the students using skill-builder in an intelligent tutoring system from chosen skills?
2. Related Works
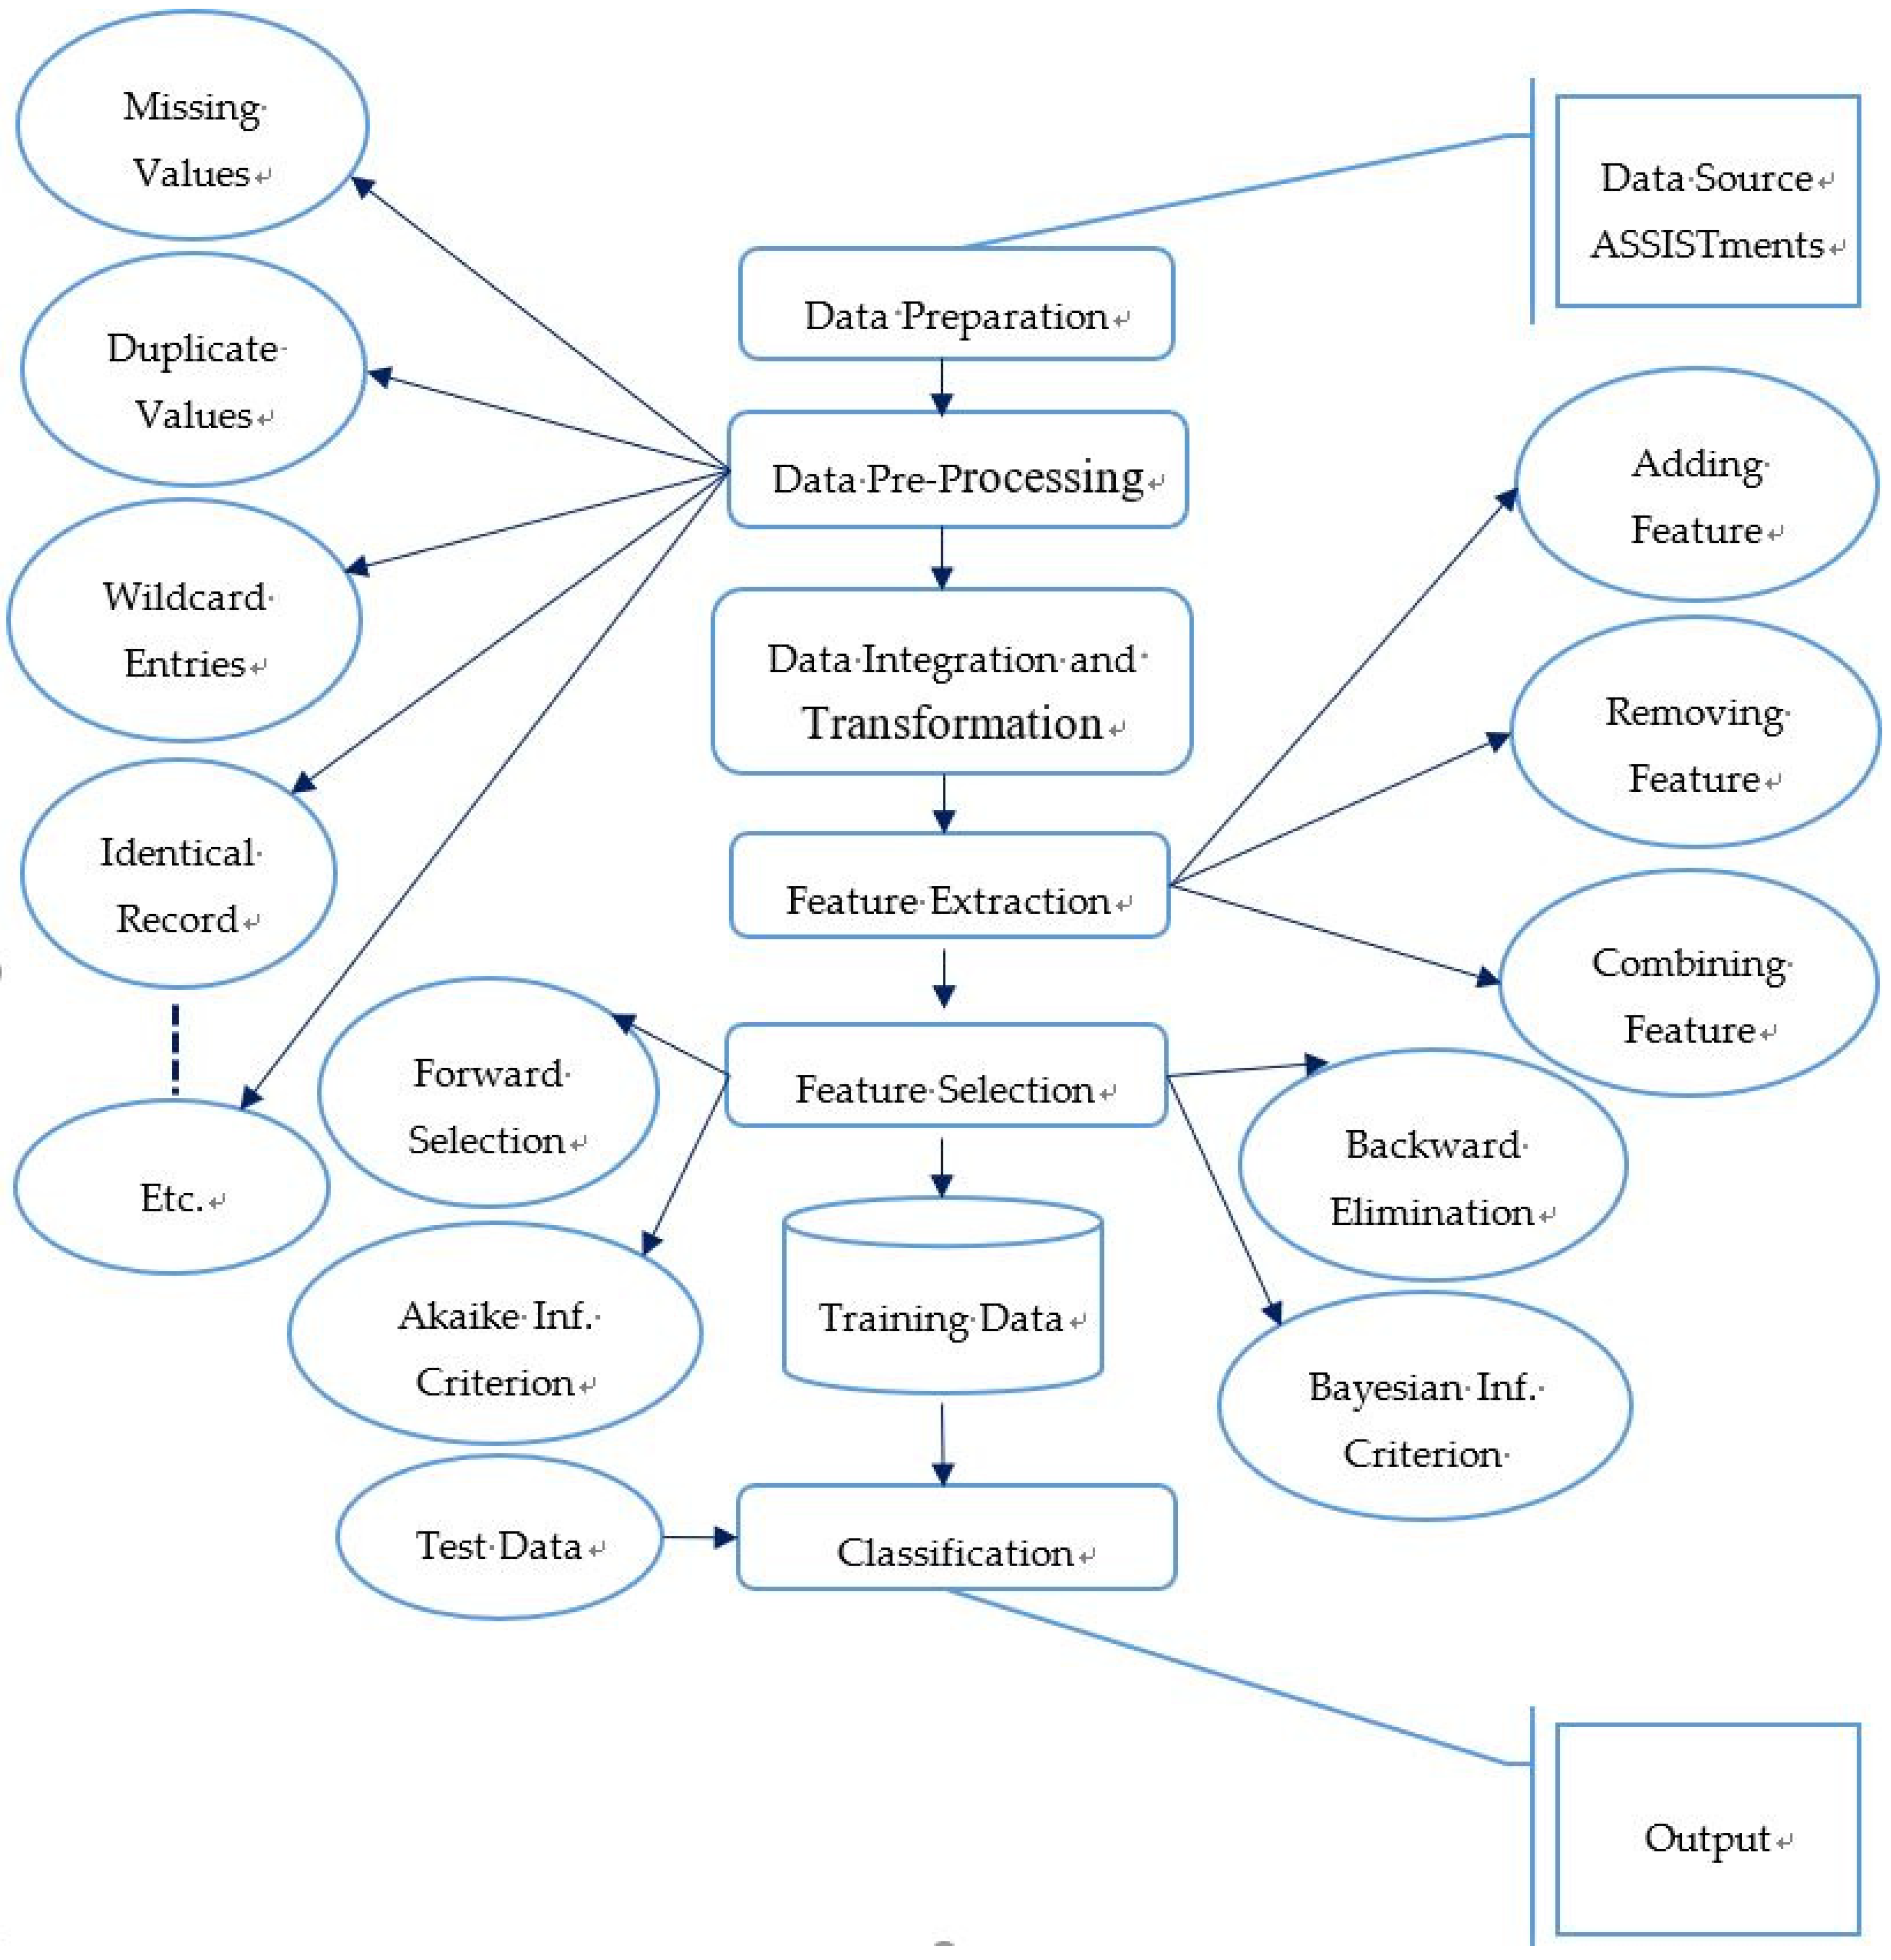
3. Methods
3.1. Preparation of Data
- Questions based on one specific skill; a question can have multiple skill tagging’s.
- Students must answer three questions correctly in a row to complete the assignment.
- If a student uses the tutoring (“Hint” or “Break this Problem into Steps”), the question will be marked incorrect.
- Students will know immediately if they answered the question correctly.
- If a student is unable to figure out the problem on his or her own, the last hint will answer.
- Currently, this feature is only available for math problem sets.
3.1.1. Measurements and Covariates
- Original: If ‘0’ means scaffolding problem, and other than ‘0’ means the main problem.
- Attempt_count: Number of times a student entered an answer.
- Ms_first_response: Time between the start time and first student action.
- Correct: If ‘0’ means Incorrect on first attempt otherwise correct.
- Hint_total: Number of possible hints on the problem.
- Overlap_time: This is meant to be the time taken by student to finish the problem.
- Opportunity: The number of opportunities each student has to practice on the skill.
3.1.2. Discretization of Predicted Variable
- If (attempt_count) > Total mean (attempt_count)
- and (correct) < Total mean (correct)
- and (overlap_time) > Total mean (overlap_time) then (Confuse) otherwise (Not Confuse)
3.1.3. Experimental Manipulations or Interventions
3.1.4. Statistical Analysis
3.2. Pre-Processing of Data
3.3. Integration and Transformation of Data
3.4. Feature Extraction
3.5. Feature Selection
3.6. Training of Model
3.7. Testing and Evaluation of the Model
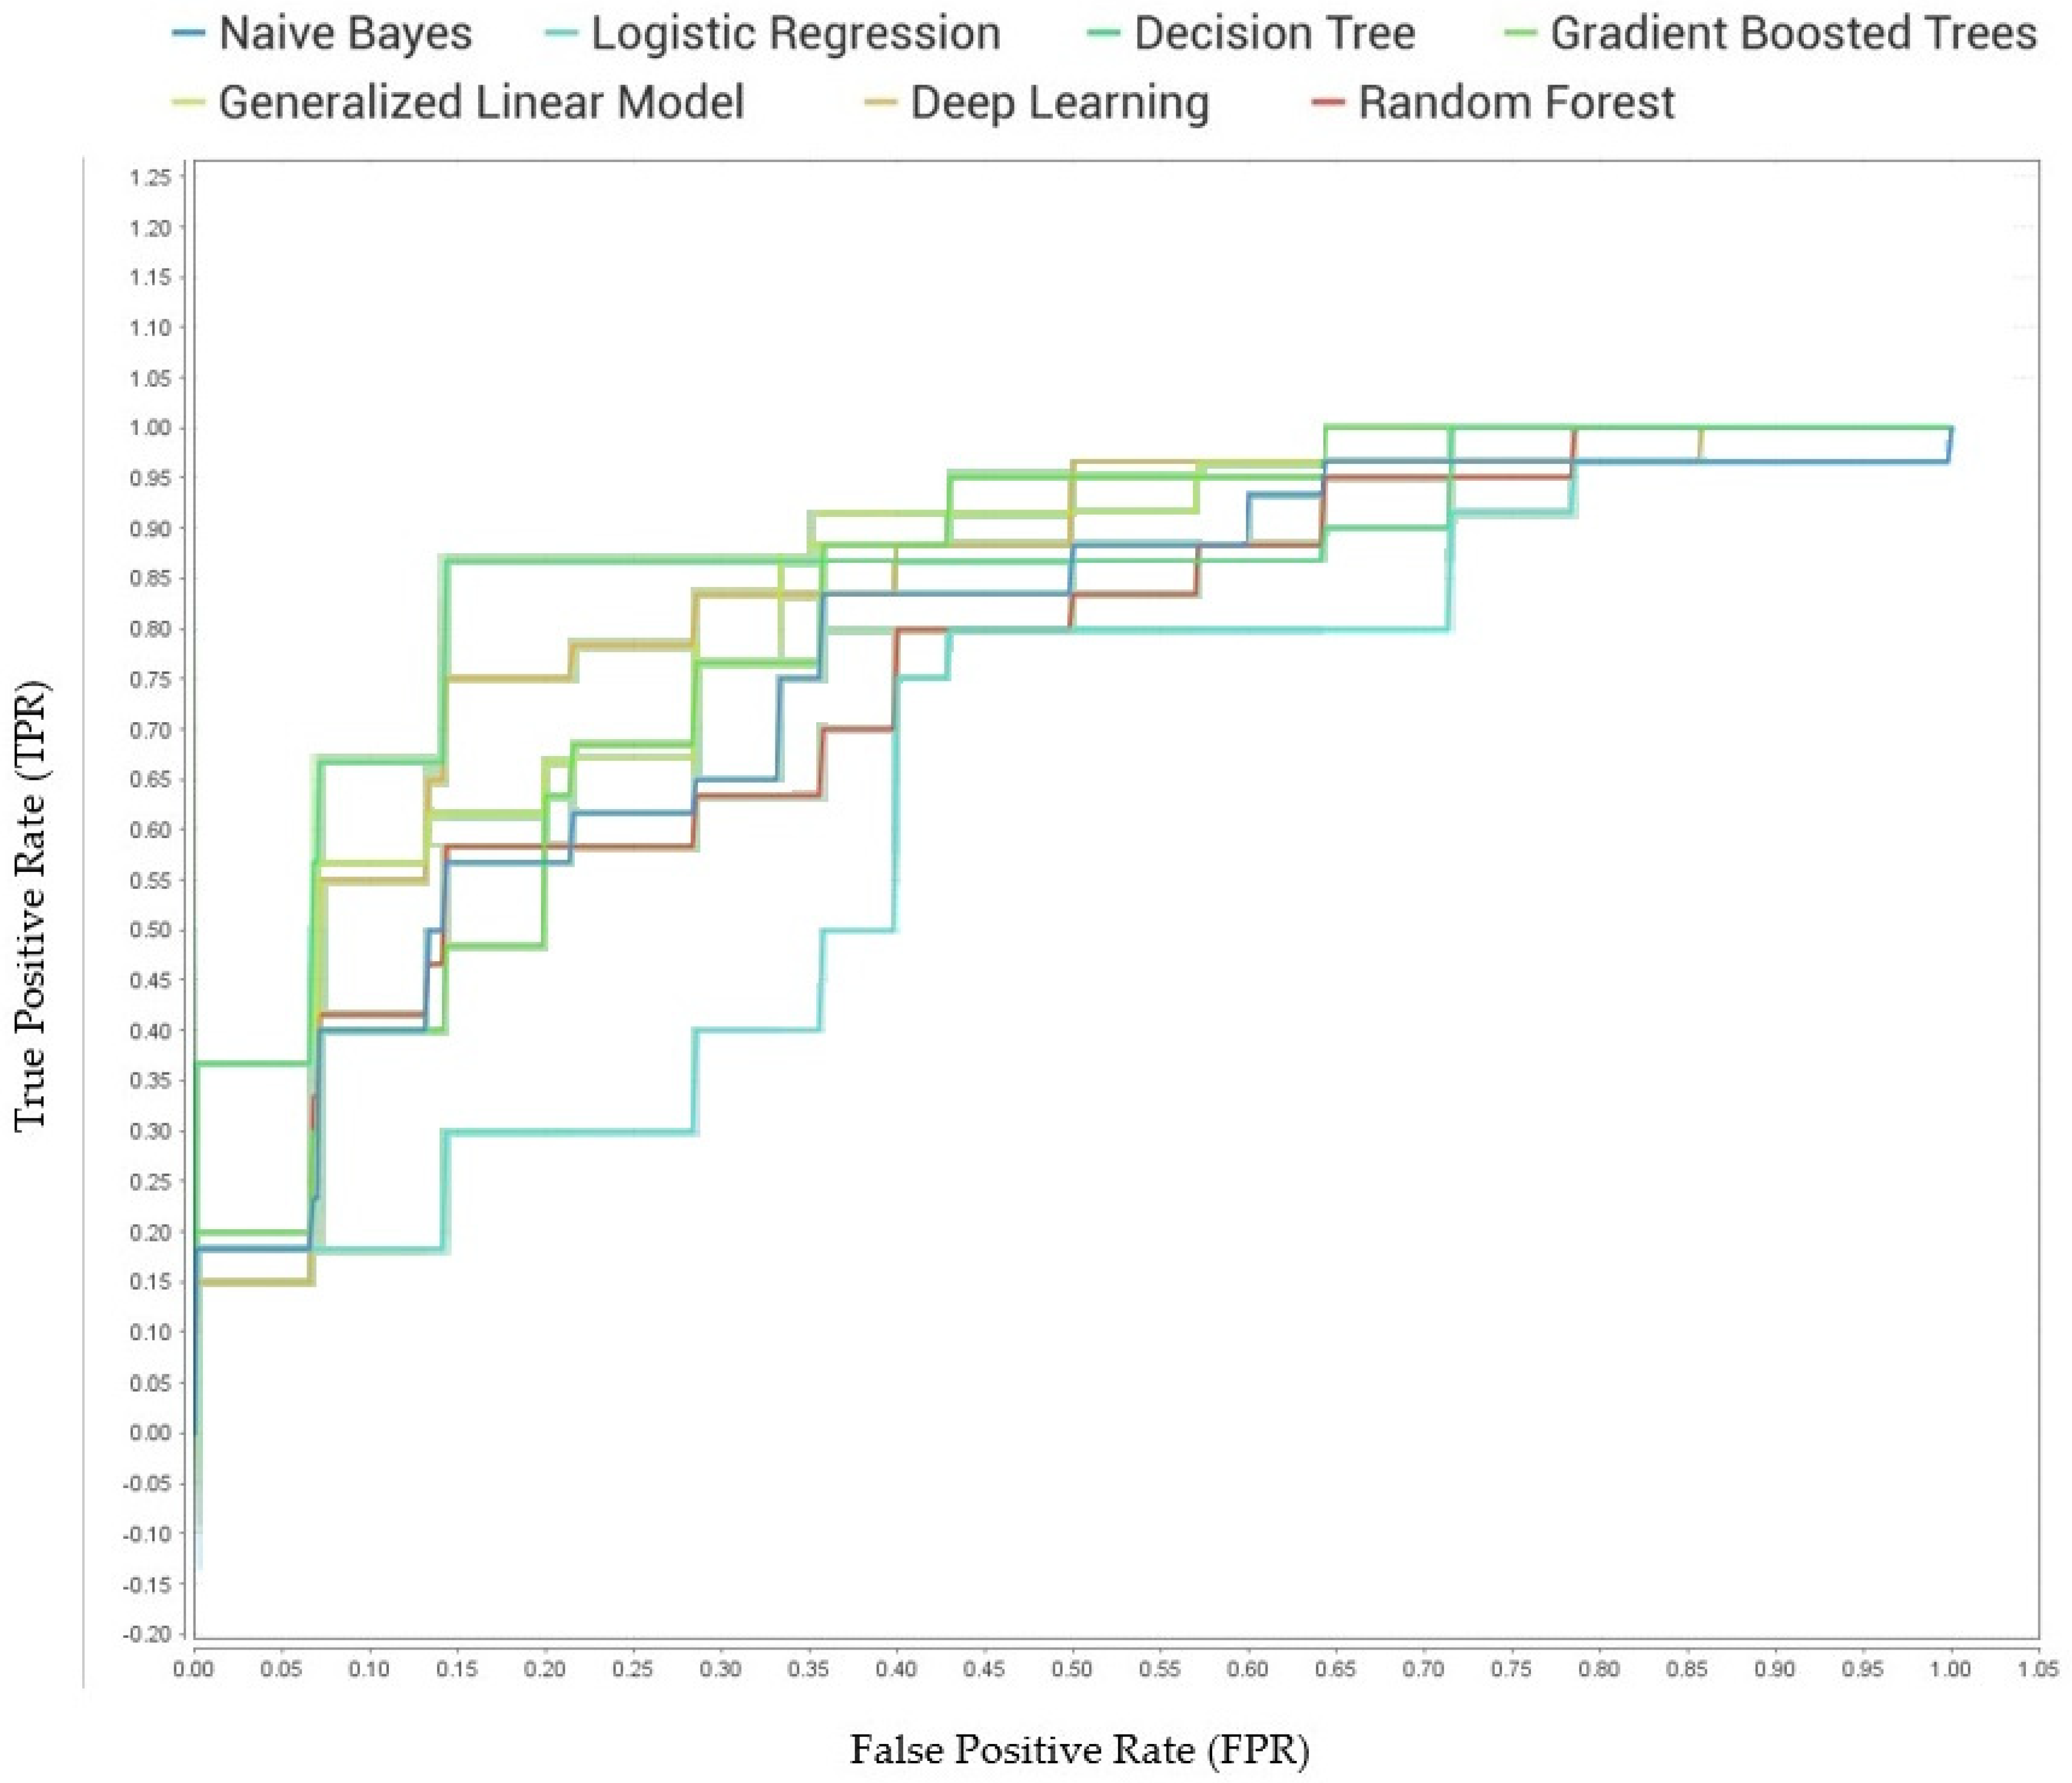
3.7.1. Performance Metrics
- ROC Curve or AUC
3.8. Classification
3.9. Statistical Analysis and Parameters
4. Results
5. Discussion and Conclusions
5.1. Shortcomings
5.2. Future Recommendations
Supplementary Materials
Author Contributions
Funding
Conflicts of Interest
References
- Aleven, V.; Baker, R.; Blomberg, N.; Andres, J.M.; Sewall, J.; Wang, Y.; Popescu, O. Integrating MOOCs and Intelligent Tutoring Systems: EdX, GIFT, and CTAT. In Proceedings of the 5th Annual Generalized Intelligent Framework for Tutoring Users Symposium, Orlando, FL, USA, 11 May 2017; p. 11. [Google Scholar]
- Koedinger, K.R.; Anderson, J.R.; Hadley, W.H.; Mark, M.A. Intelligent tutoring goes to school in the big city. Int. J. Artif. Intell. Educ. 1997, 8, 30–43. [Google Scholar]
- Aleven, V.; Sewall, J.; McLaren, B.M.; Koedinger, K.R. Rapid Authoring of Intelligent Tutors for Real-World and Experimental Use. In Proceedings of the Sixth IEEE International Conference on Advanced Learning Technologies (ICALT’06), Kerkrade, The Netherlands, 5–7 July 2006; pp. 1–5. [Google Scholar]
- Kinshuk. Computer Aided Learning for Entry Level Accountancy Students. 1996. British Library, Imaging Services North, Boston Spa, Wetherby, West Yorkshire, UK. Available online: https://core.ac.uk/download/pdf/77603309.pdf (accessed on 28 April 2018).
- Freedman, R. Atlas: A plan manager for mixed-initiative, multimodal dialogue. In Proceedings of the AAAI-99 Workshop on Mixed-initiative Intelligence, Orlando, FL, USA, 18–19 July 1999; pp. 1–8. [Google Scholar]
- Gertner, A.; Conati, C.; VanLehn, K. Procedural Help in Andes: Generating Hints Using a Bayesian Network Student Model; American Association for Artificial Intelligence (AAAI): Palo Alto, CA, USA, 1988; pp. 106–111. [Google Scholar]
- Heffernan, N.T.; Heffernan, C.L. The ASSISTments ecosystem: Building a platform that brings scientists and teachers together for minimally invasive research on human learning and teaching. Int. J. Artif. Intell. Educ. 2014, 24, 470–497. [Google Scholar] [CrossRef]
- Heffernan, N. ASSISTmentsData. 2012. Available online: https://sites.google.com/site/assistmentsdata/home/assistment-2009-2010-data/skill-builder-data-2009-2010 (accessed on 2 February 2018).
- Roschelle, J.; Feng, M.; Murphy, R.F.; Mason, C.A. Online Mathematics Homework Increases Student Achievement. AERA Open 2016, 2. [Google Scholar] [CrossRef]
- Roschelle, J.; Murphy, R.; Feng, M.; International, S.R.I.; Mason, C.; Fairman, J. Rigor and Relevance in an Efficacy Study of an Online Mathematics Homework Intervention. 2014. Available online: https://www.sri.com/newsroom/press-releases/rigorous-sri-study-shows-online-mathematics-homework-program-developed (accessed on 30 April 2018).
- Feng, M.; Heffernan, N.; Koedinger, K. Addressing the assessment challenge with an online system that tutors as it assesses. User Model. User Adapt. Interact. 2009, 19, 243–266. [Google Scholar] [CrossRef]
- Pardos, Z.; Heffernan, N. Tutor Modeling vs. Student Modeling. In Proceedings of the Twenty-Fifth International Florida Artificial Intelligence Research Society Conference, Marco Island, FL, USA, 23–25 May 2012. [Google Scholar]
- Pedro, M.O.Z.S.; Baker, R.S.J.D.; Gowda, S.M.; Heffernan, N.T. Towards an understanding of affect and knowledge from student interaction with an intelligent tutoring system. In Artificial Intelligence in Education; Lecture Notes in Computer Science; Springer: Berlin/Heidelberg, Germany, 2013; Volume 7926, pp. 41–50. [Google Scholar]
- Wang, S.; Lu, S.; Dong, Z.; Yang, J.; Yang, M.; Zhang, Y. Dual-Tree Complex Wavelet Transform and Twin Support Vector Machine for Pathological Brain Detection. Appl. Sci. 2016, 6, 169. [Google Scholar] [CrossRef]
- Ma, W.; Adesope, O.; Nesbit, J.C.; Liu, Q. Intelligent tutoring systems and learning outcomes: A meta-analysis. J. Educ. Psychol. 2014, 106, 901–918. [Google Scholar] [CrossRef]
- Crockett, K.; Latham, A.; Whitton, N. On predicting learning styles in conversational intelligent tutoring systems using fuzzy decision trees. Int. J. Hum. Comput. Stud. 2017, 97, 98–115. [Google Scholar] [CrossRef]
- Kelly, K.; Heffernan, N.; Heffernan, C.; Goldman, S.; Pellegrino, J.; Soffer-goldstein, D. WEB-BASED HOMEWORK. In Proceedings of the Joint Meeting of PME 38 and PME-NA 36, Vancouver, BC, Canada, 15–20 July 2014; Volume 3, pp. 417–424. [Google Scholar]
- Singh, R.; Saleem, M.; Pradhan, P.; Heffernan, C.; Heffernan, N.T.; Razzaq, L.; Dailey, M.D.; O’Connor, C.; Mulcahy, C. Feedback during web-based homework: The role of hints. In Artificial Intelligence in Education; Lecture Notes in Computer Science; Springer: Berlin/Heidelberg, Germany, 2011; Volume 6738, pp. 328–336. [Google Scholar]
- Vanlehn, K.; Lynch, C.; Schulze, K. The Andes physics tutoring system: Lessons learned. Int. J. Artif. Intell. Edu. 2005, 15, 1–51. [Google Scholar]
- Kelly, K.; Heffernan, N.; Heffernan, C.; Goldman, S.; Pellegrino, J.; Goldstein, D.S. Estimating the effect of web-based homework. In Artificial Intelligence in Education; Lecture Notes in Computer Science; Springer: Berlin/Heidelberg, Germany, 2013; Volume 7926, pp. 824–827. [Google Scholar]
- Fyfe, E.R. Providing feedback on computer-based algebra homework in middle-school classrooms. Comput. Hum. Behav. 2016, 63, 568–574. [Google Scholar] [CrossRef]
- Hattie, J.; Timperley, H. The Power of feedback. Review of Educational Research. Rev. Educ. Res. 2007, 77, 81–112. [Google Scholar] [CrossRef]
- Alfieri, L.; Brooks, P.J.; Aldrich, N.J.; Tenenbaum, H.R. Does Discovery-Based Instruction Enhance Learning? J. Educ. Psychol. 2011, 103, 1–18. [Google Scholar] [CrossRef]
- Gupta, N.K.; Rose, C.P. Understanding Instructional Support Needs of Emerging Internet Users for Web-based Information Seeking. JEDM J. Educ. Data Min. 2010, 2, 38–82. [Google Scholar]
- Lee, D.M.C.; Rodrigo, M.M.T.; Baker, R.S.J.D.; Sugay, J.O.; Coronel, A. Exploring the relationship between novice programmer confusion and achievement. In Affective Computing and Intelligent Interaction; Lecture Notes in Computer Science; Springer: Berlin/Heidelberg, Germany, 2011; Volume 6974, pp. 175–184. [Google Scholar]
- Baker, R.S.J.d.; Gowda, S.M.; Wixon, M.; Kalka, J.; Wagner, A.Z.; Salvi, A.; Aleven, V.; Kusbit, G.K.; Ocumpaugh, J.; Ocumpaugh, L. Towards Sensor-Free Affect Detection in Cognitive Tutor Algebra. In Proceedings of the 5th International Conference on Educational Data Mining, Chania, Greece, 19–21 June 2012; pp. 126–133. [Google Scholar]
- Lehman, B.; D’Mello, S.; Graesser, A. Interventions to regulate confusion during learning. In Intelligent Tutoring Systems; Lecture Notes in Computer Science; Springer: Berlin/Heidelberg, Germany, 2012; Volume 7315, pp. 576–578. [Google Scholar]
- Pardos, Z.A.; Baker, R.S.J.D.; Pedro, M.O.C.Z.S.; Gowda, S.M.; Gowda, S.M. Affective States and State Tests: Investigating How Affect Throughout the School Year Predicts End of Year Learning Outcomes. In Proceedings of the Third International Conference on Learning Analytics and Knowledge (LAK’13), Leuven, Belgium, 8–12 April 2013; Volume 1, pp. 117–124. [Google Scholar]
- Pekrun, R.; Goetz, T.; Titz, W.; Perry, R.P. Academic emotions in students’ self-regulated learning and achievement: A program of qualitative and quantitative research. Educ. Psychol. 2002, 37, 91–105. [Google Scholar] [CrossRef]
- Conati, C.; MacLaren, H. Empirically building and evaluating a probabilistic model of user affect. User Model. User Adapt. Interact. 2009, 19, 267–303. [Google Scholar] [CrossRef]
- D’Mello, S.; Lehman, B.; Pekrun, R.; Graesser, A. Confusion can be beneficial for learning. Learn. Instr. 2014, 29, 153–170. [Google Scholar] [CrossRef]
- Vu, D.H.; Muttaqi, K.M.; Agalgaonkar, A.P. A variance inflation factor and backward elimination based robust regression model for forecasting monthly electricity demand using climatic variables. Appl. Energy 2015, 140, 385–394. [Google Scholar] [CrossRef]
- Rundel, M.C. Linear Regression and Modeling. 2018. Available online: https://www.coursera.org/learn/linear-regression-model (accessed on 18 January 2018).
- Smith, V.C.; Lange, A.; Huston, D.R. Predictive modeling to forecast student outcomes and drive effective interventions in online community college courses. J. Asynchronous Learn. Netw. 2012, 16, 51–61. [Google Scholar] [CrossRef]
- Ng, V.K.Y.; Cribbie, R.A. The gamma generalized linear model, log transformation, and the robust Yuen-Welch test for analyzing group means with skewed and heteroscedastic data. Commun. Stat. Simul. Comput. 2018, 1–18. [Google Scholar] [CrossRef]
- RapidMiner. RapidMiner Documentation. 2016. Available online: https://docs.rapidminer.com/latest/studio/operators/ (accessed on 29 April 2018).
- Peng, C.; Lee, K.; Ingersoll, G.M. An introduction to logistic regression analysis and reporting. J. Educ. Res. 2002, 96, 3–14. [Google Scholar] [CrossRef]
- Li, W.; Gao, M.; Li, H.; Xiong, Q.; Wen, J.; Wu, Z. Dropout prediction in MOOCs using behavior features and multi-view semi-supervised learning. In Proceedings of the 2016 International Joint Conference on Neural Networks (IJCNN), Vancouver, BC, Canada, 24–29 July 2016; pp. 3130–3137. [Google Scholar]
- Xing, W.; Du, D. Dropout Prediction in MOOCs: Using Deep Learning for Personalized Intervention. J. Educ. Comput. Res. 2018. [Google Scholar] [CrossRef]
- Kabra, R.R.; Bichkar, R.S. Performance prediction of engineering students using decision trees. Int. J. Comput. Appl. 2011, 36, 8–12. [Google Scholar]
- Breiman, L. Random Forests. Mach. Learnl. 2001, 45, 5–32. [Google Scholar] [CrossRef]
- Cobos, R.; Wilde, A.; Zaluska, E. Predicting attrition from massive open online courses in FutureLearn and edX. In Proceedings of the 7th International Learning Analytics and Knowledge Conference, Simon Fraser University, Vancouver, BC, Canada, 13–17 March 2017; Volume 1967, pp. 74–93. [Google Scholar]
- Pontius, R.G.; Si, K. The total operating characteristic to measure diagnostic ability for multiple thresholds. Int. J. Geogr. Inf. Sci. 2014, 28, 570–583. [Google Scholar] [CrossRef]
- Wang, S.; Yang, M.; Zhang, Y.; Zhang, Y.-D. Detection of left-sided and right-sided hearing loss via fractional Fourier transform. Entropy 2016, 18, 194. [Google Scholar] [CrossRef]
- Hussain, M.; Zhu, W.; Zhang, W.; Abidi, S.M.R.; Ali, S. Using machine learning to predict student difficulties from learning session data. Artif. Intell. Rev. 2018, 1–27. [Google Scholar] [CrossRef]
- Mierswa, I.; Wurst, M.; Klinkenberg, R.; Scholz, M.; Euler, T. YALE: Rapid prototyping for complex data mining tasks. In Proceedings of the ACM SIGKDD International Conference on Knowledge Discovery and Data Mining, Philadelphia, PA, USA, 20–23 August 2006; Volume 2006, pp. 935–940. [Google Scholar]
- Godwin, K.E.; Almeda, M.V.; Petroccia, M.; Baker, R.S.; Fisher, A.V. Classroom activities and off-task behavior in elementary school children. In Proceedings of the 35th Annual Meeting of the Cognitive Science Society, Berlin, Germany, 31 July–3 August 2013; No. 2001. pp. 2428–2433. [Google Scholar]
- Metz, C.E. Basic Principles of ROC Analysis. 2018. Available online: http://gim.unmc.edu/dxtests/ROC1.htm (accessed on 4 May 2018).
- Microsoft. Lift Chart (Analysis Services—Data Mining). 2018. Available online: https://docs.microsoft.com/en-us/sql/analysis-services/data-mining/lift-chart-analysis-services-data-mining?view=sql-analysis-services-2017 (accessed on 7 May 2018).
- Education for Sustainable Development|Higher Education Academy. Available online: https://www.heacademy.ac.uk/knowledge-hub/education-sustainable-development-0 (accessed on 16 November 2018).
- The Brundtland Commission. Available online: https://www.sustainabledevelopment2015.org/AdvocacyToolkit/index.php/earth-summit-history/past-earth-summits/58-the-brundtland-commission (accessed on 13 November 2018).
- Gao, H.; Cheng, B.; Wang, J.; Li, K.; Zhao, J.; Li, D. Object Classification Using CNN-Based Fusion of Vision and LIDAR in Autonomous Vehicle Environment. IEEE Trans. Ind. Inform. 2018, 14, 4224–4230. [Google Scholar] [CrossRef]
- Xie, G.; Gao, H.; Qian, L.; Huang, B.; Li, K.; Wang, J. Vehicle Trajectory Prediction by Integrating. Mech. Syst. Signal Process. 2018, 102, 1377–1380. [Google Scholar]
- Li, D.; Gao, H. A Hardware Platform Framework for an Intelligent Vehicle Based on a Driving Brain. Engineering 2018, 4, 464–470. [Google Scholar] [CrossRef]
- Gao, H.; Zhang, X.; Liu, Y.; Li, D. Cloud Model Approach for Lateral Control of Intelligent Vehicle Systems. Sci. Program. 2016, 2016, 1–12. [Google Scholar] [CrossRef]


| Methods Used | Advantages | Disadvantages |
|---|---|---|
| Fuzzy Decision Trees [16] | The most popular choice for learning and reasoning systems particularly from feature based discrete values, dealing issue with uncertainty, noise, and inexact data | Does not take into consideration the connections between behavior variables and, due to the uncertainty intrinsically present in modeling learning styles, small differences in behavior can lead to incorrect predictions |
| Hierarchical Linear Regression Model (HLM) [9] | Simple relationship with a limited number of variables, it is the ordinary least square (OLS) regression-based analysis that takes the hierarchical structure of data into consideration | Complex form, assessed data using a fixed parameter, and thus insufficient analysis due to the neglect of the shared variance |
| Regression Analysis [21] | It is a statistical analysis technique used to forecast future conditions, provides the relationship between two or more related variables with the help of which we can quickly estimate or predict the unknown values of one variable from the known values of another variable | The cause and effect of the relationship between variables remain unchanged, cannot be used in a qualitative phenomenon, long and complex calculations and analysis |
| Mixed-effects Modeling [31] | Useful where repeated measurements are made on the same statistical units or made on clusters of related statistical units, Includes a combination of fixed and random effects, and very appropriate dealing with missing values | Increase the power in studies without sample structure |
| ANCOVA (Analysis of Covariance) [17] | Better power, enhanced capability to detect and evaluate interactions, and the availability of extensions to deal with measurement error in the covariates | It may not be helpful when the imbalance between the groups is large |
| Sensor-Free Detectors [26] | These detectors are designed to operate solely on the information available through the students’ semantic actions within the interface | Not substantially better especially when subject to stringent cross-validation processes |
| ANOVA (Analysis of Variance) [18] | The statistical method used to compare the means of multiple groups (more than two sets of data), can also control the overall Type-I error rate | Not suitable when the samples are not independent |
| Discovery with a model approach [25] | Leaves clear data trials that can be re-inspected in the future, development of lifelong learning skills, supports an active engagement of the learner, use activities to focus attention, can be motivating | Inefficient, too time-consuming, possibility of confusing learner’s if no initial framework is available, requires that the teacher prepares for too many corrections if discovery turns out to be wrong |
| Data-Driven Methodology [24] | Make up-to-date design decisions based on real user needs and prioritize issues to solve based on its relative impact for users | Data are trusted blindly without any uncertainty, and are often messy and even incorrect. Low-quality data leads to low-quality decisions |
| Feedback Model [22] | Reduces the discrepancy between current and desired understanding | Feedback is only built on something. It is of little use when there is no initial learning or surface information, and under particular circumstances, an instruction is more effective than feedback |
| Probabilistic Student Model [19] | Beneficial for making responses to help requests that are particularly relevant to domains in which there is uncertainty about the student’s mental state | Unable to look at the problem of deciding what kind of response to give to the student at any given time |
| Academic Emotions Questionnaire (AEQ) assumptions of a cognitive-motivational model [30] | Useful for analyzing students’ emotions in learning, as emotions are multifaceted and can be measured reliably by the AEQ | Due to primarily used cross-sectional or predictive designs, not allowing precise inferences of causal relations |
| Skill Name | Attribute-1 | Attribute-2 | Attribute-3 | Attribute-4 |
|---|---|---|---|---|
| Absolute Value | 3.8 | 8.4 | 1.7 | 20.3 |
| Box and Whisker | 0.7 | 0.0 | 2.2 | 1.7 |
| Circle Graph | 2.5 | 6.3 | 4.8 | 15.5 |
| Venn Diagram | 4.0 | 6.8 | 2.2 | 31.2 |
| Write Linear Equation from Graph | 0.6 | 1.7 | 0.0 | 28.9 |
| Attributes | Ranks (Weights) |
|---|---|
| ms_first_response_absValue | 1.000 |
| ms_first_response_percentOf | 0.901 |
| original_absValue | 0.813 |
| ms_first_response_subWholeNum | 0.755 |
| ms_first_response_multiFrac | 0.627 |
| opportunity_cirGraph | 0.568 |
| hint_total_absValue | 0.561 |
| opportunity_absValue | 0.551 |
| ms_first_response_ordFrac | 0.498 |
| original_addSubPosDec | 0.490 |
| Attribute | Label |
|---|---|
| user_id | −0.11 |
| original_absValue | 0.23 |
| ms_first_response_absValue | 0.28 |
| hint_total_absValue | 0.16 |
| opportunity_absValue | 0.16 |
| original_addSubPosDec | 0.15 |
| ms_first_response_addSubPosDec | 0.11 |
| opportunity_addSubPosDec | 0.10 |
| original_box&Whis | −0.05 |
| hint_total_box&Whis | −0.05 |
| opportunity_box&Whis | −0.05 |
| original_cirGraph | −0.06 |
| ms_first_response_cirGraph | 0.12 |
| hint_total_cirGraph | −0.03 |
| opportunity_cirGraph | −0.17 |
| original_multiFrac | 0.12 |
| ms_first_response_multiFrac | 0.18 |
| hint_total_multiFrac | 0.12 |
| opportunity_multiFrac | 0.07 |
| original_ordFrac | 0.05 |
| ms_first_response_ordFrac | 0.15 |
| opportunity_ordFrac | −0.02 |
| original_percentOf | 0.01 |
| ms_first_response_percentOf | 0.26 |
| hint_total_percentOf | 0.08 |
| opportunity_percentOf | −0.13 |
| original_subWholeNum | 0.02 |
| ms_first_response_subWholeNum | 0.22 |
| opportunity_subWholeNum | −0.11 |
| original_vennDiag | −0.07 |
| ms_first_response_vennDiag | −0.11 |
| hint_total_vennDiag | 0.11 |
| opportunity_vennDiag | −0.09 |
| original_wrtLinEqGraph | −0.11 |
| ms_first_response_wrtLinEqGraph | −0.08 |
| opportunity_wrtLinEqGraph | −0.02 |
| Min | 1Q | Median | 3Q | Max |
|---|---|---|---|---|
| −0.94696 | −0.04588 | 0.05360 | 0.13200 | 0.44114 |
| Coefficients | Estimate | Std. Error | t Value | pr (>|t|) | |
|---|---|---|---|---|---|
| (Intercept) | 0.5588550 | 0.0475093 | 11.763 | <2 × 10⁻¹⁶ | *** |
| ms_first_response_absValue | 0.0247446 | 0.0043088 | 5.743 | 4.73 × 10⁻⁸ | *** |
| original_addSubPosDec | 0.0104006 | 0.0058002 | 1.793 | 0.074887 | . |
| original_box.whis | −0.1641421 | 0.0685545 | −2.394 | 0.017838 | * |
| opportunity_box.whis | 0.0317376 | 0.0196939 | 1.612 | 0.109082 | *** |
| original_cirGraph | 0.0530879 | 0.0123338 | 4.304 | 2.95 × 10⁻⁵ | *** |
| opportunity_cirGraph | −0.0041942 | 0.0010725 | −3.911 | 0.000137 | *** |
| hint_total_vennDiag | 0.0273546 | 0.0059493 | 4.598 | 8.77 × 10⁻⁶ | ** |
| original_wrtLinEqGraph | −0.0602548 | 0.0218751 | −2.754 | 0.006577 | * |
| opportunity_wrtLinEqGraph | 0.0005436 | 0.0002309 | 2.355 | 0.019787 |
| Residual Standard Error | Degrees of Freedom | Multiple R-Squared | Adjusted R-Squared | F-Statistic | p-Value |
|---|---|---|---|---|---|
| 0.2936 | 156 | 0.3213 | 0.2821 | 8.205 | 6.123 × 10⁻¹⁰ |
| Attribute | Maximum Adjusted R2 Value |
|---|---|
| (Intercept) | 0.20–0.28 |
| user_id | 0.00 |
| original_absValue | 0.00 |
| ms_first_response_absValue | 0.20–0.28 |
| hint_total_absValue | 0.00 |
| opportunity_absValue | 0.00 |
| original_addSubPosDec | 0.265–0.28 |
| ms_first_response_addSubPosDec | 0.00 |
| opportunity_addSubPosDec | 0.00 |
| original_box&Whis | 0.25–0.28 |
| hint_total_box&Whis | 0.23–0.25 |
| opportunity_box&Whis | 0.275–0.28 |
| original_cirGraph | 0.23–0.28 |
| ms_first_response_cirGraph | 0.00 |
| hint_total_cirGraph | 0.00 |
| opportunity_cirGraph | 0.23–0.28 |
| original_multiFrac | 0.00 |
| ms_first_response_multiFrac | 0.00 |
| hint_total_multiFrac | 0.00 |
| opportunity_multiFrac | 0.00 |
| original_ordFrac | 0.00 |
| ms_first_response_ordFrac | 0.00 |
| opportunity_ordFrac | 0.00 |
| original_percentOf | 0.20–0.23 |
| ms_first_response_percentOf | 0.20–0.23 |
| hint_total_percentOf | 0.00 |
| opportunity_percentOf | 0.00 |
| original_subWholeNum | 0.20–0.23 |
| ms_first_response_subWholeNum | 0.00 |
| opportunity_subWholeNum | 0.25–0.28 |
| original_vennDiag | 0.25–0.28 |
| ms_first_response_vennDiag | 0.00 |
| hint_total_vennDiag | 0.20–0.28 |
| opportunity_vennDiag | 0.00 |
| original_wrtLinEqGraph | 0.00 |
| ms_first_response_wrtLinEqGraph | 0.00 |
| opportunity_wrtLinEqGraph | 0.00 |
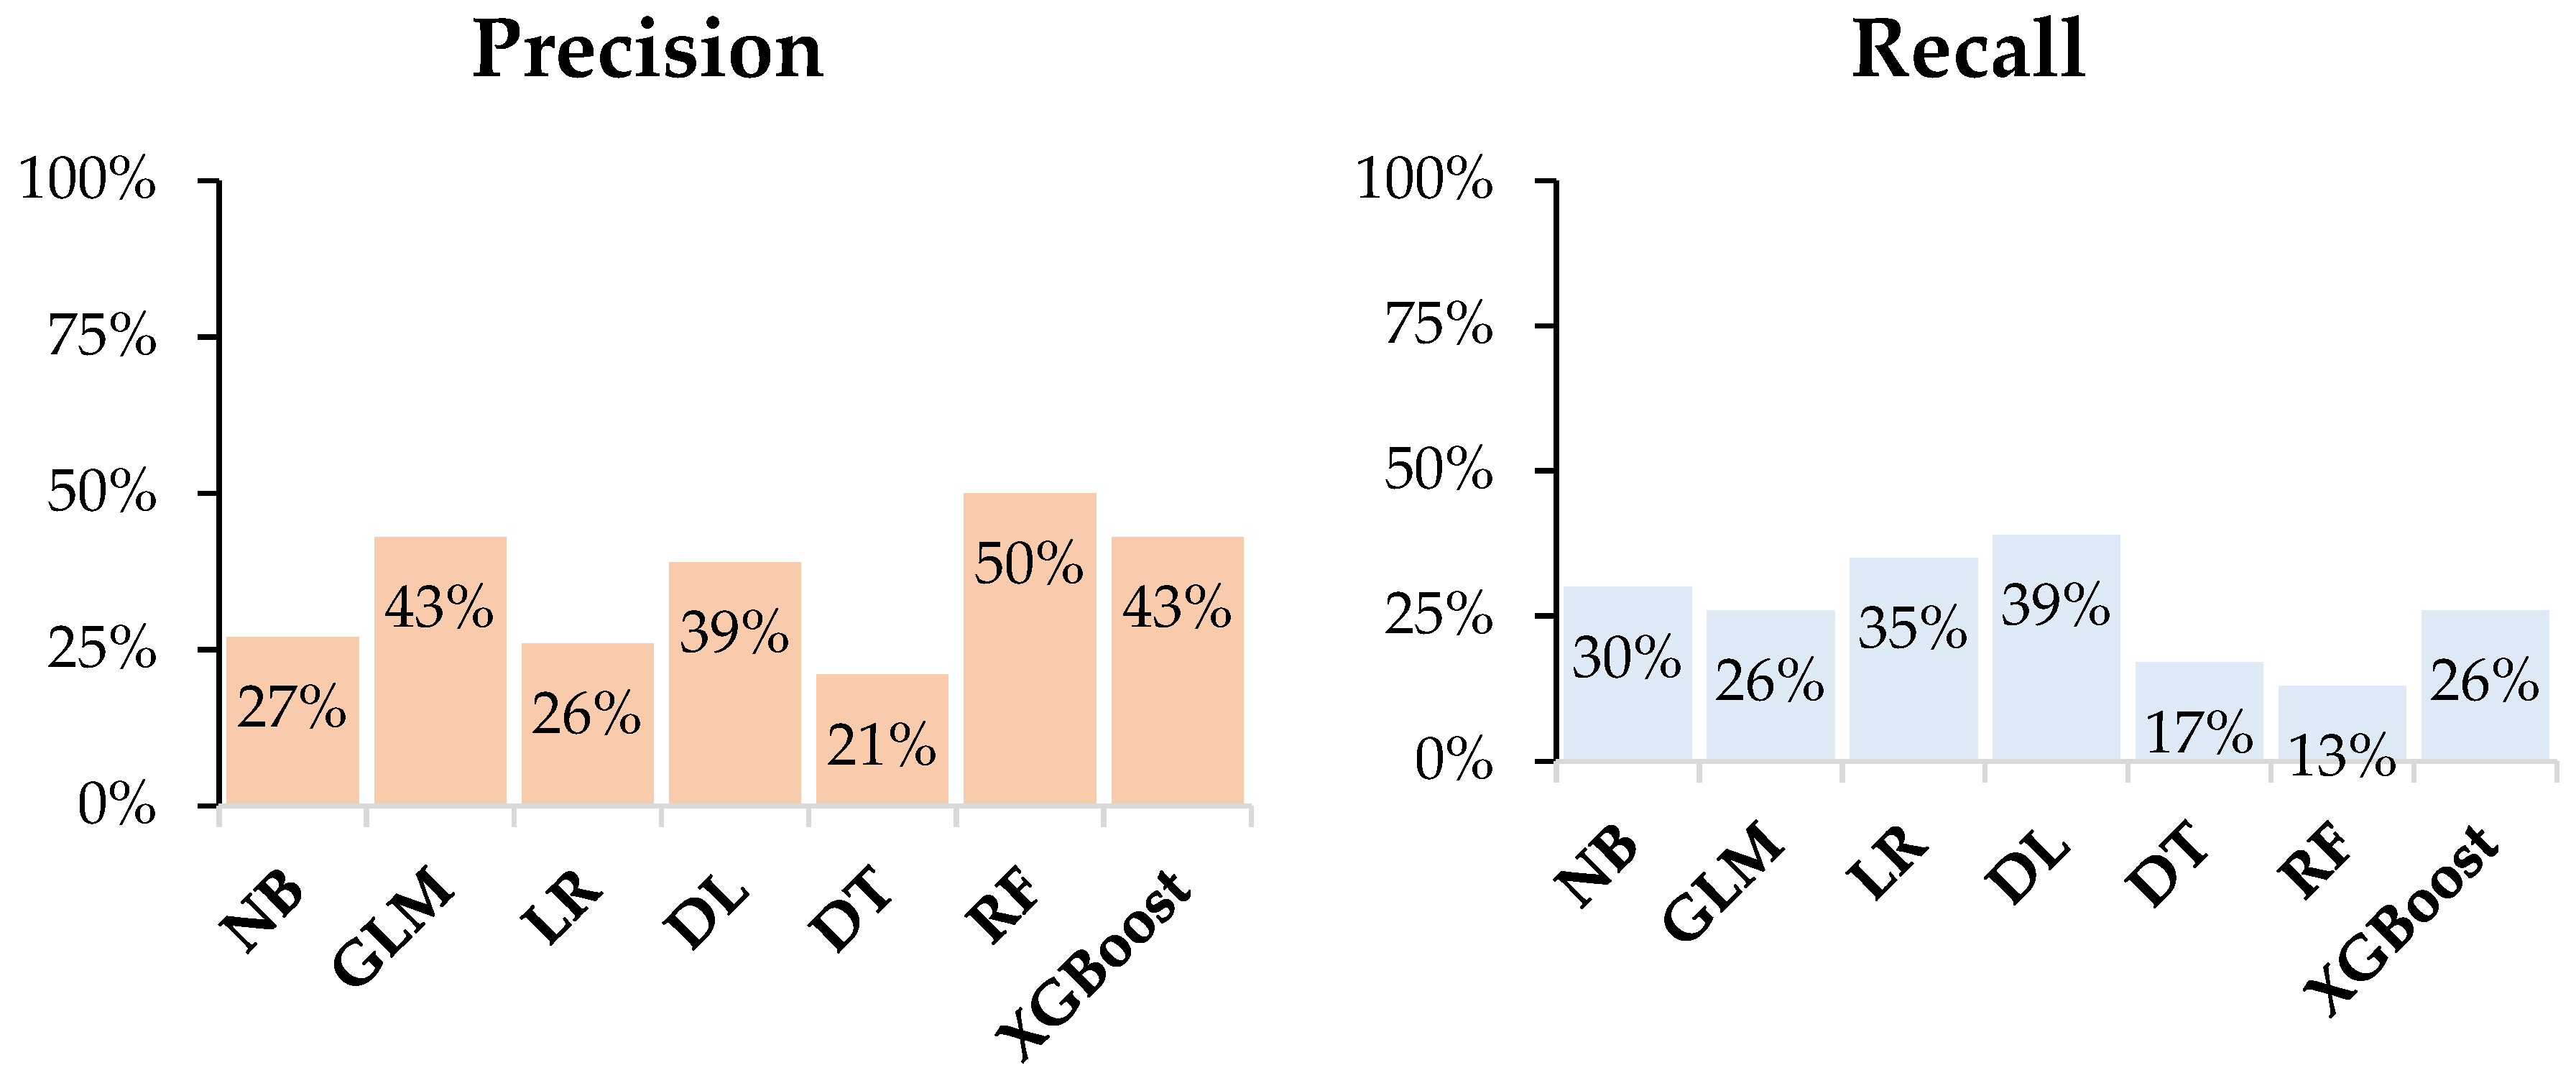
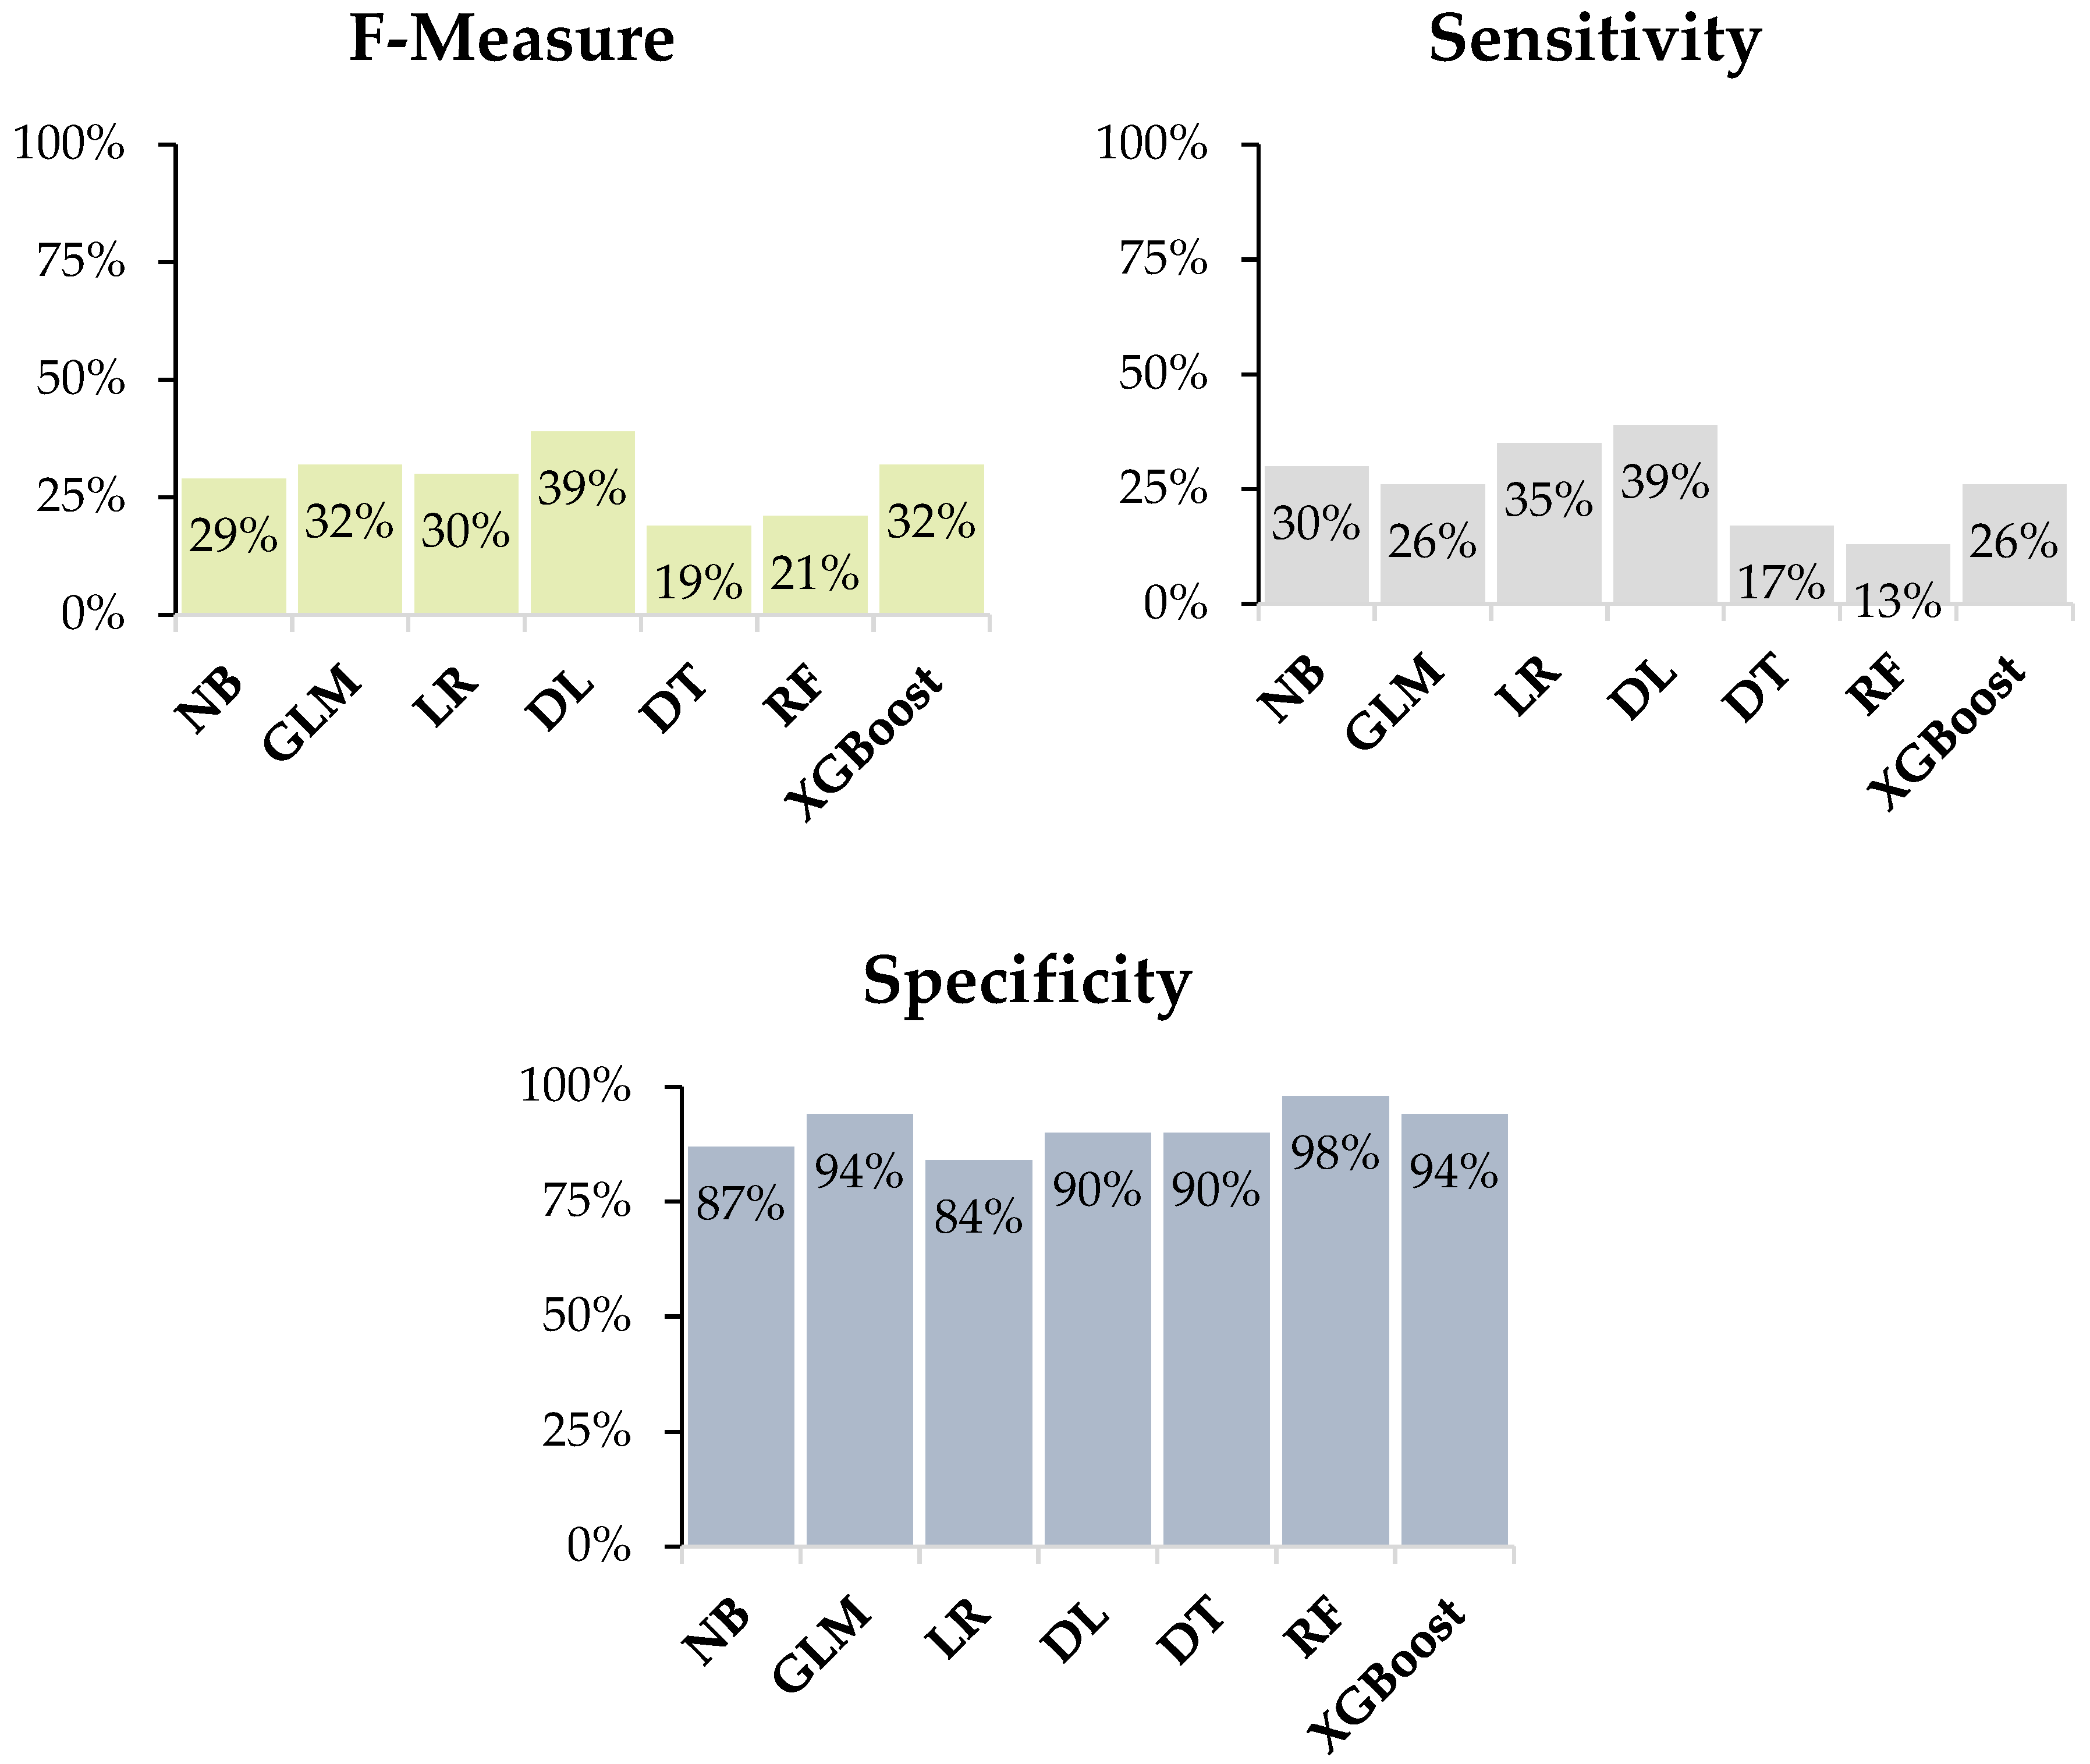
| Model | Accuracy | Precision | Recall | F-Measure | Sensitivity | Specificity | Runtime |
|---|---|---|---|---|---|---|---|
| NB | 78.9% | 26.9% | 30.4% | 28.6% | 30.4% | 86.7% | 87 ms |
| GLM | 84.9% | 42.9% | 26.1% | 32.4% | 26.1% | 94.4% | 5 s |
| LR | 77.1% | 25.8% | 34.8% | 29.6% | 34.8% | 83.9% | 772 ms |
| DL | 83.1% | 39.1% | 39.1% | 39.1% | 39.1% | 90.2% | 1 s |
| DT | 79.5% | 21.1% | 17.4% | 19.1% | 17.4% | 89.5% | 527 ms |
| RF | 86.1% | 50.0% | 13.0% | 20.7% | 13.0% | 97.9% | 3 s |
| XGBoost | 84.9% | 42.9% | 26.1% | 32.4% | 26.1% | 94.4% | 1 min 33 s |
© 2018 by the authors. Licensee MDPI, Basel, Switzerland. This article is an open access article distributed under the terms and conditions of the Creative Commons Attribution (CC BY) license (http://creativecommons.org/licenses/by/4.0/).
Share and Cite
Abidi, S.M.R.; Hussain, M.; Xu, Y.; Zhang, W. Prediction of Confusion Attempting Algebra Homework in an Intelligent Tutoring System through Machine Learning Techniques for Educational Sustainable Development. Sustainability 2019, 11, 105. https://doi.org/10.3390/su11010105
Abidi SMR, Hussain M, Xu Y, Zhang W. Prediction of Confusion Attempting Algebra Homework in an Intelligent Tutoring System through Machine Learning Techniques for Educational Sustainable Development. Sustainability. 2019; 11(1):105. https://doi.org/10.3390/su11010105
Chicago/Turabian StyleAbidi, Syed Muhammad Raza, Mushtaq Hussain, Yonglin Xu, and Wu Zhang. 2019. "Prediction of Confusion Attempting Algebra Homework in an Intelligent Tutoring System through Machine Learning Techniques for Educational Sustainable Development" Sustainability 11, no. 1: 105. https://doi.org/10.3390/su11010105
APA StyleAbidi, S. M. R., Hussain, M., Xu, Y., & Zhang, W. (2019). Prediction of Confusion Attempting Algebra Homework in an Intelligent Tutoring System through Machine Learning Techniques for Educational Sustainable Development. Sustainability, 11(1), 105. https://doi.org/10.3390/su11010105