A Collaborative Stakeholder Decision-Making Approach for Sustainable Urban Logistics


1
Department of Industrial Systems Engineering and Product Design, Ghent University, Technologiepark 903, 9052 Gent-Zwijnaarde, Belgium
2
Industrial Systems Engineering (ISyE), Ghent University, 9052 Gent-Zwijnaarde, Belgium
*
Author to whom correspondence should be addressed.
Sustainability 2019, 11(1), 234; https://doi.org/10.3390/su11010234
Submission received: 30 September 2018
/
Revised: 13 December 2018
/
Accepted: 20 December 2018
/
Published: 4 January 2019
(This article belongs to the Special Issue Decision Support Systems for Urban Logistics Planning: Multi-Stakeholder and Participative Approaches)
Abstract
:Cities strongly rely on efficient urban logistics to ensure their attractiveness, quality of life, and economic development. In the same time, they strive to ensure livable and safe environments around its road network, where the increased presence of light and heavy goods vehicles raises questions of regarding safety and environmental impacts. Recent literature has well-recognized the need to consider different stakeholders’ perspectives on these issues, in order to achieve desired outcomes. In this paper, we introduce a collaborative stakeholders’ decision-making approach for sustainable urban logistics, and demonstrate its applicability on a real-life example. The suggested approach extends existing route planning approaches by considering route sustainability as a part of an arc’s traversal cost. The integration of route sustainability is based on the adoption of a multi-criterial decision-making approach, with the possibility of including different stakeholders’ points of view, and evaluating the sustainability cost concerning the route’s spatial context. To demonstrate the applicability of the suggested approach, we extract the route sustainability cost from the traffic sign database, and implement the findings on a real-life example. Furthermore, the suggested approach exhibits a high level of transferability to various local contexts, where local stakeholders might have a different view on the route sustainability than is the case in our example.

1. Introduction
In 2008, for the first time, the population in urban areas worldwide outgrew the population in rural areas. The trend of growing cities is expected to continue, and it is estimated that by 2030, towns and cities will be home to almost five billion people [1]. These growing cities rely on efficient and sustainable urban logistics systems to ensure the conduction of daily activities, as well as to increase the attractiveness, the economic development, and the quality of life in them [2]. The aforementioned poses plenty of challenges relating to the increasing traffic within limited urban areas, environmental requirements, the complexity of supply chain within city dynamics, and the integration of different perspectives of particular stakeholders regarding the matter. Taniguchi and Thompson [2] identified shippers, city logistics service providers, residents, and city administrators as the most important stakeholders in this process. Recent literature strongly points towards the importance of explicitly considering different stakeholders’ perspectives, in order to reduce congestion and environmental nuisances, as well as to increase the safety of road traffic in cities [3,4,5,6,7,8]. Castillo-Manzano et al. [9] investigated the relationship between truck load capacity and traffic accidents in the European Union, and highlight that light goods trucks are the worst performers in terms of traffic accidents, and they are often used for city logistics purposes. Darbyshire and Young [10] and Hill and LaVela [11] point out that heavy traffic at 10 m distance generates about 80 dB of noise. Their research includes the measurement of noise levels at hospitals, and results show that the World Health Organization recommended sound levels of 35 dB were often exceeded. Angelelli et al. [12,13], and Liu and Qu [14] focused on congestion-related issues, and explored a proactive route guidance approach that assigned acceptable least-duration paths to users, while minimizing overall congestion. Furthermore, Franceschetti et al. [15,16,17], Ehmke, Campbell and Thomas and Mensing et al. [18,19], Fukasawa et al. [20] considered congestion from another point of view, where it restricts vehicle speeds and increases emissions. Thus, they aimed at identifying and modelling conditions under which it is optimal to wait idly at certain locations in order to avoid congestion, and to reduce the cost of emissions. Undoubtedly, all of these issues are relevant, and should be included in route planning; however, so far they are mainly considered separately, and with the limited possibility to integrate, often conflicting, point of views of different stakeholders. In this paper, we introduce a collaborative stakeholders’ decision-making approach for sustainable urban logistics, and demonstrate its applicability in a real-life example. The suggested approach extends existing route planning approaches by considering route sustainability as a part of an arc’s traversal cost. Integration of the route sustainability is based on the adoption of a multi-criterial decision-making approach, with possibility to include different stakeholders points of view and to evaluate sustainability costs with regard to the route’s spatial context. Thus, the contribution of this paper can be stated as follows: (i) we extend existing routing approaches with the possibility to integrate different perspectives of stakeholders, which makes it particularly applicable for urban logistics purposes; (ii) we demonstrate how both qualitative and quantitative elements can be integrated into route planning in a real-life example; (iii) we develop an transferable and adjustable way to integrate sustainable routing in different local environments with respect to the local context and preferences of the local stakeholders; (iv) we demonstrate how new technologies, including the traffic sign database, can be used to extract sustainability insight from the information content that they possess.
The remainder of the paper is structured as follows. The next section describes the methodology and the study area for the real-life case example. Section 3 provides the research results and the practical computational campaign example to motivate the problem, and to demonstrate its applicability. This is followed by the discussion and conclusion remarks in Section 4 and Section 5.
2. Materials and Methods
2.1. Decision-Making Approach
Decision-making is the act of choosing between two or more courses of action. It is a well-studied branch of operations of research models which deal with decision problems under the presence of decision criteria [21,22,23]. When the number of decision criteria is higher than one, it is called a Multiple Criteria Decision Making (MCDM) problem. In general, it can be viewed as a (finite) set of decision alternatives and a (finite) set of criteria, according to which the desirability of an action is judged . The aim is to determine the optimal decision alternative with the highest degree of desirability, with respect to all relevant criteria .
In our study, to evaluate the sustainability component of the routing process, we adopt am Analytic Hierarchy Process (AHP). The reason for this is its capability for integrating both objective and subjective information, and to organize and analyze complex decision-making problems based on analytical and psychological foundations. Furthermore, the AHP is based on a hierarchical overview of the decision-making process, which makes it easy to interpret across different sustainable route planning stakeholders. Also, it can be used in decision-making procedures where perceptions of individuals, groups, or both, are under consideration. The method was first introduced by Saaty [24,25] and has been extensively studied and refined since then [26,27,28,29,30,31]. The AHP relies on decomposing before integrating, as the decision maker first decomposes a problem into a hierarchy or sub-problems. The hierarchy has at least three basic layers: the decision goal, the alternatives for reaching it, and the criteria for evaluating the alternatives, but can be more complex, including several levels of criteria, sub-criteria, etc. Once the hierarchy is established, the decision maker carries out pairwise comparison of judgments among the elements, at one level of the hierarchy, in terms of the next higher level. The judgments are made based on the Saaty scale of importance (Table 1) which allows for the conversion of qualitative comparisons into quantitative values by using a numerical scale of integers ranging from 1 to 9.
Each one of the comparison matrices assumes the form:
where represents the pairwise comparison rating for hierarchy element and , where both and belong to the same level of the hierarchy. Given that the matrix is consistent, the sum of the column corresponds to the reciprocal of the weight value, which then allows for the calculation of the weight vector for the corresponding hierarchy level. The weight vector is the principal right eigenvector of the matrix When the pairwise comparison data are translated into the absolute values, the normalized weight vector is obtained by solving the following matrix equation:
where is principal eigenvalue of the matrix . In addition, the AHP also allows for decision makers to maintain control over the inconsistent judgements that may occur due to inherent human nature. Thus, the consistency ratio is calculated based on property that is always greater than or equal to (number of rows or columns). As approaches value, the matrix can be considered to be more consistent. If and are equal, the consistency index becomes zero, which guarantees perfect consistency. The quantity measures the degree of inconsistency within the matrix. Thus, the deviation from judgment matrix ’s consistency is expressed by the following equation consistency index ():
The measures the coherence of the pairwise judgements, and is defined by:
where is the average consistency index of the randomly generated comparisons (Table 2). Values of are considered acceptable, while higher values of mean an undesirable level of inconsistency, and indicate that the decision maker should revise their pairwise comparison judgments.
2.2. Study Area
To demonstrate the practical applicability of the urban logistics route planning approach that integrates route sustainability, we consider an example of the road network routing case in the city of Ghent, Belgium. The city of Ghent is the capital and largest city of the East Flanders province, with approximately 250,000 inhabitants [32]. It is accessible via two motorways (E40 and E17) and five train stations. It has two ringways (R4, connecting the outskirts of Ghent with each other and the surrounding villages, and R40, connecting the different downtown quarters with each other). It is a port and a university city, with 65,000 students [32], and it is the home of the largest designated cyclist area in Europe, with nearly 400 km of cycle paths [33]. The target area to test the time-adaptive sustainable route planning approach is the Merelbeke neighborhood (Figure 1), located in the southern part of the Ghent. It is accessible via the E40 motorway, and is connected by the R4 ringway. The practical problem that we consider is the sustainable routing of a light goods vehicle with regard to five () sustainable routing elements. These sustainable routing elements are defined in consultation with the regional mobility institute [34] as:
- Nature park areas (e.g., national park or recreation areas where citizens relax, have picnics, or do sport activities);
- Historical areas (monuments and historic locations that might be damaged by traffic-related vibrations or emissions);
- Care facility areas (health-related facilities used for medical treatments and recovery);
- Construction areas (where traffic might cause increased particulate matter presence, like dust);
- Children areas (areas where children gather, play, or go to school).
To describe the spatial sustainable routing context, one can rely on multiple data sources, depending on their availability for the study area considered. In our case, the spatial context is extracted from the smart city traffic sign database that has been mapped to the transport network. The reason for this is the availability of verified and precise data on the traffic signs network in the area, and the possibility for extracting knowledge on the defined sustainable routing elements from these data. The traffic sign database [35] is an inventory of all traffic signs along the roads of Flanders. It covers a total of ±62,000 km of paved roads (±7500 km of regional and ±54,000 km of local roads), where each traffic sign is described by its geographic coordinates, the orientation of the traffic signs (left or right side of the road), street name and town, date of recording, type of traffic signs (according to the traffic signs classification in the national traffic regulation), dimensions of the plate, and picture of the set-up (Figure 1).
Due to the specific focus of our study, only traffic signs related to the five sustainable routing elements are considered (Table 3).
3. Results
3.1. Integrating Sustainability into the Time-Dependent Route Cost Calculation Based on the Traffic Sign Database
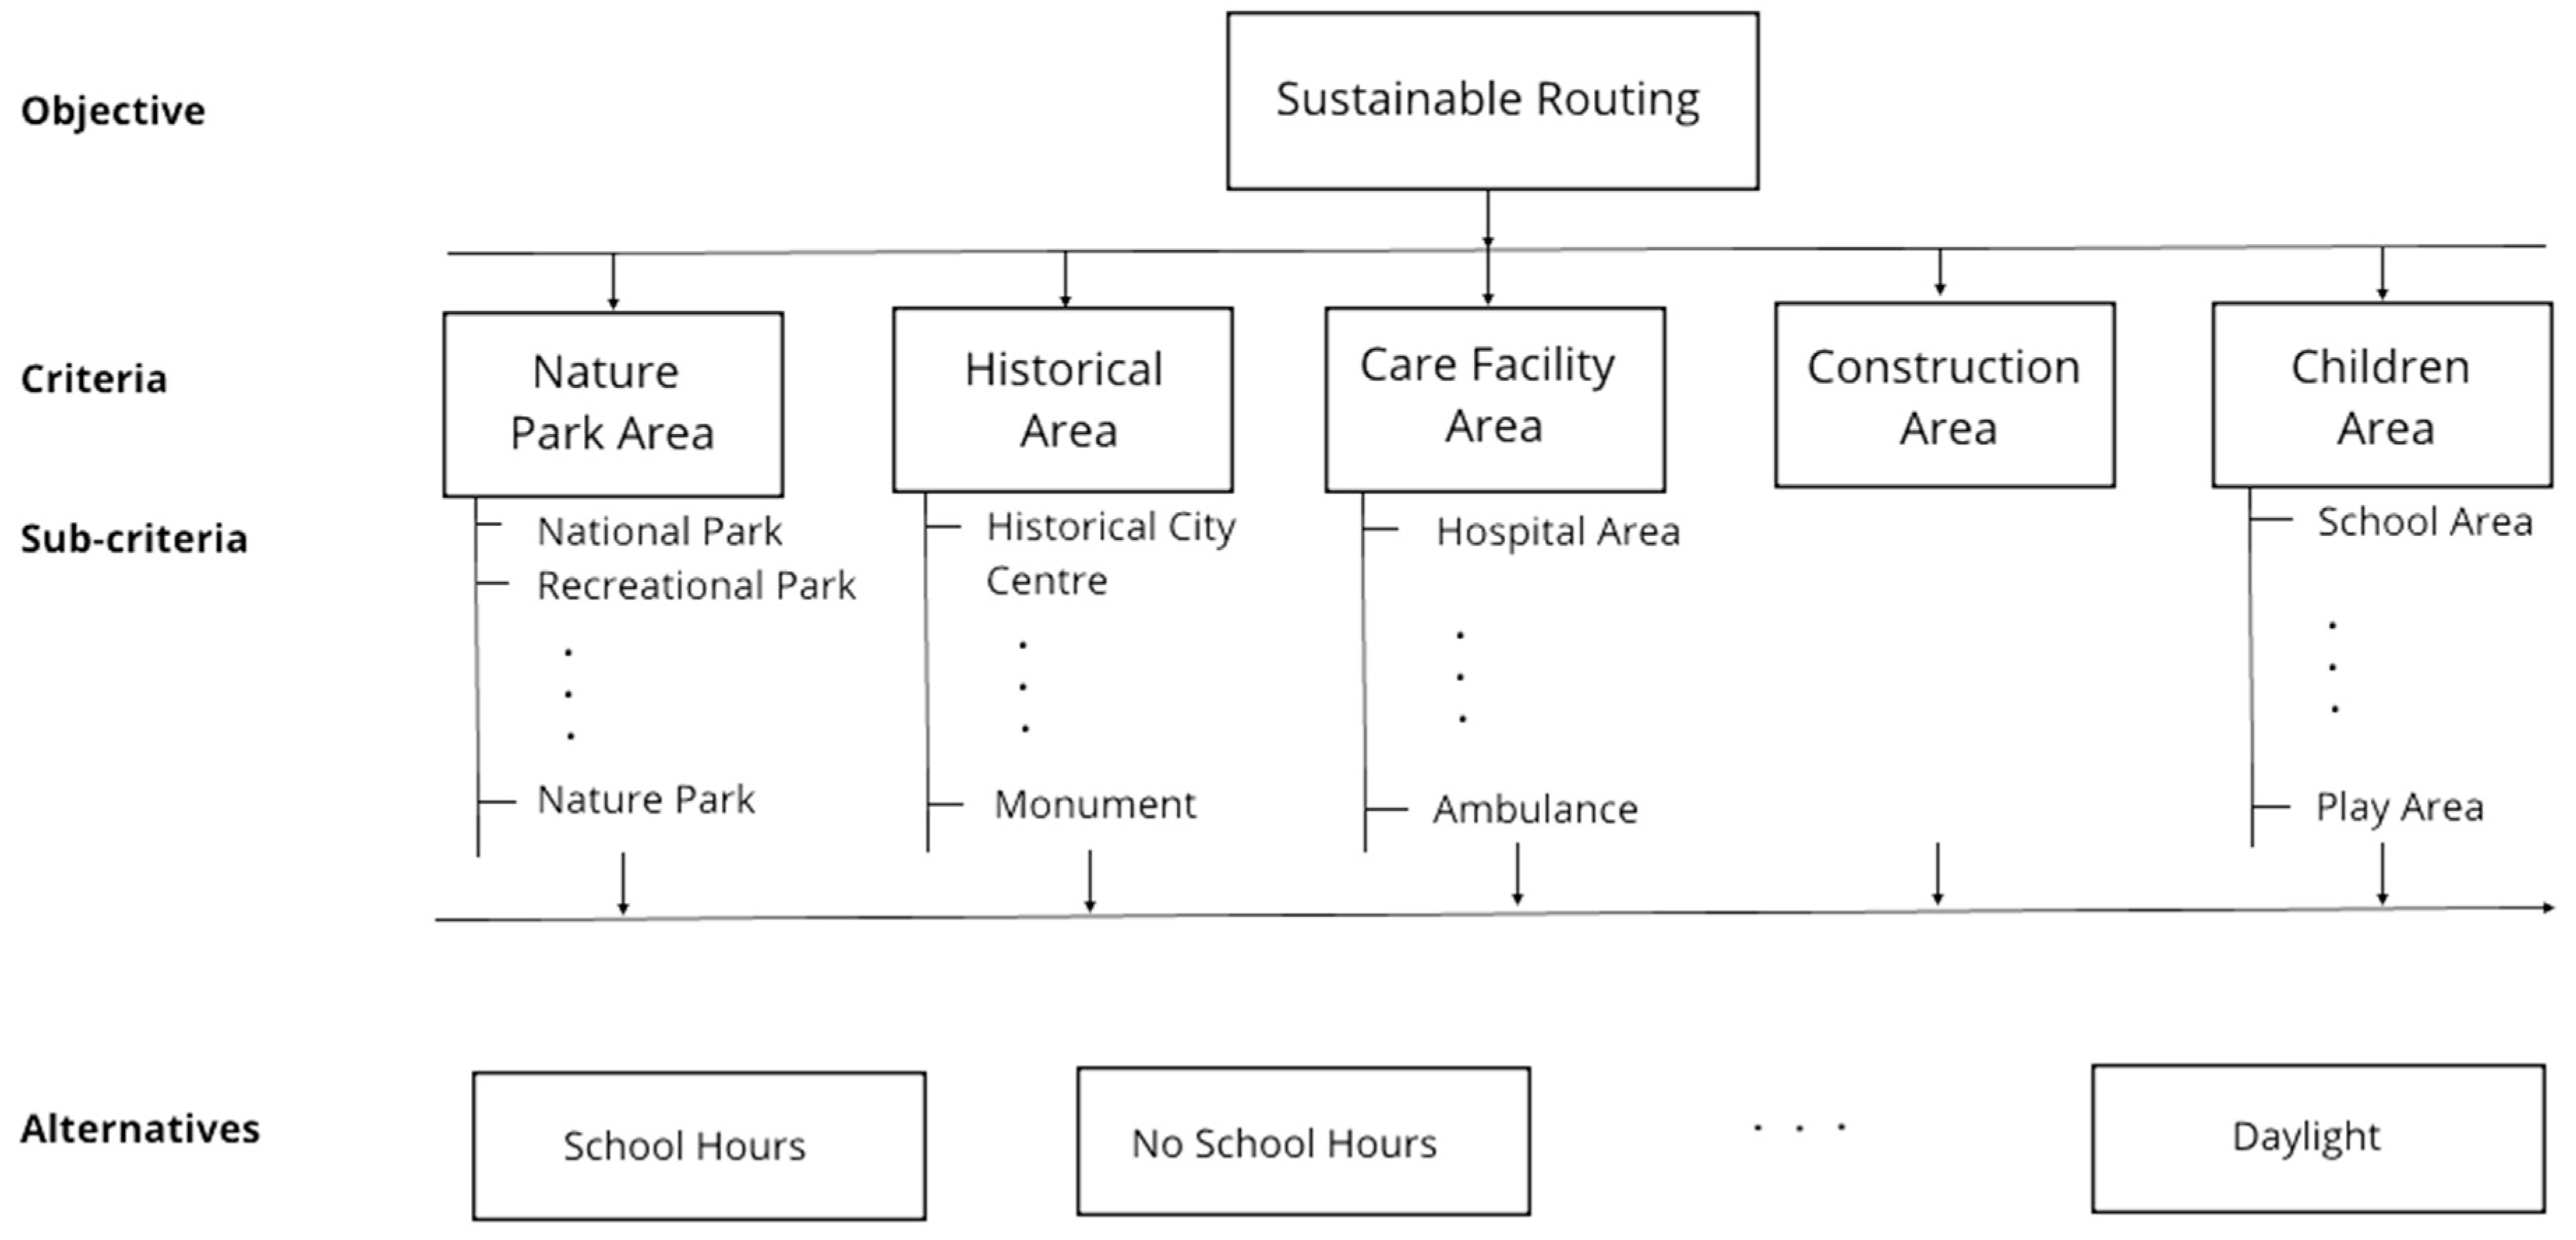
The hierarchy of the sustainable routing problem is defined as follows: the overall goal is sustainable routing, while the level of criteria corresponds to the five sustainable routing elements (Figure 2). The level of sub-criteria corresponds to the different sustainable routing sub-elements, which in our case, are represented by different traffic signs’ meanings (as defined by Table 3).
When carrying out the pairwise comparison judgments among the sub-elements, one is evaluating the relevance of the meaning described by the traffic sign type for the sustainable routing element of the higher level. The obtained comparison matrixes can be seen as a result of a consensus between multiple stakeholders for the defined study area, including representatives of authorities, citizens, research organizations, and companies engaged in the delivery and collection of goods. Thus, in another context, or area, stakeholders might have different opinions on the relevance of the sustainable routing elements. Table 4 shows the details of the calculation for the pairwise comparison matrix, the normalized relative weight, and the normalized principal eigenvector of each sub-element for the historical areas sustainability element, while Table 5 shows a pairwise comparison matrix and a normalized principal eigenvector for each sustainability element, as required for applying the AHP method. The number of order of matrix , and the largest eigenvalue of the preference matrix, the consistency index , random consistency index , and the consistency ratio for the sustainable routing elements are given in Table 6.
3.2. Sustainable Routing
The suggested approach is evaluated by using the real-life sustainable routing example. It is the case used for one of the companies engaged in the delivery and collection of goods in the area, and is used to illustrate the applicability of the approach, and to foster the achievement of consensus among stakeholders. The consensus-based proportionality constant (a constant that fits the weight of the sustainability element as defined by the AHP approach to the length of the route) is defined to be 1000 ( = 1000) for the path length represented in meters. A reason for this, among others, was the ease of interpreting the tradeoff between the path length and the participation in the overall route cost for each of the sustainability elements, based on the normalized weight vector.
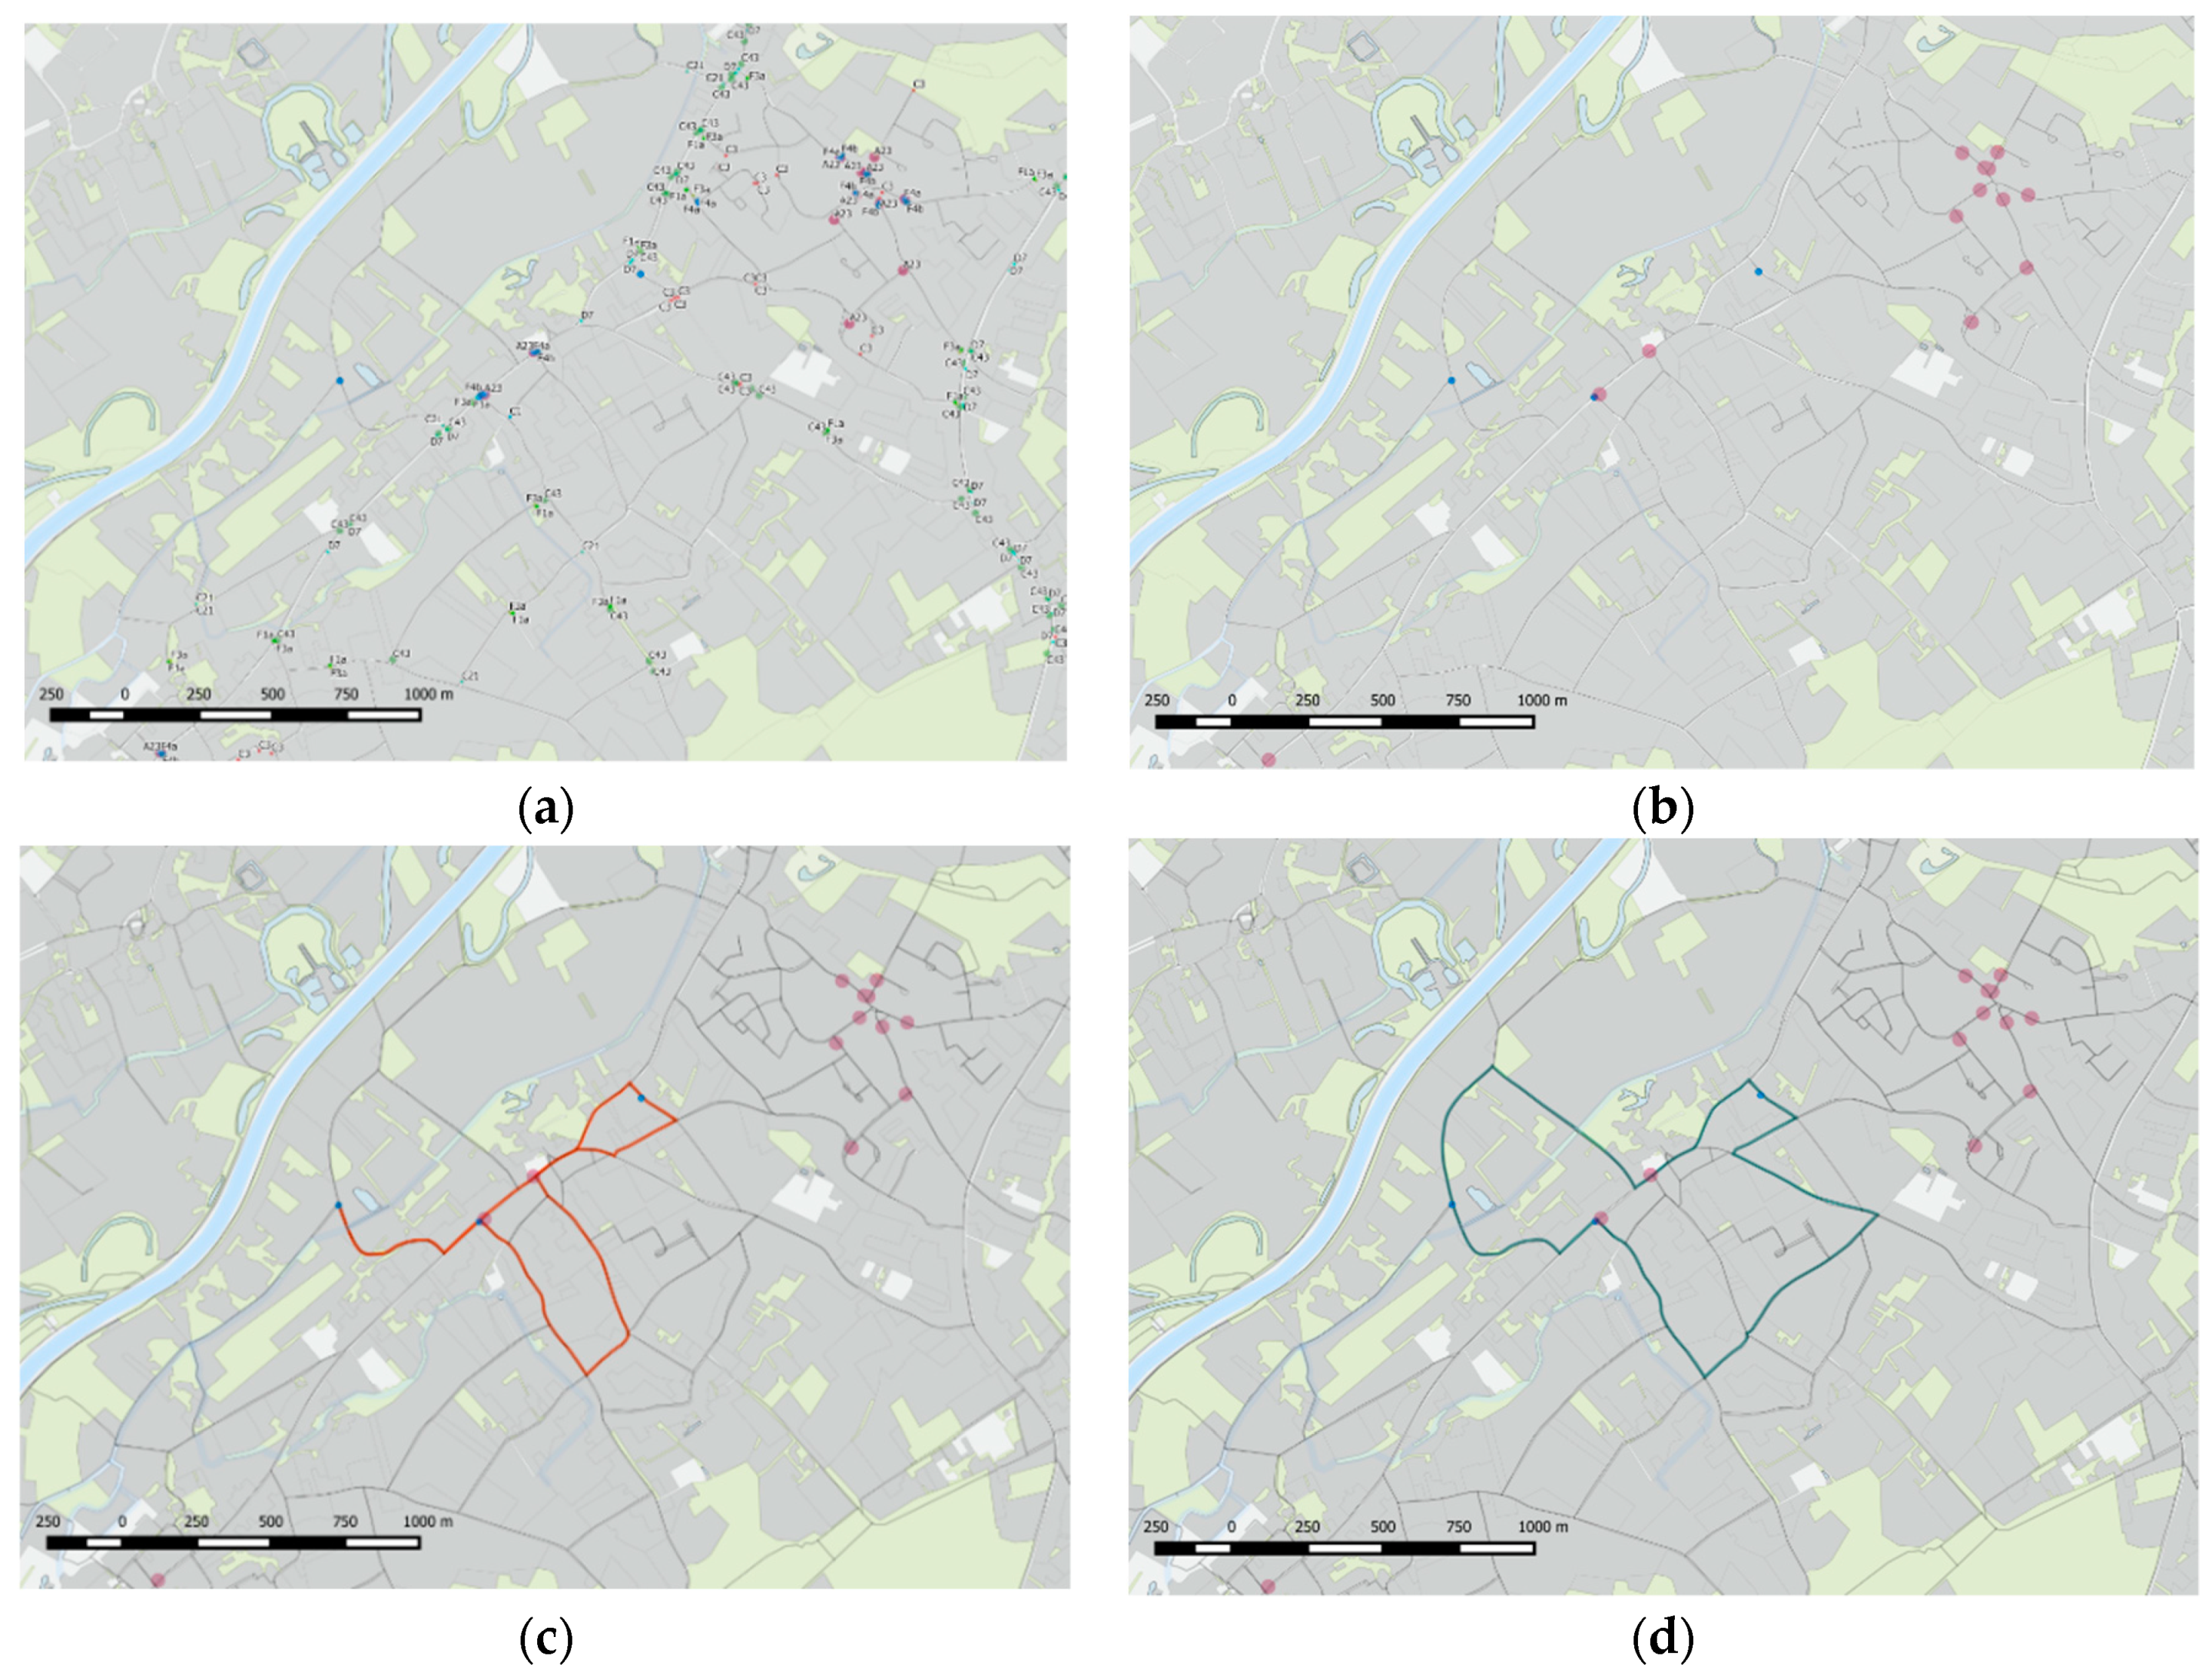
The spatial context of the routing problem in the Merelbeke area, with the indicated types and locations of all traffic signs, is shown in Figure 3a. For clarity, Figure 3b shows the same location, with an indication of only the school area (A23) traffic signs (red points), and vertices of the road network graph that need to be visited by the delivery vehicle (blue points). The vehicle starts at the vertex located on the West part of the network, and needs to make a round tour, visiting two other vertices. In essence, the problem represents the Asymmetric Travelling Salesman Problem (ATSP). The asymmetry is a consequence of the road network directionality, as not all the roads are two-way roads. To solve this routing problem we implemented a well-known Dijskstra routing algorithm with modification: (1) we defined the order of visiting vertices, and then (2) we calculated the path with minimum distance between them. The order of visiting vertices was defined in the initial step, and is equal to the increasing order of Euclidean distances from the starting vertex. When the last vertex is reached, then the shortest returning path is calculated. Figure 3 shows the results for the standard routing problem, (c) and with route sustainability-based results (d).
The Table 7 summarizes the results. In general, the route that corresponds to the shortest path calculated by the Dijkstra’s algorithm is shorter than the sustainability-based route. When the sustainability is integrated in the routing calculation, the route avoids that urban logistic vehicle passes next to the school area. This is the case for all the A23 signs except for one. The route that avoids this would have a smaller sustainability cost, but the increase in the fixed cost (distance) would be too high to compensate for the sustainability cost decrease.
4. Discussion
Cities strongly rely on efficient urban logistics to ensure their attractiveness, quality of life, and economic development. In the same time, they strive to ensure livable and safe environments around its road network, where the increased presence of light and heavy good vehicles raises questions of both safety and environmental impacts [9,10,15]. Recent literature have well-recognized the need to consider different stakeholders’ perspectives on these issues, in order to achieve the desired outcomes [3,4,5,6,7,8]. In this paper, we have defined the sustainable routing that integrates route sustainability into arc traversal cost, based on the adopted multi-criterial decision-making approach. The motivation for this is threefold. Firstly, by adopting the multi-criterial decision-making approach, we have overcome the existing barrier, and suggested a tool that supports the integration of views of different stakeholders regarding the importance of each element related to route sustainability, and its spatial and temporal context. In city logistics, the city administration decides on routing rules though its policy measures. However, if there is a conflict between shippers, city logistics service providers, and/or residents, by implementing the suggested approach, the city administration can easily include interested parties in the decision-making process, and work jointly towards conflict resolution. Additionally, different departments from city administration can also participate in the decision making, if needed. Secondly, the integration of a multi-criterial decision-making approach exhibits additional benefits such as the use of sensitivity a analysis to illustrate different scenarios based on which decision makers can evaluate their results. Finally, the adopted MCDM approach also allows for both quantitative and qualitative parameters to be taken into account. Thus, measurable elements such as financial cost can be combined into the model with the qualitative ones. This is due to the fact that many elements related to the societal costs are likely to have subjective parameters included, such as safety or quality of life, which are often not straightforward monetary values. Furthermore, the approach is transferable across different areas and/or stakeholders, as, depending on the organization(s) that adopts the approach and the local context, the sustainability elements can be redefined, and their relative importance can be changed. Also, the traffic sign database seems to be a useful and practical source that can be implemented to describe the spatial context of the road network. It is expected that the number of such verified databases will increase, with the introduction of autonomous vehicles that rely on them for their operations. The results from this real-life example indicate that the participation of the sustainability related cost, in the overall route cost, is considered to be acceptable, by all stakeholders, if it is up to 20%.
The main limitation of the suggested approach includes an increased complexity of the cost function that results in an increased complexity of the overall algorithm, and thus it might result in a high computational cost for large networks. The availability of verified data that can be used to describe a spatial routing context, might be limiting for some areas, but as mentioned previously, it is expected that the number of such data sources will increase over time. Furthermore, to make a broader conclusion on the acceptability of the sustainability-related cost, in the overall route cost, it would be beneficial to test this approach on a larger number of examples with the presence of a more diverse set of sustainability elements. Potentially, an interesting example of this would be the implementation of the adaptive routing approach outside of urban areas, or in a wider metropolitan area.
5. Conclusions
In this paper, we explored the possibility of using a multi-criteria decision-making approach, namely the Analytical Hierarchical Process, to integrate route sustainability into the urban logistics routing process. The main motivation behind the suggested approach is the need to achieve consensus among related stakeholders on the best routing option (in terms of sustainability) and the diverse interests that each stakeholder has. To do so, we firstly extracted the route sustainability context from the traffic sign database, and based on the MCDM approach, integrated it into the route cost calculation. Based on the simple adoption of the Dijkstra algorithm, we tested the suggested approach on a real life example and proved its applicability. Furthermore, the suggested approach exhibits a high level of transferability to various local contexts where local stakeholders might have a different view on the route sustainability than was the case in our example.
Author Contributions
I.S. prepared the methodology, investigation, visualization and writing—original draft preparation. S.G. participated in the methodology preparation and writing—review and editing.
Funding
This work was supported by the Flemish government agency for Innovation by Science, and Technology, Flemish Institute for Mobility, European Commission’s Urban Innovative Actions.
Acknowledgments
The authors thank all of the participants of the Vebimobe project for their contribution in the traffic sign database adoption, and evaluation of sustainability element relevance for practical examples.
Conflicts of Interest
The authors declare no conflict of interest.
References
- UNPFA State of World Population 2007: Unleashing the Potential of Urban Growth. 2007. Available online: https://www.unfpa.org/sites/default/files/pub-pdf/695_filename_sowp2007_eng.pdf (accessed on 15 June 2018).
- Taniguchi, E.; Thompson, R. Innovations in City Logistics; Nova Science Publishers: New York, NY, USA, 2008. [Google Scholar]
- Gatta, V.; Marcucci, E. Stakeholder-specific data acquisition and urban freight policy evaluation: Evidence, implications and new suggestions. Transp. Rev. 2016, 1647. [Google Scholar] [CrossRef]
- Holguín-Veras, J. Necessary conditions for off-hour deliveries and the effectiveness of urban freight road pricing and alternative financial policies in competitive markets. Transp. Res. Part A Policy Pract. 2008, 42, 392–413. [Google Scholar] [CrossRef]
- Holguín-Veras, J.; Silas, M.; Polimeni, J.; Cruz, B. An investigation on the effectiveness of joint receiver-carrier policies to increase truck traffic in the off-peak hours. Part II: The behavior of carriers. Netw. Spat. Econ. 2008, 8, 327–354. [Google Scholar] [CrossRef]
- Macharis, C.; Melo, S. City Distribution and Urban Freight Transport Multiple Perspectives; Edward Elgar Publishing: Cheltenham, UK, 2011; ISBN 978-1-78347-082-2. [Google Scholar]
- Witkowski, J.; Kiba-Janiak, M. The Role of Local Governments in the Development of City Logistics. Procedia Soc. Behav. Sci. 2014, 125, 373–385. [Google Scholar] [CrossRef] [Green Version]
- Grazia Speranza, M. Trends in transportation and logistics. Eur. J. Oper. Res. 2016, 264, 830–836. [Google Scholar] [CrossRef]
- Castillo-Manzano, J.I.; Castro-Nuño, M.; Fageda, X. Exploring the relationship between truck load capacity and traffic accidents in the European Union. Transp. Res. Part E Logist. Transp. Rev. 2016, 88, 94–109. [Google Scholar] [CrossRef]
- Darbyshire, J.L.; Young, J.D. An investigation of sound levels on intensive care units with reference to the WHO guidelines. Crit. Care 2013, 17, R187. [Google Scholar] [CrossRef] [PubMed]
- Hill, J.; LaVela, S. Noise Levels in Patient Rooms and at Nursing Stations at Three VA Medical Centers. HERD Heal. Environ. Res. Des. J. 2015, 9, 54–63. [Google Scholar] [CrossRef] [PubMed]
- Angelelli, E.; Arsik, I.; Morandi, V.; Savelsbergh, M.; Speranza, M.G. Proactive route guidance to avoid congestion. Transp. Res. Part B Methodol. 2016, 94, 1–21. [Google Scholar] [CrossRef]
- Angelelli, E.; Mansini, R.; Vindigni, M. The Stochastic and Dynamic Traveling Purchaser Problem. Transp. Sci. 2016, 50, 363–761. [Google Scholar] [CrossRef]
- Liu, S.; Qu, Q. Dynamic collective routing using crowdsourcing data. Transp. Res. Part B Methodol. 2016, 93, 450–469. [Google Scholar] [CrossRef]
- Franceschetti, A.; Honhon, D.; Van Woensel, T.; Bektaş, T.; Laporte, G. The time-dependent pollution-routing problem. Transp. Res. Part B Methodol. 2013, 56, 265–293. [Google Scholar] [CrossRef] [Green Version]
- Franceschetti, A.; Demir, E.; Honhon, D.; Van Woensel, T.; Laporte, G.; Stobbe, M. A metaheuristic for the time-dependent pollution-routing problem. Eur. J. Oper. Res. 2017, 259, 972–991. [Google Scholar] [CrossRef]
- Franceschetti, A.; Honhon, D.; Laporte, G.; Van Woensel, T.; Fransoo, J.C. Strategic fleet planning for city logistics. Transp. Res. Part B Methodol. 2017, 95, 19–40. [Google Scholar] [CrossRef]
- Ehmke, J.F.; Campbell, A.M.; Thomas, B.W. Vehicle routing to minimize time-dependent emissions in urban areas. Eur. J. Oper. Res. 2015, 251, 478–494. [Google Scholar] [CrossRef]
- Mensing, F.; Bideaux, E.; Trigui, R.; Tattegrain, H. Trajectory optimization for eco-driving taking into account traffic constraints. Transp. Res. Part D Transp. Environ. 2013, 18, 55–61. [Google Scholar] [CrossRef]
- Fukasawa, R.; He, Q.; Song, Y. A disjunctive convex programming approach to the pollution-routing problem. Transp. Res. Part B Methodol. 2016, 94, 61–79. [Google Scholar] [CrossRef]
- Mardani, A.; Jusoh, A.; MD Nor, K.; Khalifah, Z.; Zakwan, N.; Valipour, A. Multiple criteria decision-making techniques and their applications—A review of the literature from 2000 to 2014. Econ. Res. Istraživanja 2015, 28, 516–571. [Google Scholar] [CrossRef]
- Chang, T.; Wang, T. Using the fuzzy multi-criteria decision making approach for measuring the possibility of successful knowledge management. Inf. Sci. (Ny). 2009, 179, 355–370. [Google Scholar] [CrossRef]
- Brnjac, N.; Cavar, I. Example of positioning intermodal terminals on inland waterways. Promet Traffic Transp. 2009, 21, 443–449. [Google Scholar] [CrossRef]
- Saaty, T.L. A Scaling Method for Priorities in Hierarchical Structures. J. Math. Psychol. 1977, 15, 234–281. [Google Scholar] [CrossRef]
- Saaty, T.L. How to make a decision: The Analytic Hierarchy Process. Eur. J. Oper. Res. 1990, 48, 9–26. [Google Scholar] [CrossRef]
- Kavran, Z.; Cavar, I. AHP Model of Selecting Mobile Phones in the Republic of Croatia. In Proceedings of the 15th Mini EURO Conference, Coimbra, Portugal, 22–24 September 2004; pp. 11–14. [Google Scholar]
- Novacko, L.; Cavar, I.; Hozjan, D. Selection of LRT system track gauge using multi-criteria decision-making (City of Zagreb). WIT Trans. Built Environ. 2008, 101, 167–173. [Google Scholar] [CrossRef] [Green Version]
- Vaidya, O.S.; Kumar, S. Analytic hierarchy process: An overview of applications. Eur. J. Oper. Res. 2006, 169, 1–29. [Google Scholar] [CrossRef]
- Petrini, M.A.; Rocha, J.V.; Brown, J.C.; Bispo, R.C. Using an analytic hierarchy process approach to prioritize public policies addressing family farming in Brazil. Land Use Policy 2016, 51, 85–94. [Google Scholar] [CrossRef] [Green Version]
- Chaudhary, P.; Chhetri, S.K.; Joshi, K.M.; Shrestha, B.M.; Kayastha, P. Application of an Analytic Hierarchy Process (AHP) in the GIS interface for suitable fire site selection: A case study from Kathmandu Metropolitan City, Nepal. Socioecon. Plann. Sci. 2016, 53, 60–71. [Google Scholar] [CrossRef]
- Kijewska, K.; Torbacki, W.; Iwan, S. Application of AHP and DEMATEL methods in choosing and analysing the measures for the distribution of goods in Szczecin region. Sustainability 2018, 10. [Google Scholar] [CrossRef]
- Stad Gent Belfry Ghent in Statistics Ghent in Statistics. Available online: https://visit.gent.be/en/ghent-statistics?context=tourist (accessed on 22 August 2018).
- Nicholson, B.H. Get on Your Bike in Belgium: The Best Way to See Glorious Ghent? On Two Wheels. Available online: http://www.dailymail.co.uk/travel/article-2508846/Belgium-breaks-The-best-way-glorious-Ghent-On-wheels-.html (accessed on 22 August 2018).
- VIM Vlaams Instituut voor Mobiliteit. 2017. Available online: http://www.vim.be (accessed on 01 September 2018).
- Mobiel Vlaanderen Verkeersbordendatabank. Available online: http://www.mobielvlaanderen.be/verkeersbordendatabank/index.php (accessed on 1 September 2018).
Figure 1.
Geographical area and the traffic signs database: (a) Map of Belgium with a detailed view of the city of Ghent and the routing target area; (b) An example of the Flemish road signs database record.
Figure 1.
Geographical area and the traffic signs database: (a) Map of Belgium with a detailed view of the city of Ghent and the routing target area; (b) An example of the Flemish road signs database record.
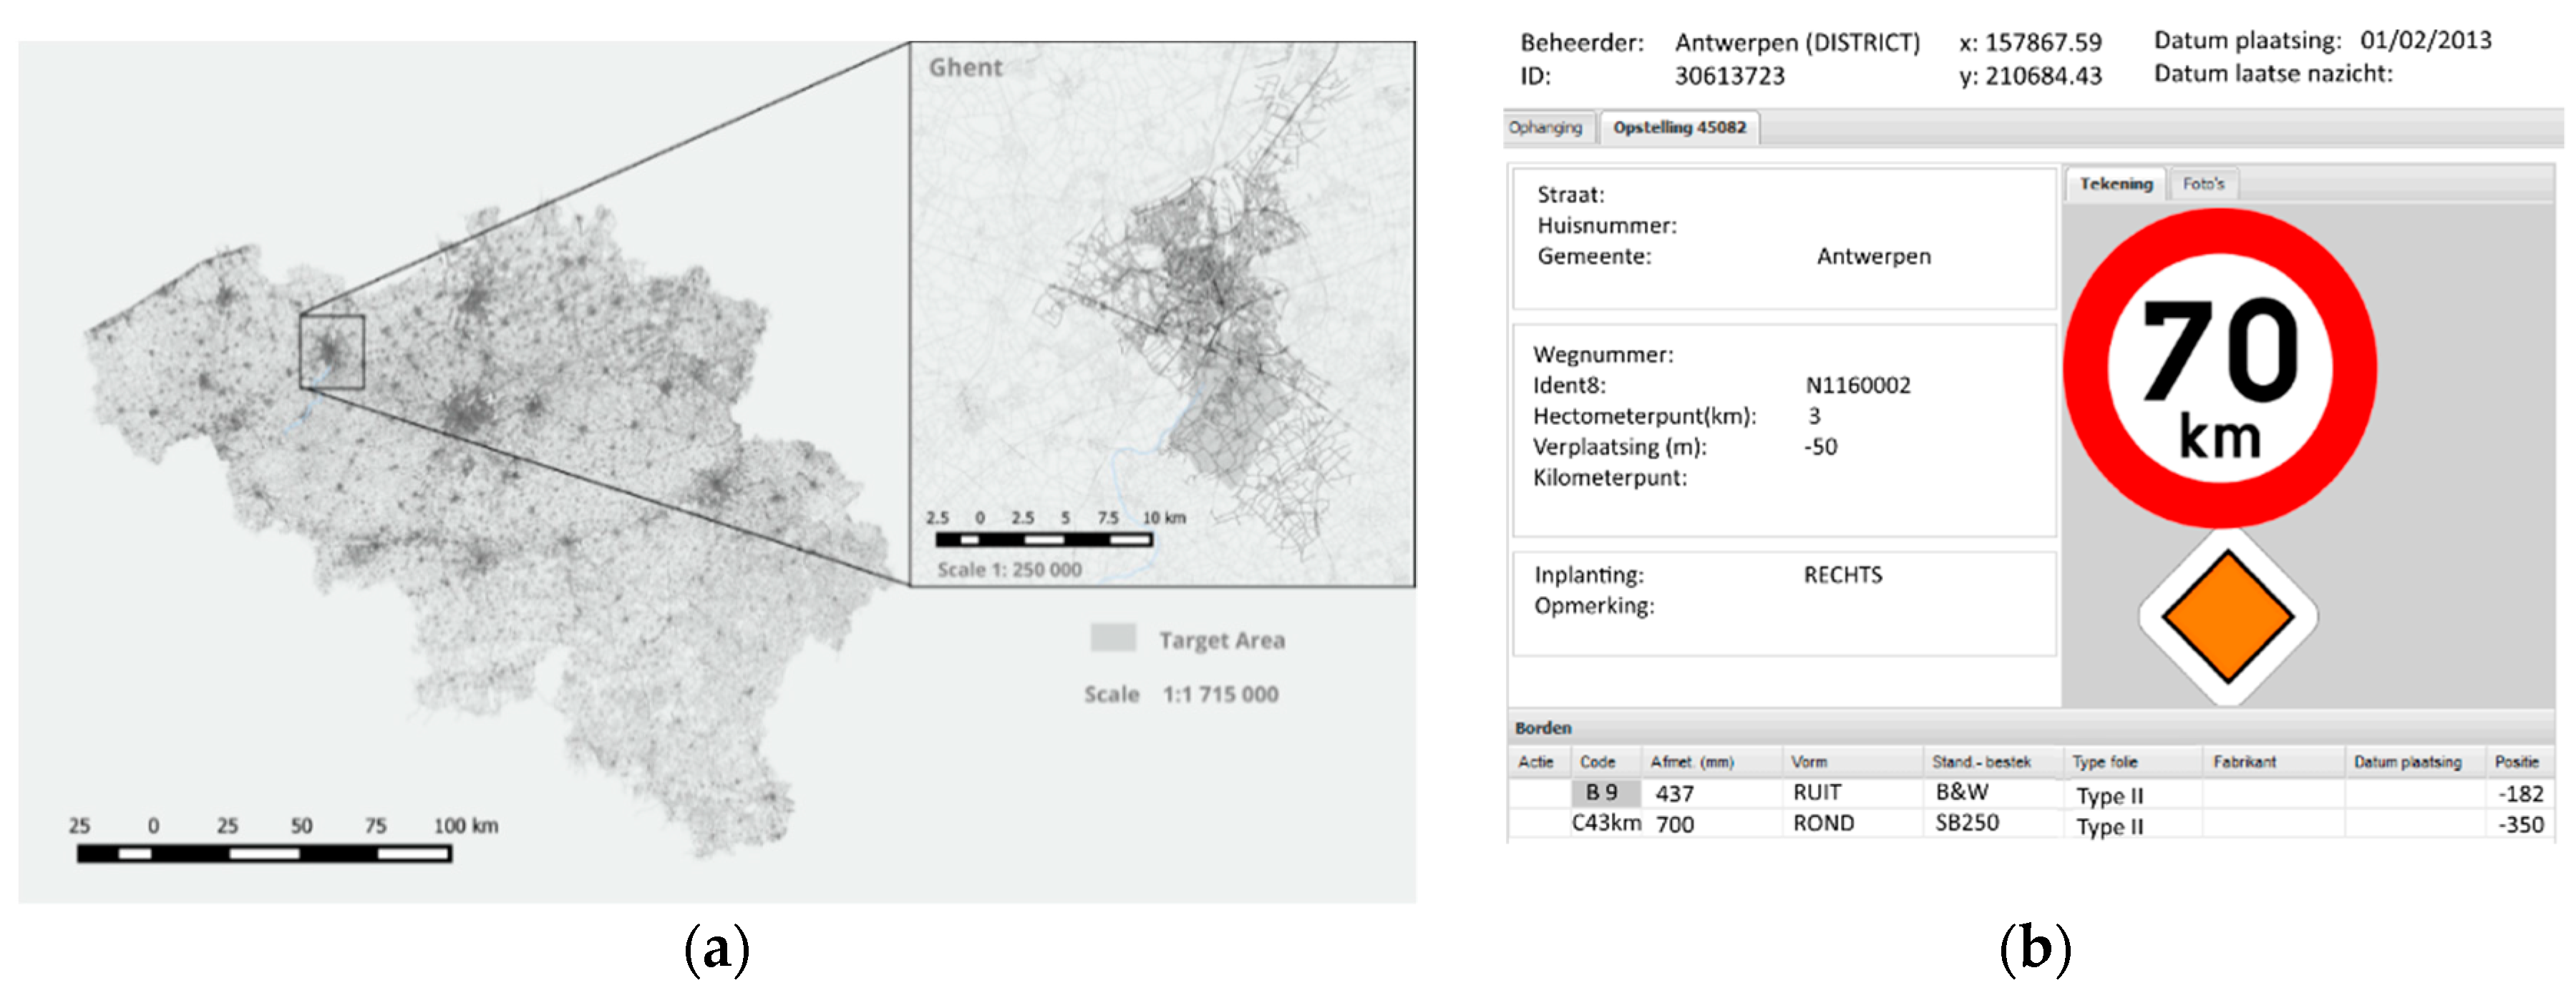
Figure 2.
Hierarchical structure of sustainable routing.

Figure 3.
Use case: (a) The routing location with indication of all traffic signs in the area; (b) The routing location with indication of sustainability-related traffic signs (red) and delivery locations (blue), (c) The Dijskstra-based route, (d) The route with the sustainability elements included in the route calculation.

Table 1.
Scale of preference between two parameters in the analytic hierarchy process (AHP) [25].
Table 1.
Scale of preference between two parameters in the analytic hierarchy process (AHP) [25].
| Preference Factor | Degree of Preference | Explanation |
|---|---|---|
| 1 | Equally | Two factors contribute equally to the objective |
| 3 | Moderately | Experience and judgment slightly to moderately favor one factor over another |
| 5 | Strongly | Experience and judgment strongly or essentially favor one factor over another |
| 7 | Very strongly | A factor is strongly favored over another, and its dominance is shown in practice |
| 9 | Extremely | The evidence of favoring one factor over another is of the highest degree possible of an affirmation |
| 2, 4, 6, 8 | Intermediate | Used to represent compromises between the preferences in weights 1, 3, 5, 7, and 9 |
| Reciprocals | Opposites | Used for inverse comparisons |
Table 2.
Random consistency index (RI).
| 1 | 2 | 3 | 4 | 5 | 6 | 7 | 8 | 9 | 10 | |
|---|---|---|---|---|---|---|---|---|---|---|
| 0 | 0 | 0.58 | 0.90 | 1.12 | 1.24 | 1.32 | 1.41 | 1.45 | 1.49 |
Table 3.
Relation between the traffic sign database types and sustainable routing.
| Type | Description | Type | Description | Type | Description | Type | Description | Type | Description |
|---|---|---|---|---|---|---|---|---|---|
| S34 | Park Area | S31 | Castle | F53 | Nursing Facility/Hospital | A31 | Construction Works | A23 | School |
| S36 | National Park Area | S32 | Ruins | F55 | Aid station/Ambulance | F47 | End of Construction Works | F12a | Start of Living Street zone |
| S33 | Abbey | F12b | End of Living Street zone | ||||||
| S35 | Monument | F4a | Start of zone 30 km/hr | ||||||
| F4b | End of Zone 30 km/hr | ||||||||
Table 4.
Calculation showing the pairwise comparison matrix, normalized relative weight, and normalized principal eigenvector for the historical areas sustainability element.
Table 4.
Calculation showing the pairwise comparison matrix, normalized relative weight, and normalized principal eigenvector for the historical areas sustainability element.
| Criteria | ||||
|---|---|---|---|---|
| Pair wise comparison matrix | ||||
| 1.00 | 1.00 | 4.00 | 1.00 | |
| 1.00 | 1.00 | 4.00 | 1.00 | |
| 0.25 | 0.26 | 1.00 | 0.25 | |
| 1.00 | 1.00 | 4.00 | 1.00 | |
| Sum | 3.25 | 3.26 | 13.00 | 3.25 |
| Normalized relative weight | ||||
| 0.308 | 0.308 | 0.308 | 0.308 | |
| 0.308 | 0.308 | 0.308 | 0.308 | |
| 0.077 | 0.077 | 0.077 | 0.077 | |
| 0.308 | 0.308 | 0.308 | 0.308 | |
| Sum | 1.00 | 1.00 | 1.00 | 1.00 |
| Historical areas sub-elements | Normalized principal eigenvector | |||
| 0.308 | ||||
| 0.308 | ||||
| 0.077 | ||||
| 0.308 | ||||
Table 5.
Pairwise comparison matrix and normalized principal eigenvector for each sustainability element.
Table 5.
Pairwise comparison matrix and normalized principal eigenvector for each sustainability element.
| Sustainable Routing Elements | Pairwise Comparison Matrix | Normalized Principal Eigenvector | |||
|---|---|---|---|---|---|
| Nature park areas | |||||
| 1.000 | 0.143 | 0.125 | |||
| 7.000 | 1.000 | 0.875 | |||
| Historical areas | |||||
| 1.00 | 1.00 | 4.000 | 1.000 | 0.308 | |
| 1.00 | 1.00 | 4.000 | 1.000 | 0.308 | |
| 0.25 | 0.26 | 1.000 | 0.250 | 0.077 | |
| 1.00 | 1.00 | 4.000 | 1.000 | 0.308 | |
| Care facility areas | |||||
| 1.000 | 5.000 | 0.833 | |||
| 0.200 | 1.000 | 0.167 | |||
| Construction areas | |||||
| 1.000 | 1.000 | ||||
| Children areas | |||||
| 1.000 | 4.000 | 9.000 | 0.701 | ||
| 0.250 | 1.000 | 6.000 | 0.243 | ||
| 0.111 | 0.167 | 1.000 | 0.056 | ||
Table 6.
Number of order of matrix , largest eigenvalue of the preference matrix, consistency index , random consistency index , and consistency ratio , for the sustainable routing elements.
Table 6.
Number of order of matrix , largest eigenvalue of the preference matrix, consistency index , random consistency index , and consistency ratio , for the sustainable routing elements.
| Criteria | |||||
|---|---|---|---|---|---|
| Nature park areas | 2 | 2.00000 | 0.00000 | 0.00 | 0.0000 |
| Historical areas | 4 | 4.00554 | 0.00185 | 0.90 | 0.0021 |
| Care facility areas | 2 | 2.00000 | 0.00000 | 0.00 | 0.0000 |
| Construction areas | 1 | 1.00000 | 1.00000 | 0.00 | 0.0000 |
| Children areas | 3 | 3.10564 | 0.05282 | 0.58 | 0.0911 |
Table 7.
Sustainable routing results.
| Results | Sustainable Routing | Dijkstra | ||||
|---|---|---|---|---|---|---|
| Distance | Sustainability Cost | Overall | Distance | Sustainability Cost | Overall | |
| Cost | 4735.76 | 1182.00 | 5917.76 | 4393.12 | 0 | 4393.12 |
| Percentage | 80.03% | 19.97% | 100.00% | 100% | 0% | 100.00% |
© 2019 by the authors. Licensee MDPI, Basel, Switzerland. This article is an open access article distributed under the terms and conditions of the Creative Commons Attribution (CC BY) license (http://creativecommons.org/licenses/by/4.0/).
Share and Cite
MDPI and ACS Style
Semanjski, I.; Gautama, S. A Collaborative Stakeholder Decision-Making Approach for Sustainable Urban Logistics. Sustainability 2019, 11, 234. https://doi.org/10.3390/su11010234
AMA Style
Semanjski I, Gautama S. A Collaborative Stakeholder Decision-Making Approach for Sustainable Urban Logistics. Sustainability. 2019; 11(1):234. https://doi.org/10.3390/su11010234
Chicago/Turabian StyleSemanjski, Ivana, and Sidharta Gautama. 2019. "A Collaborative Stakeholder Decision-Making Approach for Sustainable Urban Logistics" Sustainability 11, no. 1: 234. https://doi.org/10.3390/su11010234
Note that from the first issue of 2016, this journal uses article numbers instead of page numbers. See further details here.