Decision Support Systems for Smarter and Sustainable Logistics of Construction Sites


Luxembourg Institute of Science and Technology (LIST), 5 Av. des Hauts-Fourneaux, L-4362 Esch/Alzette, Luxembourg
*
Author to whom correspondence should be addressed.
Sustainability 2019, 11(10), 2762; https://doi.org/10.3390/su11102762
Submission received: 31 March 2019
/
Revised: 26 April 2019
/
Accepted: 27 April 2019
/
Published: 14 May 2019
(This article belongs to the Special Issue Decision Support Systems for Urban Logistics Planning: Multi-Stakeholder and Participative Approaches)
Abstract
:Efficient logistics in urban areas is crucial for construction companies since building materials account for 30–40% of all construction costs and the space on site is highly constrained. To face these challenges, actions coming from both public and private decision-makers to find more sustainable solutions related to the distribution of building materials in urban areas become urgent. Although barely used in such contexts, can decision support systems be of support, and for who and for which purpose? This paper proposes a set of decision support systems addressing public and private decision-makers to improve the construction logistics and supply chain with evidence-based decision-making mechanisms. Those systems are, in particular, a public participatory geographical information system for determining the impact of policy measures, a consolidation center locator, a consolidation center planner, and an innovation measures selector. The paper explains how these decision support systems are settled and experimented from the analysis of pilot sites in European cities and in collaboration with the companies. Our diverse experiments demonstrate that data-driven decision-making is worth it to trigger thought on improvement measures for construction freight transport in urban area. We conclude that additional attention should be devoted to this specific sector.
1. Introduction
As of 2018, around 55% of the world’s population lives in urban areas [1]. This share is expected to grow significantly. Europe is one of the most urbanized regions with 74% of its population living in urban areas in 2018. The share of this population is projected to rise to just over 80% by 2050, highlighting the need for more sustainable urban planning and public services [2]. The concentration of population in cities is causing an increase in construction works. This in turn leads to more trips related to and from construction sites, which often originate from far away and have huge negative externalities such as congestion, air pollution, noise, and accidents. According to the European Commission [3], transport is one of the main contributors of air pollution in cities and represents almost one-quarter of Europe’s greenhouse gas emissions. Urban freight is responsible for 25% of urban transport-related CO2 emissions and 30–50% of other transport-related pollutant emissions (particulate matter, nitrogen oxide) [4]. Congestion is another externality of the transport activity which has also a major economic impact, and it is estimated to contribute to 1% of the European Union (EU)’s gross domestic product (GDP) [5]. Facing that problem, the European Commission set the objective of reaching free CO2 city logistics by 2030 in major urban areas [6]. To address these challenges, policy-makers at the national and local level are seeking ways to make urban freight transport more sustainable and are increasing restrictions affecting it. As a result, city logistics that looks at efficient and effective transport of goods in urban areas while taking into account the negative effects on environment, safety, and congestion is critical to ensuring continued quality of life in cities.
This paper details a set of decision support systems (DSS) addressing public and private decision-makers, for instance, public authorities and construction companies, to improve the construction logistics and supply chain and facilitate evidence-based decision-making. Section 2 describes the so-called policy impact assessment DSS, a collaborative tool to demonstrate quickly and easily the impact of different policy and optimization measures on the sustainability of one or more construction projects. Section 3 describes three other DSSs as part of the so-called SUCCESFUL toolkit: the SUCCESSFUL-Action Plan DSS that provides guidance on the most appropriate logistics optimization measures, then the cost benefit analysis for CCC (SUCCESSFUL-CBA4CCC) DSS and the SUCCESSFUL-CCC locator DSS that provide guidance when implementing a CCC and help identify the conditions under which an urban consolidation center (UCC) is most likely sustainable. Section 4 provides a general discussion on the previously mentioned decision support systems and their relevance to the sustainability of the construction logistics. Section 5 concludes the paper.
2. Background
Alternative last mile solutions popped up in the last decades and some started disrupting the industry, especially the ones targeting the Business to Consumer e-commerce [7,8,9]. Some solutions already proved their benefits, while some others are too recent to justify their relevance. In this area, policy-makers need to consider where to drive innovation and where to slow down the autonomous economy to avoid unwanted consequences, such as job losses. For a sector with low margins, it is important to bring a change from traditional ways of delivering to better and economically more interesting ones. Hundreds of supply chains deliver goods to cities, each with its own specificities. Most last mile delivery solutions address today a large range of supply chains including, among others, e-commerce, HoReCa (hotels–restaurants–cafés), retail, and cold food. While the distribution of building materials represents a large share of the freight traffic in cities [10,11], very few initiatives address the construction sector, which suffers from poor productivity performance [12] and has a low appetite for investment in innovation. A recent study showed that poor logistics and supply chain management is one of the main causes of non-value adding operations [13].
The Sustainable Urban Consolidation Centers for Construction (SUCCESS) project sought to address the challenges pinpointed by the European Commission and, in particular, to improve the understanding of urban freight transport and to introduce more resource-efficient, more environmentally friendly, safer, and seamless supply chain innovations. It aimed to improve the efficiency and reduce the negative impacts of the construction supply chain by exploring and testing reliable and innovative solutions with a specific focus on the construction consolidation centers (CCCs). As illustrated in Scheme 1, a CCC is a logistics facility close to construction sites where building materials are delivered, sorted, and eventually dispatched to the construction sites on a just-in-time basis. The CCC provides suppliers with easier access to deliver their goods and enough space for big trucks to perform maneuvers and unloading operations. Building materials can be safely stored in a CCC and deliveries can be better organized to increase fluidity and react to urgent needs on construction sites. The concept is very similar to the urban consolidation center (UCC).
Various contributions [14,15,16,17] addressed the use of UCCs to improve the efficiency of urban freight transport and thereby reduce its impacts on traffic and the environment. While UCCs have been around for years, there are still doubts on both their economic viability and their ability to improve goods’ distribution and alleviate environmental and traffics issues within urban areas. Indeed, many UCCs failed once public funding became unavailable, thus proving that the scheme was not sustainable [16]. The lack of information on the costs and benefits of a UCC makes evidence-based decision-making difficult.
On the choice of policy measures for urban freight transport, recent studies [18] tested numerical simulated approaches to model the behaviors of stakeholders when selecting and implementing a Urban Freight Transport (UFT) policy measure. This suggests that supporting the stakeholders’ decision-making process for urban freight transport is a track of investigation.
3. The Collaborative Policy Impact Assessment DSS
3.1. Aim
This collaborative DSS tool helps demonstrate quickly and easily useful and sustainable solutions to improve the current situation and facilitates evidence-based decision-making. The policy impact assessment DSS helps understanding, quantifying, and comparing impacts of various policy and optimization measures on the delivery of building materials on construction sites. The policy and optimization measures implemented in this tool address restrictions on the size and emission standards of the delivery vehicles and the introduction of a CCC. The ambition was to foster collaboration between the relevant stakeholders, which have each their own goals, strategy, and understanding of the issue.
3.2. Methodology
The use of participatory, collaborative, and/or interactive approaches is quite common in urban planning. The aim of such approaches is to embed stakeholders in the process of making decisions on urban planning that will affect urban activities. Participatory approaches are required to overcome the lack of knowledge exchange between stakeholders [19,20,21]. While participatory approaches are usually low-tech and take the form of public meetings, studies proposed the use of technology, usually a geographical information system (GIS), in such contexts [22,23]. Later, the use of GIS was extended to a public-wide context [24], which is referred to as a public participation GIS (PPGIS) [25,26,27]. The authors experienced the use of a PPGIS with a tangible tabletop for making collective decisions on urban logistics [28]. Given the positive feedback of the PPGIS experience with a tangible tabletop, the authors chose to renew the tangible PPGIS approach for the purpose of construction logistics.
Over the interactive tangible tabletop presented in Figure 1, decision-makers can stand around and discuss, in a collaborative way, how to solve a problem. The hardware part of the PPGIS is a 55-inch touchscreen usually designed as a combinable cell for a visualization wall. The screen includes a touch detection technology with infrared cameras that allow the detection of hands, fingers, and objects with optical markers. For the purpose of the PPGIS approach, the screen was used horizontally (laid on a table) instead of vertically (hanging on a wall). This setting allowed the use of optical-marked physical objects (i.e., tokens) as interfaces with the GIS. The screen is connected to a computer that hosts the GIS. In such a configuration, the screen acts both as a display unit and as an input unit. However, the finger touching capability is not exploited. Only the optical reading of objects is used.
For the software part, the core GIS layer is an open-source database management system with GIS capability: the PostgreSQL system with the PostGIS extension. On top of this layer, a display and interaction capture layer are added in the form of a Java application.
3.3. Data Collection
The tool is generic but the illustration was developed around a case study in Luxembourg City. The set of data required to present this case study is derived from data observed over eight months of activity in one of the four real construction sites observed during SUCCESS. The volume of building materials, number of deliveries, etc. for the three other sites were estimated proportionally to the size of the construction site. The vehicles’ sizes and emission standards were observed on one site (over eight months of operations), and then their distributions were computed. It was assumed that the vehicles delivering the three remaining construction sites followed the same distribution.
The routing data were computed using road networks data from Open Street Map with the PGrouting library. The air pollutant emissions were computed from the routing data, combined with vehicles’ data (size and emission standard) with the COPERT© tool.
This formed the baseline for the development of several “what-if” scenarios, where parameters (mainly policy measures) can be modified through the PPGIS. For each scenario, the impact on logistics operations indicators (travel distance, number of deliveries) on environment (particulate matter (PMx) and CO2 emissions) and on health was precomputed so that it could be displayed to the users in the PPGIS.
3.4. Data Representation
Over the interactive tangible table, the user lays down tokens representing basic information related to the construction logistics and to the impact of policy measures. A token can represent information in different views. Table 1 summarizes the possible user interactions. Firstly, the user displays the locations of the construction sites and their suppliers (construction sites and supplier tokens).
By moving and/or rotating the relevant tokens, the user can apply different policy decisions related to the CCC (CCC token), as well as the size and emission standard of delivery vehicles admitted into the city (vehicle size and vehicle emission standard tokens), and get immediate information on their impact on a set of indicators (Dashboard token). Considering the different options that the three policy and optimization measures provide, the user can simulate 47 different scenarios and compare each of them to the situation observed during the data collection (the baseline). The user can display the impact of the selected measures with the Dashboard token that shows a circular bar chart of the indicators. An example of token choice and the resulting display is illustrated in Figure 1.
3.5. Results
3.5.1. Impact of the size of the vehicle
The user can quantify the impact of restricting the size of the vehicles used to deliver building materials to the four construction sites.
- The baseline represents the distribution of vehicles observed on the four constructions sites (current situation), with a mix of light (30% of the total), medium (20% of the total), and heavy (50% of the total) vehicles;
- Light (<3.5 t): with this measure, only light (N1 size) vehicles are allowed to deliver goods in the city center;
- Medium (Rigid trucks between 7.5 t and 12 t);
- Heavy (Articulated trucks between 28 t and 34 t).
We acknowledge that some options are purely theoretic since light vehicles cannot be the only size of vehicle that suppliers can use to deliver construction materials because of their volume and weight.
Indeed, restricting the vehicle size alone does not influence positively the impact of deliveries. On the contrary, restricting the delivery to light vehicles only makes the number of trips explode, which increases all the environmental indicators (CO2, PM10, and PM2.5) by 255% to 295%, as well as the health indicator (disability-adjusted life years (DALY)) by 445% and the operation indicators (travel distance and number of deliveries) by 1000% of the baseline.
The situation is a bit better (or less worse) with medium-sized vehicles, but still underperforming when compared to the baseline; environmental indicators increase by 33% to 43%, the health indicator increases by 23%, and the operations indicators increase by 60%.
Restricting to heavy vehicles only allows a decrease in operation indicators (with a 20% drop in distance and a 30% drop in the number of deliveries), but environmental and health indicators raise slightly above the baseline (+4–7% for PM10 and PM2.5 and +14% for DALY).
In this case, the mix of vehicles represented by the baseline is revealed to be the best option.
3.5.2. Impact of the Emission Standard of the Vehicle
The user can quantify the impact of restricting the emission standard of the vehicles used to deliver building materials to the four construction sites.
- The baseline represents the distribution of vehicles observed on the four constructions sites (current situation), with a mix of Euro II (11.3%), Euro III (5.5%), Euro IV (17.3%), Euro V (36.9%), and Euro VI (29%);
- Euro IV: all vehicles are replaced by Euro IV vehicles of similar size;
- Euro VI: all vehicles are replaced by Euro VI vehicles of similar size.
Restricting the vehicle’s emission standards does positively influence the impact of deliveries only in the case of Euro VI. In both cases (Euro IV and Euro VI), the operation indicators are unchanged, since the size of the vehicles and their routing do not change when restricting only the emission standard.
When restricting to Euro IV, the environmental indicators increase by 7% to 10% for PM10 and PM2.5 while CO2 increase is very limited (+0.8%) and the health indicator’s increase is even more limited (+0.16%). This is explained by the fact that replacing all vehicles with Euro IV ones results in improving the performance for part of the fleet but lowering the performance for another part as compared to the baseline distribution.
When restricting to Euro VI, the environmental indicators decrease significantly for PMx (−31% for PM10 and −44% for PM2.5); however, counterintuitively, the CO2 increases slightly. This is due to the fact that the Euro VI standard focuses on the reduction of NOx emissions (which we do not monitor in our simulations) by relaxing very slightly the CO2 emissions in comparison to previous emissions standards. The health indicator decreases slightly (−2%).
The best option is, therefore, to increase the requirement for vehicle emission standards, although it does not guarantee an improvement of all indicators.
3.5.3. Impact of the Introduction of a CCC and Its Location
For the purpose of the scenario, we identified three locations where potential CCCs could operate. It was assumed that, when a CCC is used, the observed deliveries are split into two parts, an inbound flow from the supplier to the CCC and a consolidated outbound flow from the CCC to the construction sites. Another strong assumption was made, i.e., that the CCC uses a fully loaded heavy vehicle to deliver the materials to the construction sites.
In the PPGIS, the user can quantify the impact of implementing a CCC to deliver building materials to the four construction sites by using the CCC token. By manipulating the token, he can choose one of the three locations for the CCC or stay in the current situation with no CCC.
With the introduction of a CCC, in the three options, the number of deliveries (−15%) and the total distance traveled drop (from 25% to 37%) when compared to the baseline. However, the environmental and health indicators do not necessarily drop as well. Indeed, the CCC location might induce a longer travel distance in urban or on non-motorway roads where delivery vehicles have more environmental impact. Particulate matter is reduced in all cases (due to the lower number of vehicles driving in the city center) from 16% to 2%. However, for CO2 emissions and for the health indicator, only one out of three potential locations for a CCC appears to be a better choice than the situation without a CCC (the baseline).
These results show that introducing a CCC, as a single policy measure, does not necessarily bring a positive environmental and health impact on the delivery of building materials. Only when the location of the CCC is carefully chosen, based on the analysis of delivery history, can the environmental impact be improved.
3.5.4. Impact of Combined Policy Measures
The PPGIS offers the possibility for users to combine policy measures in order to see the impact of such combined measures, thus allowing a multi-criteria decision analysis. The authors assumed that vehicles for the outbound flow (delivering to the construction site) are always heavy vehicles (see previous section), which means that, when combining vehicle size restriction and the use of a CCC, the restriction applies to the inbound flow (vehicles delivering to the CCC).
Out of the 47 possible scenarios, only five lead to the reduction of all indicators when compared to the baseline. All five scenarios make use of a CCC, the one located closest to the construction sites, in combination with one of the other policy measures. Among these, the best combination of policy measures is the following:
- Size of the vehicle for inbound flows: heavy trucks;
- Emission standards: restriction to Euro VI class;
- Use of CCC: located closest to the construction sites.
This combination of measures would hypothetically allow a 39% reduction in total delivery distance, a 49% reduction of the number of deliveries to the construction site, a decrease in PM10 and PM2.5 emissions by 18% and 17% respectively, a reduction in CO2 by 11%, and a decrease of the health impact indicator by 9%.
3.6. Experimentation and Validation
The PPGIS was first proposed to SUCCESS project partners to support their decision. As illustrated in Figure 2, the construction company that provided the data used the PPGIS for one month at the end of 2018. In a free use context, the company exposed the impact of the logistics operations related to its core activities to its internal and external stakeholders. The PPGIS was also presented in scientific conferences and business exhibitions between 2017 and 2018 to hundreds of visitors. Finally, the PPGIS is visible to the public in the showroom of the authors’ institute since mid-2017. Regular exhibitions are done to raise scientific awareness of the public or of specific scientific or industrial visitors. In all cases, the authors received very positive feedback from the community who was impressed by the capacity of this application to explain a complex context resulting from a vast amount of information and correlations in a simple and visual way. It appears that the tool helps break down some prejudices such as the idea that light vehicles fit urban freight transport better than heavy vehicles or that a CCC necessarily provides positive environmental impacts.
4. The SUCCESSFUL Toolkit
Complementary to the previous collaborative DSS, a toolkit called SUCCESSFUL allows urban decision-makers, as well as transport and logistics and construction companies, to receive targeted advices on potential optimization measures for future construction projects. The toolkit is a set of three freely available software tools, as follows:
- SUCCESSFUL-Action Plan: the DSS assesses the logistics complexity of a given set of projects in a given city and identifies the most appropriate optimization measures;
- SUCCESSFUL-CCC Locator: the DSS identifies the optimal location of a CCC among a given set of options;
- SUCCESSFUL-CBA4CCC: the DSS assesses the costs and the benefits that a CCC would bring for a given set of projects in a given city.
The three tools are all available on the same platform, illustrated in Figure 3, allowing the end-user to create a personal account and benefit from a more convenient and personal browsing experience. The SUCCESSFUL-CCC Locator DSS is integrated in the SUCCESSFUL-CBA4CCC DSS so the decision-maker can skip some steps when estimating distance and access time.
4.1. SUCCESSFUL-Action Plan DSS
4.1.1. Aim
The SUCCESSFUL-Action Plan DSS provides both local authorities and construction companies with a framework for making the construction logistics and supply chain more efficient. It is designed to assess the logistics complexity of a construction project and explore solutions adapted to its profile among about 70 solutions that address the logistics challenges. Because each city and each construction project are different, the set of selected measures may drastically change. For example, a construction site with a very limited available space and located in a congested area may require a clear and effective strategy to reduce the negative externalities caused by its logistics. On the other hand, a construction site located in a new urban area may require a less proactive and costly set of mitigating actions.
4.1.2. Methodology
The identification of the most appropriate measures follows a two-step approach.
- In the first step, the DSS helps the decision-maker (a construction company or a local authority) to evaluate the logistics profile of a construction site, which reflects its complexity. This step determines which projects should receive highest priority within a portfolio of projects that were already evaluated.
- In the second step, the decision-maker selects among the evaluated projects a construction site to which he or she wants to give more attention (i.e., construction projects classified as high priority) and selects the objectives that his or her organization targets. Finally, the decision-maker is guided in the preparation of an action plan with a selection of the most appropriate measures based on the overall complexity of the project and the selected objectives.
4.1.3. Step 1: Evaluating the Logistics Profile of the Construction Project
The logistics profile of a construction site is assessed along two primary dimensions: the urban complexity and the site complexity. The urban area dimension addresses the complexity of a set of variables related to the accessibility of the construction site. The construction site dimension looks at the complexity of a set of variables related to the construction site itself.
Based on the experience learned from past projects (e.g., the Interreg NWE IVB LaMiLo project; the House of BioHealth, Eco², and Royal Grace construction projects) and the SUCCESS project, a group of six experts from the logistics and construction sectors identified 22 variables listed in Table 2. Each of them was evaluated on a four-point rating scale (slightly (one point) to extremely complex (four points)).
For each variable, the experts’ group defined different levels of complexity. The rating of each variable was either evidence-based or perception-based. Indeed, some variables, such as turnover, can be rated in numerical terms. Others, such as city logistics regulation, can only be rated by the judgement of the assessor, as illustrated in Table 3 and Figure 4. During this phase, the decision-maker collects all relevant information, thus enabling him or her to determine with a high level of confidence the complexity of each dimension.
The decision-maker is guided through the evaluation assessment with questions illustrating each variable and with additional explanations and examples to ease the understanding. The global evaluation of the variables’ score determines the rating of the dimension. When all the ratings related to a dimension are identified, the DSS calculates the average of the dimension. Each variable has the same weight for the rating of the dimension. Using these ratings, the assessor can determine the level of complexity achieved for one dimension.
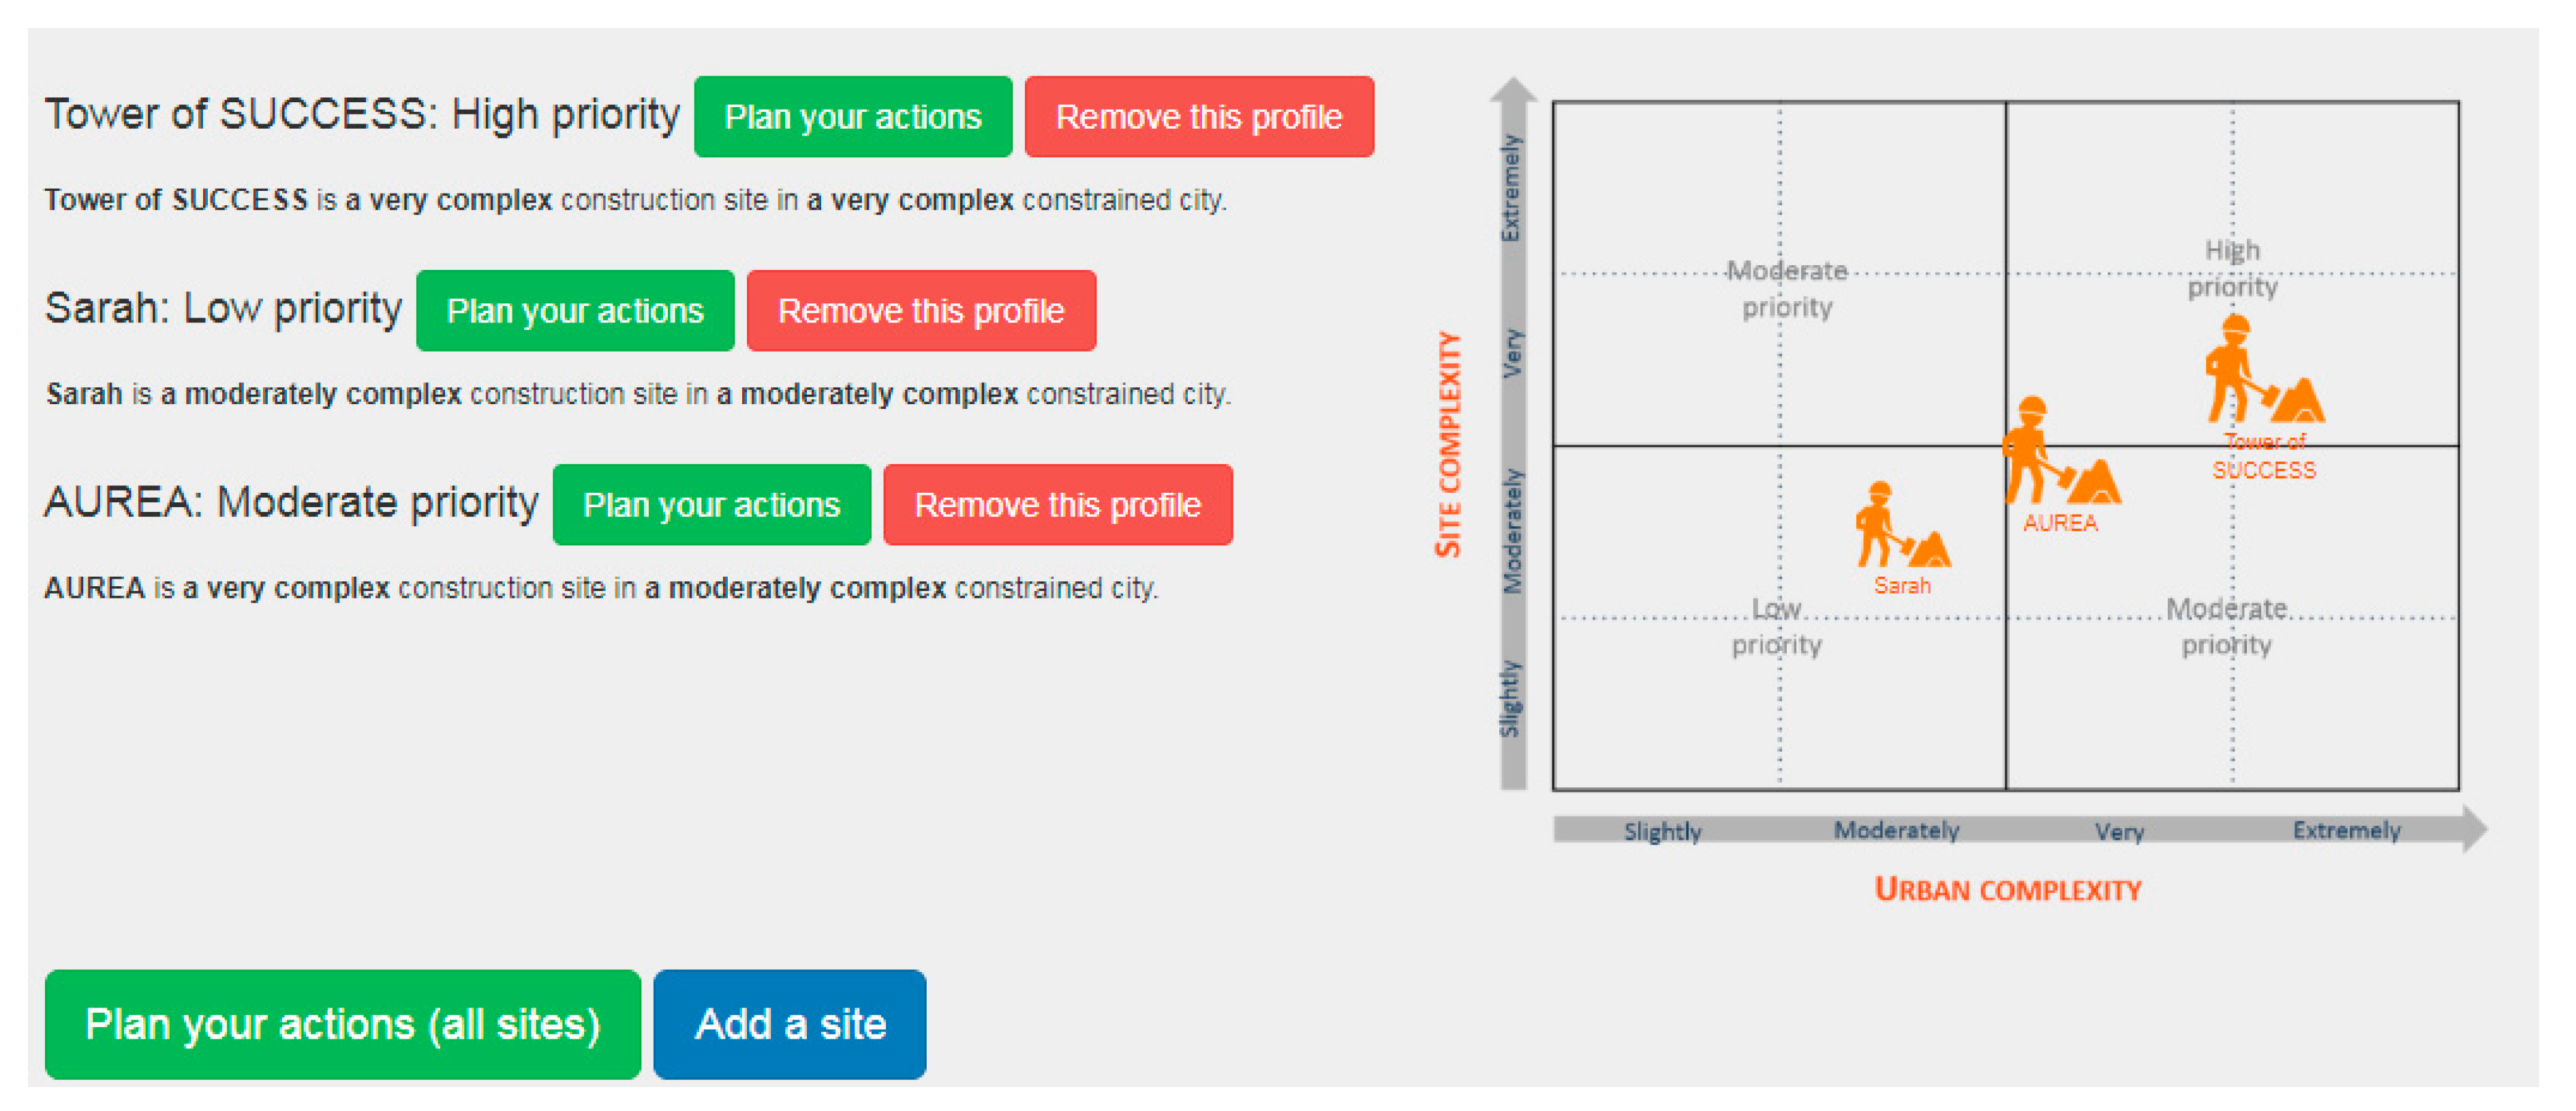
The complexity of the construction project is evaluated against the full range of variables for both the urban area and construction site dimensions. A logistics profile is determined from the combination of the urban complexity and construction complexity scores of a construction project. For an easy understanding, the DSS graphically represents the logistics profile on a matrix that increases visibility and facilitates the comparison between different projects’ complexity, helping determine which construction projects need an action plan in priority. The logistics profile matrix uses a 4 × 4 matrix with the scale of complexity for the urban and site dimensions “slightly”, “moderately”, “very”, and “extremely” complex.
The overall logistics profile of the construction site ranks as low, moderate, or high priority. Construction projects in low priority benefit from very good conditions on the construction site and accessibility to the site. The projects that fall in this category do not need proactive actions since such actions would offer little benefit. The added value of improving logistics for this category is low. Construction projects in moderate priority are somehow constrained by either the site itself or the surrounding urban area. Investment should be intermediate for projects falling in this category since the added value of improving logistics for this category is moderate. Construction projects in high priority are highly constrained by the site itself and are located in a constrained urban area. The added value of improving logistics for this category is the highest. An action plan to reduce the negative externalities should target primarily construction projects in this category since they offer the greatest benefit. It is important to understand the priority of each project in terms of logistics as it allows the construction company or the local authority to appreciate the relative importance of each project and decide what resources they will allocate to managing that complexity.
A sample of the logistics profile matrix is given below for a reference in Figure 5. It shows the complexity of three construction projects. The size of the icon in the chart is proportional to the turnover of the project. The decision-maker should here focus his or her efforts on projects falling in the “high-priority” category and having the higher turnover.
4.1.4. Step 2: Exploring Solutions Adapted to Its Profile
After selecting the construction project for which the decision-maker wants to focus on, the DSS proposes the decision-maker to select and prioritize objectives the organization targets among a set of 15 objectives such as “increase safety outside the construction site”, “reduce congestion”, or “reduce waste”. Based on the priorities and the overall complexity of the project, the DSS proposes a list of the most appropriate measures ordered by relevance. The proposed measures are a selection among 75 measures that the consortium identified as solutions to improve the logistics and supply chain management in the construction. We acknowledge that other practices exist and that the DSS proposes only a subset of the existing practices.
The measures are mapped against the 22 variables so that the assessment guides the decision-maker in identifying the most relevant measures for his or her own situation and preparing an action plan. Some variables may be more determinant than others to qualify a measure. Table 4 presents an illustration of the mapping between one measure (logistics team in this case) and the variables that have an influence on the adoption of this measure (see Table 3 for the notation). The table specifies the rating that a variable needs to achieve to make the measure relevant. In other words, the table can be read as follows: if the variable scores at the level indicated in the cell, then the implementation of the measure might be relevant to reduce the complexity.
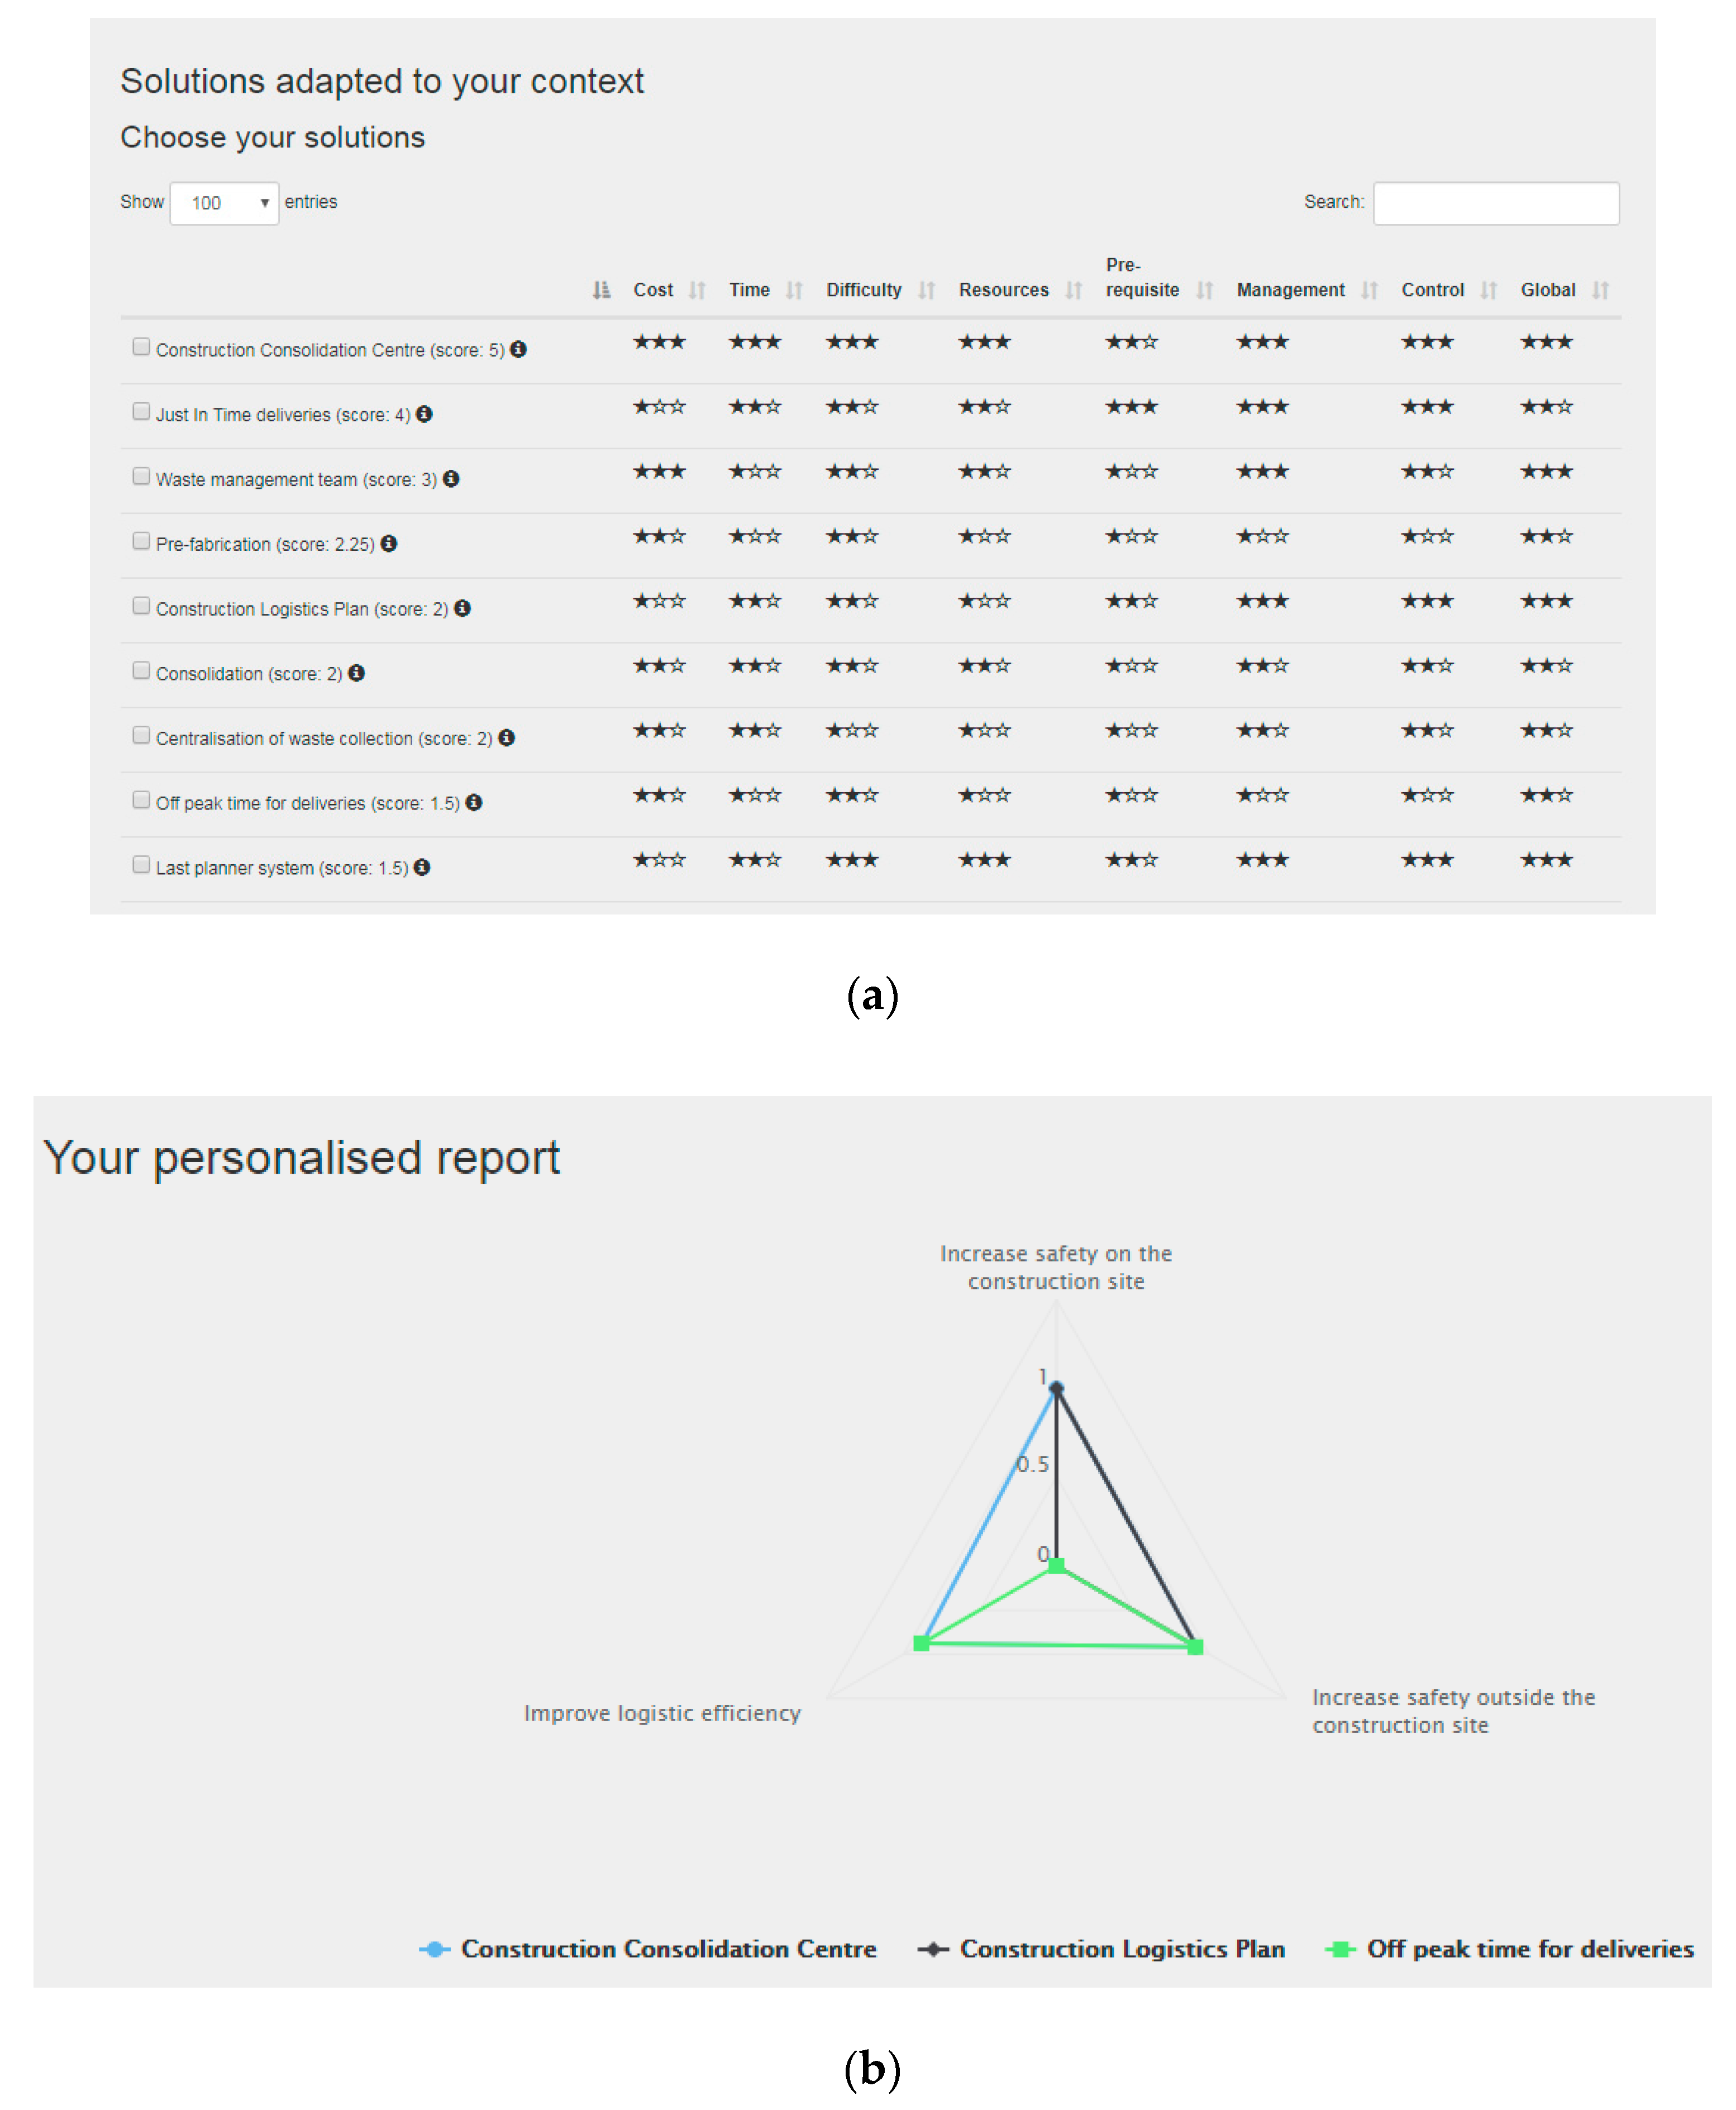
Then, the DSS proposes to the decision-maker to select measures among the most appropriate ones based on the evaluation of each measure against eight criteria indicating the effort to invest to implement and maintain the measure: cost, time, difficulty, resources, pre-requisite, management, control, and global (Figure 6a). Finally, the DSS graphically represents on a radar chart the extent to which the selected measures will help reach the selected objectives (Figure 6b).
4.2. SUCCESSFUL-CBA4CCC DSS
4.2.1. Aim
The project identifies the CCC as a particularly promising solution for the construction sector under pressure to increase its productivity performance while reducing the associated negative externalities. The main barriers remain in evaluating the economic viability and designing the related sustainable business model. The viability of a CCC must be evaluated on a case-by-case basis and depends on many variables. There exist few examples of CCCs; the most known are those in Stockholm that received public subsidies granted during the period of construction of a large urban development project and those in London for which the business model relies essentially on the regulatory framework which includes a congestion charge scheme and high-level requirements for developers. CCCs can be financially sustainable, even without public help, but the initiative must be located in a context that is favorable to their development (in terms of geographical location, chosen business model, political environment, etc.). The feasibility and profitability of a CCC highly depends on the possibility to reach economies of scale to compensate the extra costs; thus, the presence of big construction sites or the choice of a CCC serving several sites seems to be the most financially sustainable in the long term.
In that context, a CBA tool named “CBA4CCC” was developed to specifically address the construction sector in assessing in a simplified manner the potential benefits and associated costs that a CCC would bring for a given set of projects in a given city.
4.2.2. Methodology
The tool relies on a cost–benefit analysis approach (CBA), a quantitative approach that provides support to decide whether to go ahead with a project. It involves a comparison of the expected benefits of an action compared with the associated costs that gives the net present value (NPV). If the NPV is positive, the benefits are greater than the costs and the project will, over time, be profitable. If the NPV is negative, the project will never be profitable and the project is not worth the effort. The developed appraisal framework relies on the basic principles outlined in the Guide to Cost Benefit Analysis of Investment Projects by the Evaluation Unit of the European Commission Directorate General of Regional Policy.
The tool results from a deep analysis of the costs and benefits of CCC applied to the four construction sites observed during the project (Luxembourg City, Paris, Valencia, and Verona). The approach proposed in the tool provides a simplified version of the analysis based on a number of assumptions. The current version of the DSS allows the evaluation of different scenarios including only the use of one CCC and not several. The definition of the business model can be supported by the use of a business model canvas and by the analysis of the business models that were applied in previous UCC and CCC experiences. This information will be useful in order to detect business models suitable for the implementation of CCCs by the construction industry.
Because several stakeholders can participate in the implementation of a CCC, the DSS addresses four types of stakeholders who can be involved in such initiative: construction companies, logistics and service providers (LSPs), material suppliers, and public authorities. We assume that stakeholders do not have access to the same kind of data according to their profile and will not be interested by the same results and benefits. Therefore, the decision-maker provides a set of inputs that depends on its profile and the DSS proposes different perspectives.
4.2.3. CBA4CCC Construction Company
The SUCCESSFUL-CBA4CCC DSS proposes to a construction company to evaluate the potential benefits that the implementation of a CCC would bring if the company operates the CCC. In this case, the CCC is a cost center where the main benefits come from the optimization and the savings in the core operations of the construction company (although the operations could be outsourced to an LSP). There are no revenues since the construction company is the customer and provider of the service. Thus, the benefits of the CCC are assessed globally for the construction company by estimating the savings that the CCC brings to its core business (i.e., construction activity). The construction company will likely select this scenario if it is the only customer of the service and the CCC serves one big project or several projects.
The CCC could benefit the main contractor who wants to improve logistic efficiency on site and, therefore, reduce the risk of letting the project run behind schedule or over budget. It could also benefit the trade contractors who are interested in a secured storage area to reduce thefts, and damage or loss of materials and equipment. Globally, the main benefits for the construction company are the following:
- Improvement of labor force’s productivity;
- Better use of materials due to fewer stolen/damaged items;
- Better reliability and punctuality of deliveries;
- Increased safety conditions on site due to the reduction of material handling;
- Benefits of the just-in-time method applied to the construction industry;
- Reduced stock on site;
- Reduced number of vehicles on site and better delivery planning;
- Waste reduction and possibility to use round trips for reverse logistics.
To configure the scenario in the DSS, the decision-maker should first give an estimation on the following:
- The inflation rate (%);
- The discount rate (%);
- The location of the CCC or the average distance (km) from the CCC to the construction sites;
- If the user provides the location of the CCC, the DSS calculates the average distance via the DSS CCC locator.
- The number of working days (per year);
- The number of construction sites;
- The number of deliveries to each construction site (average number per day);
- The turnover of all the construction projects (€/year);
- The share of the labor force that will benefit from the CCC compared to the total cost of the project (%);
- The share of the material cost that will be delivered by the CCC compared to the total cost of the project (%);
- The rental cost of the CCC (€/m²/month).
Based on the configured scenario, the DSS generates a spreadsheet including the estimated costs and benefits associated with the implementation of a CCC for a life span of 10 years. The cost estimate comes from the following:
- Cost of the facility (€);
- Cost of the staff (€);
- Cost of operating the vehicles (€);
- General expenses of the CCC (€).
The estimate of the revenues come from economic savings due to a better labor performance on the site and better utilization and handling of building materials as follows:
- Personnel savings (€);
- Savings due to better utilization of materials (€);
- Savings due to unsorted bins (€).
The net present value is calculated from the previous costs and benefits and is compared to the situation without CCC so the construction company can evaluate if the use of a CCC is economically viable.
Additionally, the DSS proposes some recommendations in terms of dimensioning of the service to implement to work correctly, such as the following:
- Facility (m²): total surface needed included the one for the storage;
- Fleet of vehicles: number of trucks recommended per tonnage;
- Labor force: number of managers, operators, drivers and other staff;
- Equipment: number of different types of handling equipment at the CCC (e.g., forklifts).
4.2.4. CBA4CCC Logistics and Service Provider
The SUCCESSFUL-CBA4CCC DSS proposes to an LSP to evaluate the potential benefits that the implementation of a CCC would bring if it operates a CCC. In this case, the LSP is managing a CCC as a profit center and the revenues come from services provided to the construction companies. In this case, the LSP is likely offering services to several construction companies and, therefore, serving several construction sites simultaneously. The CCC is operated on a permanent basis and is responsible for the investments required (e.g., infrastructure, vehicles).
To configure the scenario in the DSS, the decision-maker should first provide his or her estimation of the following:
- The inflation rate (%);
- The discount rate (%);
- The location of the CCC or the average distance (km) from the CCC to the construction sites;
- The number of working days (per year);
- The number of construction sites served by the CCC;
- The number of deliveries to each construction site (average number per day);
- The turnover of all the construction projects (€/year);
- The price per unit moved (€/pallet).
Based on the configured scenario, the DSS generates a spreadsheet including the estimated costs and benefits associated with the implementation of a CCC for a life span of 10 years. The cost estimate comes from the following:
- Cost of the facility (€);
- Cost of the staff (€);
- Cost of operating the vehicles (€);
- General expenses of the CCC (€).
The estimated revenues come from the services provided to the construction companies. They include not only the delivery of the building materials, but also additional services such as express deliveries, off-peak deliveries, working package, rented space for pre-fabrication, mock-up, and storage. We acknowledge that the LSP could also get revenues from the services provided to suppliers, but this eventuality is not integrated in this model.
The net present value is calculated from the previous costs and benefits and is compared to the situation without CCC so the LSP can evaluate if the use of a CCC is economically viable.
Additionally, the DSS proposes some recommendations in terms of dimensioning of the service to implement to work correctly. The types of recommendations are the same as the ones for the construction companies.
4.2.5. CBA4CCC Material Supplier
The SUCCESSFUL-CBA4CCC DSS proposes to a material supplier to evaluate the potential benefits that the implementation of a CCC would bring if he or she uses the services offered by a CCC. In this case, the CCC addresses the suppliers (shippers or carriers) who are asked to use the CCC by the construction company. If they do not pay directly the CCC, we imagine that their customers would ask them for a discount. We acknowledge that the CCC could address suppliers who prefer not entering the city during the peak hours and dropping off material at the CCC at their convenience, and that suppliers who do not have a warehouse to store temporary equipment could use the CCC as storage; however, the DSS does not integrate these scenarios at this stage. The main benefits of a CCC for the material’s supplier are the following:
- Better vehicle utilization (better load factor);
- Better driver utilization (reduction in travel time);
- Reduction of the unit cost of transport for the final delivery stage;
- Reduction in the number of vehicle-kilometers;
- Reduction in freight journeys;
- More flexibility for deliveries to the CCC than to the construction site.
To configure the scenario in the DSS, the decision-maker should first provide his or her estimation of the following:
- The location of the CCC or the average distance (km) and the average time (min) from the CCC to the construction sites;
- The average distance (km) and the average time (min) from the warehouse to the CCC.
Then, the decision-maker sets values for the congestion charge (zero in the absence of one) and describes the fleet by indicating for each category of vehicles the number of vehicles, their euro class, number of deliveries, and transport costs outside and inside the city.
Based on the configured scenario, the DSS generates a spreadsheet including estimations on the following socio-economic savings:
- Time saving for unloading operations (min);
- Saving for not traveling outside the construction site (min, km, and €);
- Saving for not traveling inside the construction site (min, km, and €);
- Cost saving from the congestion charge (€);
- Transport saving per delivery (€/delivery).
4.2.6. CBA4CCC Public Authorities
The SUCCESSFUL-CBA4CCC DSS proposes to a public authority to evaluate the potential benefits that the implementation of a CCC would bring if it serves one or several construction sites. Public authorities are mostly interested in getting a livable city where the negative externalities related to the transport of materials such as accidents, congestion, noise, pollution, and the production of waste are limited. They could implement UFT policies that have a direct impact on the delivery to construction sites with the objective to reduce the associated negative effects and, therefore, create the conditions that could ensure the business case for a CCC. Among the common policy measures [29,30,31], the DSS considers the two following ones on which the cities can evaluate the impacts: access restriction based on the emissions of the vehicles that can enter the city and congestion charge. The main benefits of a CCC for the public authorities are the following:
- Transport optimization for last-mile distribution inside the city;
- Incentives to use environmentally friendly vehicles for the last-mile distribution;
- Reduction in the number of vehicle-kilometers and freight journeys;
- Reduction in congestion inside the city (for direct and reverse logistics);
- Reduction of pollutant emissions inside the city;
- Reduction in the number of construction vehicles entering the city;
- Improvement of the working environment and the living conditions of the citizens;
- Waste reduction;
- Health and safety improvements due to better working conditions.
To configure the scenario in the DSS, the decision-maker should first provide an estimation of the following:
- The location of the CCC or the average distance (km) and the average time (min) from the CCC to the construction sites;
- The number of construction sites;
- The average daily number to each construction site.
Then, the decision-maker sets a value for the congestion charge and restrictions on the emissions standards of different types of vehicles.
Based on the configured scenario, the DSS generates a spreadsheet including estimations of the following environmental and economic savings:
- Distance saved inside the city (km);
- Revenue from the congestion charge (€);
- CO emissions avoided inside the city (kg);
- PM2.5 emissions avoided inside the city (ppm);
- PM10 emissions avoided inside the city (ppm);
- NOx emissions avoided inside the city (kg);
- CO2 emissions not generated inside the city (kg);
- Number of trucks removed from the city (vehicles).
4.3. SUCCESSFUL-CCC Locator DSS
4.3.1. Aim
The location of the CCC as an intermediate node in the supply chain plays a key role to reach its main objectives, which are to reduce vehicle accidents, congestion, emissions, and noise within the city. If facility location problems are extensively investigated in the operational research from a variety of algorithmic perspectives, we believe that applications of these models to specific sectors considering the lack of certain data remain of interest. Indeed, a facility location solver is usually based on origin/destination and the volume of material delivered, which is difficult to estimate prior to a construction project. The SUCCESFUL-CCC locator DSS provides evidence-based decision-making with minimum information on volume and suppliers’ location to select the most appropriate location for a CCC among a given set of existing facilities in order to minimize travel distance, driving time, and emissions. The tool considers environmental and traffic impacts and does not consider socio-economic impacts but the SUCCESSFUL-CBA4CCC DSS instead.
4.3.2. Proposed Framework
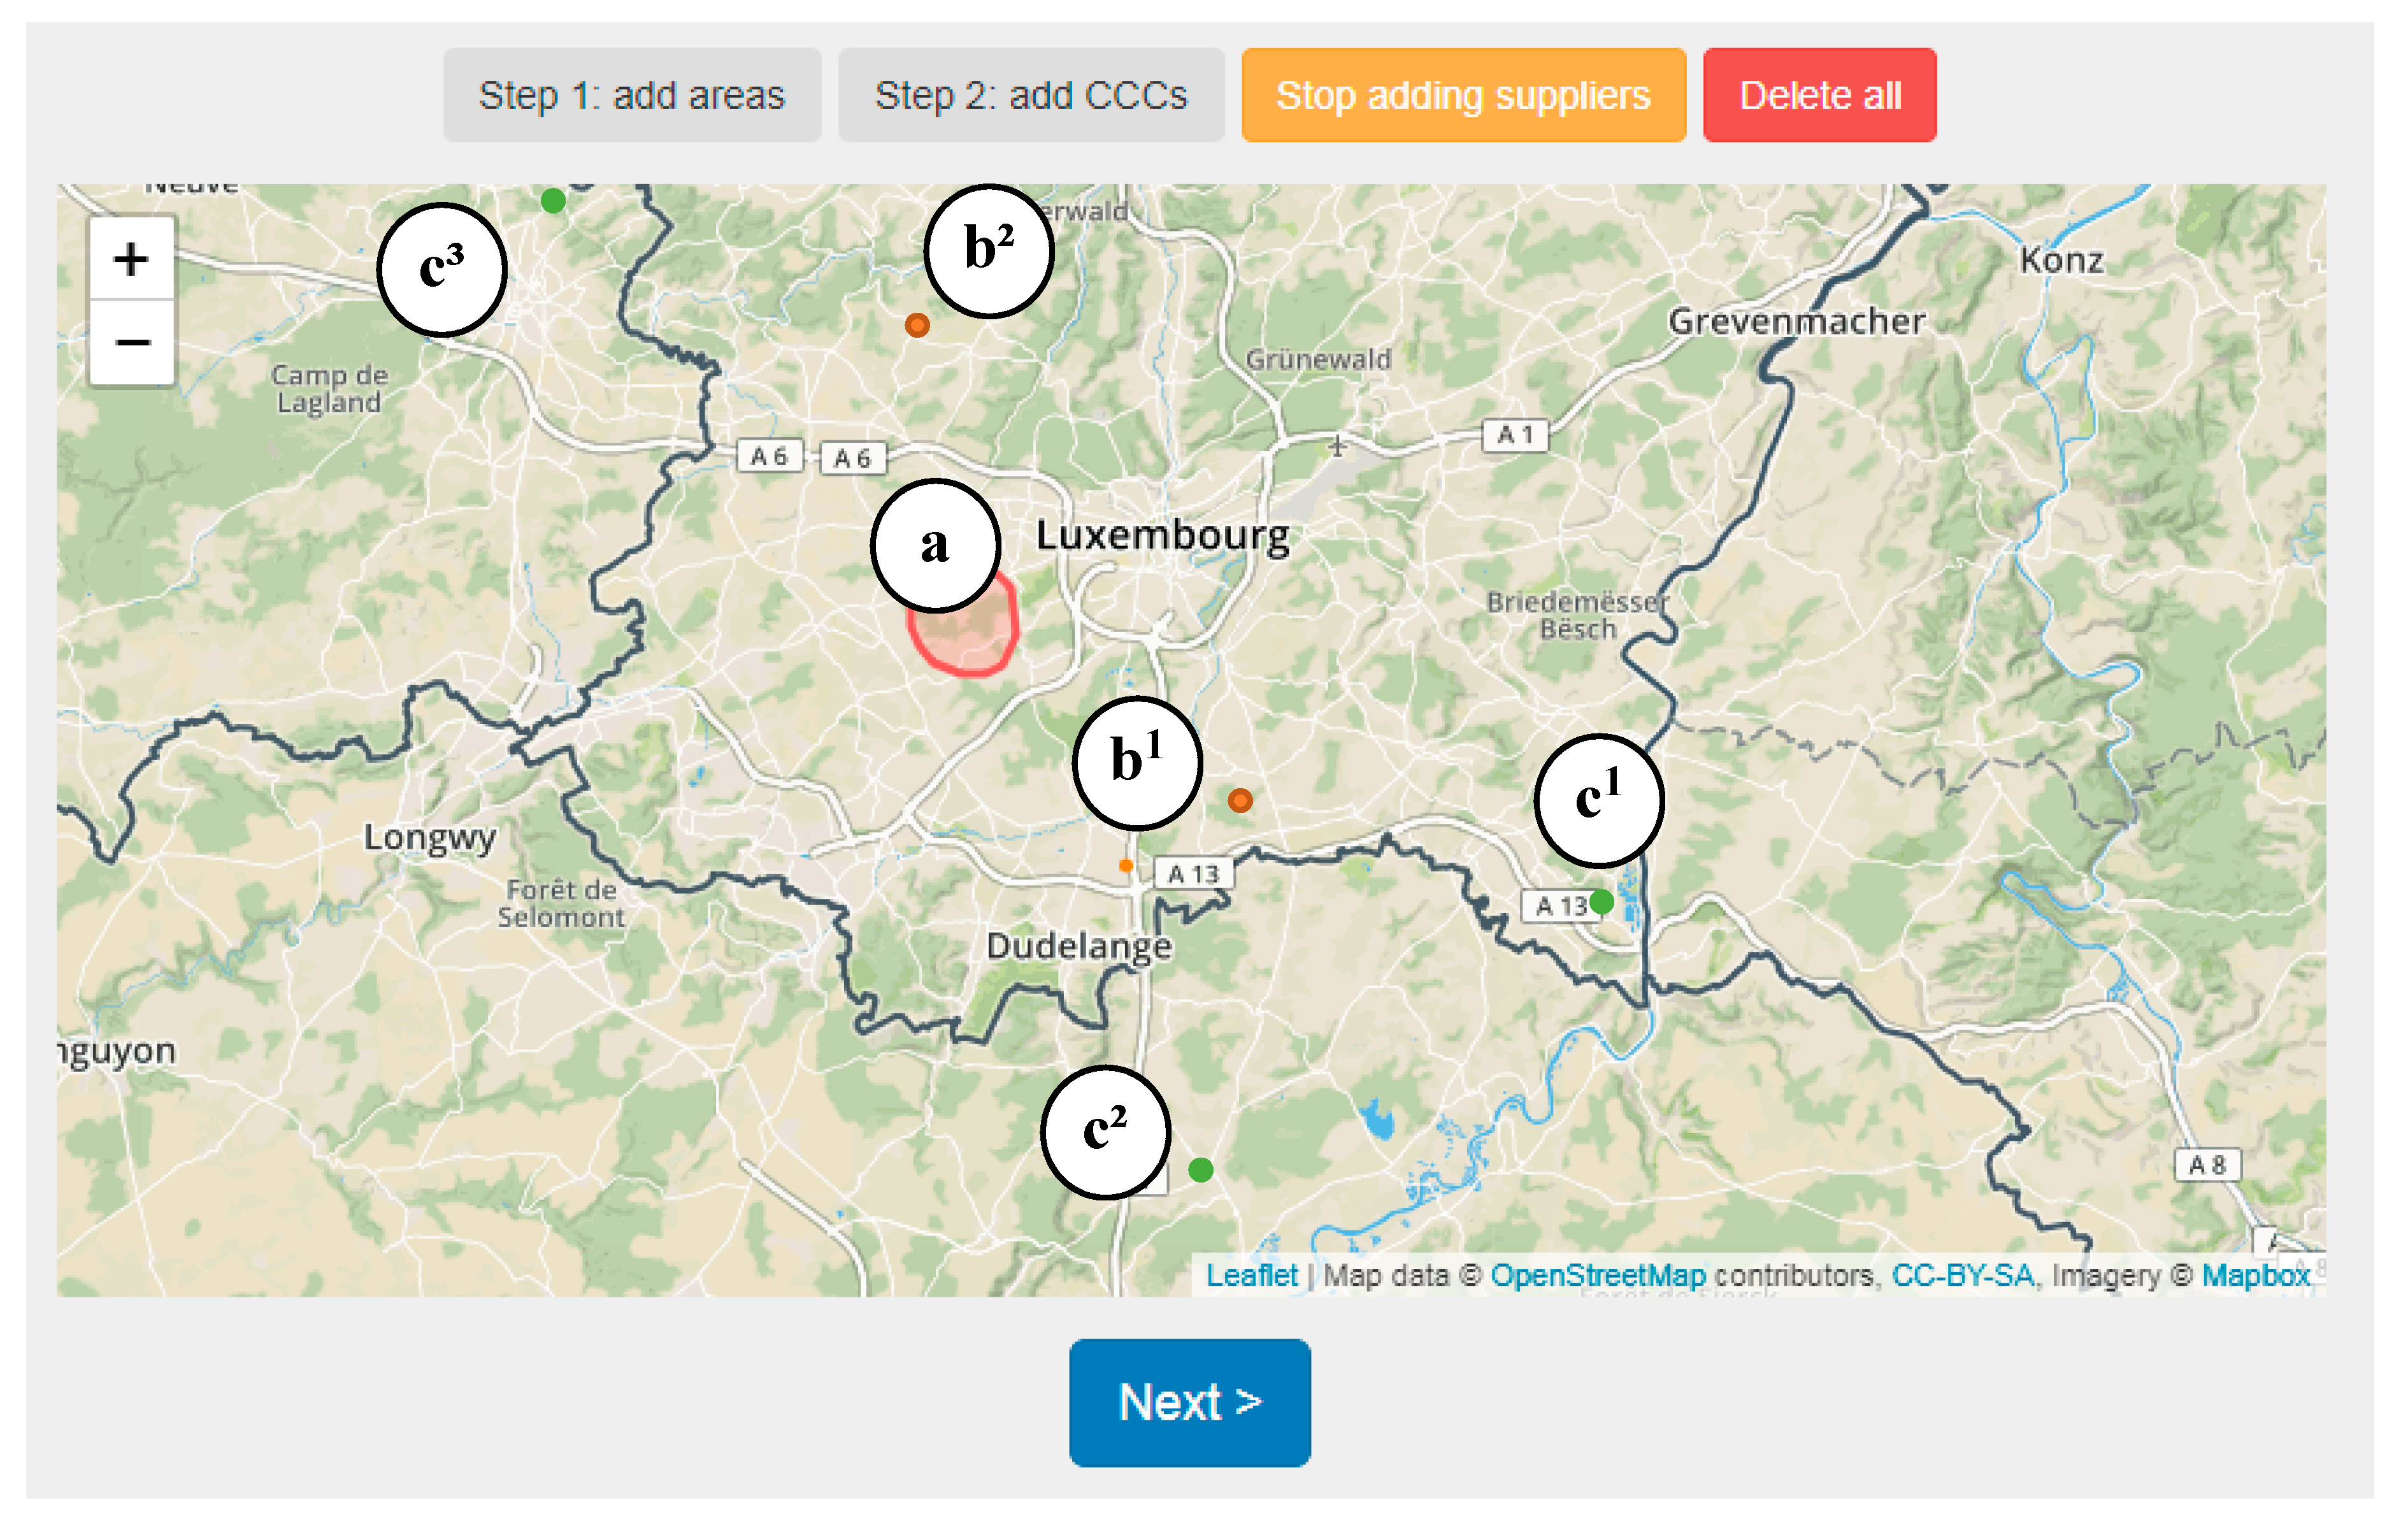
Firstly, the decision-maker builds a scenario in which he or she defines on a map the locations of construction projects, potential CCCs, and suppliers (see Figure 7). The construction projects are represented with a polygon that delimits a demand area to which the user associates the total value of the construction sites (€) and their type (i.e., public buildings, apartments, urban works, offices). Potential CCCs are represented with orange points and do not have any capacity restriction in terms of storage. Finally, potential suppliers are represented with green points to which the user associates the building materials they deliver (i.e., civil works, external works, facades waterproofing, finishing, mechanical, electrical, and plumbing). The user associates one to several types of building materials to a supplier and at least one supplier to each type of building material. These software modules and the mapping elements were developed using popular web services and open-source tools such as the Leaflet JavaScript library and data from the OpenStreetMap community.
Once the user builds the scenario, the DSS generates a configuration file that includes a set of indicators estimated for the baseline (situation without a CCC) and the potential CCCs. The indicators are the following: traveled distance, time, number of deliveries, load, CO emissions, PM2.5 emissions, PM10 emissions, NOx emissions, and CO2 emissions.
The time and travel distances are calculated based on a web service, managed by MapQuest, which provides real distances between two coordinates.
The other indicators are generated through a local library that executes a simulation for each CCC in the scenario described by the decision-maker. The simulations rely on a mathematical model of the stochastic facility location problem. The volume of building materials delivered to the construction site(s) is estimated from data collected on the four construction sites observed during the SUCCESS project. The computation of the emissions results from the estimated traveled distance and emission factors based on COPERT©.
With the estimated results, the decision-maker compares the alternative scenarios with each other and can select the most appropriate providing evidence-based decision-making.
4.4. Experimentation and Validation
The SUCCESSFUL toolkit DSS was applied to the four construction projects as an initial experiment. The simulations for each of the four cities assessing the impacts of the use of a CCC serving one to several construction projects showed very good results. The daily number of freight vehicles for both direct and reverse logistics can be reduced by 42% to 54%; CO2 emissions can be reduced by 13% to 33%, NOx ones by 8% to 41%, and PMx ones by 19% to 30%; the distance traveled by construction vehicles can be reduced by 20% to 42%; small deliveries can be eliminated entirely, and the load factor can be increased by 41% to 232%. Also, proper management of a CCC can make it a viable business, with a payback that is often very short (less than a year) and only in one case is of five years. However, it is difficult at this stage to evaluate the robustness of the models since neither a CCC nor other measures are actually implemented. Implementing a CCC is a project that usually takes a long time before being operational. Current initiatives in Luxembourg City and Brussels with construction companies implementing a CCC and in France for the Olympic Games should bring helpful information to improve the current version of the toolkit. The models are based on the assumptions derived from data observed over eight months of four construction sites. If the quantity and the diversity of the collected data give us enough confidence to propose a first set of models, other sets of data representing other types of construction projects in other cities are necessary to improve the current models.
Additionally, the SUCCESSFUL toolkit DSS was presented in detail to 12 additional cities, mainly represented by public authorities. They generally showed interest in its benefits and highlighted how CCC practices are complex and need to take into consideration different elements, as reported hereafter.
The main feedback concerning the SUCCESSFUL-CBA4CCC DSS refers to the following:
- The quantification of indicators in each CCC: it strongly depends on the local context and makes the generalization of the evaluation of the benefits difficult. The complexity of CCC practices makes their assessment with a standard tool quite difficult.
- The opportunity of raising awareness: cities noted that it gives useful estimations to assess the impact of the CCCs’ activation and it can be a starting point for a more detailed cost–benefit analysis. The evaluation should be followed with more detailed and tailored analyses with reference to the specific case before taking decisions to introduce a CCC or not.
The main comments for the SUCCESSFUL-Action Plan DSS concerned the following:
- The tool can be useful for a high-level support to decision-making;
- The matching between the measures and the variables;
- The tool does not provide a statistically reliable basis to generalize;
- The tool can help dialogue and communication between public and private stakeholders.
This partial experimentation received a lot of interest from the cities, which asked to be informed of the release of the tool.
5. General Discussion
Addressing challenges in city logistics requires a wide range of data that can now be collected and monitored more extensively and accurately with recent developments in information and communications technology (ICT) and intelligent transportation system (ITS). With the spread of Internet of things (IoT) sensors on vehicles, infrastructure, and goods, we can capture a large amount of real-time data at lower costs and share it in a transparent and secure way. Data can refer to traffic data, truck movements, or movements of goods captured at high frequency in urban areas. This provides opportunities for improving the performance and reducing the impacts of the urban freight transport in developing more advanced DSSs that will grasp the complexity of urban freight distribution. The most effective transport strategy, measure, or tool relies strongly on the capability to evaluate the economic, environmental, and social impacts of transport solutions. Advanced propositions to support the decision-making either for the choice of innovation measures [18] or for more operational questions like routing of dangerous goods [32] are promising but require important volume of accurate data.
If the technology is ready, we could wait for decades before witnessing a full exploitation of its potential. Construction is today one of the least digitalized sectors after agriculture [33]. For a sector with low margins and apparently stuck in a time warp, investment in innovation remains difficult, as does digitization and data reliability. Therefore, the authors think that the introduction of decision support solutions should be gradual and related to the maturity of the sector. The DSSs presented are simple, and do not integrate all aspects of urban freight transport, like hazardous material transport, but remain applicable in context.
Stakeholders involved in the planning phase underestimate the impact of transport. In the lifecycle of a standard construction project, transport and logistics issues are addressed during the execution phase, whereas they should be addressed earlier in the planning phase since they impact the local communities with regards to accidents, congestion, noise, and pollution. In the United Kingdom (UK), planners, developers, and construction contractors develop, during the planning permission process, a construction logistics plan focusing specifically on construction supply chains and how their impact on the road network can be reduced.
The set of DSSs we developed results from the observation and analysis of building constructions (hospital, office, and residential buildings). We may think that the approach should not fit infrastructure constructions that include public works, bridges, and highways. If the latter are executed in a widely spread area, the nature of activities is less diverse, as well as their supply chain. For example, road construction results from repetitive work including mainly earthwork and paving. In comparison, a residential construction will involve numerous sub-contractors that will perform specific activities sequentially, including among others structural works, cover and roofing, plumbing, electrical, and landscaping. However, infrastructure projects have limited means to work in isolation and, therefore, suffer from a higher exposure to the public, especially in urban areas. One of the other main characteristics that could have an impact on modeling is that most infrastructure projects such as roads, subways, and trams are mobile construction sites that change as the works go on.
6. Conclusions
Construction logistics is a niche market and a complex segment gathering a multitude of stakeholders with conflicting interests. To accommodate the growing population in urban areas, cities are renovating and developing building and infrastructure constructions as part of large redevelopment plans. To face the challenges related to the distribution of building materials in urban areas, actions coming from public and private decision-makers to find new solutions to limit nuisances become urgent. Because there is no one-size-fits-all solution to managing the urban supply chain, it is essential to take the specificities of each city and construction project into account. With specific regard to CCCs, the successful implementation of a CCC must be evaluated on a case-by-case basis and depends on many variables. In fact, CCCs can be financially sustainable, even without public help, but they must be deployed in favorable contexts (in terms of geographical location, chosen business model, political environment, etc.). The feasibility and profitability of a CCC highly depends on the possibility to reach economies of scale to compensate for the extra costs; thus, the presence of big construction sites or the choice of a CCC serving several sites seems to be most sustainable in the long term. As both a large customer and regulator, the public sector could play an important role in the adoption of this type of solution. Indeed, the public sector, which accounts for 20–30% of the total construction spending [12], could include the use of a CCC in the tendering process and, thus, democratize an innovative practice.
The set of DSSs dedicated to construction logistics and supply chain presented in this paper provides urban decision-makers, and transport and logistics and construction companies with evidence-based decision-making support to (a) identify the most adapt measures for their future projects (collaborative DSS on the tangible tabletop and SUCCESSFUL-Action Plan DSS), and (b) assess the impact of the adoption of a CCC (SUCCESSFUL-CBA4CC and CCC locator DSSs). Experiments demonstrated decision-makers’ interest for DSSs that are specific to their sector. Future studies on additional construction projects representing diverse types of construction projects, other sectors, and diverse cities across the world should improve the models supporting our DSSs to improve their robustness.
Author Contributions
Writing—original draft preparation, C.G. and S.R.; writing—review and editing, S.F; software; S.F.; methodology, C.G. and S.R.; supervision, F.F; review edition, F.F.
Funding
This paper is part of the SUCCESS project, funded from the European Union’s H2020 research and innovation program under grant agreement no. 633338 (www.success-urbanlogistics.eu).
Acknowledgments
The authors thank all the partners of SUCCESS who contributed to the development of the DSSs.
Conflicts of Interest
The authors declare no conflicts of interest.
References
- United Nations. 68% of the World Population Projected to Live in Urban Areas by 2050, Says UN; United Nations Department of Economic Social Affairs: New York, NY, USA, 2018. [Google Scholar]
- United Nations. Around 2.5 Billion More People Will Be Living in Cities by 2050, Projects New UN Report; United Nations Department of Economic Social Affairs: New York, NY, USA, 2018. [Google Scholar]
- European Commission. A European Strategy for Low-Emission Mobility. 2016. Available online: https://eur-lex.europa.eu/resource.html?uri=cellar:e44d3c21-531e-11e6-89bd-01aa75ed71a1.0002.02/DOC_1&format=PDF (accessed on 26 April 2019).
- ALICE. Urban Freight Research Roadmap; European Road Transport Research Advisory Council: Brussels, Belgium, 2015. [Google Scholar]
- UN-Habitat; European Union. The State of European Cities 2016: Cities Leading the Way to a Better Future; United Nations Organization: New York, NY, USA, 2016; ISBN 978-92-1-132717-5. [Google Scholar]
- European Commission. Roadmap to a Single European Transport Area—Towards a Competitive and Resource Efficient Transport System; European Commission: Brussels, Belgium, 2011. [Google Scholar]
- Morganti, E.; Seidel, S.; Blanquart, C.; Dablanc, L.; Lenz, B. The Impact of E-commerce on Final Deliveries: Alternative Parcel Delivery Services in France and Germany. Transp. Res. Procedia 2014, 4, 178–190. [Google Scholar] [CrossRef]
- Taniguchi, E.; Thompson, R.G. City Logistics: Mapping the Future; CRC Press: Bocaton, FL, USA, 2014; ISBN 978-1-4822-0889-4. [Google Scholar]
- McKinsey. Parcel Delivery—The Future of Last Mile; McKinsey & Company: New York, NY, USA, 2016. [Google Scholar]
- Amstel, W.P.V.; Wagter, H.; Quak, H.; Boer, E.D. Annual Outlook City Logistics 2050. 2017. Available online: https://www.researchgate.net/profile/Walther_Ploos_van_Amstel/publication/320831599_Annual_Outlook_City_Logistics_2050/links/59fc6894aca272347a211f7b/Annual-Outlook-City-Logistics-2050.pdf (accessed on 26 April 2019).
- Dablanc, L. Freight Transport for Development Toolkit: Urban Freight; The World Bank: Washington, DC, USA, 2009; pp. 1–57. [Google Scholar]
- The Economist. The Construction Industry’s Productivity Problem—Can We Fix It? 2017. Available online: https://www.economist.com/leaders/2017/08/17/the-construction-industrys-productivity-problem (accessed on 26 April 2019).
- Aalto University. iCONS: Boosting Construction Productivity with Indoor Positioning. 2019. Available online: https://www.aalto.fi/en/news/icons-boosting-construction-productivity-with-indoor-positioning (accessed on 26 April 2019).
- Marcucci, E.; Danielis, R. The potential demand for a urban freight consolidation centre. Transportation 2008, 35, 269–284. [Google Scholar] [CrossRef]
- Leonardi, J.; Dablanc, L.; Van Egmond, P.; Guerlain, C. Feasibility Study of a Network of Consolidation Centres in Luxembourg. In Proceedings of the 10th International Conference on City Logistics, Tenerife, Spain, 17–19 June 2015; p. 15. [Google Scholar]
- Allen, J.; Browne, M.; Woodburn, A.; Leonardi, J. The Role of Urban Consolidation Centres in Sustainable Freight Transport. Transp. Rev. 2012, 32, 473–490. [Google Scholar] [CrossRef]
- Janjevic, M.; Kaminsky, P.; Ndiaye, A.B. Downscaling the consolidation of goods—State of the art and transferability of micro-consolidation initiatives. Eur. Transp. 2013, 23. [Google Scholar]
- Le Pira, M.; Marcucci, E.; Gatta, V.; Inturri, G.; Ignaccolo, M.; Pluchino, A. Integrating discrete choice models and agent-based models for ex-ante evaluation of stakeholder policy acceptability in urban freight transport. Res. Transp. Econ. 2017, 64, 13–25. [Google Scholar] [CrossRef]
- Lindholm, M. A sustainable perspective on urban freight transport: Factors affecting local authorities in the planning procedures. Procedia Soc. Behav. Sci. 2010, 2, 6205–6216. [Google Scholar] [CrossRef]
- Van Rooijen, T.; Quak, H. City Logistics in the European CIVITAS Initiative. Procedia Soc. Behav. Sci. 2014, 125, 312–325. [Google Scholar] [CrossRef]
- Witkowski, J.; Kiba-Janiak, M. The Role of Local Governments in the Development of City Logistics. Procedia Soc. Behav. Sci. 2014, 125, 373–385. [Google Scholar] [CrossRef]
- Balram, S.; Dragicevic, S.; Feick, R. Collaborative GIS for spatial decision support and visualization. J. Environ. Manag. 2009, 90, 1963–1965. [Google Scholar] [CrossRef] [PubMed]
- Hall, G.B.; Moore, A.; Knight, P.; Hankey, N. The extraction and utilization of local and scientific geospatial knowledge within the Bluff oyster fishery, New Zealand. J. Environ. Manag. 2009, 90, 2055–2070. [Google Scholar] [CrossRef] [PubMed]
- Salter, J.D.; Campbell, C.; Journeay, M.; Sheppard, S.R.J. The digital workshop: Exploring the use of interactive and immersive visualisation tools in participatory planning. J. Environ. Manag. 2009, 90, 2090–2101. [Google Scholar] [CrossRef] [PubMed]
- Bugs, G.; Granell, C.; Fonts, O.; Huerta, J.; Painho, M. An assessment of Public Participation GIS and Web 2.0 technologies in urban planning practice in Canela, Brazil. Cities 2010, 27, 172–181. [Google Scholar] [CrossRef]
- Davies, S.R.; Selin, C.; Gano, G.; Pereira, Â.G. Citizen engagement and urban change: Three case studies of material deliberation. Cities 2012, 29, 351–357. [Google Scholar] [CrossRef]
- Haklay, M.; Jankowski, P.; Zwoliński, Z. Selected modern methods and tools for public participation in urban planning—A review. Quaest. Geogr. 2018, 37, 127–149. [Google Scholar] [CrossRef]
- Guerlain, C.; Cortina, S.; Renault, S. Towards a collaborative Geographical Information System to support collective decision making for urban logistics initiatives. In Proceedings of the 9th International Conference on City Logistics, Tenerife, Spain, 17–19 June 2015. [Google Scholar]
- Ogden, K.W. Urban Goods Movement: A Guide to Policy and Planning; Ashgate: Aldershot, UK; Brookfield, VT, USA, 1992; ISBN 978-1-85742-029-6. [Google Scholar]
- Russo, F.; Comi, A. A classification of city logistics measures and connected impacts. Procedia Soc. Behav. Sci. 2010, 2, 6355–6365. [Google Scholar] [CrossRef]
- Stathopoulos, A.; Valeri, E.; Marcucci, E. Stakeholder reactions to urban freight policy innovation. J. Transp. Geogr. 2012, 22, 34–45. [Google Scholar] [CrossRef]
- Ebrahimi, H.; Tadic, M. Optimization of dangerous goods transport in urban zone. Decis. Mak. Appl. Manag. Eng. 2018, 1, 131–152. [Google Scholar] [CrossRef]
- McKinsey. Imagining Construction’s Digital Future; McKinsey & Company: New York, NY, USA, 2016. [Google Scholar]
Scheme 1.
Construction consolidation center (CCC) scheme.
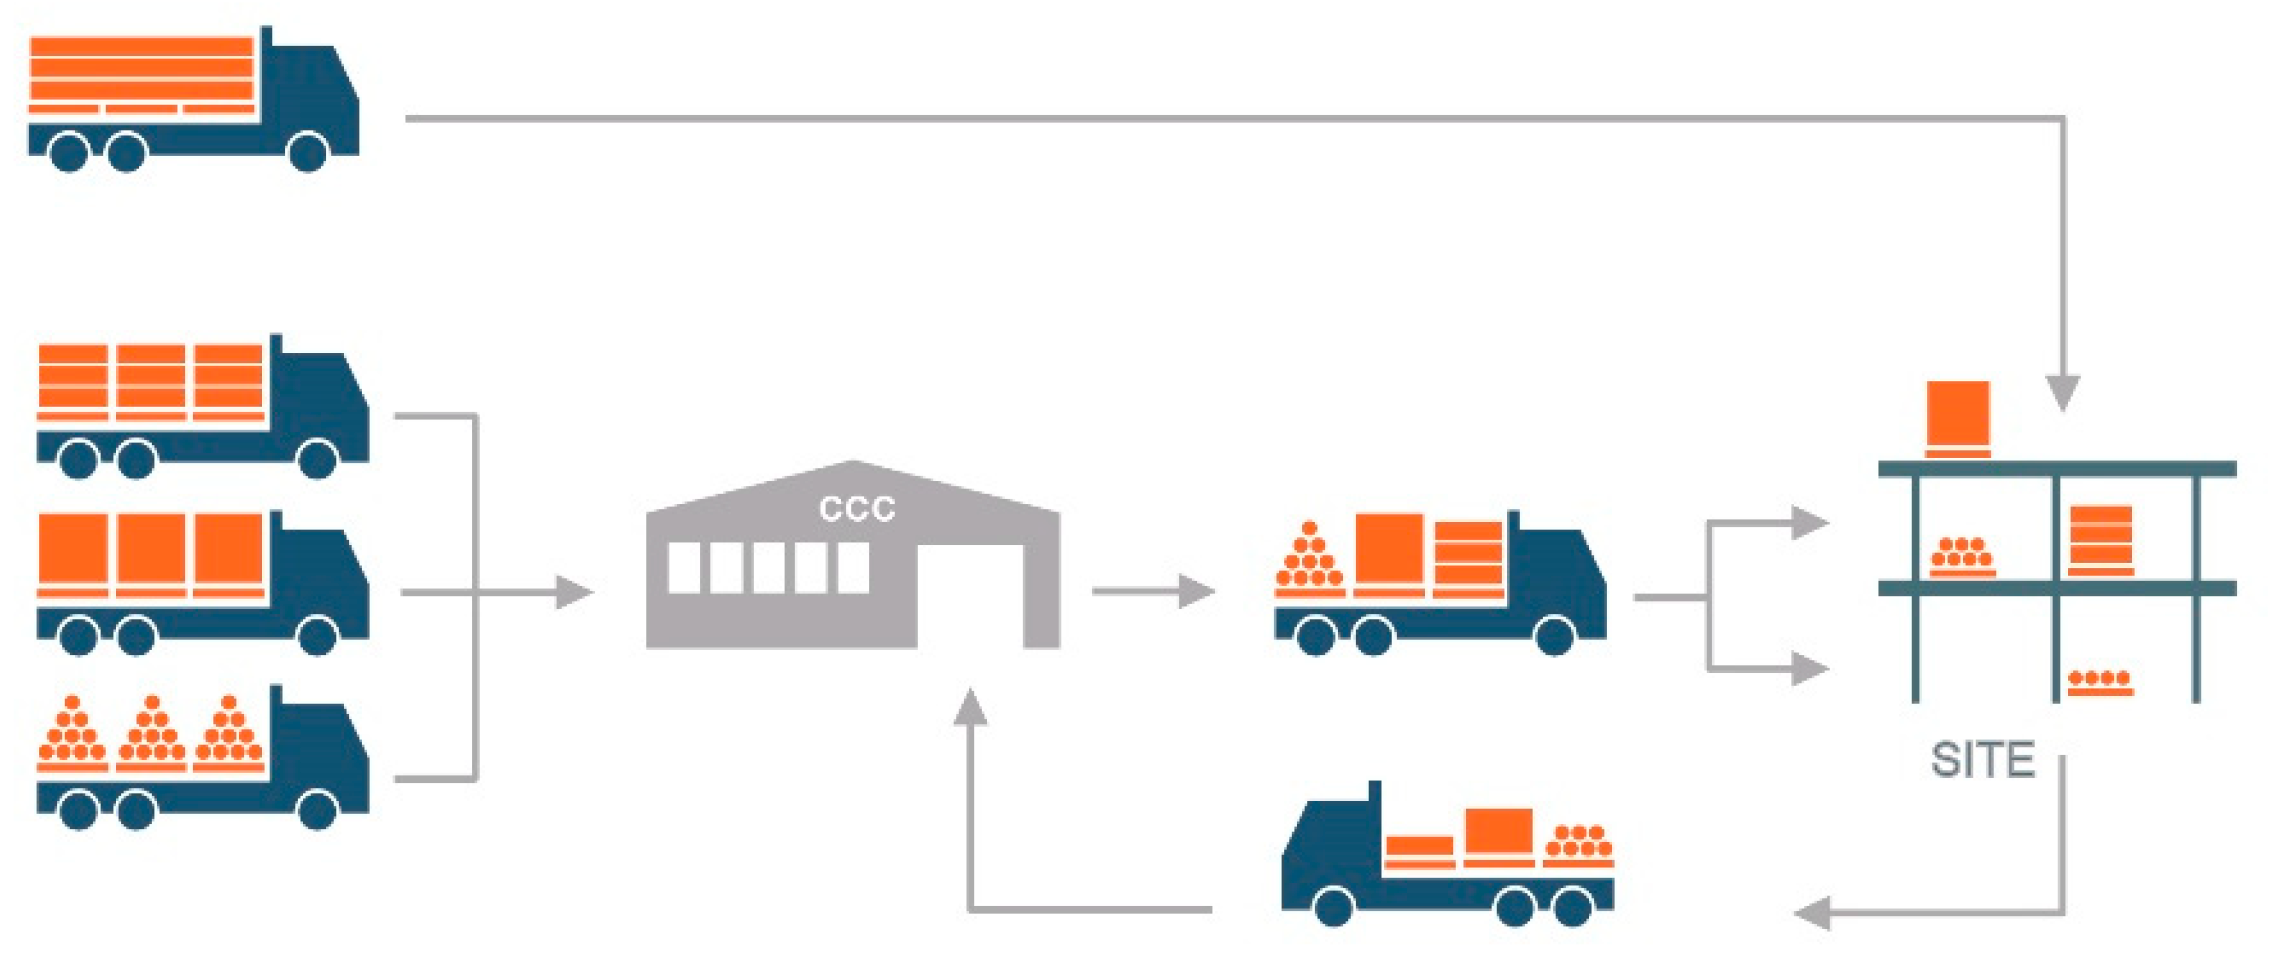
Figure 1.
Illustration of the tangible table display with six tokens in use: (a) dashboard, (b) suppliers, (c) construction sites, (d) vehicle emission standard, (e) vehicle size, (f) construction consolidation center (CCC).
Figure 1.
Illustration of the tangible table display with six tokens in use: (a) dashboard, (b) suppliers, (c) construction sites, (d) vehicle emission standard, (e) vehicle size, (f) construction consolidation center (CCC).

Figure 2.
Tangible tabletop in use in a construction company.
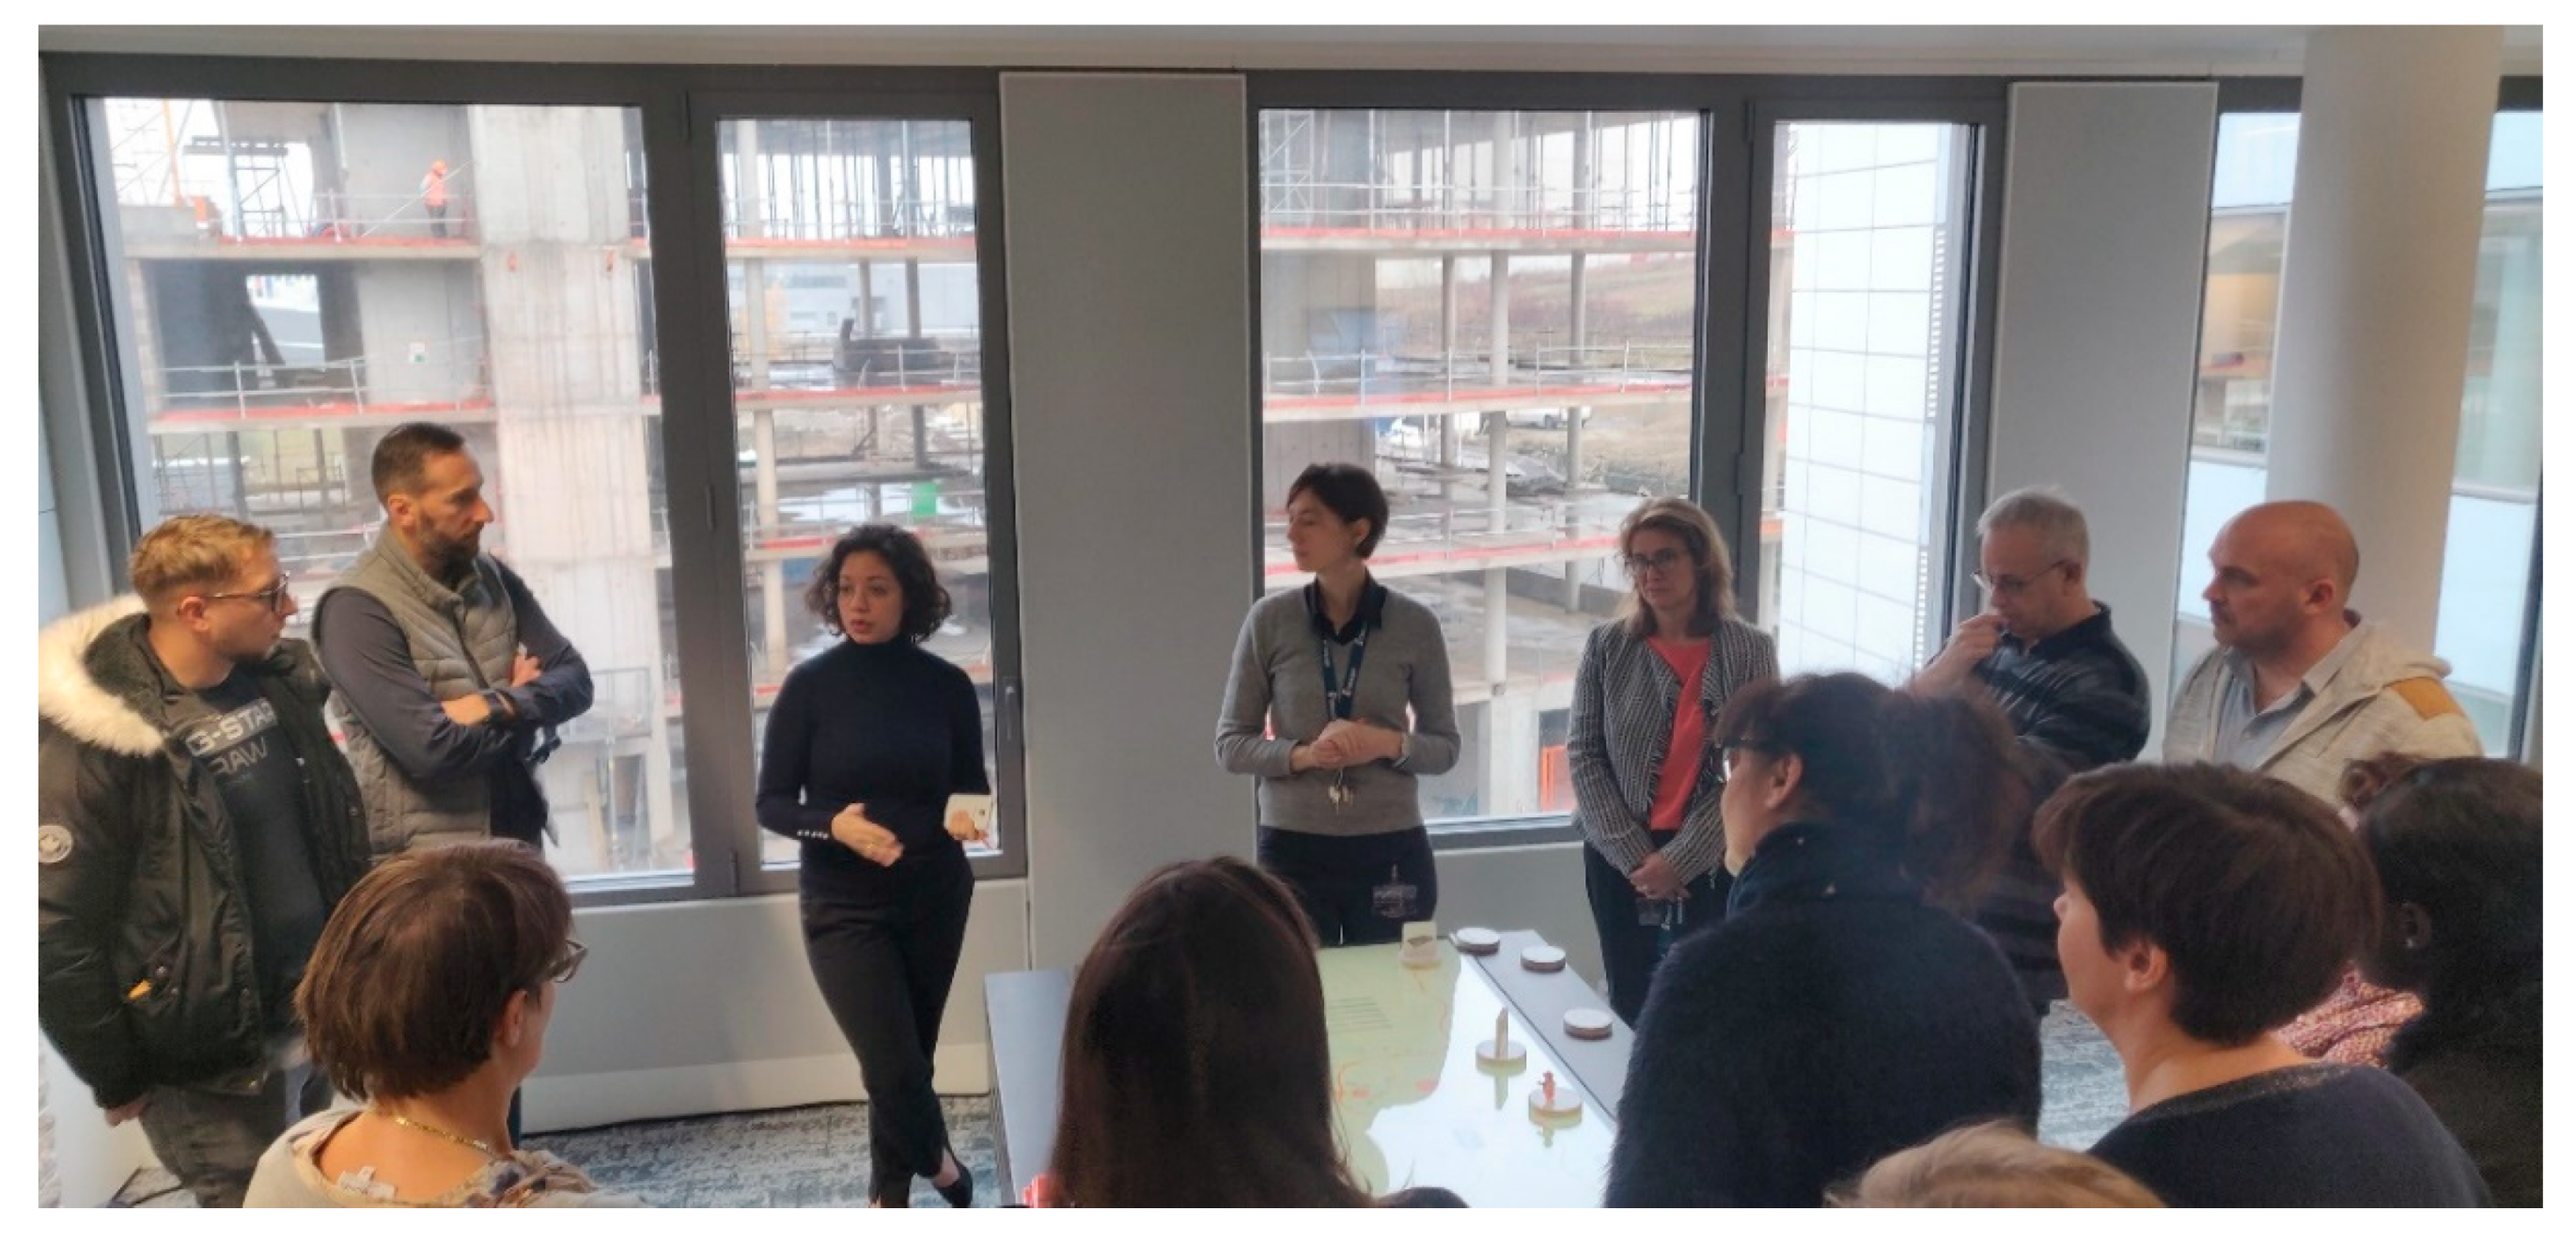
Figure 3.
Homepage of the SUCCESSFUL Toolkit.

Figure 4.
Questionnaire to evaluate the site complexity profile (extract).

Figure 5.
Example of logistics profile matrix.

Figure 6.
Example of evaluation results: (a) list of the most appropriate measures; (b) radar chart with the selected measures.
Figure 6.
Example of evaluation results: (a) list of the most appropriate measures; (b) radar chart with the selected measures.

Figure 7.
Illustration of the configuration of a scenario with (a) one construction area, (b1; b2) two potential locations for a CCC, and (c1; c2; c3) three suppliers.
Figure 7.
Illustration of the configuration of a scenario with (a) one construction area, (b1; b2) two potential locations for a CCC, and (c1; c2; c3) three suppliers.


Table 1.
Description of interactions (tokens) with the public participation geographic information system (PPGIS). CCC—construction consolidation center; PM—particulate matter.
Table 1.
Description of interactions (tokens) with the public participation geographic information system (PPGIS). CCC—construction consolidation center; PM—particulate matter.
| Token | Description |
|---|---|
| Construction sites | Display the location and size of the construction sites. |
| Suppliers | Allow the selection between 3 different options for the suppliers who deliver freight to the construction sites: their location, the number of deliveries originating from each supplier, and the total tonnage delivered by it. |
| Vehicle emission standard | Allow the selection between 3 different options for vehicle emissions standards: baseline (current situation), Euro IV, Euro VI. |
| Vehicle size | Allow the selection between 4 different options for vehicle emissions standards: baseline (current situation), light (<3.5 t), medium (rigid trucks between 7.5 t and 12 t), heavy (articulated trucks between 28 t and 34 t). |
| CCC | Allow the selection between 3 different potential locations for a CCC: baseline (no CCC), option 1 (Bettembourg), option 2 (Senningenberg), option 3 (Hamm). |
| Dashboard | Display results associated with the selected options for CCC, vehicle size, and vehicle emission standard for a set of 6 indicators: number of deliveries (total), distance traveled (total, km), CO2 emissions (total, g), PM2.5 emissions (total, g), PM10 emissions (total, g), and the disease burden expressed in DALYs (disability-adjusted life years). |
| Zoom in/out | Move the map and zoom in and out. |
| Initial view | Reset the center point of the map and the zoom level. |
| Reset scenario | Reset the vehicle size, emission standard, and CCC to the baseline’s results. |
Table 2.
Variables to evaluate the logistics profile.
| Urban Dimension | Site Dimension |
|---|---|
| Site location | Turnover |
| Neighborhood’s environmental sensitivity | Building size |
| Regulation | Storage capacity |
| Maturity level of local authorities | Time pressure |
| Exposure to air pollution and traffic noise | Subcontractors |
| Congestion | Site access |
| Topography | Delivery areas |
| Topology | Handling equipment |
| Construction activity | Certification |
| Logistics strategy | |
| Scope of the project | |
| Construction’s intended usage | |
| Change in project scope |
Table 3.
Rating scale (extract). M€—million euros.
| Variable | Slightly Complex | Moderately Complex | Very Complex | Extremely Complex |
|---|---|---|---|---|
| Site location | In the suburbs of a small city | In the center of a small city or in the suburbs of a medium city | In the suburbs of a large city or in the center of a medium city | In the center of a large city |
| Regulation | Low | Moderate | High | Very high |
| Turnover | <20 M€ | Between 20 and 50 M€ | Between 50 and 100 M€ | >100 M€ |
| Storage capacity | <0.3 | Between 0.3 and 0.7 and storage not fragmented or located on the same level | Between 0.3 and 0.7 and storage fragmented or located on different levels | >0.7 |
Table 4.
Relationship between the variables and the measures for one measure.
| Variable | Logistics Team |
|---|---|
| Turnover | ≥2 |
| Building size | ≥2 |
| Storage capacity | ≥3 |
| Time pressure | ≥2 |
| Subcontractors | 2; 4 |
| Handling equipment | ≤2 |
| Logistics strategy | ≤2 |
© 2019 by the authors. Licensee MDPI, Basel, Switzerland. This article is an open access article distributed under the terms and conditions of the Creative Commons Attribution (CC BY) license (http://creativecommons.org/licenses/by/4.0/).
Share and Cite
MDPI and ACS Style
Guerlain, C.; Renault, S.; Ferrero, F.; Faye, S. Decision Support Systems for Smarter and Sustainable Logistics of Construction Sites. Sustainability 2019, 11, 2762. https://doi.org/10.3390/su11102762
AMA Style
Guerlain C, Renault S, Ferrero F, Faye S. Decision Support Systems for Smarter and Sustainable Logistics of Construction Sites. Sustainability. 2019; 11(10):2762. https://doi.org/10.3390/su11102762
Chicago/Turabian StyleGuerlain, Cindy, Samuel Renault, Francesco Ferrero, and Sébastien Faye. 2019. "Decision Support Systems for Smarter and Sustainable Logistics of Construction Sites" Sustainability 11, no. 10: 2762. https://doi.org/10.3390/su11102762
Note that from the first issue of 2016, this journal uses article numbers instead of page numbers. See further details here.