1. Introduction
Construction of large hydroelectric dams can induce major habitat loss and degradation in the surrounding areas [
1,
2]. However, deactivated hydropower landscapes have been used worldwide as an area for tourism development, as well as natural conservation units to compensate the lost ecosystems during the construction of hydroelectric reservoirs since the late 19th century [
3]. In recent decades, numerous hydropower landscapes around the world became sites for ecosystem conservation, tourism and are defined as protected areas (PAs). Examples for such models for ecosystem conservation can be found in Brazil [
4], Canada [
5], Costa Rica [
6], and many more.
Brazil has the largest PA system in the world (approximately 220 million ha), even though there has been a reduction in the area of PAs since the late 2000s [
7]. The Federal Constitution of Brazil expresses in its article 225 the legal and constitutional duty of transmitting the environmental patrimony in the best of conditions to the future and current generations. Likewise, Law 12,651/2012—the Brazilian Forest Code, in its article 1º-A, item I, confirms Brazil’s sovereign compromise with the preservation of its forests and other forms of native vegetation, as well as biodiversity, soil, water resources, and integrity of the climatic system. Based on this fact, it is only with preservation practices and environmental control that we will reach a balance, aiming at the reduction of the direct or indirect degradations caused by anthropogenic activities.
The efficient environmental management of a territory largely depends on previous surveys and systematic studies on the main elements and physical conditions. The inappropriate occupation of space and improper use of natural resources can lead to pressure on environmental systems. Among so many laws that guide and foster the environment, we can highlight Law 9985/2000 which institutes the National System of Nature Conservation Units (SNUC). This law establishes the criteria and norms for the creation, implementation, and management of conservation units. From this, we infer that the conservation units (CUs) and their buffer zone are an essential instrument for the protection of biodiversity, natural processes, and environments involved.
Remote sensing, spaceborne data in particular, has been widely used for the dynamic monitoring of land use changes, biodiversity evolution, management of water resources, and the changes on the earth surface in general [
8]. Various algorithms for processing remotely sensed data remove the barriers of the human visual system, facilitating effective interpretation of information contained in satellite imagery [
9]. In this study, we used satellite data for detecting the land cover changes occurred in a state park located in southern Brazil and its surrounding areas within a 10 km buffer for the period between 1990 and 2016. This study period will allow us to compare the land cover changes occurred before and after the establishment of the park for natural preservation beside a hydroelectric dam in the region. The study area provides an excellent opportunity to understand how the ecosystem loss associated with dam construction can be compensated after the functioning or deactivation of the power plant. We mapped the regeneration of the natural species inside the park and how the establishment of the conservation area reduced the contamination of exotic species into the park while the surrounding areas of the park were cultivated with
Pinus sp. for industrial raw materials.
2. Characterization of the Study Area
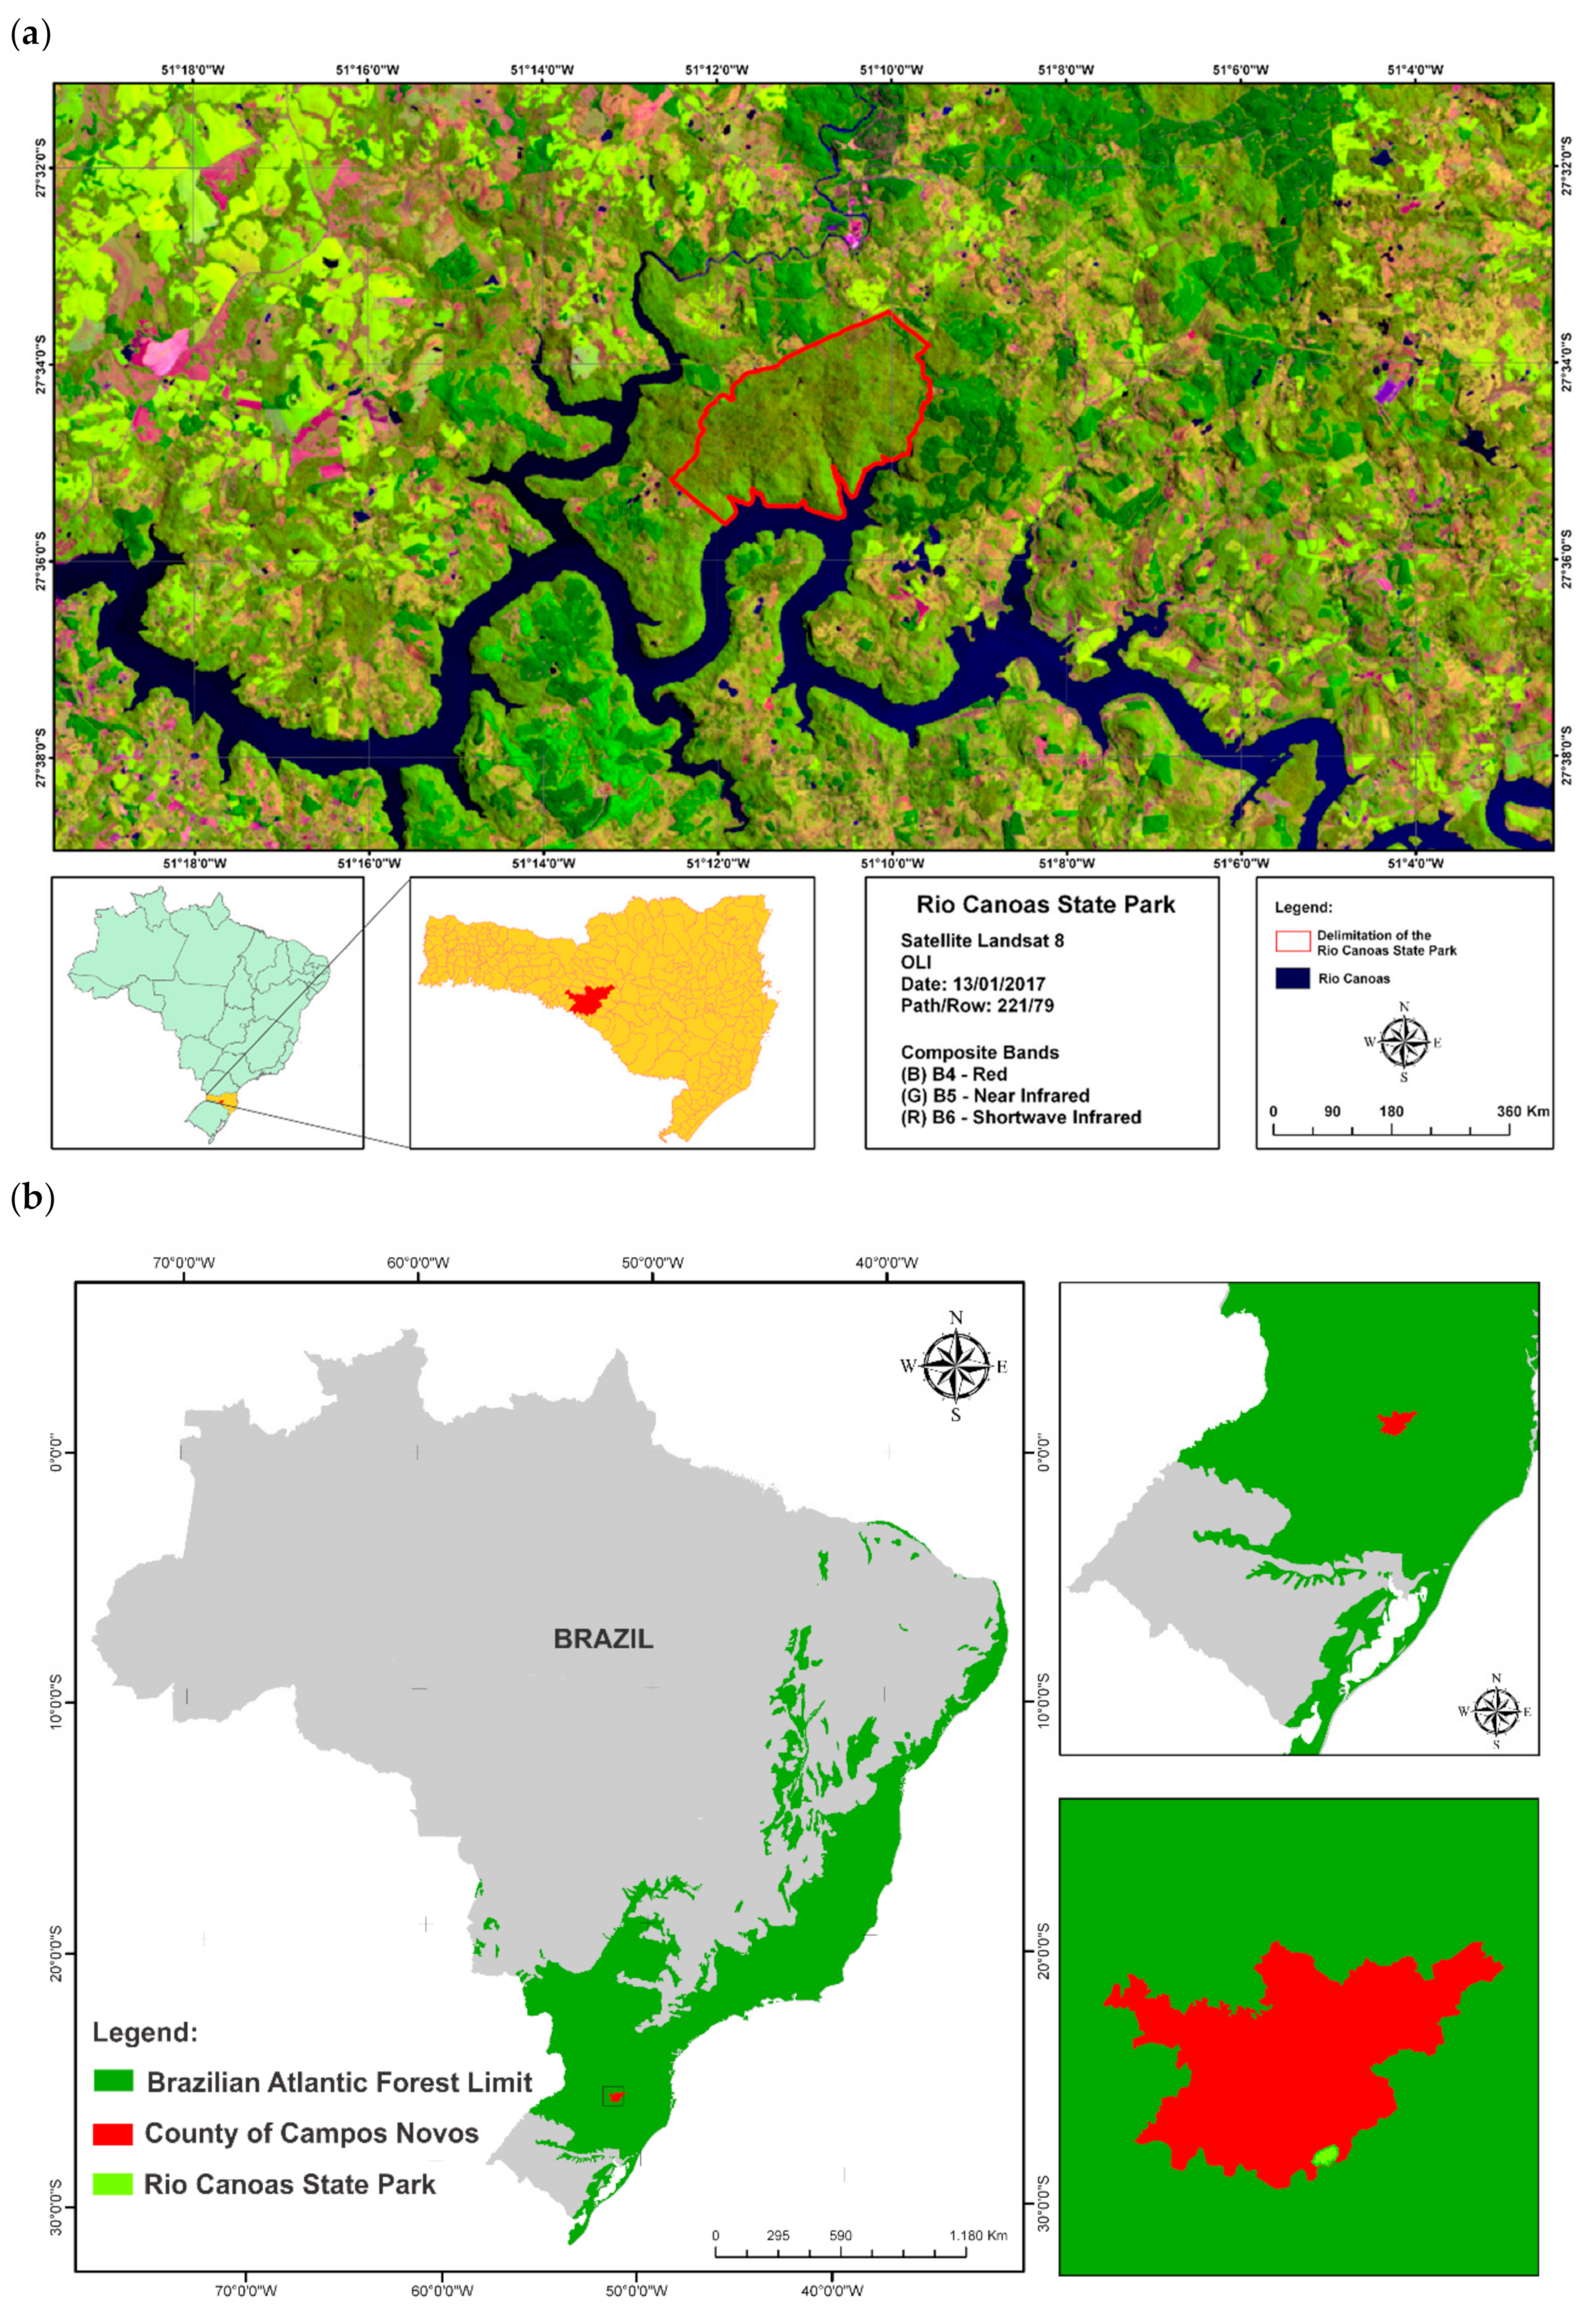
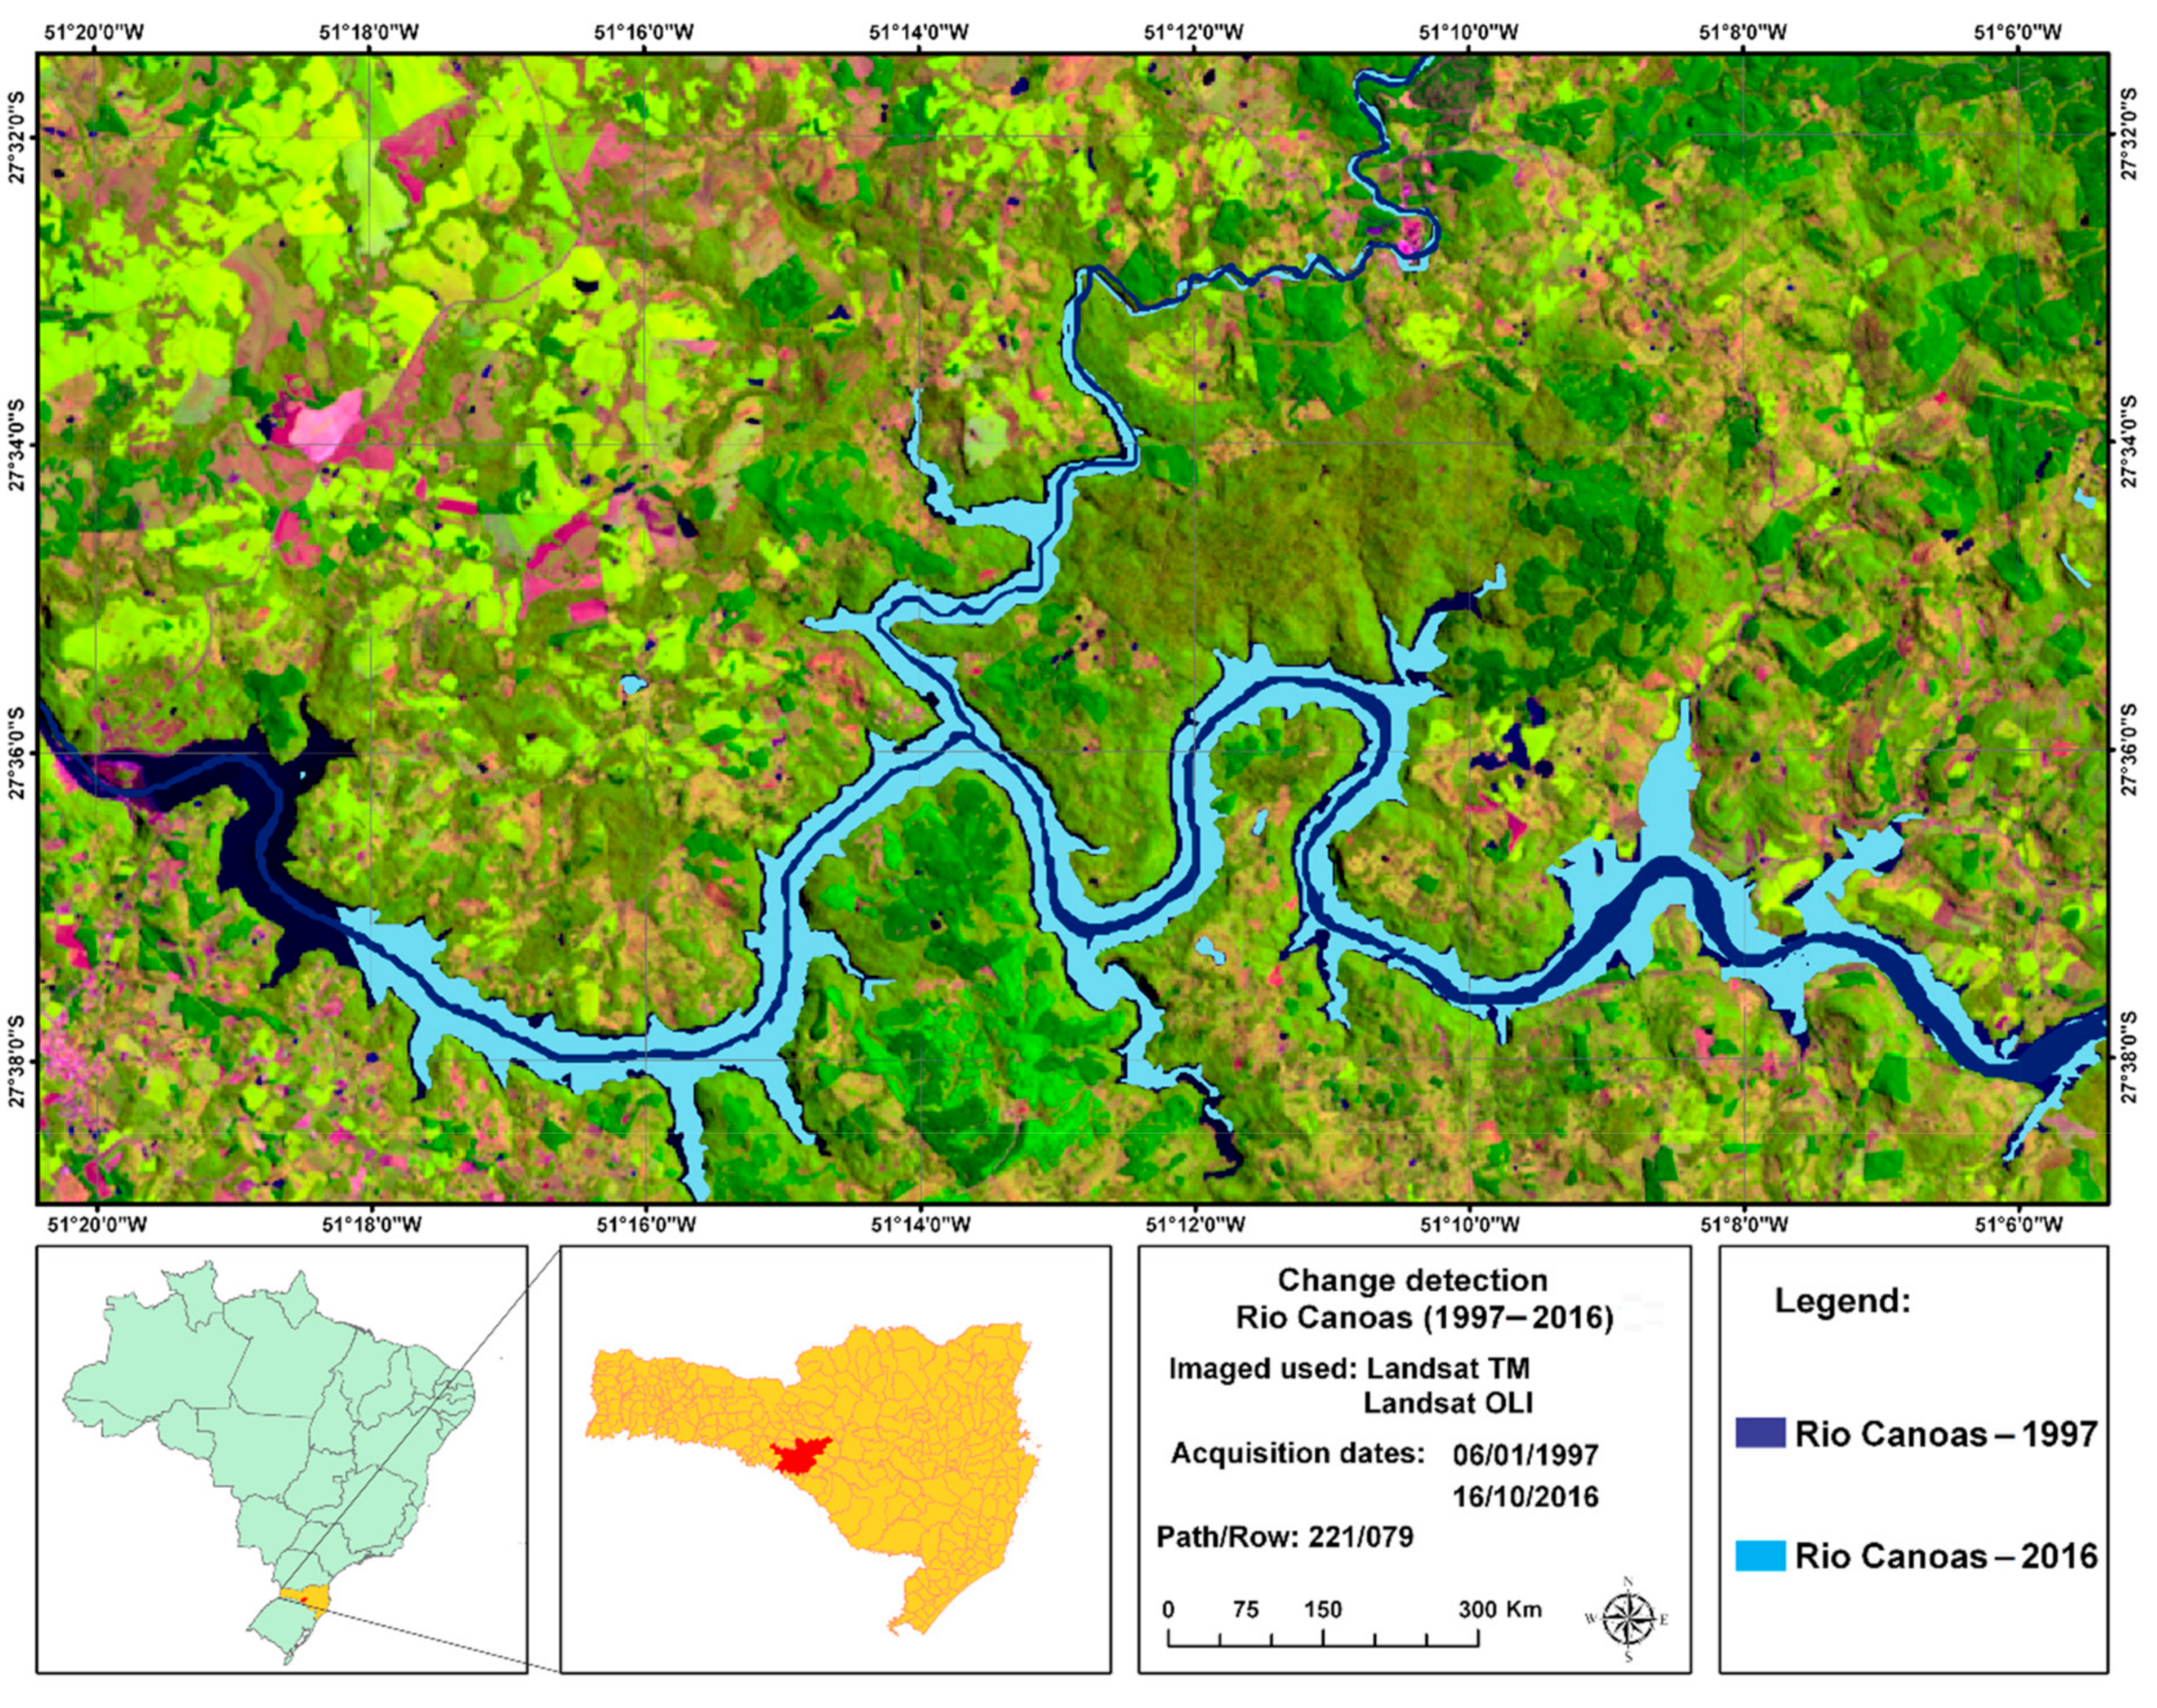
The study site is the Rio Canoas State Park and its surrounding areas, located in the municipality of Campos Novos, in the state Brazilian of Santa Catarina (
Figure 1). The Rio Canoas State Park (RCSP) has an area of 1133 hectares and is situated within the Brazilian Atlantic Forest Limit. Its surrounding area, within a buffer zone of 10 km around the park, was also analyzed and encompasses a small portion of the municipalities of Abdon Batista, Anita Garibaldi, and Celso Ramos. The area of the RCSP was acquired by the company Campos Novos Energia S.A–ENERCAN and donated to the state of Santa Catarina to serve as compensation for the environmental loss during the construction of the Campos Novos Hydroelectric Power Plant and the dam.
The study area is characterized by flood basalt, presenting effusive acid rocks on the superior portion and a range of igneous and metamorphic rocks, and the sediments were recently found on the coast [
10]. The RCSP is located at the Araucaria Plateau, in the center-west portion of the state. The geomorphology of the study area is, in general, situated on the Geomorphological Unit Rio Iguaçu/Rio Uruguai, characterized by the intense dissection of the plateau along with the main drainage, the Rio Canoas, with large slopes between valleys.
According to the data obtained from the City Hall of Campos Novos, the municipality is known as the breadbasket of Santa Catarina state, with an economy based on the agriculture and is also considered the largest producer of cereals in the state, with the prominent production of corn, soybean, wheat, and beans. The region also focuses on industries, such as cellulose and paper, metallurgy, furniture, and hydropower, which supplies 25% of the state´s consumption. It is worth noting that the raw materials (wood) for the paper and cellulose industries are provided by the pine forests in the surrounding areas of the park. The economy of nearby municipalities (Abdon Batista, Anita Garibaldi, and Celso Ramos) is also based on agriculture, especially corn, bean, soybean, and tobacco crops, and livestock. In Censo Ramos, the cultivation of sugarcane prevails.
According to the phytogeographic data provided by FATMA [
11], the original vegetation of this region was represented, primarily, by a Mixed Ombrophilous Forest characterized by the expressive density and physiognomic uniformity of
Araucaria angustifolia (Brazilian pine), with a sub-grove formed by an expressive number of three species belonging to the Lauraceae family.
3. Datasets
To perform this research, we used satellite imagery, rainfall data and complementary information on the economic and physical characterization of the study area as described below.
3.1. Satellite Data
The list of satellite data is constituted of:
Three Landsat 8 OLI (Operational Land Imager) images with a 30 m spatial resolution (bands 4, 5, and 6) and band 8 (panchromatic) with spatial resolution of 15 m. Images where acquired on 16 April 2016, 23 September 2016, 9 October 2016 and are available at no cost from the United States Geological Survey (
http://www.earthexplorer.usgs.gov).
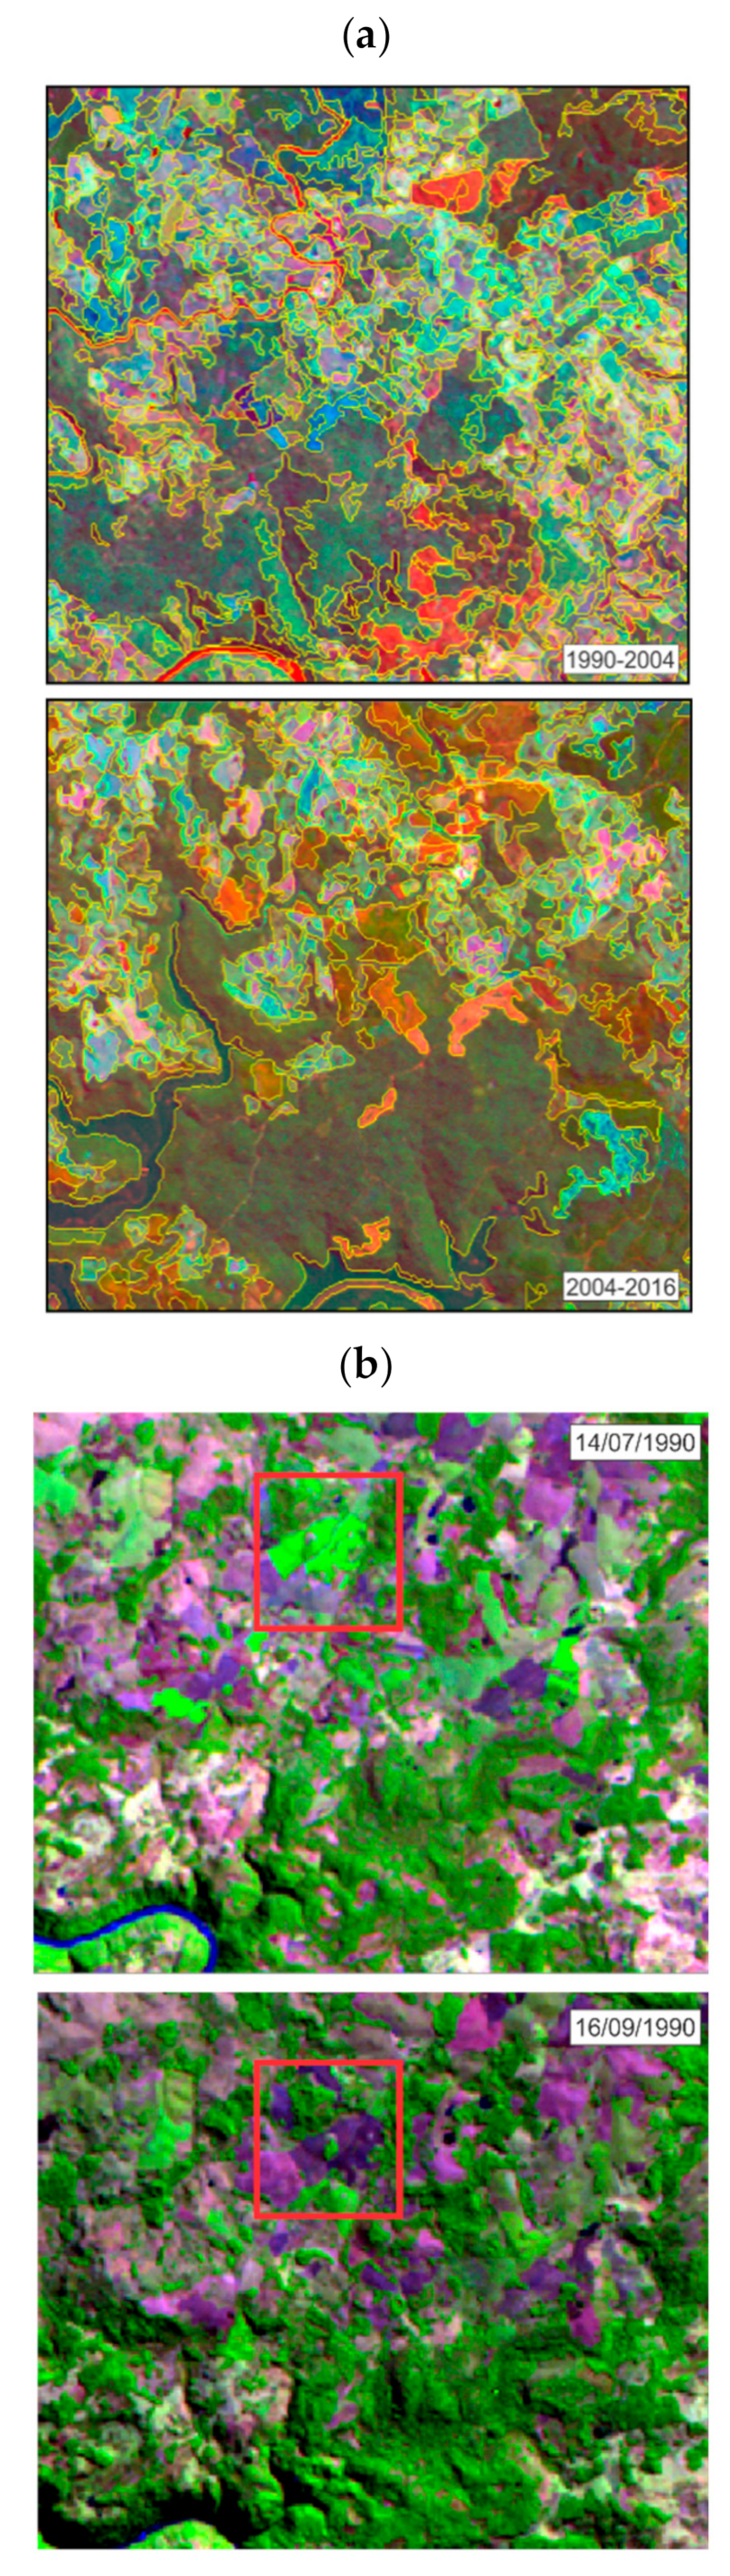
Four Landsat 5 TM images with 30 m resolution (bands 3, 4, and 5) and were acquired on 14 July 1990, 16 September 1990, 6 January 1997, 30 March 2004 and 8 October 2004, respectively.
Global Land Survey (GLS) image of Landsat 5 TM for georeferencing the orbital images of the study area (Source:
http://www.dgi.inpe.br/CDSR/).
WorldView-2 satellite images acquired in 2010, which has a spatial resolution of 0.5 m, provided by FATMA (Fundação do Meio Ambiente do Estado de Santa Catarina) and ENERCAN.
3.2. Rainfall Data
The rainfall data near the Campos Novos Hydroelectric Power Plant were acquired from the Hydrological Information System—Hidroweb of the Waters National Agency (
http://www.snirh.gov.br/hidroweb/). We used the average of rainfall from 1961 to 1990, historical series of 30 years with monthly information according to the National Meteorology Institute (
Instituto Nacional de Meteorologia—INMET). Furthermore, we used the total monthly rainfall data obtained from the INMET for the years 1990, 2004 and 2016.
3.3. Complementary Data
In addition to the information mentioned above, we used hydrographic networks of the study area, highway networks, environmental conservation plan in and surrounding area of the dam, the Rio Canoas State Park management plan and information on the agricultural calendar of the main crops cultivated in the state of Santa Catarina, which is provided by the Socioeconomy and Agricultural Planning Center of the State of Santa Catarina (Empresa de Pesquisa Agropecuária e Extensão Rural de Santa Catarina–EPAGRI).
3.4. Image Processing System
We used SPRING (Sistema de Processamento de Informações Georreferenciadas), an open software package, for processing the images and structuring the databank. We also used ArcGis 10.2 for generating thematic maps and the Microsoft Office Excel 2007 for organizing the graphs and tables, and GarminTM GPS (Global Positioning System) to collect the field data.
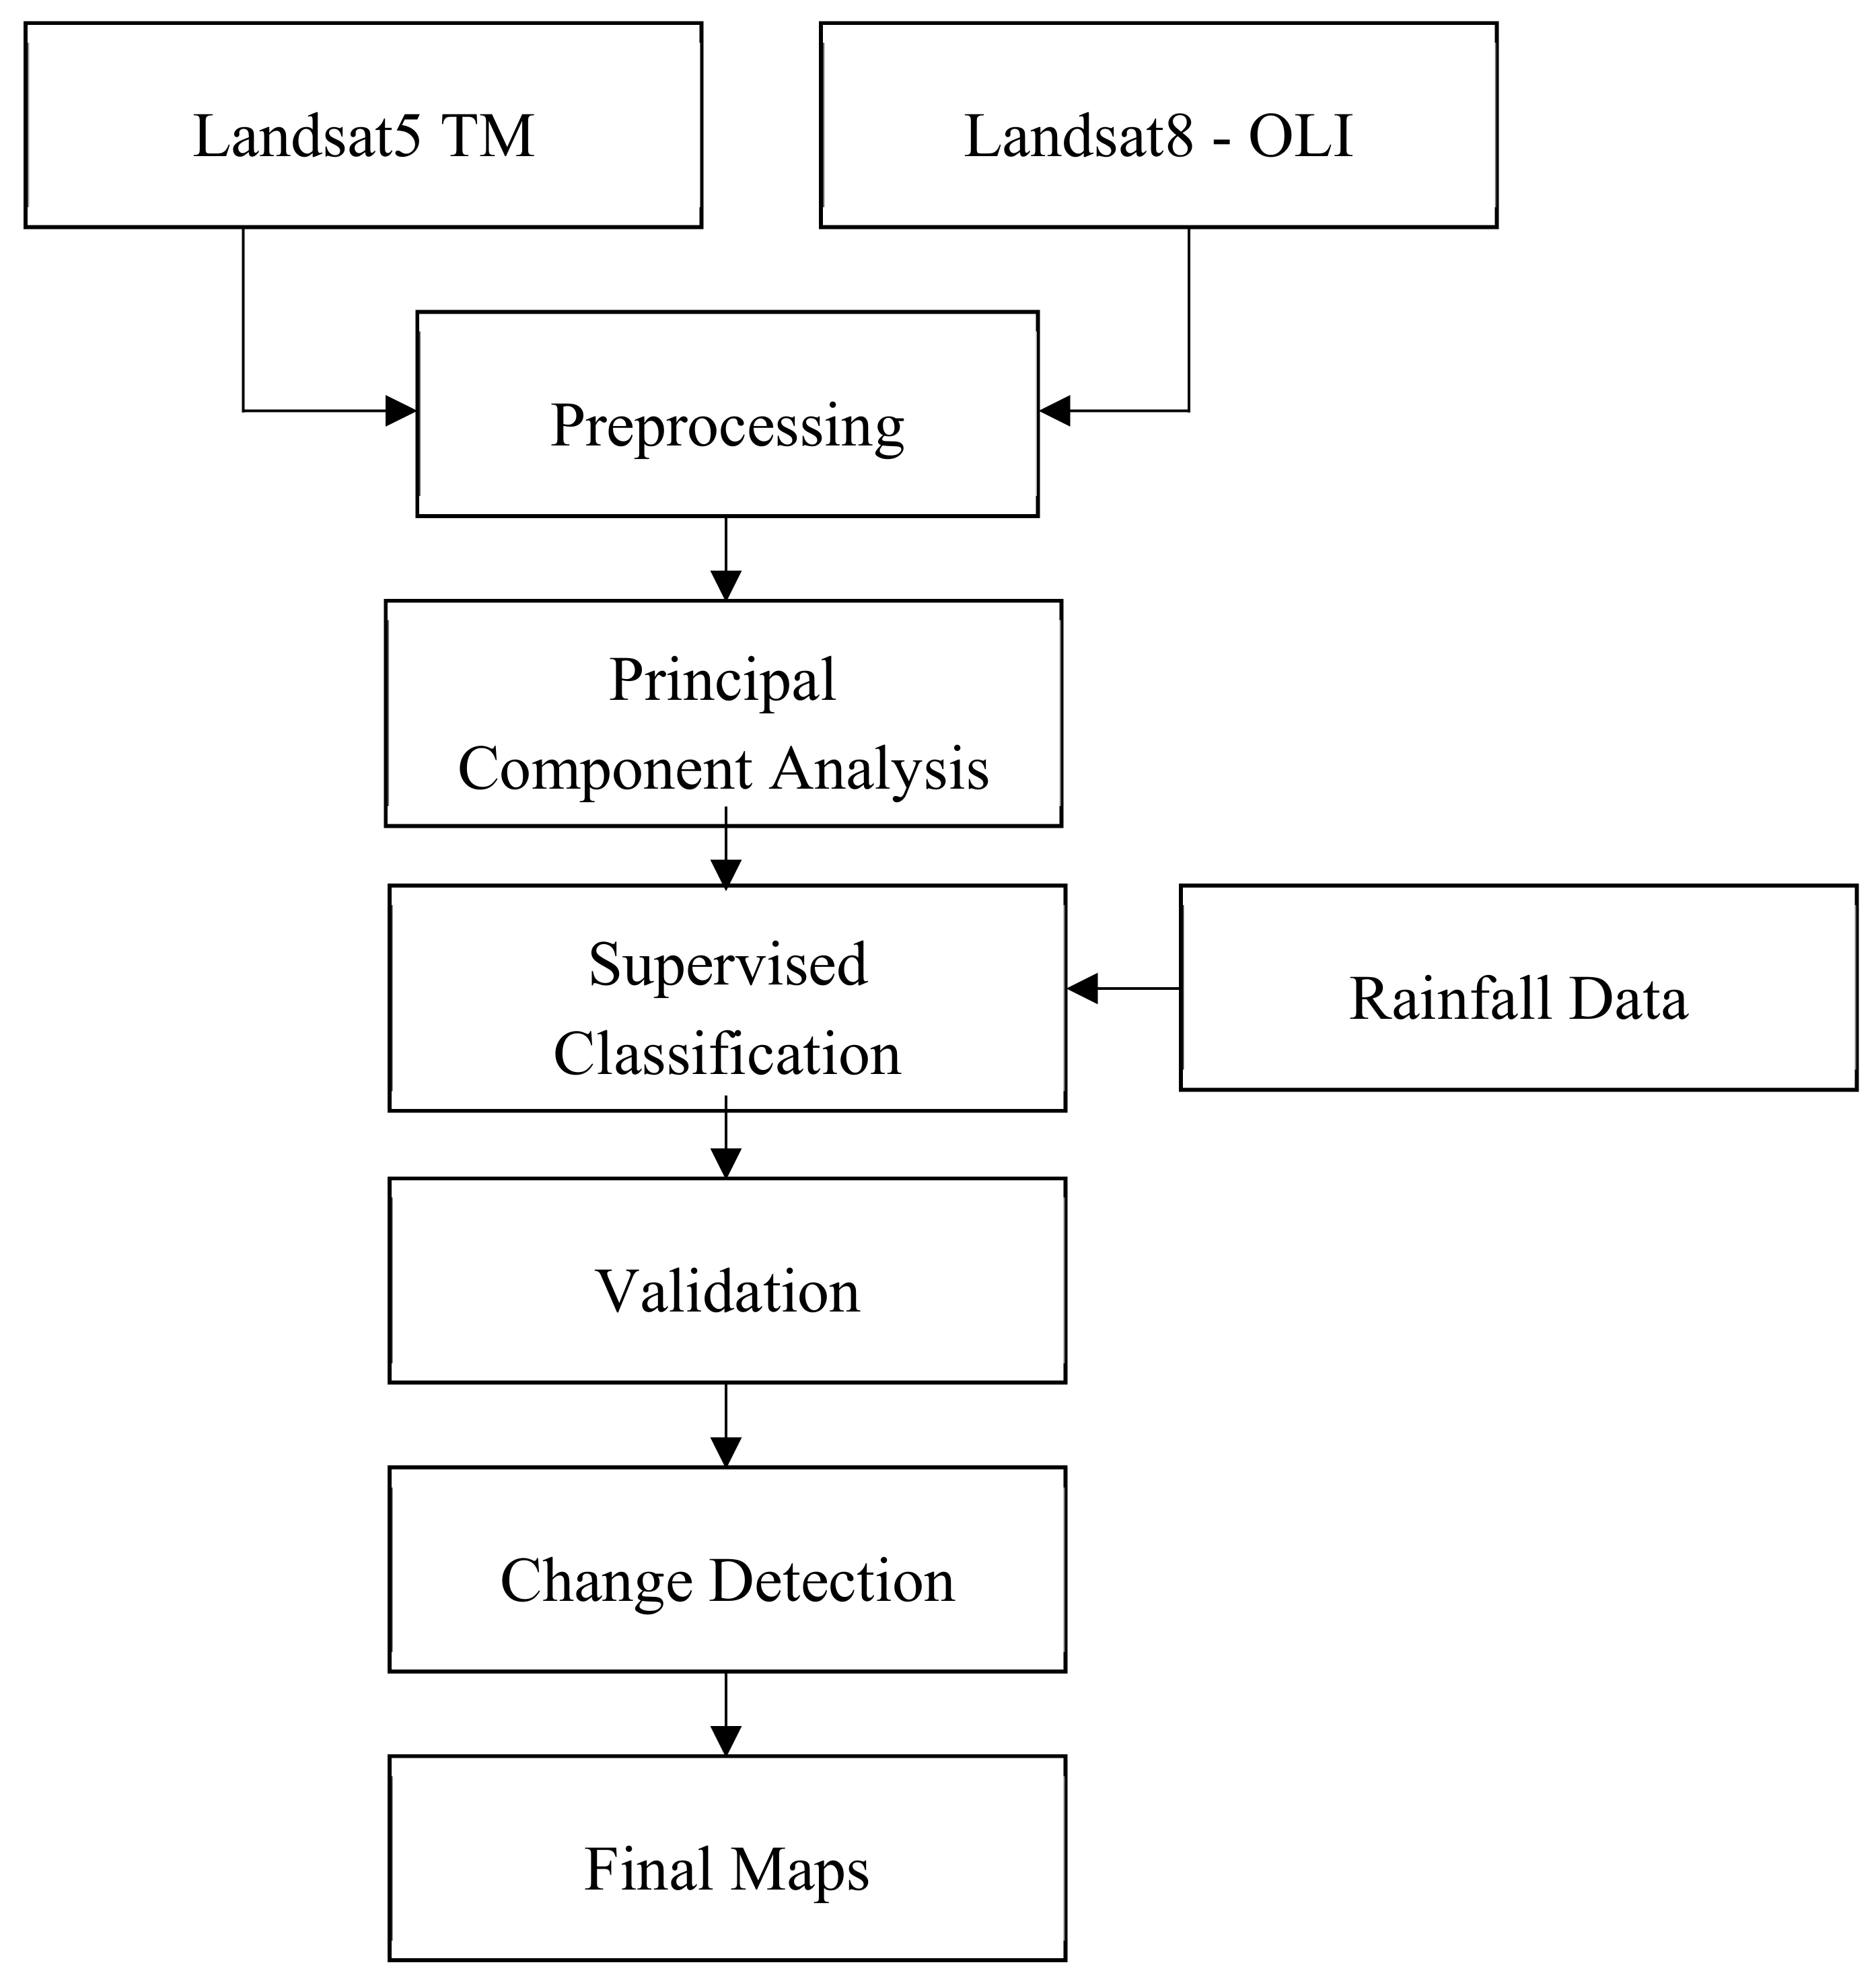
4. Methodology
The methodology adopted to develop this research encompasses various steps as described in the flowchart shown in
Figure 2.
4.1. Image Co-Registration
Image co-registration has been conducted for Landsat
TM and
OLI data for eliminating the errors that may occur in the satellite data, due to image rotation, skew and scale. In this case, we proceeded to correct the images, since the study constituted of multitemporal dynamics, in which the images were compared and required to be perfectly coincident in space. Image co-registration is the adjustment of the coordinate system (pixel/lines) of one image to be equivalent to the other image of the same region [
9,
12]. In this work, we applied pixel resampling method using the nearest neighbor interpolation obtaining the GLS image from the National Institute of Space Research (INPE—
Instituto Nacional de Pesquisas Espaciais) for choosing the control points. The image co-registration was conducted using SPRING software, in which the first phase was characterized by modifying the extension of the Landsat scenes (path/row: 221/79) for all the years studied with an average of 15 control points, accepting an error of less than one pixel, with a maximum value of 0.55.
4.2. Principal Component Analysis
After the co-registration of images, Principal Component Analysis (PCA) has been conducted with the objective of detecting the land use/land cover (LULC) changes that occurred within the 10 km buffer area surrounding the RCSP. This analysis will allow us to conclude, first, concerning the impact of the construction of the power plant and, second, whether the environmental compensation regarding the Park area was indeed incentivized and implemented properly. Another fact worth mentioning is the inclusion of the buffer zone to analyze is there were any changes in the area surrounding the park for this study to provide subsidy and aid in the future proposal of outlining the buffer zone, given that, until now, it is not present in the management plan or posterior projects. The study of the multitemporal dynamics in 1990, 2004, and 2016 were aided by the Principal Component Analysis to compare the changes before and after the formation of the Campos Novos Hydroelectric Power Plant.
The PCA is a digital image processing technique that uses statistical parameters is considered as efficient in detecting changes in the landscape. In general, the calculation of the principal components of a set of data is conducted by obtaining the eigenvalues and eigenvectors using the correlation matrix or the variance-covariance matrix between the variables of the set [
13]. PCA reduces the dimensionality of satellite data that leads to improved data visualization and manageability of data analysis [
14,
15] and is recognized as one of the best methods for mapping and monitoring interannual and interdecadal vegetation anomalies [
16]. The application of PCA, however, depends on the objective of the researcher who can analyze each component according to the work schedule. According to Duarte et al. [
17], to identify LULC changes, comparing the differences in the information contained in two or more satellite images is necessary. This identification (of LULC changes) is possible by the application of PCA, which also has the function of determining the extension of the correlation of the image bands and removes them, reducing the dimension of the data and excluding the redundant information that is of no interest (to the user).
Vegetation mapping using automatic methods, such as band rations or vegetation indices are relatively straight forward. However, these methods are not always suitable for differentiating exactly where the changes occurred, but good for what types of changes occurred (native and reforested areas in this case) and PCA has the advantage of mitigating this limitation to some extent by reducing the data dimensionality [
14]. Furthermore, the actual nature of changes occurred has been identified by a field visit in this study. It has been observed in a previous study that the overall accuracy and kappa coefficient in vegetation mapping increase when PCA has used along with the main bands of satellite data [
18].
The first Principal Component is comprised of the information that is common to all original bands (PC1), the second (PC2) contains the most significant spectral feature of the set. The higher the order of the PCs are, the less significant the spectral features will be. The last principal component has only the information that remained from the set or the noise. We analyzed the correlations of the bands related to the red wavelength (TM3) of the Landsat 5 (1990 and 2004) along with near-infrared (TM4) of the year 2004, generating a new set of images denominated principal components, in a total of three PCs. The use of only three bands is justified by presenting the number of iterations and scenes distinct from when processed by the PCA, resulting in the information of change detection during the period, as confirmed by Lopes [
19]. Furthermore, it has been affirmed that the inclusion of the first three PCs corresponds to more than 99.5% of the total variance of satellite data [
20].
The same procedure was conducted with the same band combination for comparing the period between 2004 and 2016 after the construction of the RCSP in 2004. The false-color composite image used is comprised of the 2nd (G) and 3rd (R) principal component and the band related to the shortwave infrared (B5) of the original image referent to the most recent year. After applying the PCA, we proceeded to the supervised classification per region based on the Bhattacharyya distance (B). The Bhattacharyya distance can be used as a class separability measure for feature selection [
21]. For two normally distributed classes, the Bhattacharyya distance (b) between two classes is defined as:
where,
μi and Σi are the mean vector and covariance matrix of class i, respectively. This algorithm is inbuilt in the SPRING software for image processing.
4.3. Supervised Classification
To proceed with the supervised classification, it is necessary that the user has previous knowledge of the study area. This classification requires the field observation of specific locations shown in the image, from which one can obtain ground-truth data [
9,
22]. The supervised classification is based on the statistical functions that analyze and compare the characteristics of the spectral reflectance of the pixels associated with a standard class defined by the user. Generally, we calculate the average values, and standard deviations of the defined classes and these values serve as criteria to group the pixels that fulfill the limits close to a specific class [
8]. According to Novo [
23], the classification process can be distinguished regarding the unit to be grouped. In this work, we used the region-growth algorithm from which we extract homogeneous regions according to the limits tested and established and from the group of contiguous pixels grouped.
The limit of similarity and area used were equal for all images (30). Despite the images being different and from different years, these limits were the most adequate for the identification of LULC. It is worth mentioning that the similarity limit demonstrates the smallest difference accepted between the average value of two pixels (or a set of pixels) and is considered the maximum distance between the spectral centers of two regions. The area limit represents the minimum size of the segment the user wishes to analyze.
In the supervised classification stage, we identified the areas with changes and no changes occurred comparing data acquired between 1990 and 2004, 2004 and 2016, and from 1997 to 2016. Using the false-color composite images from principal components, we observed the areas in which change occurred and those that remained with the same characteristics over the years using the multitemporal Landsat data. We determined the existence of cultivation and reforestation areas with the economic survey and fieldwork studies. However, when analyzing the images, we verified the presence of exposed soil in some regions, with well-formed texture and form. Based on the experience of the user knowledge of the area, allied to the analysis of images from different dates, we perceived that most regions were undergoing an exchange in monocrops or a shallow cutting of exotic species for replanting.
Furthermore, when analyzed the areas in which change occurred or not, we observed an intense increase of the bed of Rio Canoas, due to the creation of the Campos Novos Hydroelectric Power Plant managed by ENERCAN. The power plant is in operation since 2006 and provided approximately ¼ of the total energy consumption for the state of Santa Catarina. Therefore, we conducted a supervised classification of the areas in which change occurred on the riverbed before and after the creation of the power plant using a historical raifall data series encompassing 30 years in the Campos Novos station and the monthly total rainfall data for 2016 and 2004 to remove the influence of rainfall on the increase of the riverbed and analyze these differences.
4.4. Fieldwork
The fieldwork was conducted in two stages: From 26 November 2015 to 30 November 2015 and from 3 February 2017 to 4 February 2017 within the RCSP and its surrounding area aiming at a future elaboration of a proposal for buffer zones. The sampling points were selected using the Random Points tool of ArcGis® 10.2 and posteriorly guided according to the need for validating the multitemporal dynamics to identify the land cover at the locations presenting or not changes, as demonstrated on the map elaborated using the PCA. A total of 107 points were analyzed. The tools used in this work are Garmin® Etrex30 GPS, a digital camera (Sony Cyber Shot DSC H300), a clipboard for notes, and maps elaborated for the study area. To identify the areas with the need for change detection in the RCSP, we elaborated a spreadsheet with the features acquired from Landsat OLI images and compared the information with the photographs acquired at the location.
5. Results and Discussion
5.1. Principal Component Analysis
The Principal Component Analysis reduced the redundancy of the information between the spectral bands, which presented very similar behavior. The number of principal components is equal to the number of bands in which each component is associated with a variance of the digital levels, with the first component presenting the highest variance, successively decreasing the values [
17,
24]. Thus, the application of this technique, manipulated with multiple band association tests, can demonstrate the areas of use dynamic and land cover from 1990 to 2004 and 2004 to 2016.
Similar to the observations made by Ding et al. [
20], the first three PCs of each year corresponds to more than 99.5% of the total covariance. For example, for the Landsat TM image in 2004, PC1 presented 68.6% of the total covariance of the set and PC2 and PC3 presented 20.5% and 10.7%, respectively (total 99.9%). Based on this information, we perceived that the second and third components are not correlated. This analysis associated with RGB combination tests between the bands allowed the identification of the changes that occurred in 1990 and 2004.
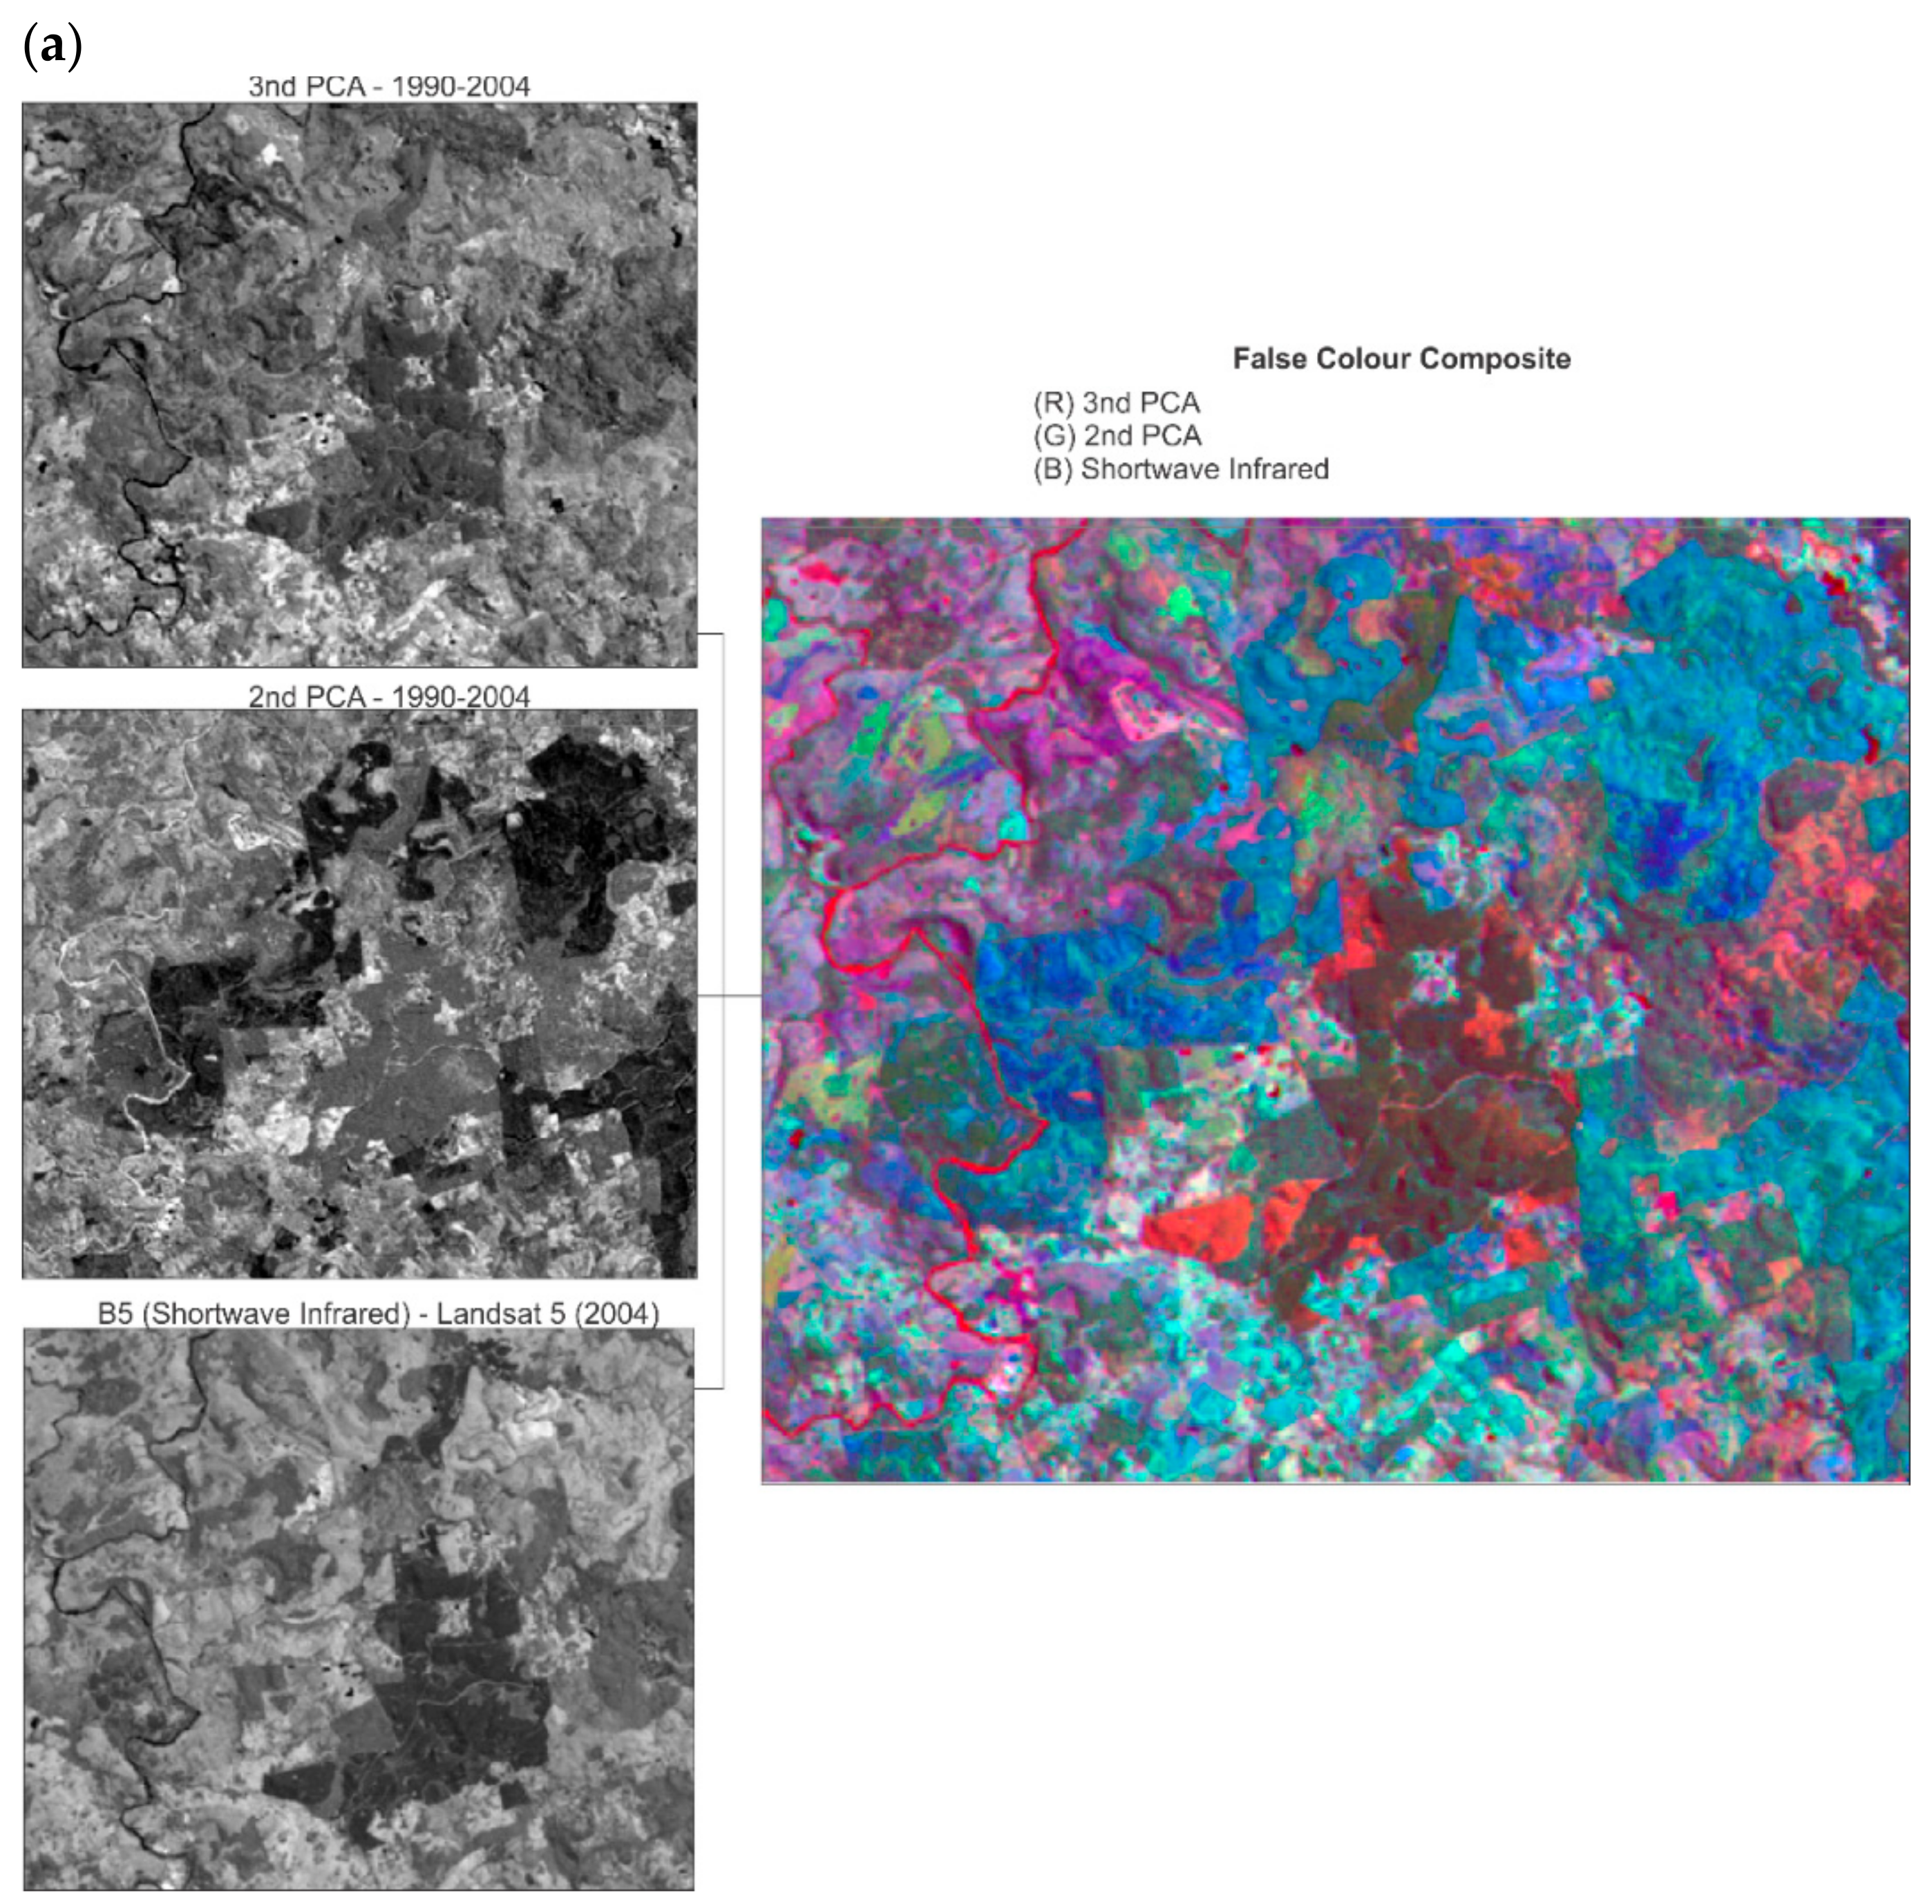
After the parameter analysis, we proceeded to study the combination of the principal components and the bands on the RGB composition. The composition that demonstrated the areas in which changes occurred or not was the second component regarding the green channel (G), the third component regarding the red channel (R), and band 5 (intermediate infrared–L5–2004) regarding the blue channel (B), as demonstrated in
Figure 3a. This composition of bands best met the objectives after numerous tests for detecting changes in the reforestation areas from 1990 to 2004 and from 2004 to 2016.
From
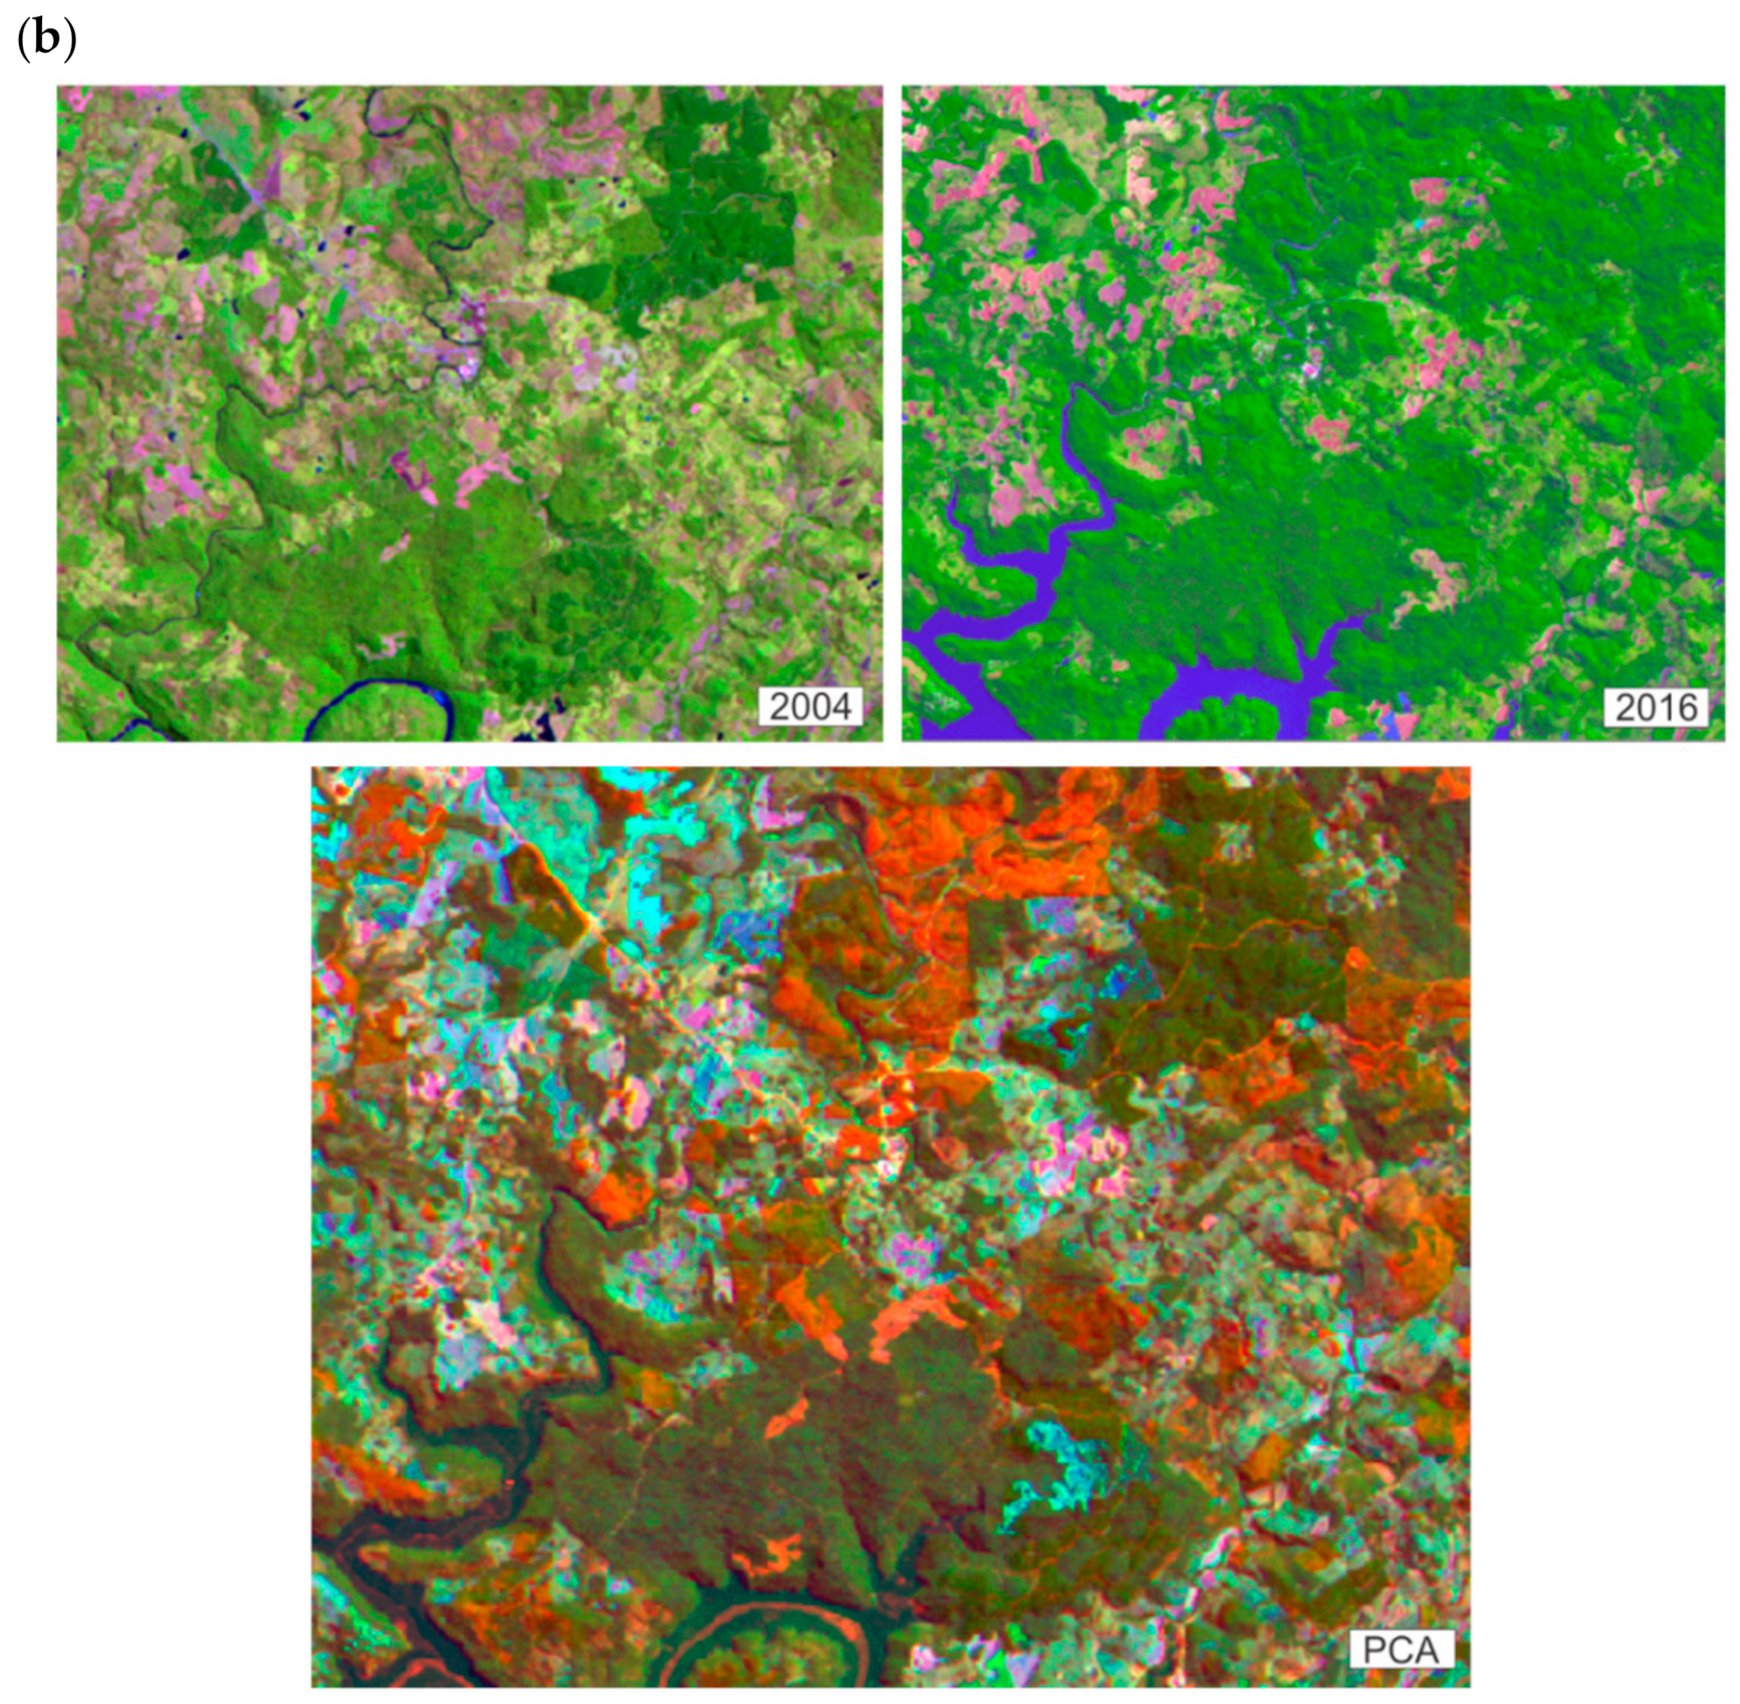
Figure 3a, we can analyze that, the areas in dark green as LULC that had already existed in 1990 and continued in 2004. The areas colored in light and dark orange demonstrated the changes that occurred in the last 14 years. The areas in dark blue are the regions that existed in 1990 and showed changes in 2004. This combination indicated very effectively the respective changes/no-changes, as shown in
Figure 3b, which established the comparison between the images acquired in 2004 and 2016.
It is worth mentioning that the result of the PCA highlighted the information measured and the changes that occurred between years (of image acquisition). However, if in an image of a specific date the soil was exposed, and, in another, the areas were cultivated, the color composition image will consequently present an area of land use and cover change. At this moment, the analyst must add the ground-truth data from the study area obtained during the fieldwork, images from other dates, which corroborated with the identification of areas with temporary crops and reforestation areas distinct from those used for the classification.
5.2. Supervised Classification
The supervised classification technique was used to elaborate on the LULC change detection map of the RCSP and its surrounding area. In this work, we applied the supervised classification based on the Bhattacharyya distance measurement. This classification divided the homogeneous regions of the images according to the area and similarity limits indicated. As
Figure 4a shows, we used an area and similarity limit equal to 30 for both images originated from PCA.
The training samples were indicated after a previous study of the area and its LULC using the high-resolution image (WorldView-2) provided by ENERCAN, images from different dates to obtain a better measure, linear contrast and segmentation techniques, and fieldwork. Moreover, to aid in the classification of the areas that presented changes, but that, for their texture and well-defined form, were similar to temporary crops, we abandoned the use of the agricultural calendar from the Socioeconomic and Agricultural Planning Center (CEPA) from EPAGRI.
The data from the agricultural calendar are presented by micro-regions, encompassing the municipalities in the areas surrounding the Rio Canoas State Park. The study area presented higher representativeness of corn, soybean, tobacco, bean, and wheat crops. According to CEPA, in 2016, 75% of the corn crops and 95% of tobacco were planted in October, while the 85% of the soybean was planted between November and December, and 60% of the bean crop, in December. The winter crops, such as wheat, were planted in June, July, and August. This information associated with the orbital images from different dates was essential concerning the supervised classification because, depending on the date of the image, the cultivation areas could present exposed soil, indicating the times of production rest, areas improper for cultivation or the moment between crops.
Therefore, with the objective of more accurately classifying the agricultural areas and exposed soil, we used the images from different dates to befit the times of production for most crops in the region. We discriminated five categories established on the theme caption, change and no-change, monocrops, water bodies, and changes in water bodies. The monocrop class encompasses the areas with agriculture crops, reforestation, and pasture, since they often present a similar spectral behavior and distinction, not as an object of this work, but presenting or not changes in the land cover. The training and test samples were acquired in an average of 100 for the classification of the false-color composites of the principal components associated with the original band of the intermediate infrared. The PCA allowed the identification of changes and no-changes in the same image, also reducing the classification time of the area, and highlighting the distinct theme classes. After classifying the images, we conducted the post-classification procedures and matrix edition of the classes presented as changed areas with exposed soil, but that, according to many studies and analyses, we concluded that these areas were recently harvested or planted agriculture areas with no plant growth, as shown in
Figure 4b.
After the classification of the image, validation has been performed visually and mathematically using the control points collected during the two field trips. More than 100 random points distributed in the image were analyzed using ground truth data from the study area with the aid of GPS. When considering all land cover classes defined, the overall accuracy index was 0.93 and the Kappa index was 0.88. This value of Kappa is associated with the quality of the classification is considered as good according to Landis and Koch [
25].
5.2.1. Change Detection within the Rio Canoas State Park
The Rio Canoas State Park is a conservation unit of a mixed ombrophilous forest or araucaria forest with approximately 1200 hectares. Because of this, previous to 2004, the RCSP had not yet been created and, consequently, preservation was not required. The term Conservation Unit (CU) is defined by the MMA [
26] as the territorial space and its environmental resources, including the jurisdictional waters, with relevant natural characteristics, legally instituted by the Public Power enterprise, with objectives of conservation and defined limits, under special administration regime, to which adequate protection guarantees are applied.
According to the Law nº 9985 of 18th July 2000, the conservation units integrating the National Nature Conservation Units System are divided into two groups with specific characteristics: The integral protection units and the sustainable use units. The objective of the integral protection units is to preserve nature and admits only the indirect use of its natural resources, except in certain legal cases. The general objective of the sustainable use units is to harmonize environmental conservation with the sustainable use of a portion of its natural resources.
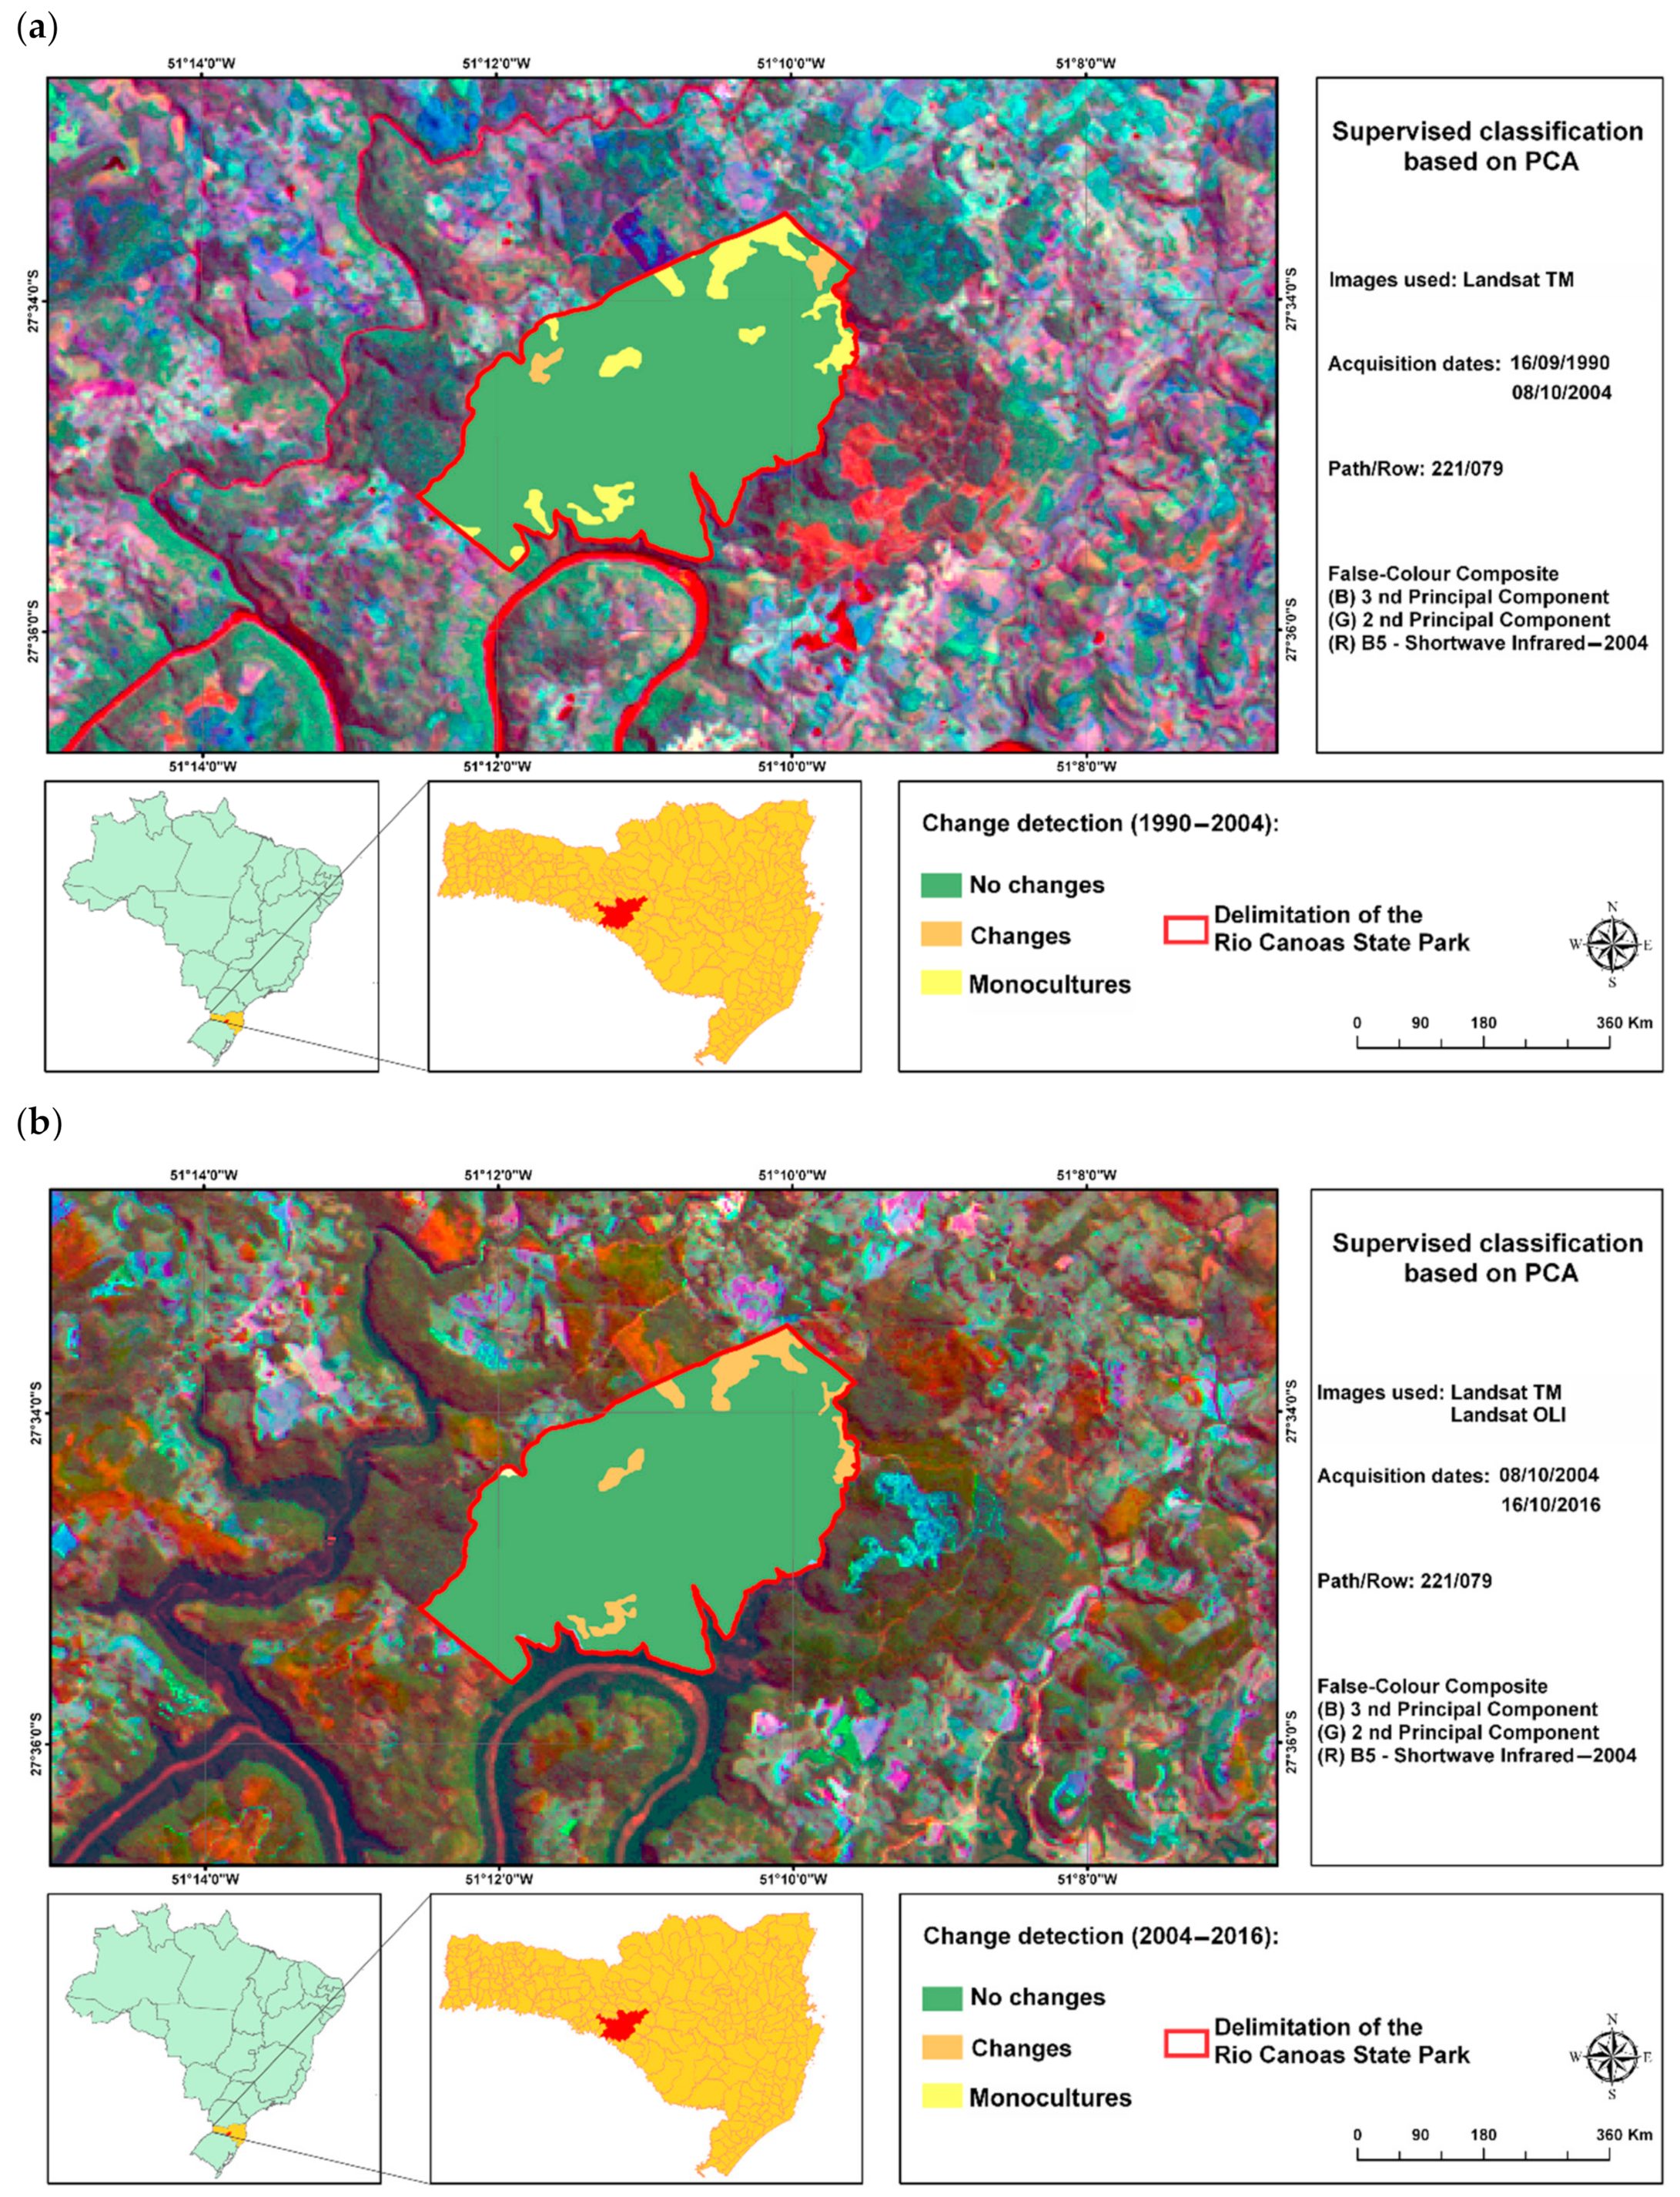
Among the integral protection groups, the units considered are the Ecological Station, Biological Reserve, National Park, Natural Monument, and Wild Life Refuge. The National Park, the object of this work, has a specific objective of the preservation of natural ecosystems of high ecological relevance and scenic beauty, allowing the performance of scientific researches and development of environmental education activities, recreation in contact with nature, and ecological tourism. Based on this, we classified the images resultant from the PCA, comparing the periods between 1990 and 2004 and between 2004 and 2016, as presented in
Figure 5a,b.
Before the creation of the RCSP up until a few months after the Decree was approved, we verified that there were crops and plantations of exotic species within the park in areas significant to the conservation unit. However, with the consolidation of the park and over time, its interior was modified.
In
Figure 4b, we observed the presence of monocrop class which encompasses areas of agricultural and silvicultural activities, such as soybean, corn, tobacco, and exotic species of the Pinus and Eucalyptus genre. In the change detection map referent to the comparison from 1990 to 2004, we verified that the areas with cultivations within the RCSP remained from 1990 until the date in which the image from 2004 (10 August 2004) was taken. These areas presented changes when comparing the images using the PCA. However, by studying other images, we verified that the area was undergoing crop exchange. Associated to this, the class measures from the SPRING software showed that 89.56% (1014.94 ha) were unchanged areas and 10.44% (118.32 ha) were areas with monocrops. Thus, we verified that, during the period from 1990 to 2004, there were no increments to the area of exposed soil, but changes of agricultural and forestry crops.
Figure 5a shows an obvious distinction between the years of 2004 and 2016. We observed that 92.51% (1048.40 ha) are unchanged areas, 6.6% (75.45 ha) demonstrated changes, and 0.7% (7.92 ha) is the riverbed that entered the Park with the creation of the Campos Novos Hydroelectric Power Plant.
The multitemporal dynamic of the land cover of 2004 and 2016, aided with the fieldwork, images from other dates, and the experience of the managers of the conservation unit indicated that, over the years, the Park aimed for changing most monocrops in significant areas to regenerate other forestry species, which ratifies the objective of the conservation unit. As demonstrated in
Figure 5b, we verified that two of the areas which the image-product classification of the PCA indicated as changed areas were real. These were areas previously occupied by Pinus species and removed to regenerate species native of the region.
5.2.2. Change Detection in the Surrounding Areas of RCSP
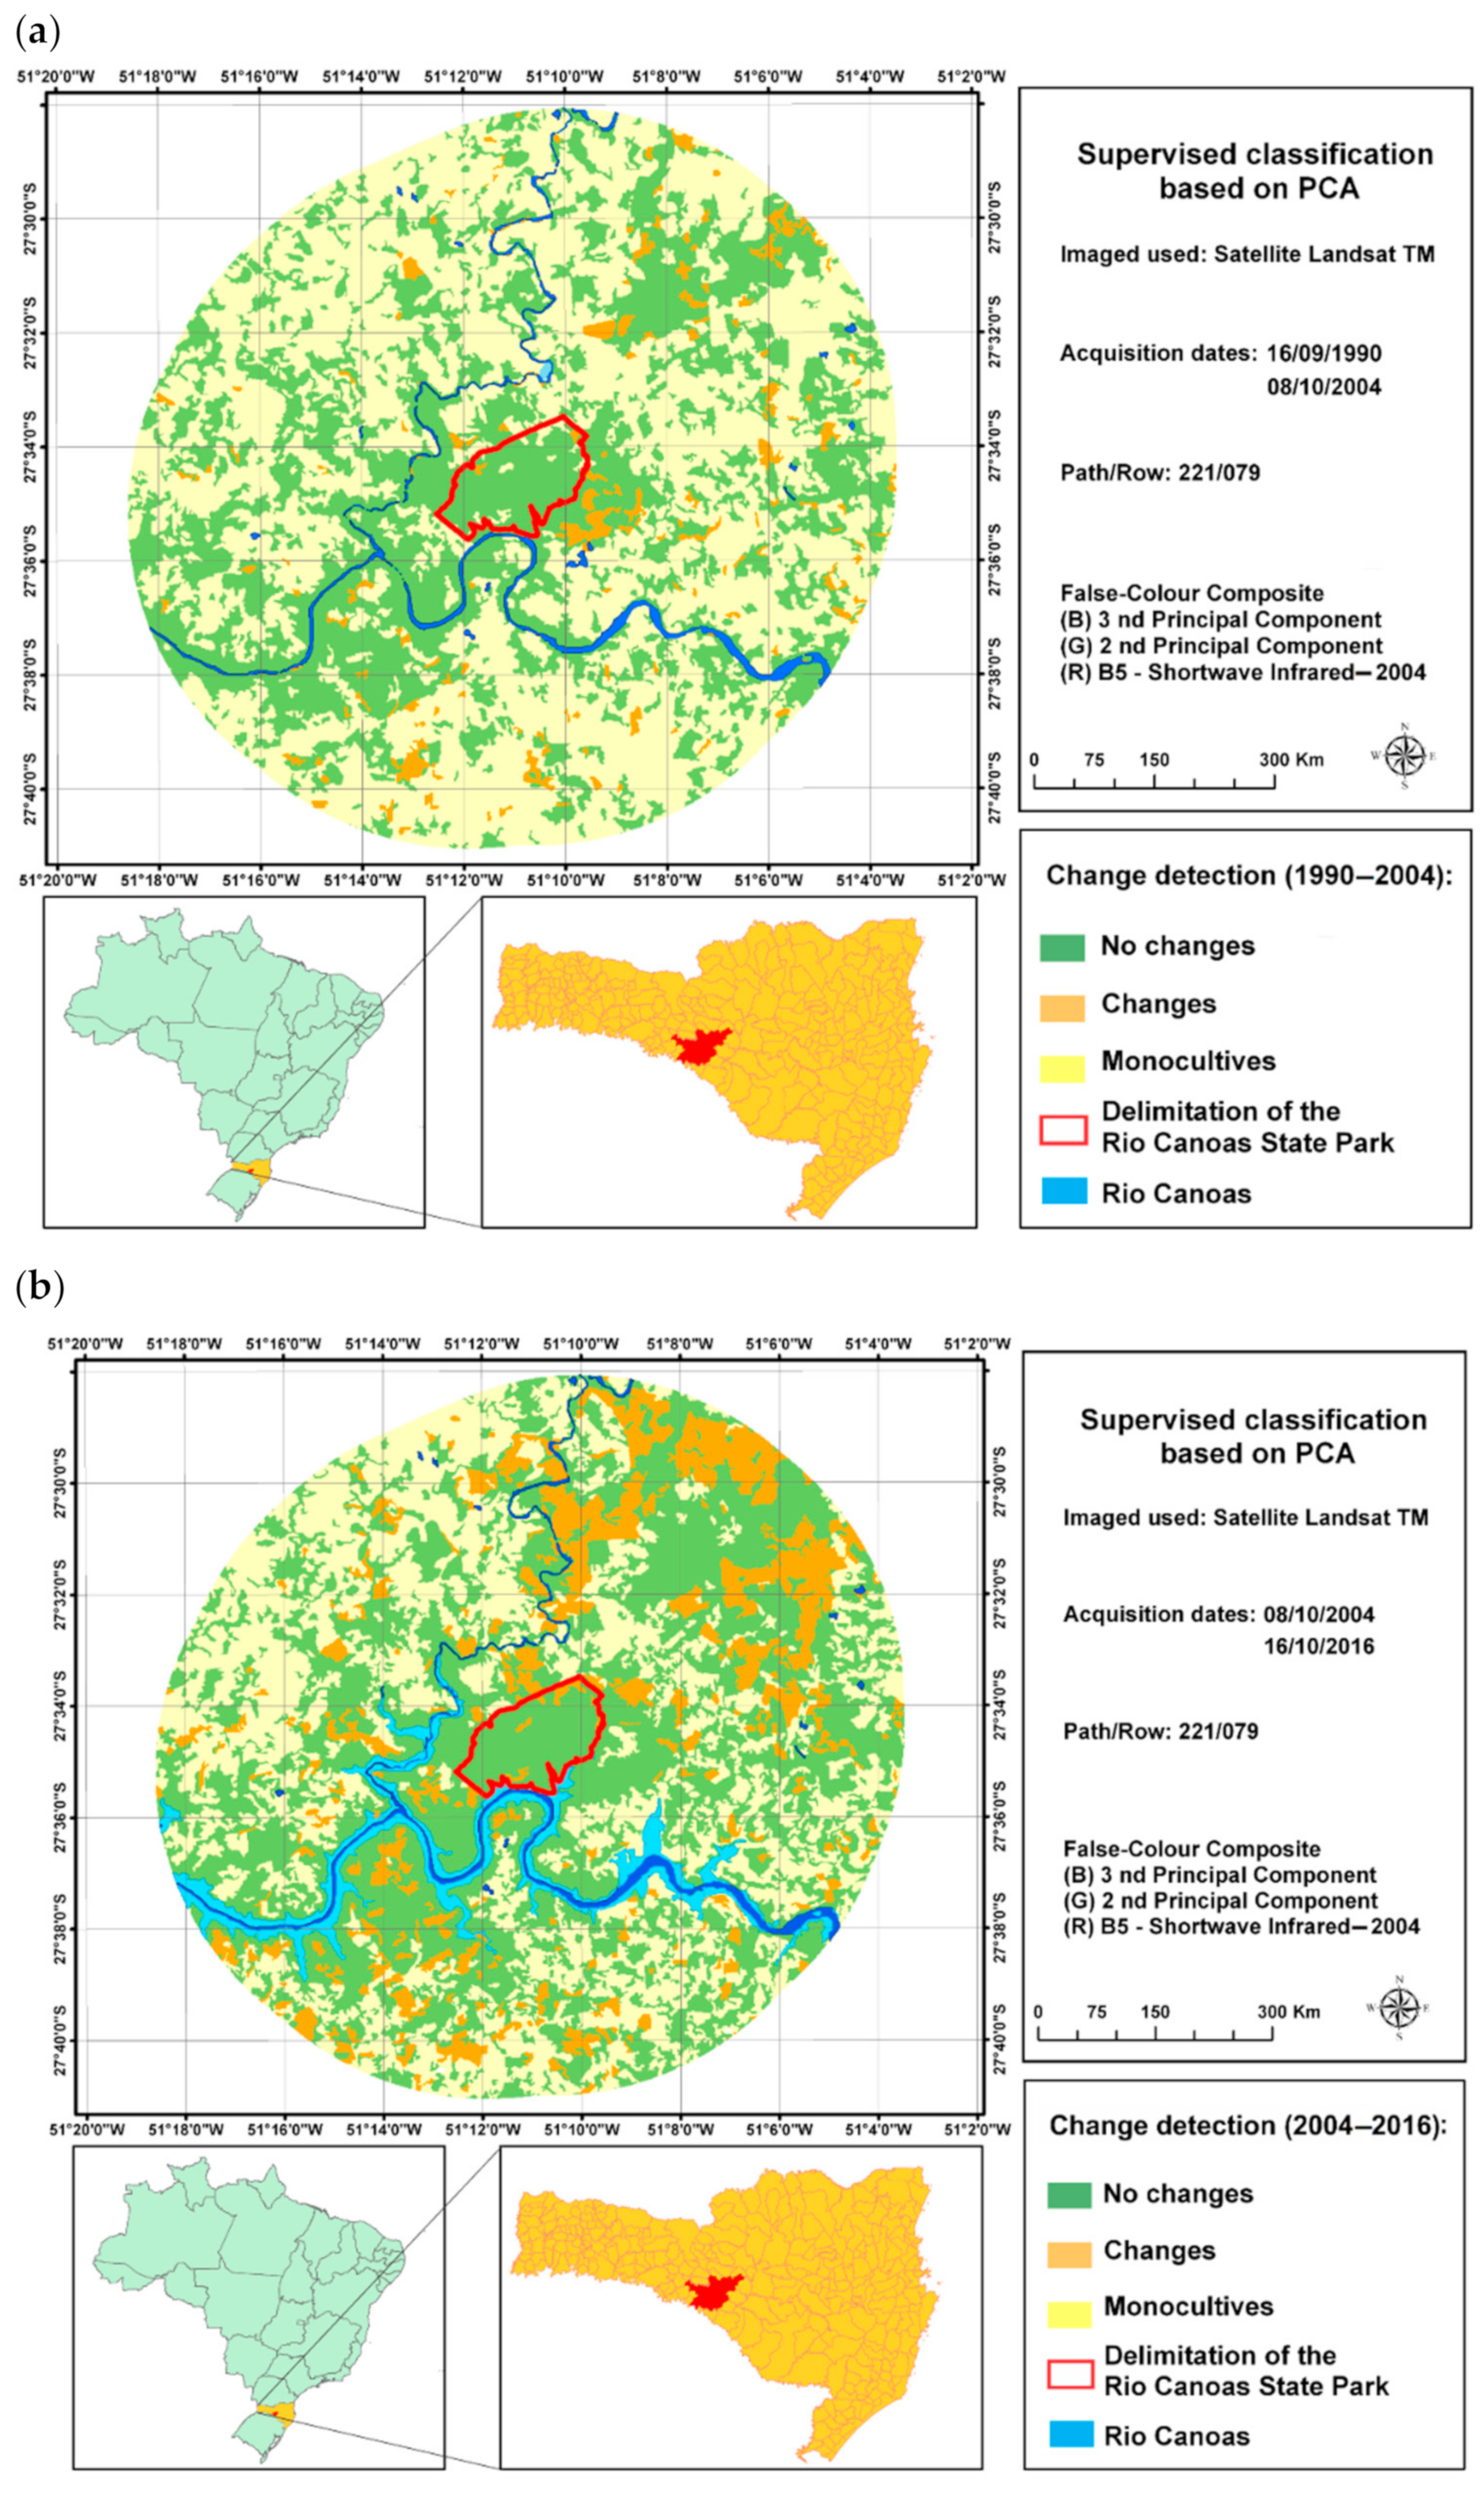
We analyzed the 10 km buffer area surrounding the RCSP to verify the vegetation coverage in the area after the formation of the Campos Novos Hydroelectric Power Plant. This verification allowed us to raise conclusion, first, on the impact the construction of the power plant and, second, if the environmental compensation regarding the PAs of the Park has been implemented correctly. Another fact concerns the inclusion of a Buffer Zone to analyze whether many changes occurred in the area surrounding the Park for this study to provide a subsidy and aid in the posterior proposal of a Buffer Zone, since it briefly mentioned in the management plan. According to the data presented in
Table 1 and the same steps are taken to detect changes within the Park, the areas presenting the most changes in land cover were those of the images taken in 2004 and 2016.
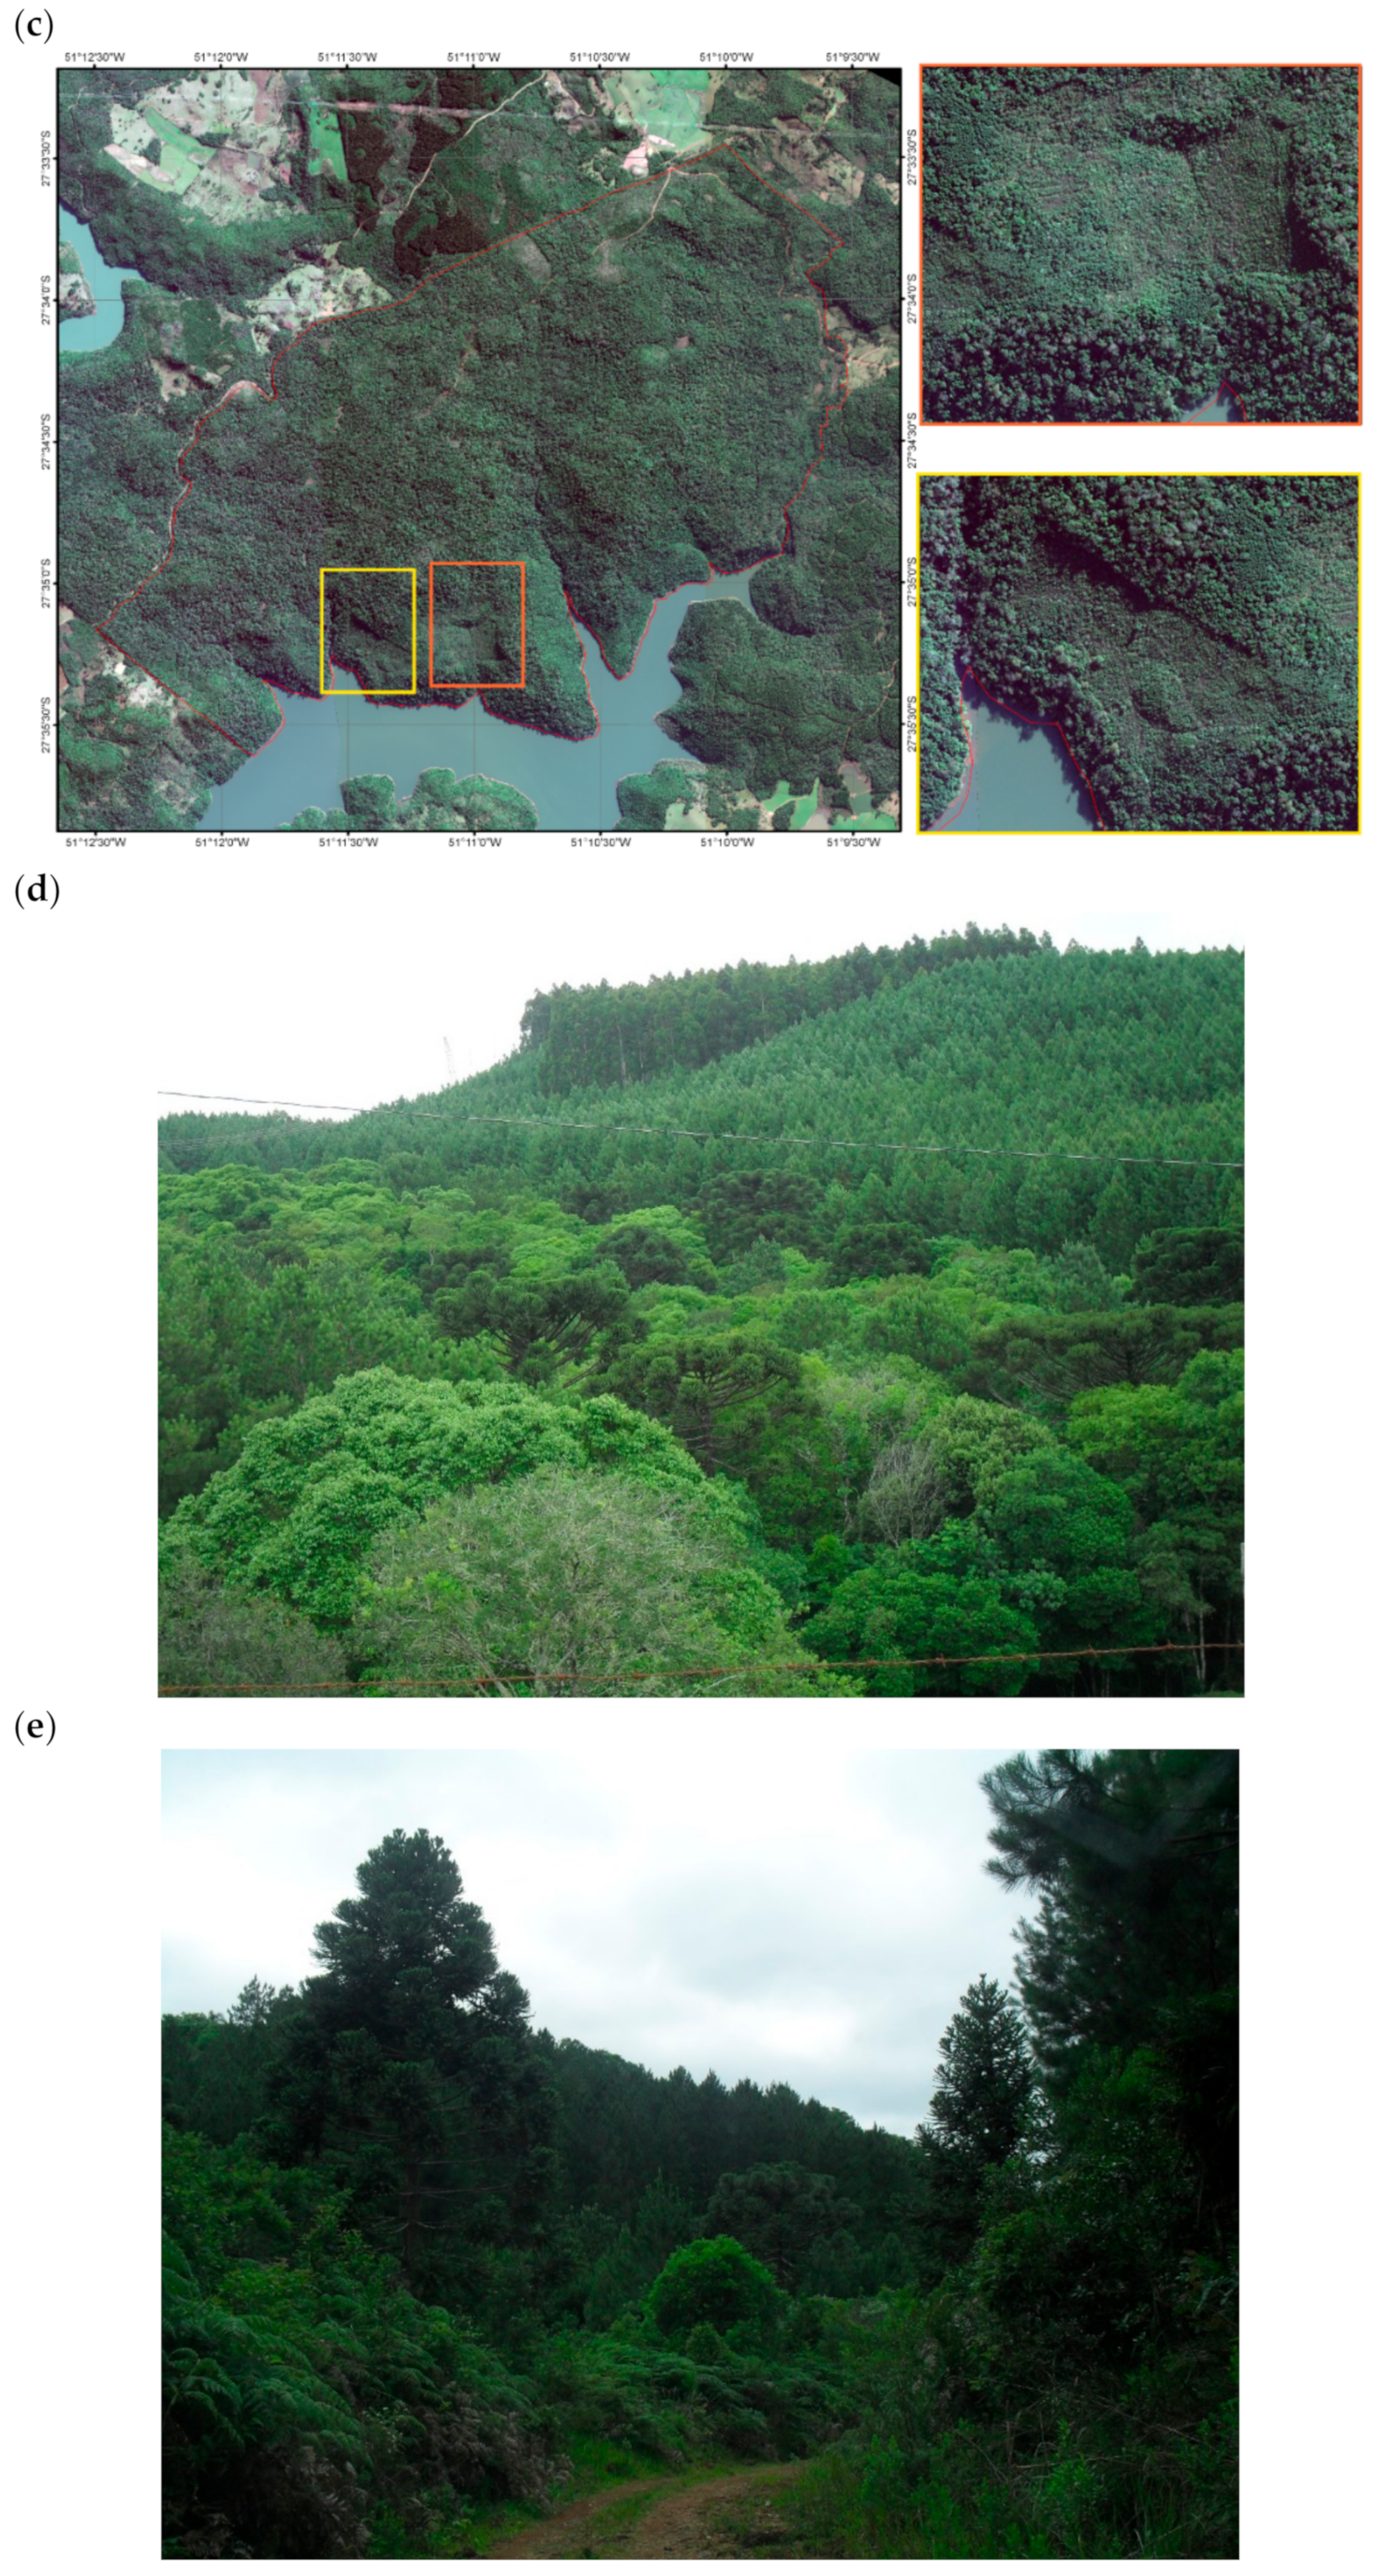
During the period from 2004 to 2016, the land cover changes in 5663. 78 ha (12.20% of the area), mostly by reforestation of Pinus species (
Figure 6b). The surrounding area of the park is characterized by cellulose and paper industries, such as
Iguaçu Celulose S.A, and wood industries. The reforestation areas of exotic species surrounding the RCSP is old and a part of the region´s economy (
Figure 6c,d). However, this is a concerning subject for avoiding contamination with invasive species, due to the proximity to the park.
In 1990 and 2004, the areas that remained unchanged were of approximately 95% of the study area and presented no changes in land cover during the 14 years (
Figure 6a). This occurs mainly due to the continuous presence of agricultural monocrops in both summer and winter, with no great increments. Regarding the 12 years from 2004 to 2016, the changes were more recurrent. This occurs mostly due to the shallow cutting of the Pinus plantation areas, which differ from the crops, such as soybean, tobacco, and corn, and changes the entire landscape. The cutting of the exotic reforestation species take years and is performed in rotations that ranges from 5 to 8 years using shallow or partial cuts. Therefore, in these cases, there is change and, contrary to the soybean crops, for example, which can be replanted as soon as the wheat is harvested and germinates days later, the plantation of new seedlings takes time.
5.2.3. Change Detection in the Bed of the Rio Canoas
The Campos Novos Hydroelectric Power Plant was implanted on the Rio Canoas, approximately 20 km upstream of its confluence with Rio Pelotas at the border of the municipalities of Campos Novos and Celso Ramos, according to the data provided by ENERCAN [
27]. According to ENERCAN, before finishing the construction at the margins of the Rio Canoas, the dam would be formed by the flooding of the peripheral areas to the Rio Canoas, characterizing a substantial extension of flooded land.
The PCA has demonstrated the transformations as pursuant to the study of the RCSP associated with the change detection. Because the data on the flooding of the marginal areas provided by the ENERCAN Company were provided before concluding the construction in 2004, we proceeded with the analyses of the area. Therefore, the data were classified in two images with specific dates and related to the rainfall data, derived from Landsat TM (acquired on 14 July 1990) and Landsat OLI (acquired on 16 April 2016).
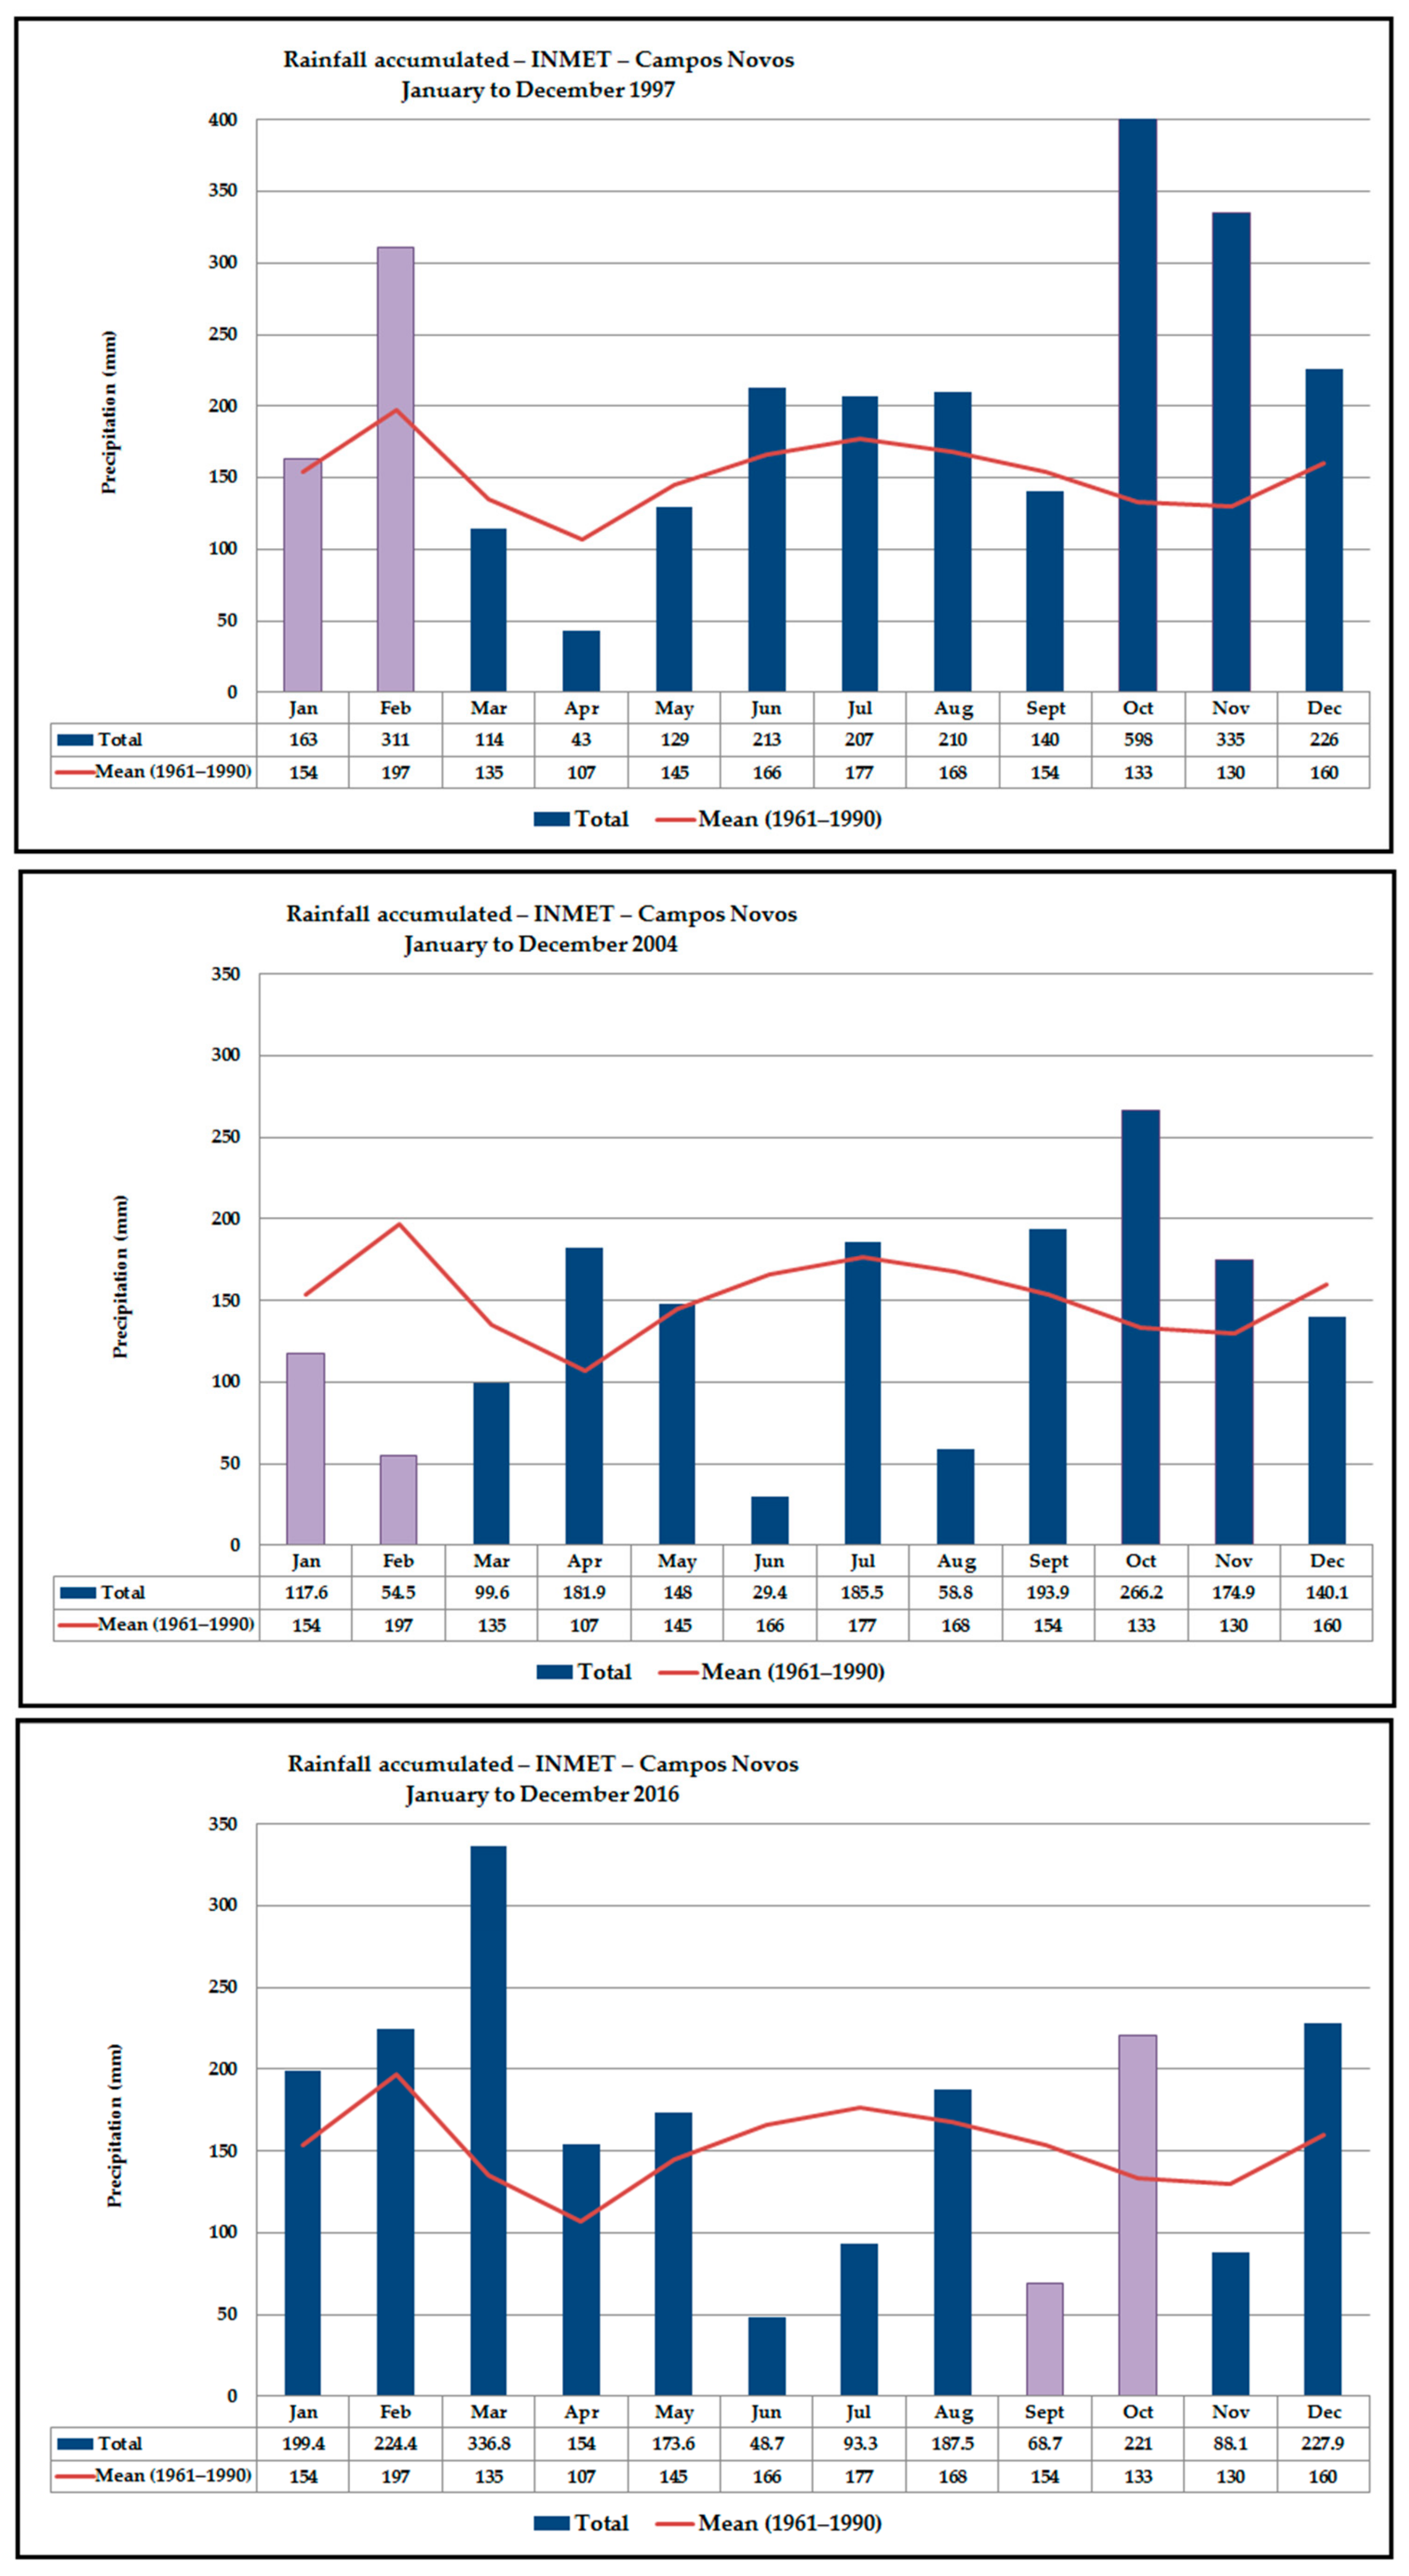
To obtain a better accuracy of the image classification, we acquired the rainfall data from the Hydrological Information System—Hidroweb of the National Waters Agency (
Figure 7). We used the average rainfall from 1961 to 1990, historical series of 30 years, with monthly information according to the National Meteorology Institute (INMET). To classify the images, they were selected according to the dates in which there was monthly accumulated rainfall nearly the same as the average for the 30 years analyzed to exclude the influences of rain in the demarcation of the riverbed before and after flooding the area.
As presented in
Figure 7, the areas in light pink identify the dates with rainfall accumulations that could influence the increase of the riverbed. We used the images according to the availability and the value nearest to the average of rain accumulated in 30 years. The image acquired on 6 January 1997 demonstrates that the amount of rain accumulated was within the average and, therefore, there were not many influences of rain. Regarding the image acquired on 16 April 2016, when considering rainfall data in October, we verified a significant increase of accumulated rainfall, but we disregarded the daily averages of accumulated rainfall for October of 2016. With this detailed information from INMET, we verified that, until the 16th of October, the rainfall accumulation was of 78 mm, also having little effect in the area. According to the generated map (
Figure 8), an area of 6.48 km
2 has been indicated as an approximate measure of the riverbed on 6 January 1997 and of 30.15 km
2 on 16 April 2016 with the creation of the Campos Novos Hydroelectric Power Plant. The objective of the study was to analyze the size of the area surrounding the RCSP that was flooded, due to the high difference made explicit in the change detection using the PCA technique.
6. Conclusions
The Rio Canoas State Park is the largest remaining portion of the Mixed Ombrophilous Forest (Araucaria Forest) surrounding the Campos Novos Hydroelectric Power Plant dam, in the southern region of Brazil. The forest ecosystem belongs to the Atlantic Forest Domain of South America, which is under the threat of extinction in the Santa Catarina state of Brazil.
Based on the work conducted, we conclude that the Principal Component Analysis associated with specific bands after conducting a field study is effective in detecting LULC changes when comparing two or more dates, particularly in understanding exactly where the changes occurred rather than what changes occurred.
The analysis conducted in the area surrounding the Rio Canoas State Park, which is established in 2004, for the period between 1990 and 2004 demonstrated that more than 95% of the park and the surrounding areas remained intact. The area, where the park is situated had no land cover change during this period and 3.1% of the surrounding areas showed changes, due to agriculture and silviculture practices. This change was minimal due to the continuous presence of agricultural monocrops in both summer and winter in the area surrounding the Park.
For the period between 2004 and 2016, it is observed that about 5663.78 ha (12.20% of the area) of the land cover surrounding the park changed, due to the reforestation of Pinus species. Within the park, we verified that 92.51% (1048.40 ha) are no-change areas, 6.6% (75.45 ha) presented changes (this includes regeneration of native species, land cover changes, due to the abandoning of agriculture within the park and invasive species), and the rest (0.89%) is the riverbed that entered the Park after the creation of the Campos Novos Hydroelectric Power Plant. This data indicates actions regarding the preservation of the vegetation cover within the Park to reduce the impacts of anthropic activities.
The areas surrounding the Park are characterized by cellulose, paper and wood industries. The reforestation areas with exotic species (e.g., Pinus elliottii, P. taeda) surrounding the Park are old and a part of the region´s economy. From an ecological point of view, it is important to avoid contamination of natural forest in the protected areas by such invasive species (Pinus sp. in particular), due to the proximity to the Park.
Furthermore, we demonstrated an increase in the Rio Canoas bed with the implementation of the Campos Novos Power Plant and concluded that there was an increase of 23.67 km2 in 2016 when compared to 1997. This area advanced the initial limits of the Rio Canoas State Park, changed the landscape, caused the translocation of people, and flooding of the areas previously covered by ciliary forests. The results of this study can be used in the environmental management of similar kinds of parks and surrounding areas, allowing the monitoring of the environmental legislation and management plan, and guide plans of action.
In a nutshell, it was concluded that after the creation of the Rio Canoas State Park, some modifications were made to its LULC, such as the clearing of larger areas with Pinus plantations, in order to facilitate the regeneration of native species and to create projects to control the expansion of exotic species. The large-scale plantations of exotic species exist prior to the creation of the park and these areas contribute to the economy of the region. However, it is known that reforestation with these invasive species, such as Pinus eliotti and P. taeda, depending on how the plantations are conducted, may lead to the decrease in some of the native species and this may alter the natural diversity of the ecosystem. After the creation of the park, expansion of exotic species into the park has been reduced, due to the control measurements taken by the authorities. These factors project the importance of a time-series monitoring of the forest fragments of mixed ombrophilous forests belonging to the core zone of the Brazilian Atlantic Forest Biosphere Reserve.


