Relationship between Vegetation and Environment in an Arid-Hot Valley in Southwestern China

State Key Laboratory of Water Environment Simulation, School of Environment, Beijing Normal University, Beijing 100875, China
*
Author to whom correspondence should be addressed.
Sustainability 2018, 10(12), 4774; https://doi.org/10.3390/su10124774
Submission received: 25 November 2018
/
Revised: 11 December 2018
/
Accepted: 11 December 2018
/
Published: 14 December 2018
(This article belongs to the Special Issue Forest Biodiversity, Conservation and Sustainability)
Abstract
:The sparse and fragile vegetation in the arid-hot valley is an important indicator of ecosystem health. Understanding the correlation between this vegetation and its environment is vital to the plant restoration. We investigated the differences of soil moisture and fertility in typical vegetation (Dodonaea viscosa and Pinus yunnanensis) under a range of elevations, slopes, and aspects in an arid-hot valley of China’s Jinsha River through field monitoring and multivariate statistical analysis. The soil moisture differed significantly between the dry and rainy seasons, and it was higher at high elevation (>1640 m) and on shade slopes at the end of the dry season. Soil fertility showed little or no variation among the elevations, but was highest at 1380 m. Dodonaea viscosa biomass increased, then decreased, with increasing elevation on the shade slopes, but decreased with increasing elevation on the sunny slopes. On the shade slopes, Pinus yunnanensis biomass was higher at low elevations (1640 m) than it was on sunny slopes, but lower at high elevation (1940 m) on the sunny slopes. We found both elevation and soil moisture were significantly positively correlated with P. yunnanensis biomass and negatively correlated with D. viscosa biomass. Thus, changes in soil moisture as a function of elevation control vegetation restoration in the arid-hot valley. Both species are adaptable indigenous plants with good social and ecological benefits, so these results will allow managers to restore the vegetation more effectively.
1. Introduction
The high temperature and low humidity in the arid-hot valley results from a combination of local climatic conditions with strong sunlight and valley wind (particularly winds caused by convection during a forest fire) and evapotranspiration. Poor soil water retention capacity intensifies the difficulty of vegetation growth, leading to serious soil erosion, threatening the human and environment security of Yangtze River basin, especially in the main stream of Jinsha River (the upper Yangtze River) [1]. Since the 1990s, plant introduction and afforestation projects have been carried out in the arid-hot valley in southwest China, but we still do not understand the factors responsible for success or failure of these projects [2].
Exploring the relationship between vegetation and environment is the key to successful vegetation restoration, particularly on mountainous terrain. Many studies have focused on potential impact factors, including climatic factors, topographic conditions, soil properties, and human disturbance [3,4,5]. A deficiency of soil moisture results in sparse vegetation and decreased restoration effectiveness in the arid-hot valley and, especially at the end of the drought season, the values of soil moisture may be lower than the plant-wilting coefficient [6,7]. In addition, topography plays an important role in vegetation growth and distribution [8], since it affects many aspects of the plant’s environment; higher solar radiation and less available water on the sunny slopes of semi-arid valleys would exacerbate drought stress, resulting in the survival of fewer species, a lower plant density, and lower growth rates of the surviving plants [9]. The literature shows that topographic conditions and soil properties are closely related to plant community composition and distribution [10], vegetation cover [11], and biodiversity [12]. To improve ecological restoration efficiency, it is necessary to deeply understand the relationships between the targeted native vegetation and the local environment (e.g., topography, soil, other habitat conditions), and to identify the key factors that affect the growth, survival, and distribution of vegetation in the arid-hot valley [13,14].
The Jinsha River basin in southwestern China has a typical arid-hot valley, and provides the important source of hydroelectric power, and plays a vital role in ecological security for its special ecosystems and rich biodiversity. Since economic development has been driven by the hydroelectric project, dam and reservoir construction have destroyed much local vegetation, thereby exacerbating the contradictions between civilization and nature. Managers of the project recognize this problem, and have looked for ways to promote greener and more sustainable development, including vegetation restoration projects and soil erosion control [14,15,16]. Many studies on the change of vegetation cover [17], mechanisms and degree of vegetation resistance, soil characteristics and fertility, and restoration techniques and benefits have been carried out [18]. The dominant native plants, Dodonaea viscosa and Pinus yunnanensis, with high stress resistance and restoration benefit, are important for soil and water conservation, and both are, therefore, key plants in ecological restoration projects. These native plants have attracted much attention from many researchers, but most of the research selected a single factor, such as soil quality, slope and elevation, to statistically analyze its effect on vegetation; even a few studies have focused on more factors, but just discussed the qualitative influence and were carried out only in the tributaries of the Jinsha River [19]. D. viscosa biomass is significantly affected by both slopes and aspects [20], and transpiration of D. viscosa is strong during both the rainy and dry seasons [21]. P. yunnanensis is widely distributed, but grows poorly on sunny slopes, even though it can tolerate low soil moisture and nutrient levels and, especially, a very low phosphorus content [22,23]. However, there has been no integrated analysis of how environmental factors affect these native plants of the Jinsha River valley.
Using the Longkaikou Reservoir region in the Jinsha River basin as a case study, we obtained field data about changes in the characteristics of D. viscosa and P. yunnanensis across an elevation gradient, including the vegetation biomass and the response to climatic, topographic, and soil characteristics, by means of multiple field surveys to analyze the differences in soil and vegetation as a function of topography. Our goal was to reveal the relationships among the topographic and soil variables and the biomass of D. viscosa and P. yunnanensis. Our results will provide scientific support for vegetation restoration projects in the arid-hot valley of the Jinsha River.
2. Materials and Methods
2.1. Study Area
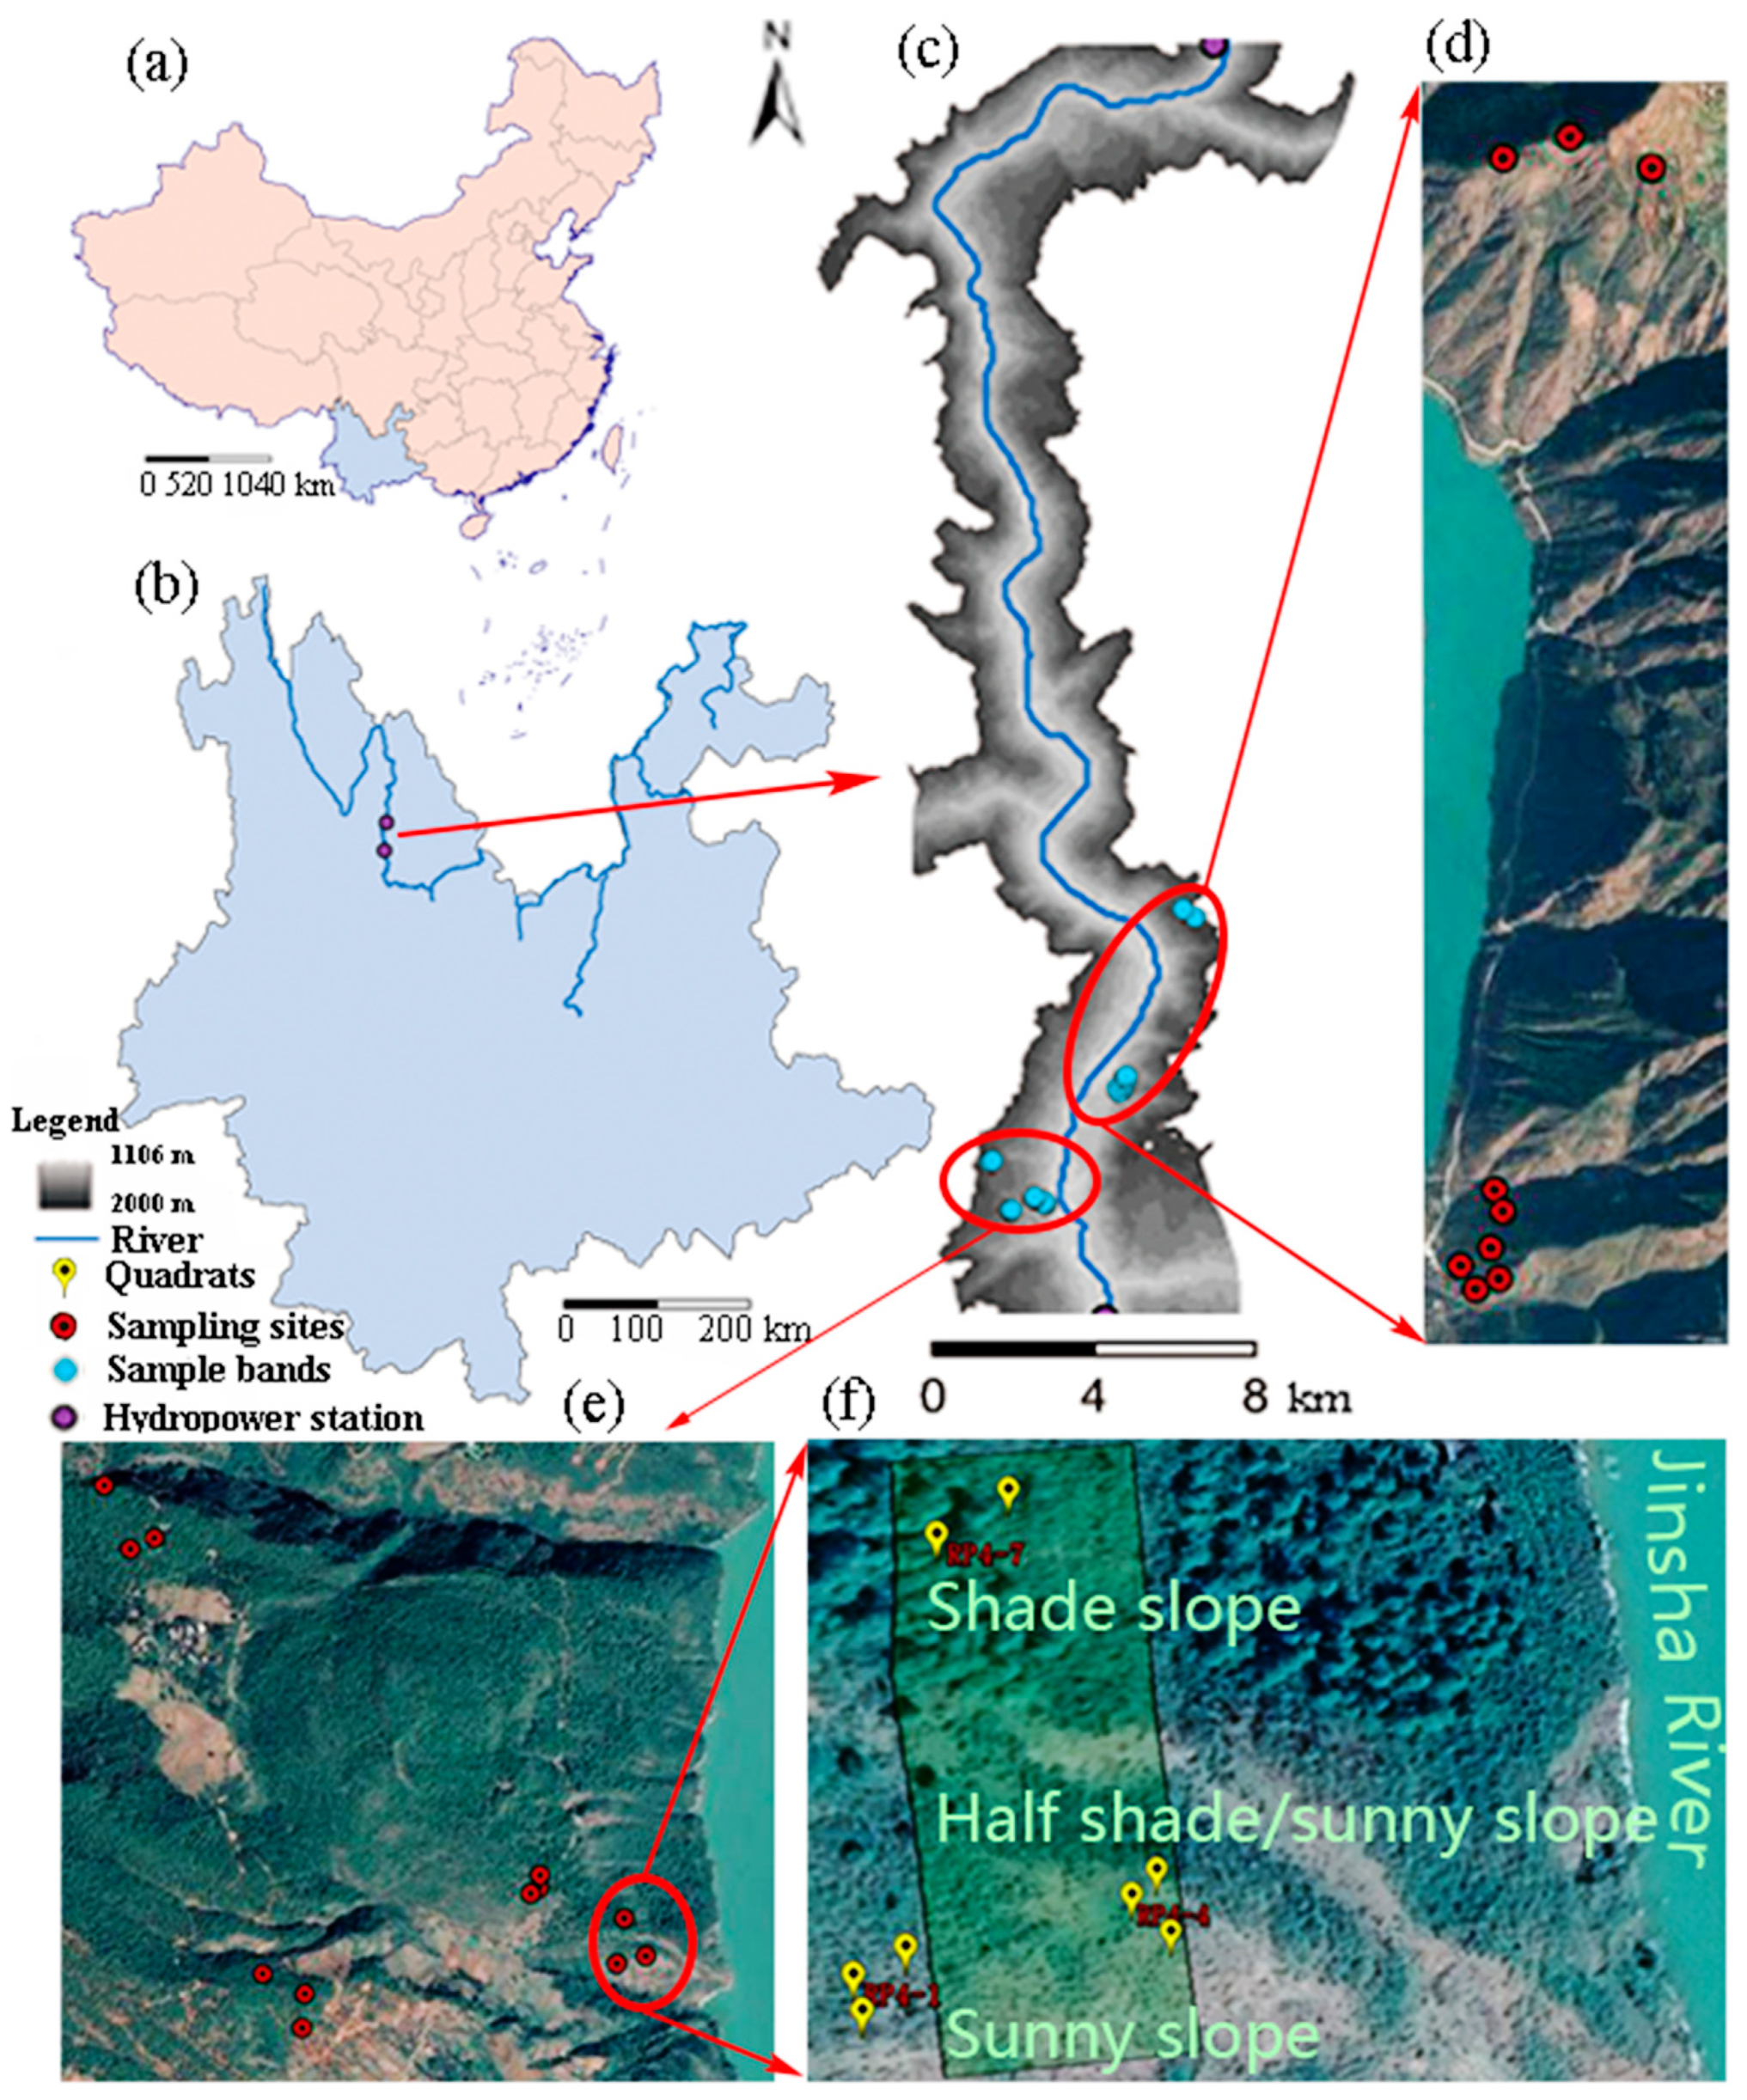
Longkaikou hydroelectric station, in Yongsheng County of Yunnan Province, is the sixth of eight cascade reservoirs constructed in the Jinsha River basin. Construction began in 2007, and it began operation in 2014. The reservoir’s main purpose is power generation, but it also provides water for irrigation and an urban and industrial water supply. The dam height is 119 m, the normal storage water level is 1298 m asl (above sea level), the backwater length is 41 km, the water area is about 17 ha, and the total reservoir capacity is 5 × 10⁸ m3. The reservoir is located in a typical alpine canyon area with complex topography and diverse local microclimates. The difference between the rainy and dry seasons is obvious, with an annual average precipitation of 936 mm, of which 82% falls between June and September (Figure S1). Figure S1 shows the annual changes of temperature and precipitation in our study area, based on data from the Yongsheng meteorological station, which is located 37.8 km from our study sites at an elevation of 2151 m asl. The land below an elevation of 1500 m asl has an arid-hot valley climate; above this elevation, there is greater precipitation and the temperatures are much colder. The vegetation, including D. viscosa, P. yunnanensis, and Ageratina adenophora, is widely distributed in the reservoir region, but has been seriously disturbed by construction of the reservoir, as well as by grazing of livestock and cutting. In local vegetation restoration projects, P. yunnanensis is used on barren mountain slopes [24]. D. viscosa is a perennial evergreen shrub or small tree of the genus Dodonaea. It can adapt to a wide range of sites due to its high tolerance of drought and low soil fertility, and is therefore one of the main native plants used for vegetation restoration in the study area. Our study area covers nearly 300 km2, with a length of 41 km along the river and a width of 7.0 km (Figure 1).
2.2. Sample Collection and Processing
We conducted field surveys three times (in April and August 2017, and in April 2018) in the study area, and collected soil and vegetation samples during each sampling period. We combined the April data to produce a single dataset for the dry season; the August data represented the end of the rainy season (the rain was too frequent to reach high area with elevation above 1640 m). For each sample, we recorded the elevation, slope, and aspect simultaneously (Table S1). We attempted to establish 3 quadrats at each of 21 sampling sites, for a total of 63 quadrats (n); however, some sampling sites had two or four quadrats, due to the nature of the topographic conditions. All of the samples were evenly distributed bath left bank (marked LPx-x) and right bank (marked RPx-x) at five elevations that ranged from the river (ca. 1380 m asl) to the top of the mountains (ca. 1940 m asl), and included shade slopes, sunny slopes, and half-shaded slopes. We established sampling bands at elevations of 1380, 1440, 1520, 1640, and 1940 m asl. For each sampling site, we recorded the slope and aspect (Asp) using a DQY-1 compass (Geological Compass; Haerbin, Heilongjiang Province, China), and obtained the elevation and the longitude and latitude using a GPS receive (GPSmap 62sc; Garmin, Lenexa, KS, USA). We calculated the topographic wetness index and the distance from the quadrats to the river are calculated from a digital elevation model (http://www.gscloud.cn/sources/?cdataid=302&pdataid=10) using version 10.2 of the ArcGIS software (www.esri.com).
In total, we established 57 D. viscosa quadrats and 38 P. yunnanensis quadrats, and recorded number of branches, plant density, and vegetation cover, diameter at breast height, crown width, and height. We collected the aboveground biomass for 25 D. viscosa plants, and dried the samples at 60 °C until constant weight in the laboratory; we then weighed the oven-dry biomass using a laboratory electronic balance with a precision of 0.01 g.
We collected 64 soil samples (each ca. 1 kg) to a depth of 10 cm with a shovel, as the soil was too rocky below this depth to allow sampling. We measured soil moisture, organic matter, total nitrogen, total potassium, hydrolyzable nitrogen, and available phosphorus in the laboratory according to the standards of the Chinese Forestry Bureau (http://www.zbgb.org/StandardCList25C.htm) using the air-dry soil for all parameters except soil moisture. Soil moisture was measured based on the difference between the fresh and oven-dry mass (after drying at 105 °C for 24 h until all the moisture was driven off). The organic matter was determined by the potassium dichromate oxidation method with external heating (LY/T 1237-1999), total nitrogen was measured by the Kjeldahl method (LY/T 1228-2015), total potassium was determined by NaoH flame photometry (LY/T 1234-2015), hydrolyzable nitrogen was determined by the alkaline hydrolysis-diffusion method (LY/T 1228-2015), and available phosphorus was determined by colorimetry (LY/T 1232-2015).
2.3. Estimation of Soil Fertility and Vegetation Biomass
We established a holistic index of soil fertility (SF) as follows:
where xi represents the value of nutrient indicator i (organic matter, total nitrogen, total potassium, hydrolyzable nitrogen, and available phosphorus), and xmini is the lowest value for each of the five nutrient indicators in the soil nutrient grading standards of the second national land survey.
The growth model for D. viscosa is region-dependent, since this species lives in different areas [25], so we established a relative growth model.
Due to the multiple branches produced by this shrub, we defined the total diameter (D) based on the sum of the squared branch diameters:
where Di is the diameter (cm) of branch i, and n is the number of branches contained in each shrub [26]. We then adopted a relative growth model in the form of a power function based on a previously determined growth model for the shrub [27]:
where Bio = aboveground biomass, D is the total diameter from Equation (2), and H is the height at the end of the tallest branch.
Bio = 44.047 D2 H0.467 (R2 = 0.94, p < 0.01),
We obtained an equation from Huo et al. [28] to determine the relative growth of P. yunnanensis.
Bio = 0.026 D2.83
2.4. Statistical Analysis
We used cosine function convert aspect (ASP) and divided it into shade slope (<0) and sunny slope (>0). First of all, we have a Kolmogorov–Smirnov test for normality of the data. When the data satisfied the conditions of normal distribution, we used ANOVA and LSD to identify significant differences in vegetation and soil properties among the topographic conditions. We used regression analysis to establish the relative growth models to calculate plant biomass and used Pearson’s correlation coefficient (r) to quantify the strength of the relationships among the vegetation, topographic, and soil indicators. All the statistical analysis was performed using version 3.5.1 of the R software (www.r-project.org).
We used redundancy analysis (RDA) to study the relationships between the vegetation and environmental indexes because the eigenvalue of the first axis of a detrended correspondence analysis (DCA) was less than 3 for the vegetation data. We performed these analyses using the “vegan” package for the R software (https://cran.r-project.org/web/packages/vegan/index.html).
3. Results
3.1. Variation in Soil Moisture and Fertility
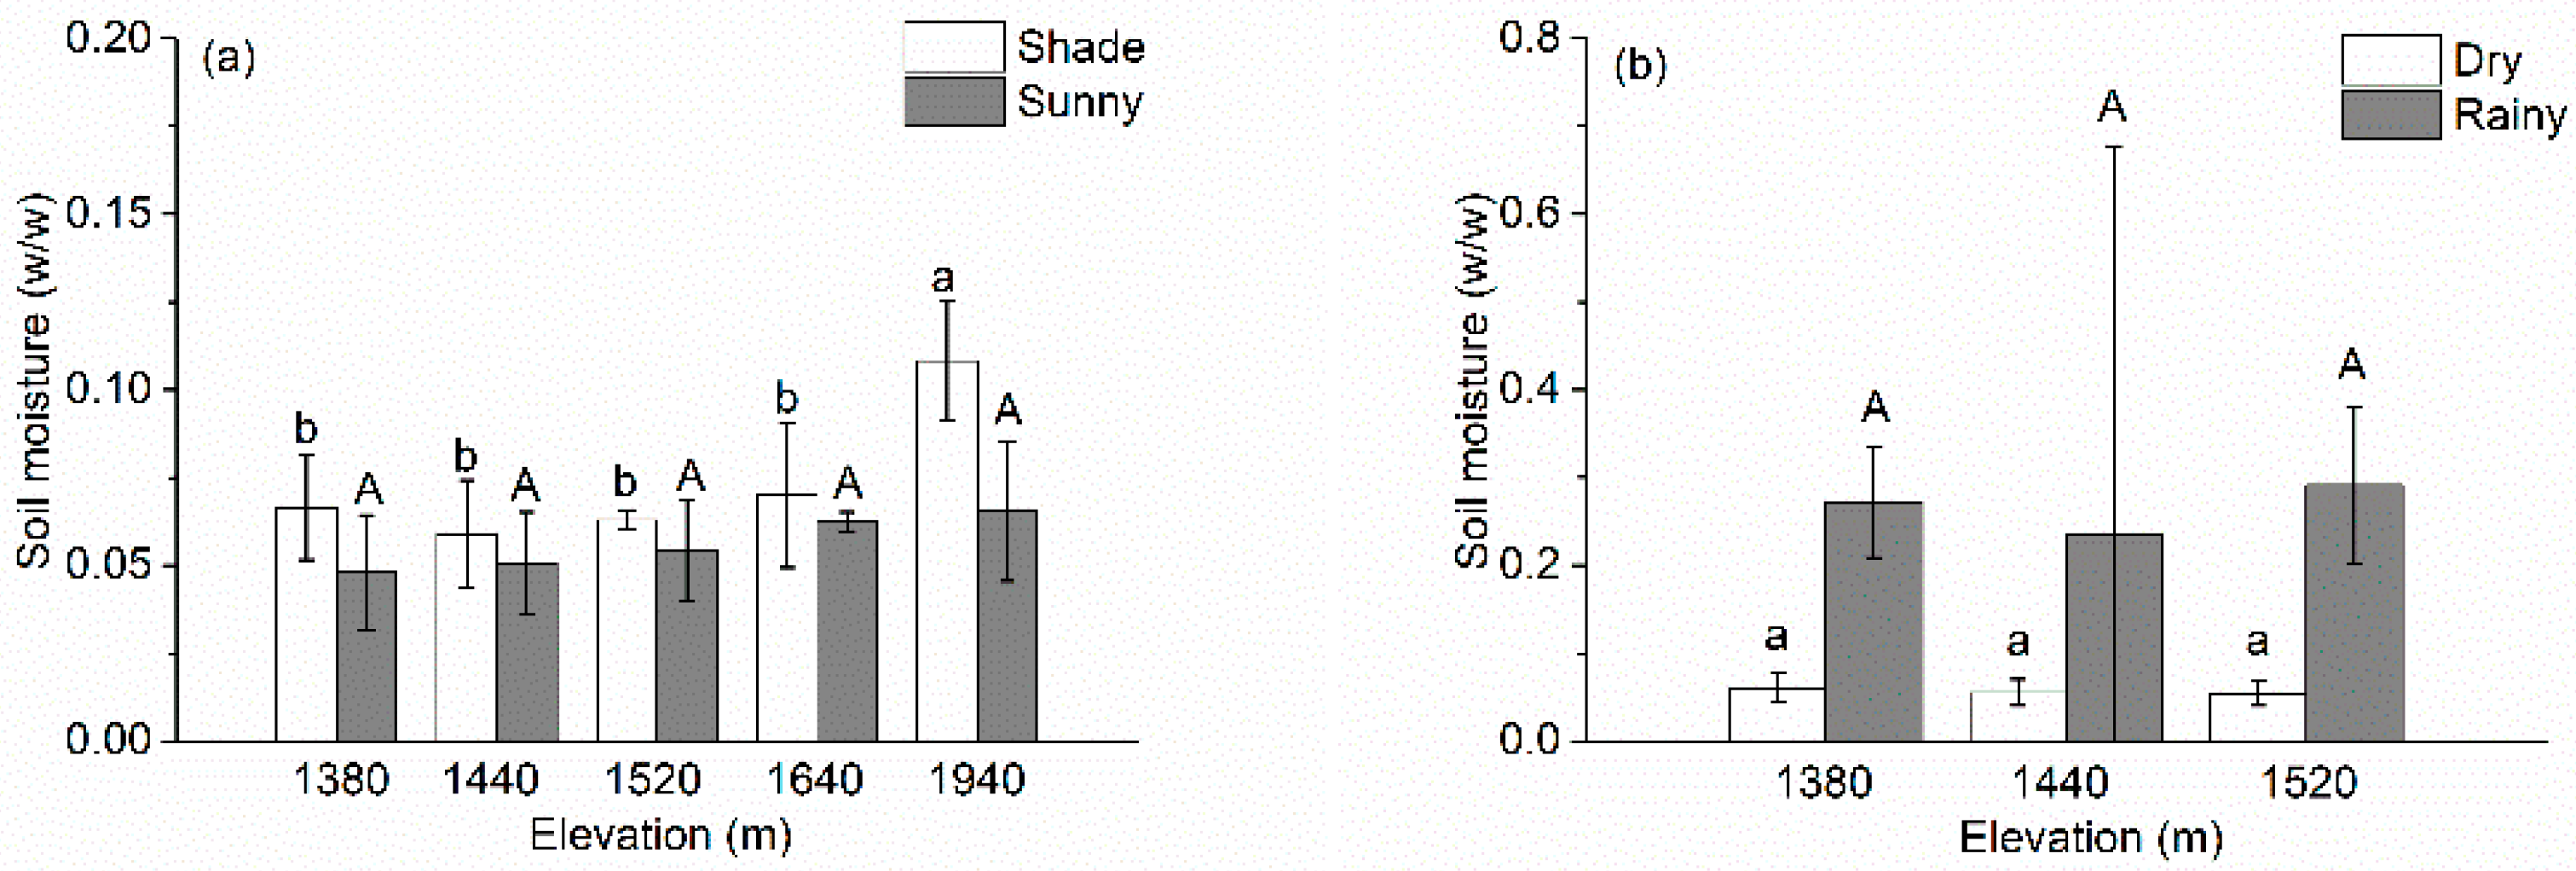
Figure 2 shows the changes of soil moisture along the elevation gradient. The soil moisture was higher on the shade slopes than on the sunny slopes at all elevations in the dry season (Figure 2a), and it was much higher in the rainy season than at the end of the dry season at a given elevation (Figure 2b). The soil moisture increased slightly, but not significantly, with increasing elevation, except the shade slope at 1940 m asl (p < 0.05) and, at elevations (≤1520 m), with an average of 0.055, did not differ significantly among elevations.
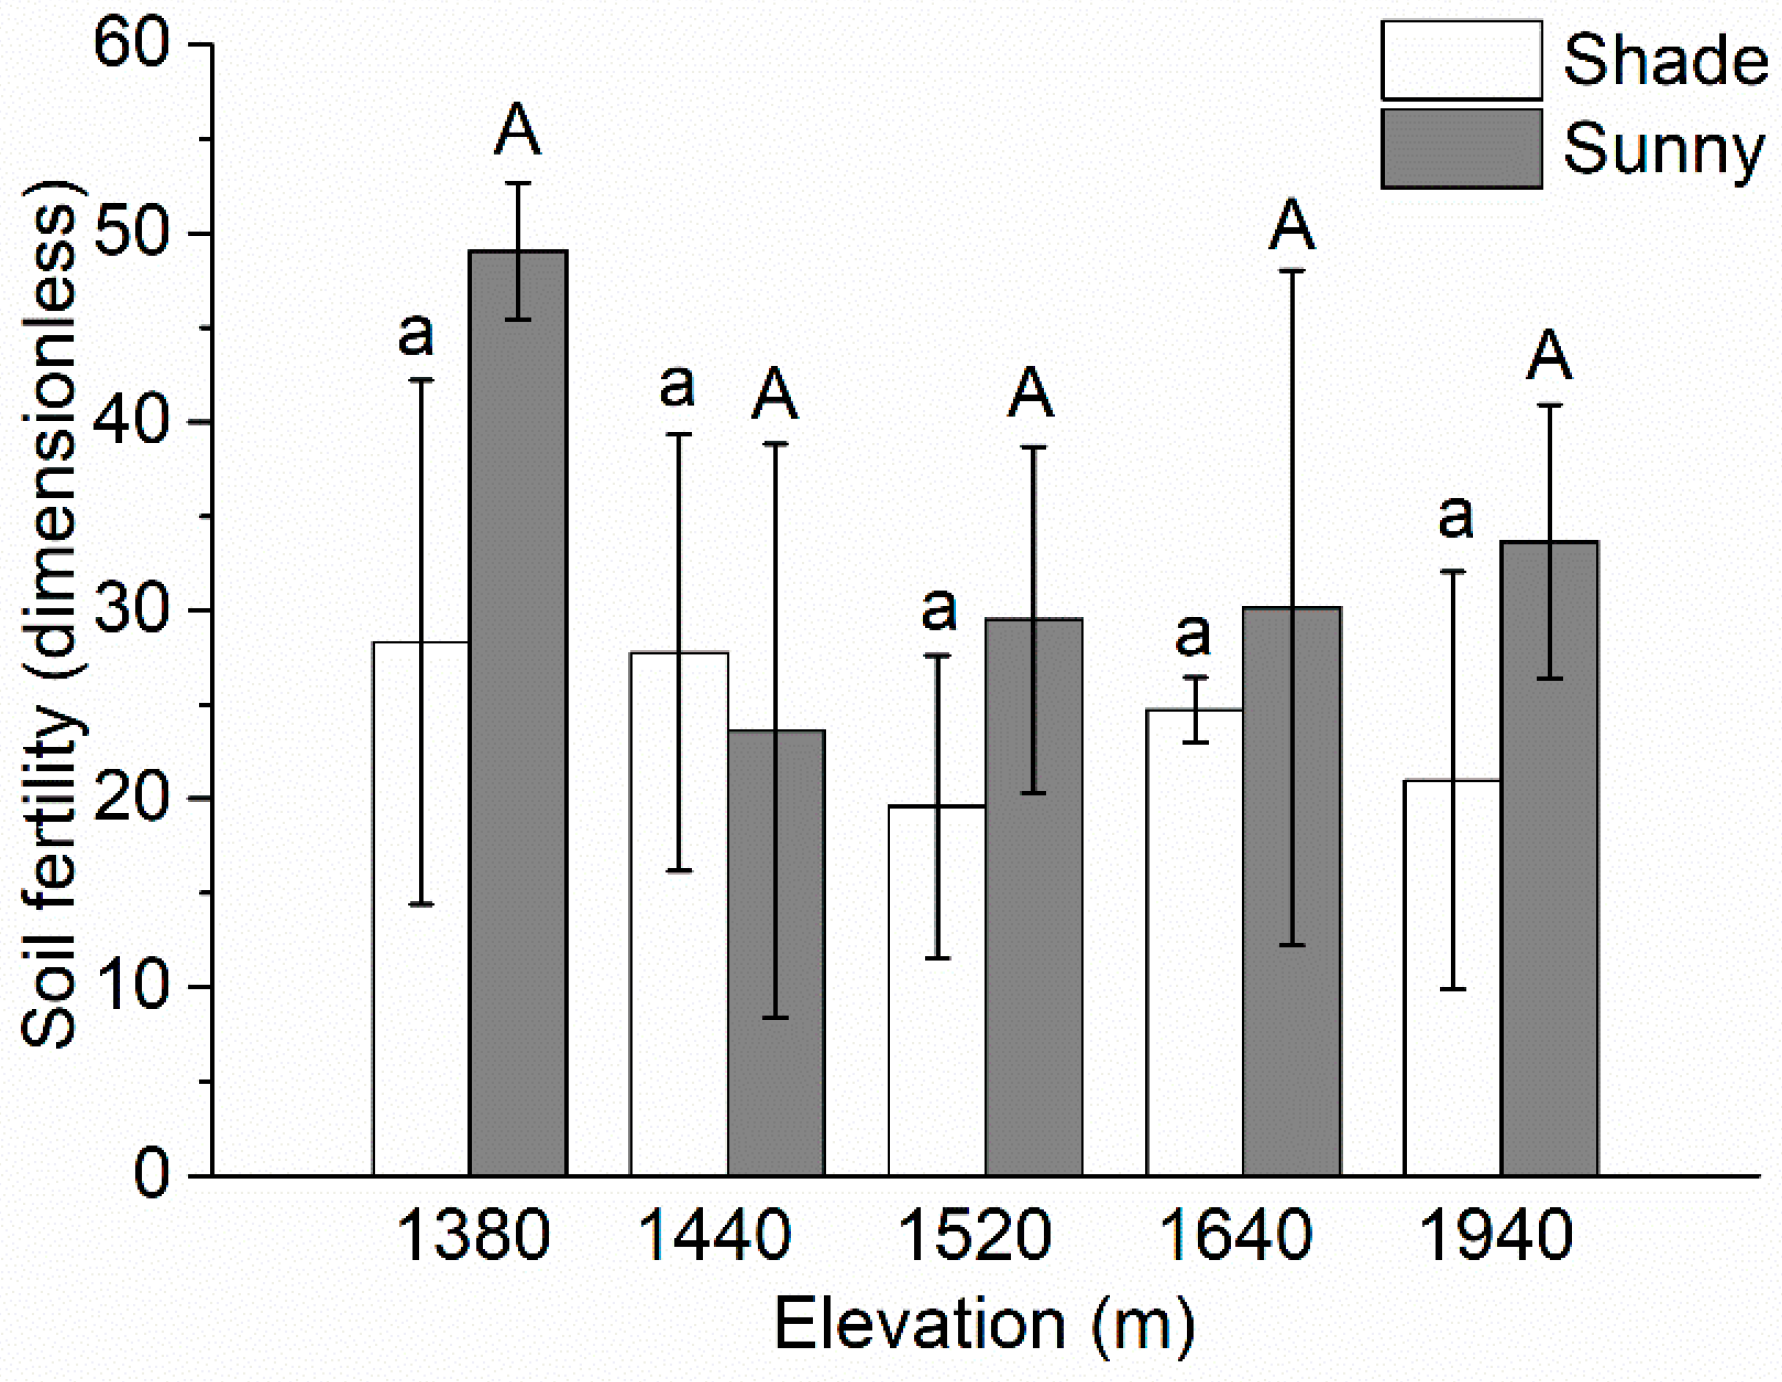
There was no significant difference in soil fertility (based on the holistic index of soil fertility) among the elevations (Figure 3). The soil fertility reached its maximum value (49.07) at the lowest elevation (1380 m) on the sunny slope, and its minimum value (19.57) at 1520 m on the shade slope.
3.2. Changes in Vegetation Biomass as a Function of Elevation and Aspect
Table 1 summarizes the changes in the characteristics of the vegetation as a function of elevation. For D. viscosa, the density and crown width increased with increasing elevation, reaching a significantly higher maximum at 1520 m, then decreased thereafter. Diameter at breast height did not differ significantly among elevations, except for a significant decrease at 1940 m. Height was significantly higher at the two lowest elevations than at the highest elevations. All D. viscosa parameters presented their lowest values at 1940 m. For P. yunnanensis, density increased with increasing elevation, and the differences were generally significant. Diameter at breast height, crown width, and height showed a similar pattern of increase, but with a maximum at 1640 m. Vegetation cover showed an inconsistent pattern, but reached a significantly higher maximum value at 1520 m. The density of the P. yunnanensis increased from 0.1 to 13.0 per 100 m2, and the average diameter, crown width, and height at 1940 increased to approximately 4 to 10 times the values at 1380 m.
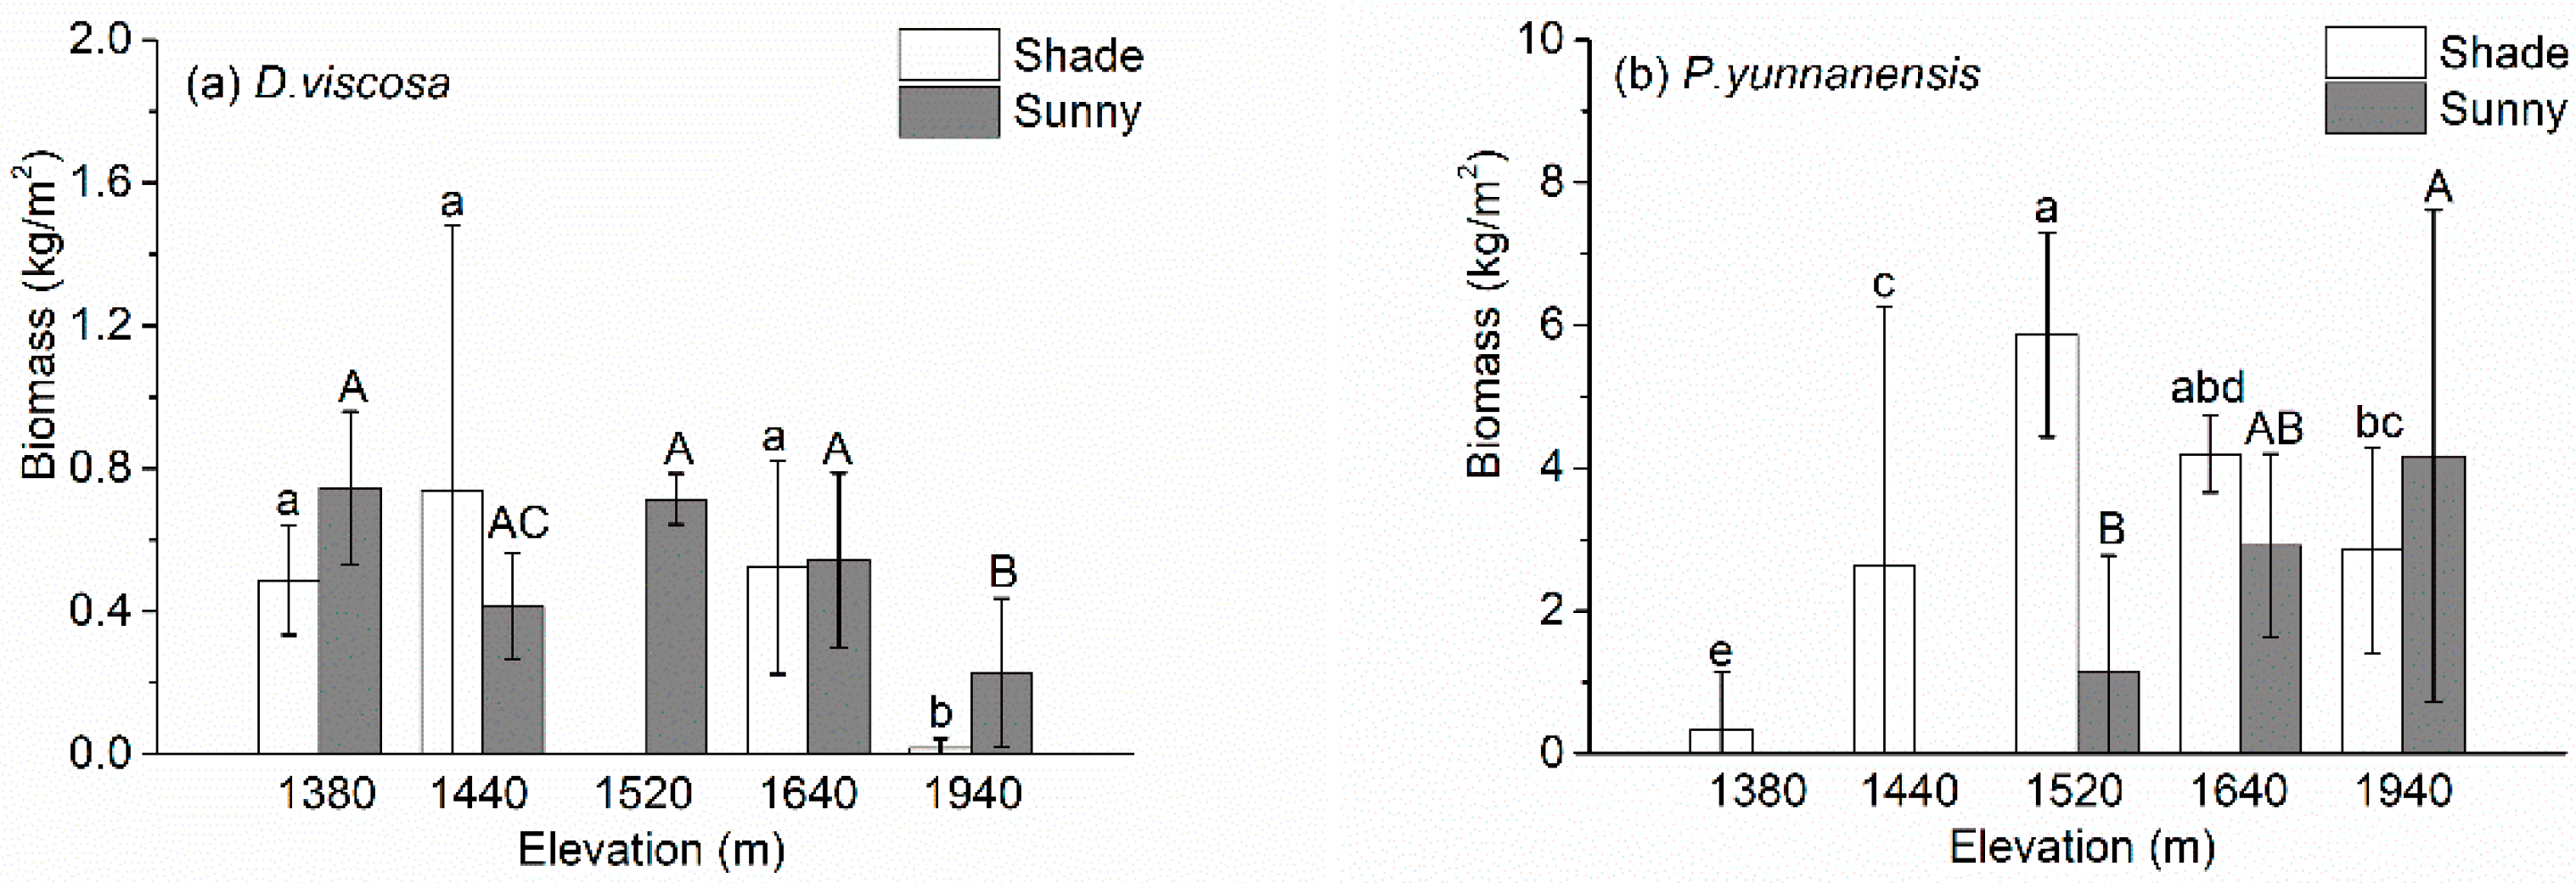
Figure 4 presents the aboveground biomass of the two species. The biomass of D. viscosa first increased, and then decreased with increasing elevation on the shade slopes, with a maximum of 0.74 kg/m2 at 1440 m; by contrast, it decreased with increasing elevation on the sunny slopes, with a maximum value of 0.75 kg/m2 at 1380 m (Figure 4a). The biomass of P. yunnanensis biomass first increased and then decreased with increasing elevation on the shade slope, with a maximum value of 5.87 kg/m2 at 1520 m, but increased with increasing elevation on the sunny slopes after it first appeared at an elevation of 1520 m (Figure 4b).
3.3. Relationship between Vegetation and Environment
We used Pearson’s correlation coefficient (r) to reveal the significant (p < 0.05) relationships between the vegetation and environmental factors (Supplemental Table S2). For D. viscosa, biomass was positively correlated with branches, density, diameter at breast height, height, and hydrolyzable nitrogen, but negatively correlated with elevation and distance of the quadrat from the river. Branches were positively correlated with density. Diameter at breast height was positively correlated with crown width and height, but negatively correlated with elevation, distance of quadrat from the river, and soil moisture. Crown width was positively correlated with height. Height was negatively correlated with elevation, distance of quadrat from the river, and soil moisture. For P. yunnanensis, biomass was positively correlated with density, diameter at breast height, crown width, height, elevation, and distance of the quadrat from the river. Density was positively correlated with height, elevation, distance of the quadrat from the river, soil moisture, and organic matter. Diameter at breast height was positively correlated with crown width, height, and aspects. Crown width was positively correlated with height. Height was positively correlated with elevation, distance of the quadrat from the river, and soil moisture. Vegetation cover was positively correlated with the topographic wetness index.
Among the significant topographic factors, elevation was positively correlated with the distance of the quadrat from the river and soil moisture; and distance of the quadrat from the river was positively correlated with soil moisture and organic matter. Among the significant soil factors, total nitrogen was positively correlated with available nitrogen and soil fertility, and the available nitrogen and phosphorus were both positively correlated with soil fertility.
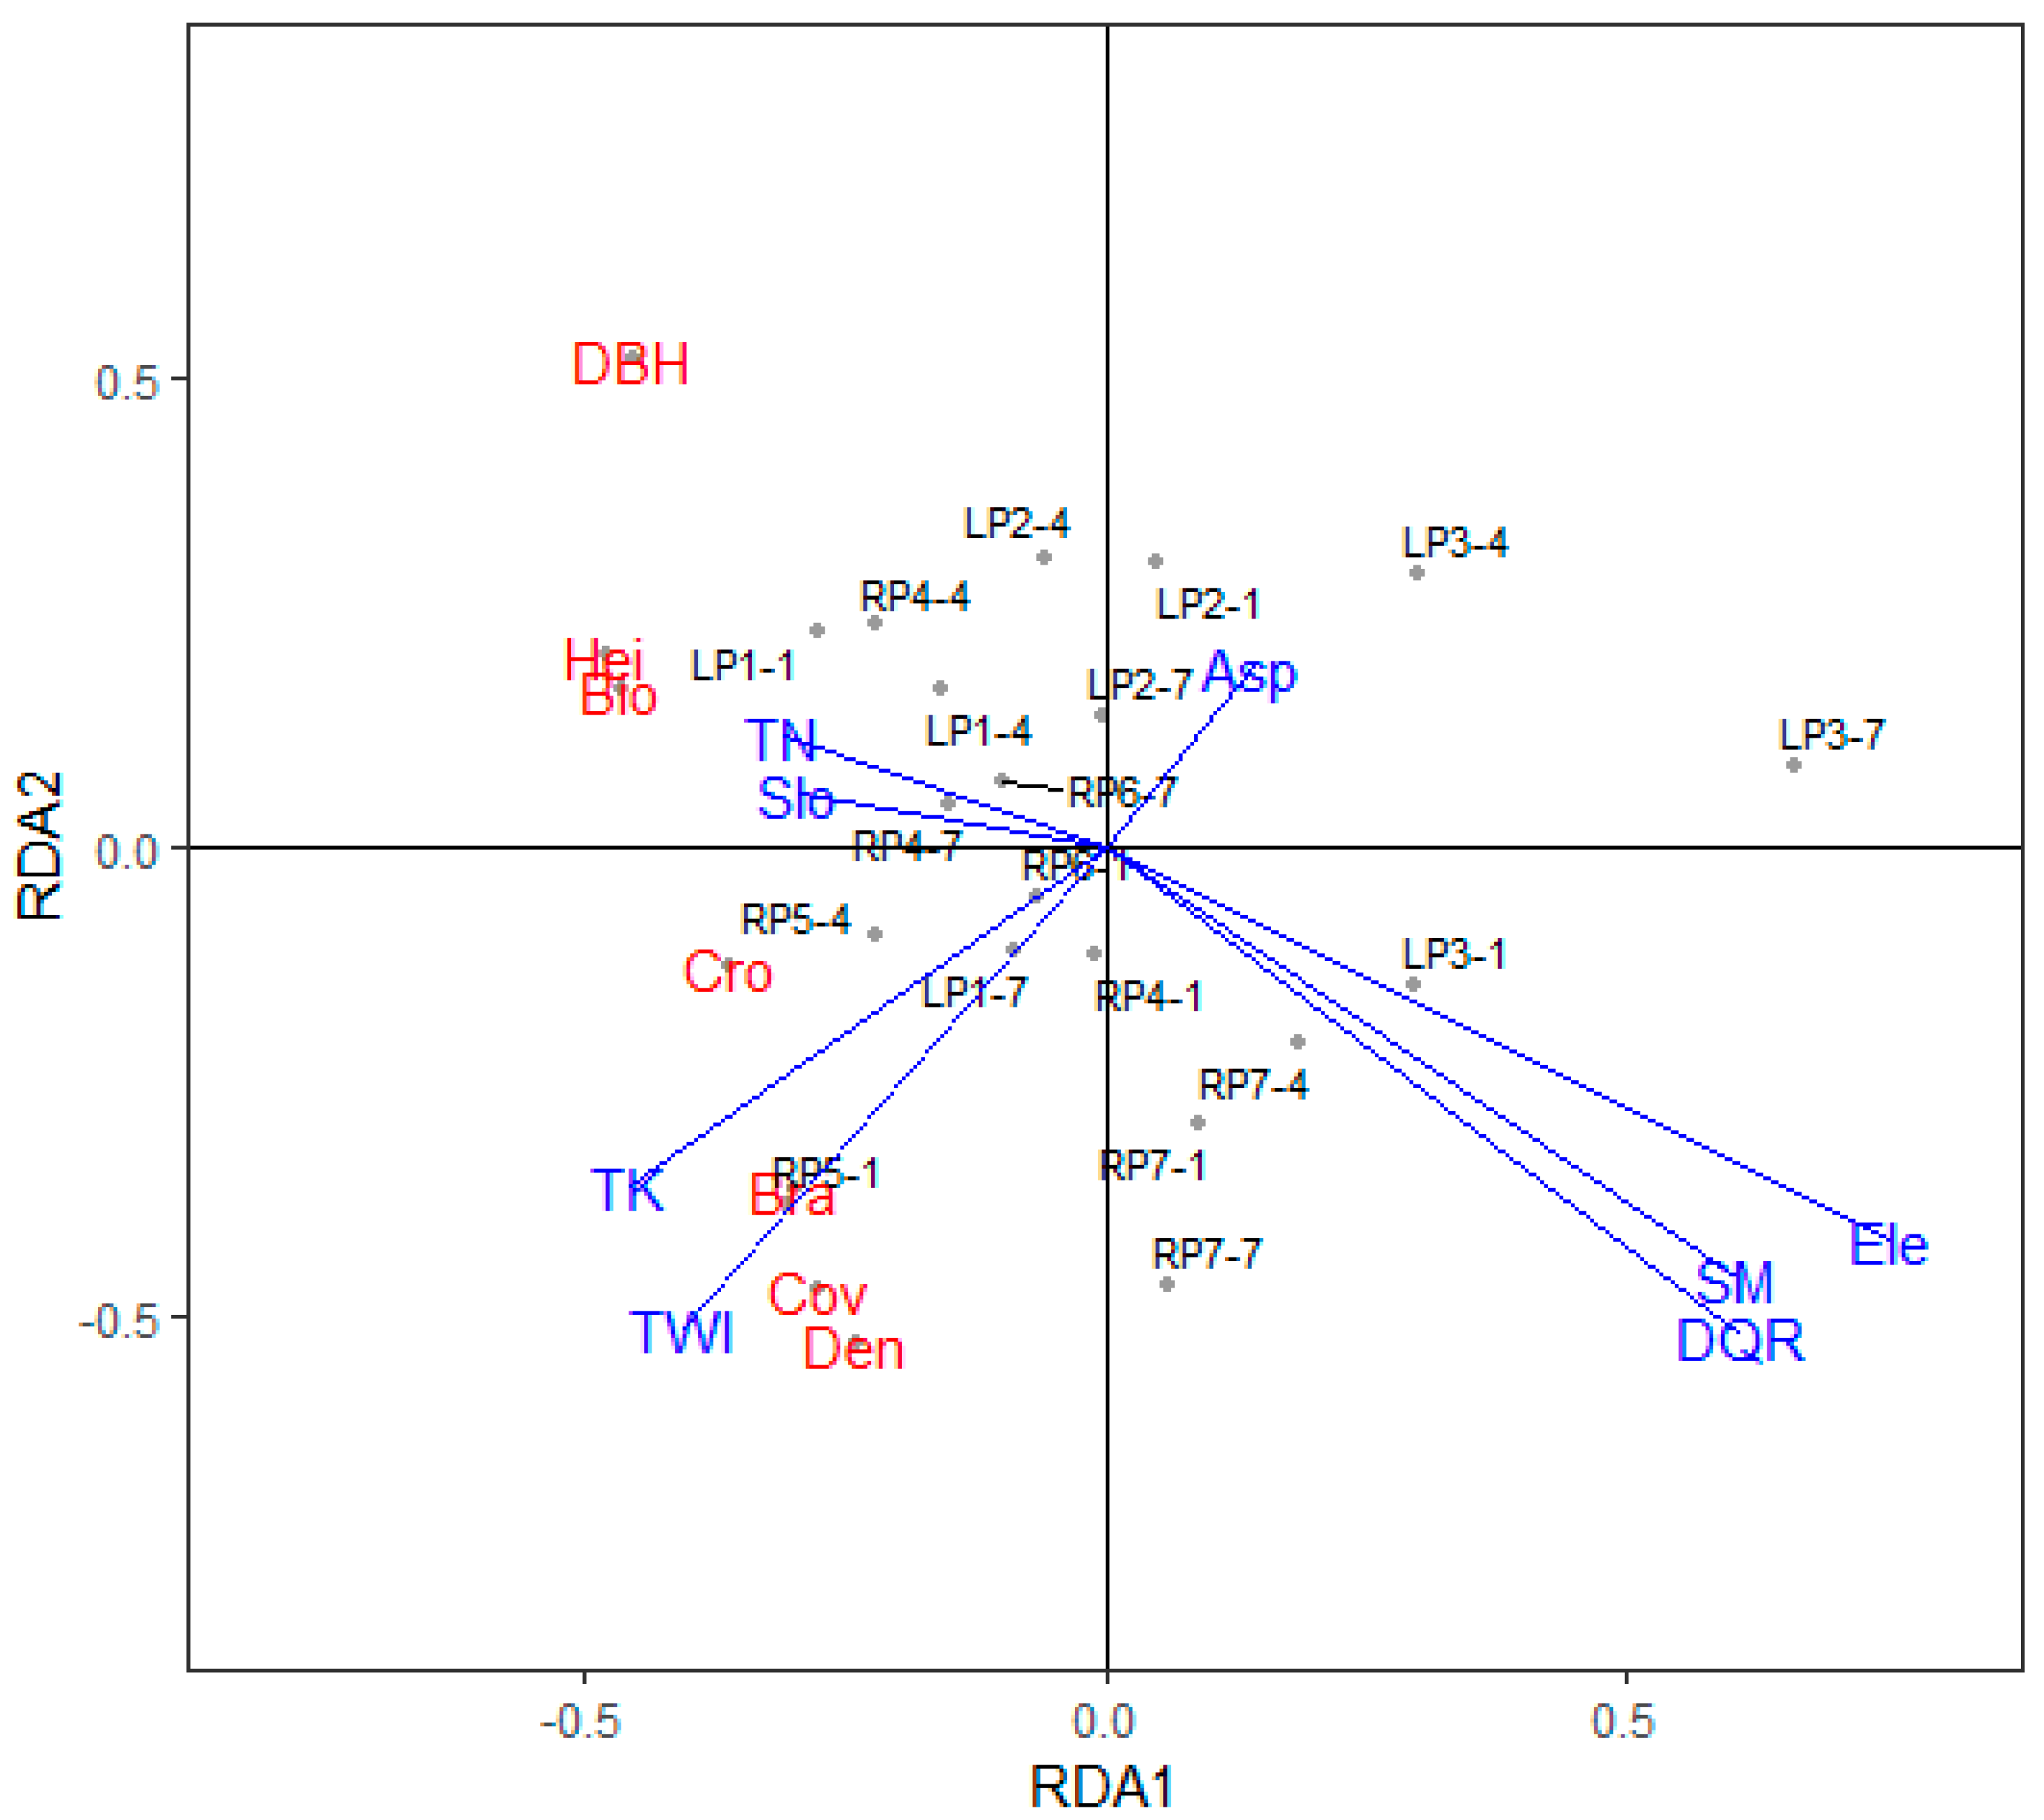
In addition, we used redundancy analysis to clarify the relationships among the soil properties and topographic parameters for the two species. Figure 5 and Figure 6 present the results for D. viscosa and P. yunnanensis, respectively. When the vegetation parameters were used as response variables, and the soil properties and topographic parameters were used as independent variables, RDA analysis (Figure 5) showed that the constrained variables explained 64% of the total variance for D. viscosa along all RDA axes. The distance from quadrats to the river, soil moisture, and elevation were positively correlated and contributed strongly to RDA axis 1; soil moisture was mainly affected by elevation and distance from quadrats to the river, which agrees with the correlation results (Table S2). The biomass, height, crown width, and diameter at breast height were negatively correlated with soil moisture, whereas the slope and total nitrogen were positively correlated with D. viscosa biomass, and the topographic wetness index and total potassium significantly affected the density and vegetation cover of D. viscosa. We divided the environmental variables into two independent variables: soil properties and topographic conditions. The soil properties explained 30% of the total variation of D. viscosa, and topographic conditions explained 51%.
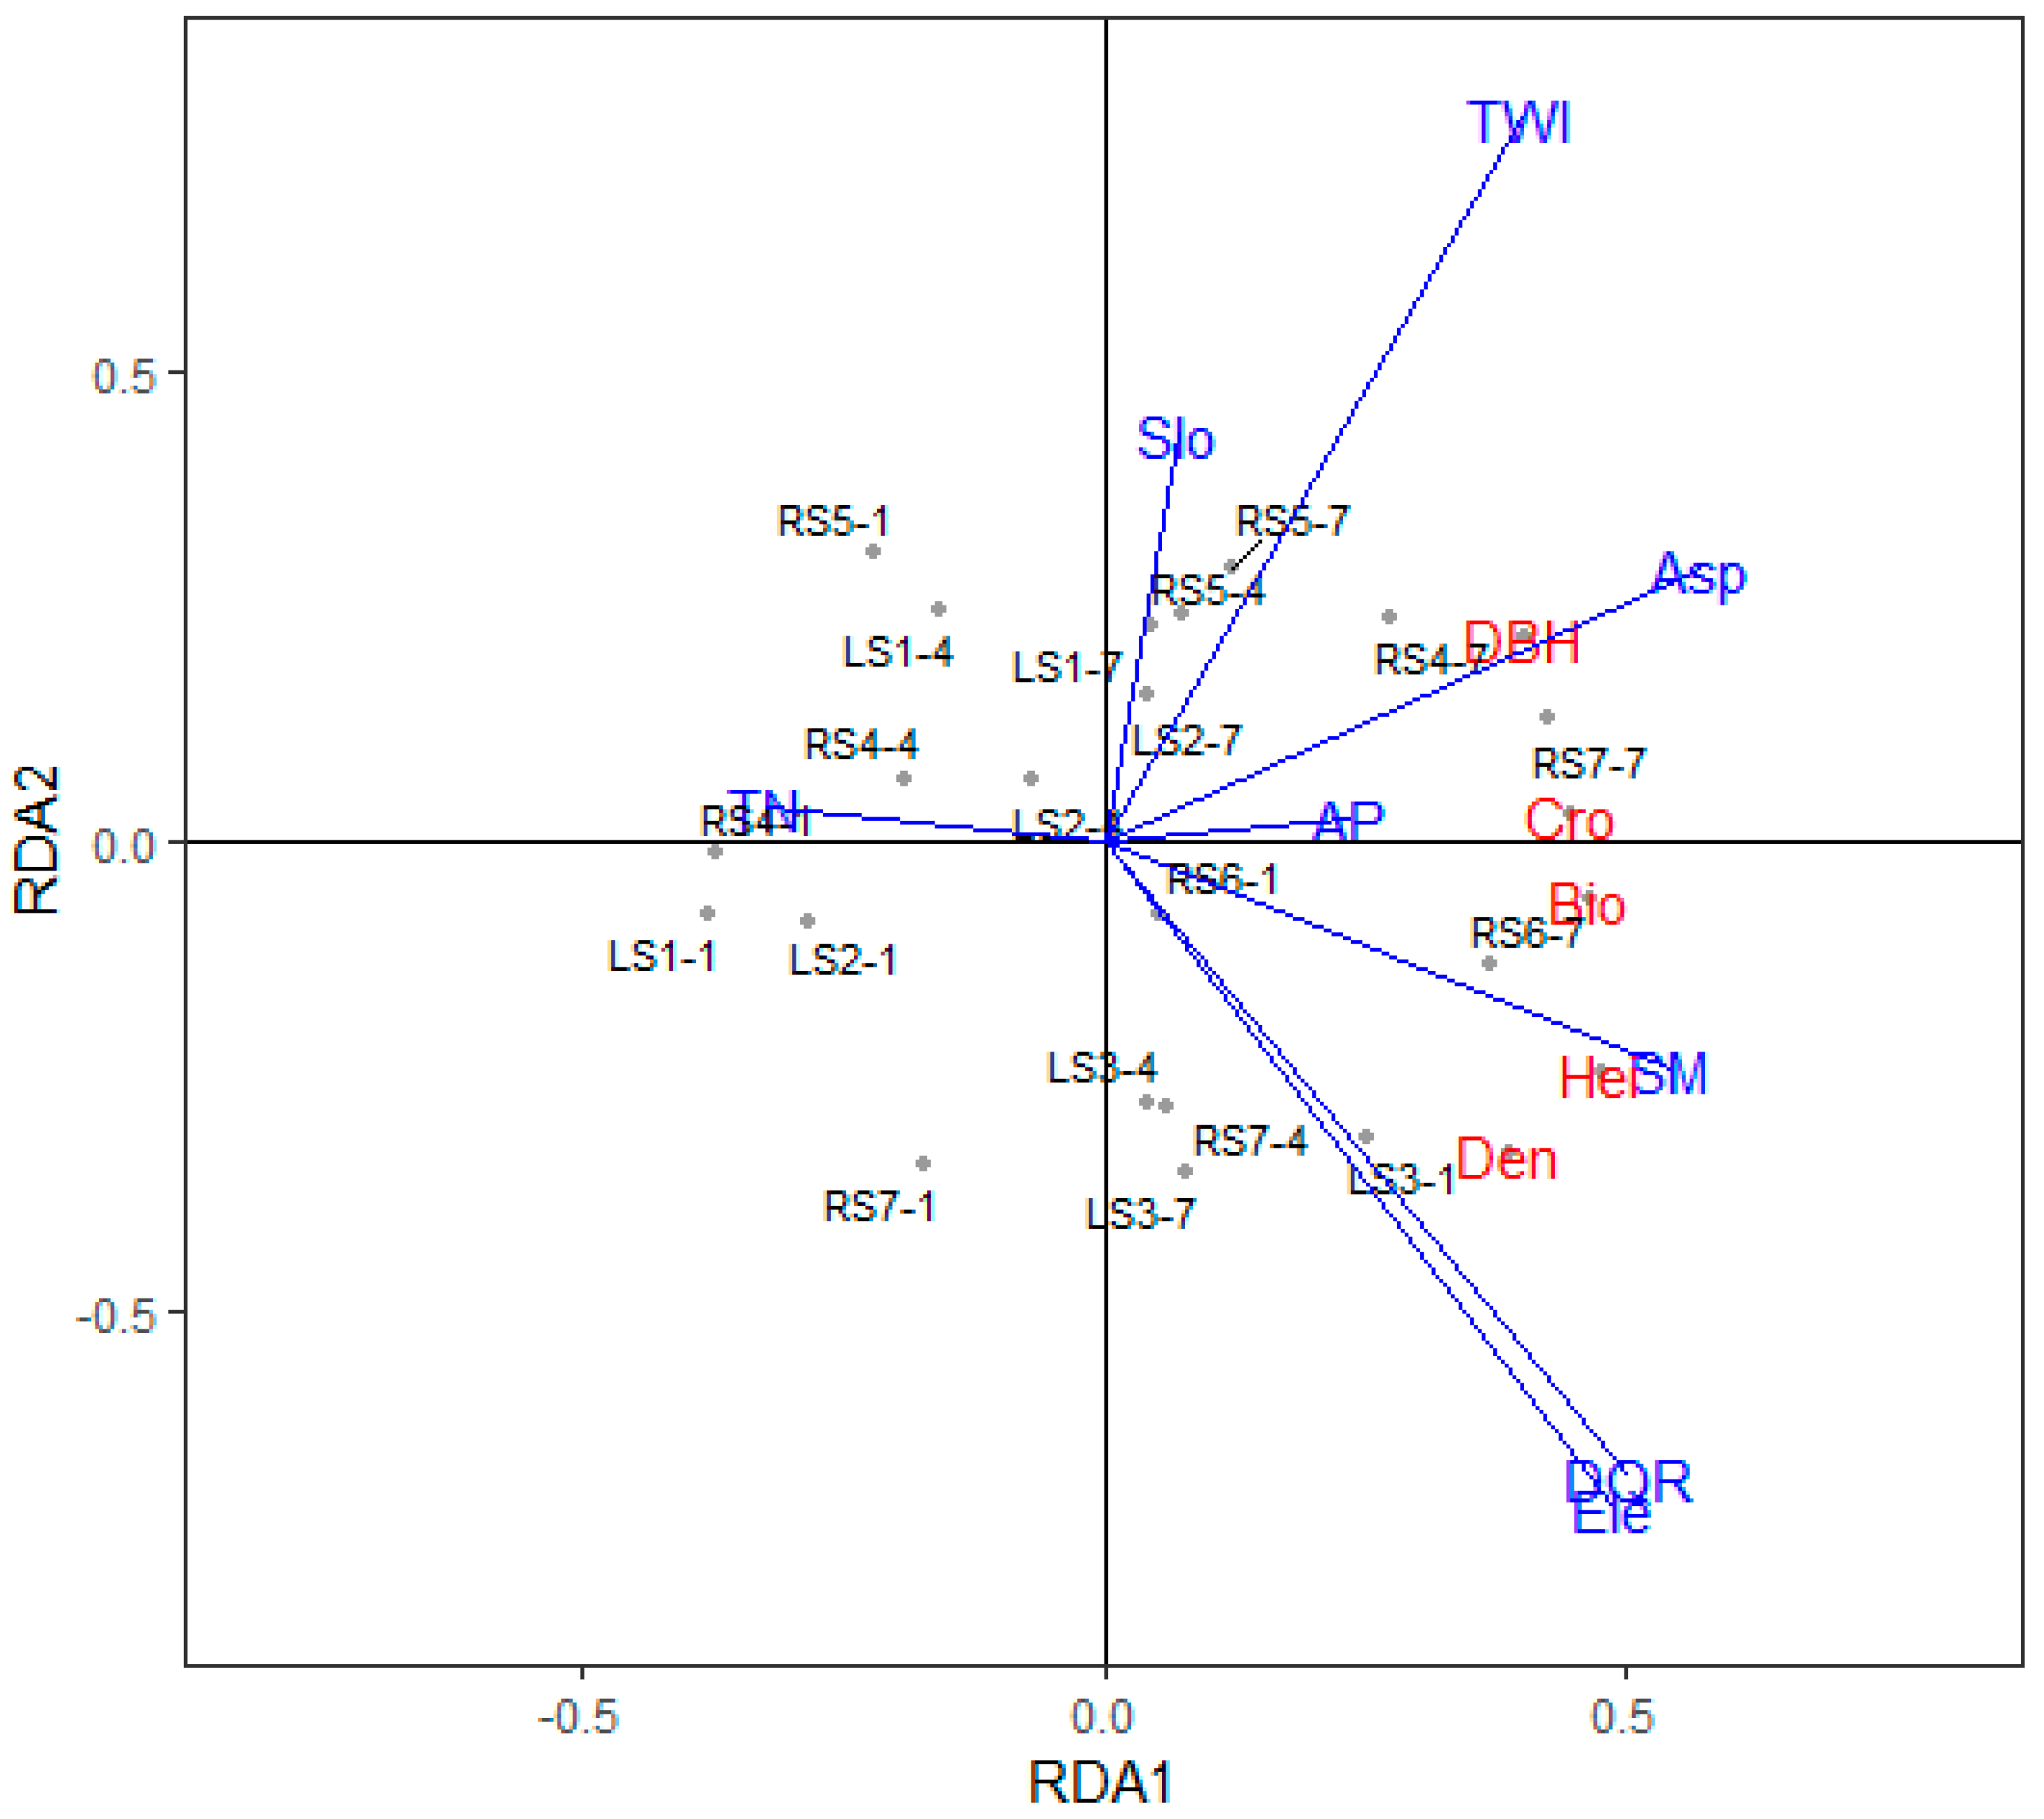
The RDA analysis for P. yunnanensis (Figure 6) showed that the constrained variables explained 69% of the total variance along all RDA axes. The distance from quadrats to the river, soil moisture, and elevation were positively correlated and contributed strongly to the first RDA axis. The vegetation parameters were positively correlated with soil moisture. In addition, the slope aspect and available phosphorus were positively correlated with the biomass of P. yunnanensis, while the total nitrogen was negatively correlated with the vegetation characteristics. The RDA analysis showed that soil properties explained 31% of the variation and topographic variables explained 53%.
4. Discussion
4.1. Effects of Habitat Conditions on Vegetation
The arid-hot valley has fragile habitats because of the highly variable spatial and temporal distribution of precipitation, and barren nutrient conditions. Our results showed large differences in soil moisture between the rainy and dry seasons, between the shade and sunny slopes, and between elevations, which is consistent with previous research results [6,29]. The soil moisture at an elevation (≤1520 m) averaged 0.055, and was below the wilting point of 0.059 for D. viscosa [30], possibly because the continuously intense evaporation during the dry season leads to low soil moisture [31]. Soil moisture was higher at 1380 m than 1440 m, and soil fertility was highest at the lowest elevation (1380 m), probably due to the increased relative humidity near the river. In fact, increased relative humidity and livestock grazing at lower elevations would accelerate the decomposition and accumulation of nutrients in the soil [32]. Our results also show differences in vegetation biomass and morphology along the elevation gradient, though the two species showed different patterns: D. viscosa generally either increased in size and then decreased with increasing elevation, or decreased steadily, whereas P. yunnanensis tended to increase in size with increasing elevation.
It will important to build on the present results to improve our understanding of the key factors that affect the growth, development, and distribution of organisms along the elevation gradient in our study area. The complex and diverse relationships between soil properties and topographic conditions affect the composition and biodiversity of the regional vegetation community [3,33], and provide insights into the characteristics that will make a plant suitable for local vegetation restoration.
Our RDA results suggest that topographic conditions explain more of the vegetation variation than soil properties, especially for elevation. This results from the high mountains and deep valleys in the Jinsha River basin. Rossi et al. [34] showed that topographic conditions, and especially the elevation and slope, could explain local vegetation patterns well in high mountain areas. The significant correlations among the elevation, distance from quadrats to the river, and soil moisture, and their significant effects on the biomass and height of D. viscosa and P. yunnanensis, confirmed that elevation was the dominant factor that affected vegetation growth and distribution in our study area. Elevation is often regarded as a comprehensive physical index that integrates the effects of changes in precipitation, temperature, relative humidity, and other environmental conditions, all of which affect soil properties and vegetation growth. Close relationships among the elevation, soil moisture, and vegetation were also found in China’s Loess Plateau [11]. The topographic wetness index has also been strongly correlated with vegetation cover, indicating that it can reflect the overall growth of the vegetation community through its ability to account for microtopographic water distribution and perhaps salinity redistribution [35]. D. viscosa and P. yunnanensis are widely distributed in our study area, due to their strong tolerance for drought barren soil, so the correlation was weak between vegetation parameters and soil nutrients in our study region.
The decreased precipitation and intense evaporation in the dry season exacerbate the effects of drought stress at low elevations, and led to little or no growth of P. yunnanensis, but sparse growth of D. viscosa on the sunny slopes. The slightly higher soil moisture on the shade slopes could be crucial to help plants survive the drought period, and this may be the main reason for differences in the plant community and ecological landscape in the arid-hot valley [29]. At an elevation of 1640 m, the growth of D. viscosa decreased, whereas P. yunnanensis responded strongly to the obviously increased soil moisture at that elevation, suggesting that the increase of soil moisture, combined with the lower temperature at that elevation, was more beneficial for the growth of P. yunnanensis. Xiong et al. [36] thought that the geotechnical properties of the site, such as infiltration and lithology, determined the soil moisture and vegetation types in arid-hot valley, but thought that elevation was not important. However, the results of our RDA analyses (Figure 5 and Figure 6) showed that elevation and distance from the quadrats to the river provide a comprehensive index that reflects the change of community characteristics, especially for biomass. Thus, understanding the soil moisture conditions at each site will be a key to successful vegetation restoration.
4.2. Restoration Potential of P. yunnanensis and D. viscosa
Different plant types have different adaptation mechanisms that determine how they respond to environmental stress. Under drought stress, D. viscosa decreases its net photosynthetic rate and improves its water-use efficiency [37], whereas P. yunnanensis distributes more photosynthate to root organs and reduces water consumption by stems and leaves [38]. Thus, D. viscosa can still survive when soil moisture is extremely low. However, when the two species coexist under suitable soil moisture levels, P. yunnanensis grows more vigorously, and its shade may limit the growth of D. viscosa, in which the overhead shading lead to the decreasing of D. viscosa biomass and increasing of soil moisture. Based on these different responses, it should be possible to select the most appropriate species according to soil moisture conditions at each site where vegetation restoration will occur. Without performing this analysis, the restoration may fail or achieve poor results, and if the species uses more water than the site can sustainably provide, this may exacerbate soil drought [39,40]. Elevation was negatively correlated with D. viscosa growth, but positively correlated with P. yunnanensis growth, indicating that drought-tolerant D. viscosa should be restored at the lower elevations and on sunny slopes, where drought stress is most likely to be severe. The positive correlation between plant parameters for slopes suggests that a suitable slope is beneficial for the growth of D. viscosa. P. yunnanensis was not sensitive to slope, but its growth was negatively correlated with total nitrogen and positively correlated with available phosphorus. Controlled experiments found that P. yunnanensis seedlings could adapt well to nitrogen stress, but were obviously affected by a phosphorus deficiency [41], but a field investigation showed that nitrogen and phosphorus were positively correlated with the growth characteristics of P. yunnanensis, with the greatest constraint created by low nitrogen [42]. Although response mechanisms may be different, we concluded that soil nutrients is important for P. yunnanensis restoration.
For successful vegetation restoration in the arid-hot valley, we should focus on which factors will most strongly constrain survival and growth; our results and previous research suggest that soil moisture will be critical. D. viscosa is highly resistant to drought stress, and also develops considerable biomass, so it is a promising species for vegetation restoration in arid and rocky sites, such as those in our study area. In addition, it has ornamental and medicinal value [43,44]. Some experiments in arid-hot valley have shown that D. viscosa grows fast, sprouts many tillers, and can restore a degraded site rapidly [45]. However, D. viscosa may be unable to survive drought stress combined with competition from other species and damage caused by grazing, especially at the seedling stage; thus, it requires suitable protection, such as clear weeds, moderate grazing, and increased soil moisture using a water-retaining agent [46], to ensure its survival and growth. P. yunnanensis is also widely distributed in our study area, and has produced an obvious improvement of water yields, thereby reducing soil erosion and improving water storage, which together can improve soil carbon storage [47]. However, it is less able than D. viscosa to withstand drought and poor soil fertility, so the survival and growth of P. yunnanensis plantations could be improved by soil management supplying sufficient nitrogen and phosphorus to mitigate any soil limitations, combined with scientific planting at an appropriate density, which agrees with previous recommendations [19]. In actual vegetation restoration, we must also consider the economic suitability and maintenance needs of the selected resistant plants, which could be considered in our future researches.
Through sampling and analysis, we have improved our understanding of the relationships among vegetation, topographic, and soil properties in the arid-hot valley. In the future, additional work should be carried out to build on our findings. First, we performed our field study only during two typical seasons. Continuous monitoring of surface soil moisture throughout the year, along with changes in plant physiology, such as the degree of water stress, would provide a clearer understanding of its variation and its effects on plants. In addition, we based the relationship between vegetation and environmental conditions mainly on correlations in field data, rather than using controlled experiments that would allow a detailed exploration of the underlying mechanisms. Future research should focus on such experiments to clarify the underlying processes that define the relationships between the vegetation and environmental factors. Finally, it will be necessary to understand the water balance in the study ecosystem based on the relationships among plants, topography, and soil, so that we can choose suitable restoration species for each combination of these conditions, and improve the likelihood of successful restoration.
5. Conclusions
In this study, we surveyed the vegetation parameters, topographic variables, and soil properties in the dry and rainy seasons from 2017 to 2018 in the arid-hot valley in southwestern China, and analyzed the relationships among them by using Pearson’s correlation coefficient and redundancy analysis. Our results suggest that soil moisture was relatively adequate during the rainy season, but that only D. viscosa survived on sunny slopes at lower elevations (≤1520 m) near the end of the dry season because of the low average soil moisture. The lack of large differences in soil fertility among the elevations suggest that soil fertility would have a relatively small influence on vegetation restoration. The biomass of D. viscosa on the shade slopes initially increased with increasing elevation, then decreased again as conditions became unsuitable for the species, but decreased steadily with increasing elevation on the sunny slopes. By contrast, the biomass of P. yunnanensis at low elevations (≤1640 m) was higher on the shade slopes than on the sunny slopes, but it was less at high elevation (1940 m). RDA analysis showed that topographic conditions explained vegetation variation better than soil conditions for both species, but that changes in soil moisture along the elevation gradient at the end of the dry season strongly affected vegetation restoration. Our study provides important scientific support for planning ecological restoration in our study area.
Supplementary Materials
The following are available online at https://www.mdpi.com/2071-1050/10/12/4774/s1, Figure S1: Distribution of temperatures and precipitation for Yongsheng County meteorological station. Variable names: Jan, January; Feb, February; Mar, March; Apr, April; Jun, June; Jul, July; Aug, August; Sep, September; Oct, October; Nov, November; Dec, December, Table S1: Topography conditions and soil nutrient elements of quadrats in study area, Table S2: Correlation analysis (Pearson’s r) for the relationships among the vegetation and environmental factors for Dodonaea viscosa and Pinus yunnanensis. Significance: *, P < 0.05; **, P < 0.01. Bio: Biomass; Den: density; Bra: branches; Cro: crown; Hei: height; Cov: coverage; Asp: aspect slope; Slo: slope; Ele: elevation; DBH: diameter at breast height; DQR: distance from quadrates to river; TWI: topographic wetness index; SM: soil moisture; OM: organic matter; TN: total nitrogen; TK: total potassium; AN: hydrolyzed nitrogen; AP: available phosphorus; SF: soil fertility.
Author Contributions
Conceptualization, W.Y.; Data curation, W.Y.; Formal analysis, W.Y.; Funding acquisition, Y.C.; Investigation, J.P., Y.Y. and X.L.; Methodology, J.P. and X.L.; Project administration, Y.C.; Resources, Y.C.; Software, J.P. and X.L.; Supervision, W.Y.; Validation, Y.Y.; Writing—original draft, J.P.; Writing—review & editing, W.Y. and Y.Y.
Funding
National Key Research and Development Plan of China (No. 2016YFC0502209 and 2017YFC0404505), and the National Natural Science Foundation of China (No. 51579012).
Acknowledgments
We thank the National Key Research and Development Plan of China (No. 2016YFC0502209 and 2017YFC0404505), the Beijing Nova Program (No. Z171100001117080), and the National Natural Science Foundation of China (No. 51579012) for their financial support. We also thank Geoffrey Hart for providing language help during the writing of this paper.
Conflicts of Interest
The authors declare no conflicts of interest.
References
- Jiang, L.G.; Yao, Z.J.; Liu, Z.F.; Wu, S.S.; Wang, R.; Wang, L. Estimation of soil erosion in some sections of Lower Jinsha River based on RUSLE. Nat. Hazards 2015, 76, 1831–1847. [Google Scholar] [CrossRef] [Green Version]
- Ren, F.P.; Zhang, P.C.; Chen, X.P.; Ping, X.; Chen, J. Vegetation spatial heterogeneity of valleys along the Jinsha River and its influence on ecological restoration. J. Yangtze River Sci. Res. Inst. 2016, 33, 24–29. (In Chinese) [Google Scholar]
- Bennie, J.; Hill, M.O.; Baxter, R.; Huntley, B. Influence of slope and aspect on long-term vegetation change in British chalk grasslands. J. Ecol. 2006, 94, 355–368. [Google Scholar] [CrossRef] [Green Version]
- Solon, J.; Degórski, M.; Roo-Zielińska, E. Vegetation response to a topographical-soil gradient. Catena 2007, 71, 309–320. [Google Scholar] [CrossRef]
- Li, C.; Xiao, B.; Wang, Q.H.; Zheng, R.L.; Wu, J.Y. Responses of soil seed bank and vegetation to the increasing intensity of human disturbance in a semi-arid region of northern China. Sustainability 2017, 9, 1837. [Google Scholar] [CrossRef]
- Mu, J.; Li, Z.B.; Li, P.; Xue, S.; Zhen, Y. Study on soil moisture dynamic variation law in dry seasons in dry-hot valley areas. J. Yangtze River Sci. Res. Inst. 2009, 26, 22–25. (In Chinese) [Google Scholar]
- Lang, N.J. Study on the Influencing Factors of Vegetation Restoration in Degraded Ecological System of Dry-Hot Valleys in Yunnan Province of China. Ph.D. Thesis, Beijing Forestry University, Beijing, China, 2005. [Google Scholar]
- Davies, R.G.; Orme, C.D.L.; Storch, D.; Olson, V.A.; Thomas, G.H.; Ross, S.G.; Ding, T.S.; Rasmussen, P.C.; Bennett, P.M.; Owens, I.P. Topography, energy and the global distribution of bird species richness. Proc. R. Soc. B-Biol. Sci. 2007, 274, 1189–1197. [Google Scholar] [CrossRef] [PubMed] [Green Version]
- Måren, I.E.; Karki, S.; Prajapati, C.; Yadav, R.K.; Shrestha, B.B. Facing north or south: Does slope aspect impact forest stand characteristics and soil properties in a semiarid trans-Himalayan valley? J. Arid Environ. 2015, 121, 112–123. [Google Scholar] [CrossRef] [Green Version]
- Poelking, E.L.; Schaefer, C.E.R.; Fernandes Filho, E.I.; De Andrade, A.M.; Spielmann, A.A. Soil-landform-plant-community relationships of a periglacial landscape on Potter Peninsula, maritime Antarctica. Solid Earth 2015, 6, 583–594. [Google Scholar] [CrossRef]
- Hu, X.M.; Cheng, J.M.; Wan, H.E.; Zhao, Y.Y. Reciprocal relationships between topography, soil moisture, and native vegetation patterns in the loess hilly region, China. Acta Ecol. Sin. 2006, 26, 3276–3285. [Google Scholar]
- Stein, A.; Gerstner, K.; Kreft, H. Environmental heterogeneity as a universal driver of species richness across taxa, biomes and spatial scales. Ecol. Lett. 2014, 17, 866–880. [Google Scholar] [CrossRef] [PubMed] [Green Version]
- Song, C.J.; Qu, L.Y.; Tian, Y.S.; Ma, K.M.; Zao, L.X.; Xu, X.L. Impact of multiple soil nutrients on distribution patterns of shrubs in an arid valley, in Southwest China. Pak. J. Bot. 2014, 46, 1621–1629. [Google Scholar]
- Li, K.; Liu, F.Y.; Yang, Z.Y.; Sun, Y.Y. Study status and trends of vegetation restoration of dry-hot valley in Southwest China. World For. Res. 2011, 24, 55–60. (In Chinese) [Google Scholar]
- Wang, C. Research conception of ecological protection and restoration of high dams and large reservoirs construction and hydropower cascade development in southwestern China. Adv. Eng. Sci. 2017, 49, 19–26. (In Chinese) [Google Scholar]
- Kang, H.; Um, M.J.; Park, D. Assessing the habitat suitability of dam reservoirs: A quantitative model and case study of the Hantan River Dam, South Korea. Sustainability 2016, 8, 1117. [Google Scholar] [CrossRef]
- Zhang, B.; Wang, D.; Wang, G.G.; Ma, Q.; Zhang, G.B.; Ji, D.M. Vegetation cover change over the southwest china and its relation to climatic factors. Res. Environ. Yangtze Basin 2015, 24, 956–964. (In Chinese) [Google Scholar]
- Yang, J.D.; Zhang, Z.M.; Shen, Z.H.; Ou, X.K.; Geng, Y.P.; Yang, M.Y. Review of research on the vegetation and environment of dry-hot valleys in Yunnan. Biodivers. Sci. 2016, 24, 462–474. (In Chinese) [Google Scholar] [CrossRef]
- Li, Q. Researches on Eco-Environment Features and Vegetation Restoration Technologies in Dry-Hot Valley of Jinsha River. Master’s Thesis, Xi’an University Technology, Xi’an, China, 2008. (In Chinese). [Google Scholar]
- Huang, D.; Ge, L.; Ma, H.C.; Zhao, G.J.; Yang, J.J. Growth response of Dodonaea viscosa L. to different site factors in the hot regions of Yunnan Province. J. Northeast For. Univ. 2015, 6, 22–24. (In Chinese) [Google Scholar]
- Li, K.; Zeng, J.M. A study on transpiration of some tree species planted in hot and arid valley of Jinsha River. For. Res. 1999, 12, 244–250. (In Chinese) [Google Scholar]
- Deng, X.Q.; Huang, B.L.; Wen, Q.Z.; Hua, C.L.; Tao, J. A research on the distribution of Pinus yunnanensis forest in Yunnan Province. J. Yunnan Univ. (Nat. Sci. Ed.) 2013, 35, 843–848. (In Chinese) [Google Scholar]
- Cai, N.H.; Zhang, R.L.; Chen, S.; Bai, Q.S.; Xu, Y.L. The physiological responses of Pinus yunnanensis to water stress. J. Yunnan Agric. Univ. 2013, 2, 247–250. (In Chinese) [Google Scholar]
- Dai, K.J.; He, F.; Shen, Y.X.; Zhou, W.J.; Li, Y.P.; Tang, L. Advances in the research on Pinus yunnanensis forest. J. Central South For. Univ. 2006, 2, 138–142. (In Chinese) [Google Scholar]
- Litton, C.M.; Boone, K.J. Allometric models for predicting aboveground biomass in two widespread woody plants in Hawaii. Biotropica 2008, 40, 313–320. [Google Scholar] [CrossRef]
- Beets, P.N.; Kimberley, M.O.; Oliver, G.R.; Pearce, S.H. The application of stem analysis methods to estimate carbon sequestration in arboreal shrubs from a single measurement of field plots. Forests 2014, 5, 919–935. [Google Scholar] [CrossRef]
- Zeng, W.S. A review of studies of shrub biomass modeling. World For. Res. 2015, 28, 31–36. (In Chinese) [Google Scholar]
- Huo, C.F.; Lu, X.Y.; Cheng, G.W. Parameter identification and simulation verifying of southwestern forest succession model. J. Northeast For. Univ. 2012, 40, 78–83. (In Chinese) [Google Scholar]
- Jiang, J.M.; Fei, S.M.; Wang, P.; Lei, C.H.; He, X.F. Dynamic comparison of soil water between shady slopes and sunny slopes in the dry-hot valley. J. Sichuan For. Sci. Technol. 2005, 26, 30–35. (In Chinese) [Google Scholar]
- Jiang, J.M.; Fei, S.M.; Li, H.; Lei, C.H. Comparison of drought resistance ability of several main afforestation trees in Panzhihua dry-hot valley. Trans. China Pulp. Paper 2004, 345–348. (In Chinese) [Google Scholar]
- Dong, Y.F.; Xiong, D.H.; Su, Z.A.; Li, J.J.; Yang, D.; Shi, L.T.; Liu, G.C. The distribution of and factors influencing the vegetation in a gully in the dry-hot valley of southwest China. Catena 2014, 116, 60–67. [Google Scholar] [CrossRef]
- Zheng, Y.; Li, Z.B.; Li, P.; Mu, J. Features of land use type on soil properties in the dry-hot valley of Jinsha River. Res. Soil Water Conserv. 2010, 17, 174–177. (In Chinese) [Google Scholar]
- Moeslund, J.E.; Arge, L.; Bøcher, P.K.; Dalgaard, T.; Odgaard, M.V.; Nygaard, B.; Svenning, J.C. Topographically controlled soil moisture is the primary driver of local vegetation patterns across a lowland region. Ecosphere 2013, 4, 1–26. [Google Scholar] [CrossRef]
- Rossi, G.; Ferrarini, A.; Dowgiallo, G.; Carton, A.; Gentili, R.; Tomaselli, M. Detecting complex relations among vegetation, soil and geomorphology. An in-depth method applied to a case study in the Apennines (Italy). Ecol. Complex. 2014, 17, 87–98. [Google Scholar] [CrossRef]
- Wu, D.Q.; Liu, J.; Wang, W.; Ding, W.J.; Wang, R.Q. Multiscale analysis of vegetation index and topographic variables in the Yellow River Delta of China. J. Plant Ecol. 2009, 33, 237–245. (In Chinese) [Google Scholar]
- Xiong, D.H.; Zhou, H.Y.; Yang, Z.; Zhang, X.B. Slope lithologic property, soil moisture condition and revegetation in dry-hot valley of Jinsha River. Chin. Geogr. Sci. 2005, 15, 186–192. (In Chinese) [Google Scholar] [CrossRef]
- Li, J.Y.; Jia, L.Q.; Lang, N.J.; Chen, S.Y.; Wu, L.Y. Characteristics of photosynthesis of Dodonaea viscosa in the dry-hot valley of Jinsha River. J. Beijing For. Univ. 2003, 25, 20–24. (In Chinese) [Google Scholar]
- Duan, X.; Zhao, Y.Y. Growth and biomass of Pinus yunnanensis seedlings under water control. J. Fujian Forest. Sci. Technol. 2015, 4, 87–92. (In Chinese) [Google Scholar]
- Luo, F.F. The Research about Water Environmental Isotope in Yuanmou Dry-Hot Valleys. Master’s Thesis, Yunnan University, Kunming, China, 2012. (In Chinese). [Google Scholar]
- Yu, W.J.; Jiao, J.Y. Sustainability of abandoned slopes in the hill and gully Loess Plateau region considering deep soil water. Sustainability 2018, 10, 1–14. [Google Scholar] [CrossRef]
- Li, D.; Fu, Y.P.; Yang, W.Q.; Wu, T.; Xu, L. Effects of different nitrogen and phosphorus levels on the photosynthetic physiology and biomass of Pinus yunnanensis seedlings. J. Anhui Agric. Sci. 2010, 38, 3217–3219. (In Chinese) [Google Scholar]
- Yang, W.Y. Community structure and natural regeneration of natural Yunnan pine forest in meddle Yunnan, China. Ph.D. Thesis, Chinese Academy of Forestry, Beijing, China, 2010. (In Chinese). [Google Scholar]
- Benítez-Rodríguez, L.; Gamboa-deBuen, A.; Sánchez-Coronado, M.; Alvarado-López, S.; Soriano, D.; Méndez, I.; Vázquez-Santana, S.; Carabias-Lillo, J.; Mendoza, A.; Orozco-Segovia, A. Effects of seed burial on germination, protein mobilisation and seedling survival in Dodonaea viscosa. Plant Biol. 2014, 16, 732–739. [Google Scholar] [CrossRef] [PubMed]
- Shanmugavasan, A.; Ramachandran, T. Investigation of the extraction process and phytochemical composition of preparations of Dodonaea viscosa (L.) Jacq. J. Ethnopharmacol. 2011, 137, 1172–1176. [Google Scholar] [CrossRef]
- Zhang, Q.; Liu, L.W.; Li, J.Q.; Wang, C.H. Characteristics of Dodonaea viscosa population regenerated in abandoned cropland of Yunnan dry-hot valleys, Southwest China. J. Agric. Sci. 2016, 29, 2234–2238. (In Chinese) [Google Scholar]
- Mu, J.; Li, Z.B.; Li, P.; Yu, G.Q.; Zhang, X.X. Applied Effect of Water Retaining Agent upon Vegetation Restoration of Abandoned Dreg Site of Hydropower Station in the Dry-Hot Valley Areas. J. Xian Univ. Technol. 2009, 25, 151–155. (In Chinese) [Google Scholar]
- Wu, J.X.; Chen, Q.B.; Wang, K.Q.; Zhao, Y.Y.; Tong, Z.L. Soil and water conservation benefits and their impacts on soil organic carbon of different vegetation in Central Yunnan Plateau. J. Northwest A F Univ. 2015, 4, 141–148. (In Chinese) [Google Scholar]
Figure 1.
Map of the study region: (a) location of Yunnan Province; (b) location of the Jinsha River in Yunnan Province; (c) map of the reservoir of the Longkaikou Hydropower Station and sample bands; (d) and (e) locations of the sampling sites; and (f) an example of the location of the quadrats at a sampling site.

Figure 2.
Changes in soil moisture (a) along the elevation gradient for shade and sunny sites and (b) between seasons at each elevation. Values are mean ± SD. Note that the values on the y-axis differ greatly between the two graphs. Values labeled with different lowercase letters differ significantly (LSD, p < 0.05) between elevations for a given site category (sunny and rainy); values labeled with the same capital letters did not differ significantly between elevations for a given site category (shade and dry).

Figure 3.
Changes in soil fertility (based on the holistic index of soil fertility; Equation (1)) with increasing elevation for the aspects. Values are mean ± SD. Values labeled with same lowercase letters differ not significantly (LSD, p >0.05) between elevations for the shade slope; values labeled with the same capital letters did not differ significantly between elevations on the sunny slope.

Figure 4.
Changes in the aboveground biomass of (a) D. viscosa and (b) P. yunnanensis as a function of elevation. Values are mean ± SD. Note that the values on the y-axis differ greatly between the two graphs. Values labeled with different lowercase letters differ significantly (LSD, p < 0.05) between elevations for a given site category (shade slope); values labeled with same capital letters did not differ significantly between elevations for the sunny slope).

Figure 5.
Results of the redundancy analysis for the relationships between the vegetation parameters for D. viscosa, soil properties, and topographic conditions. Variable names: AP, available phosphorus; Bio, aboveground biomass; Bra, branches; Cov, vegetation cover; Cro, crown width; DBH, diameter at breast height; Den, plant density; DQR, distance from quadrats to the river; Ele, elevation; Hei, height; HN, hydrolyzable nitrogen; ASP, aspect; OM, soil organic matter; Slo, slope; SM, soil moisture; TK, total potassium; TN, total nitrogen; TWI, topographic wetness index.

Figure 6.
Results of the redundancy analysis for the relationships between the vegetation parameters for P. yunnanensis and the soil properties and topographic conditions (the abbreviations in Figure 6 was the same as them in Figure 5).


Table 1.
Vegetation survey data for the two species along an elevation gradient in the study area. Values are mean ± SD. For a given parameter and species, values labeled with different letters differed significantly between elevations (LSD, p < 0.05).
Table 1.
Vegetation survey data for the two species along an elevation gradient in the study area. Values are mean ± SD. For a given parameter and species, values labeled with different letters differed significantly between elevations (LSD, p < 0.05).
| Species | Elevation (m asl) | Density (n./m2) | Diameter at Breast Height a (cm) | Crown Width (cm) | Height (cm) | Vegetation Cover (%) |
|---|---|---|---|---|---|---|
| Dodonaea viscosa | 1380 | 5.0 ± 2 b | 2.44 ± 1.16 a | 96 ± 32.97 a | 179 ± 24.55 a | 46 ± 27.25 ac |
| 1440 | 5.0 ± 3.43 b | 2.47 ± 1.34 a | 100 ± 41.82 a | 183 ± 53.20 a | 33 ± 10.17 b | |
| 1520 | 12.0 ± 6.27 a | 2.31 ± 0.50 a | 103 ± 20.88 a | 151 ± 29.74 ab | 58 ± 20.17 a | |
| 1640 | 7.0 ± 2.10 b | 1.61 ± 0.56 ab | 95 ± 34.82 a | 142 ± 16.93 ab | 40 ± 10.95 ab | |
| 1940 | 4.0 ± 4.57 b | 0.75 ± 0.54 b | 60 ± 62.57 a | 95 ± 56.72 b | 31 ± 18.03 d | |
| Pinus Yunnanensis | 1380 | 0.1 ± 0.33 D | 2.62 ± 7.86 A | 39 ± 116.67 D | 78 ± 233.33 D | 46 ± 27.25 AB |
| 1440 | 1.0 ± 1.39 D | 10.21 ± 13.66 A | 180 ± 233.67 B | 309 ± 372.03 CD | 33 ± 10.17 C | |
| 1520 | 3.0 ± 2.97 BD | 11.19 ± 9.50 A | 278 ± 248.72 AC | 481 ± 403.50 BC | 66 ± 21.78 A | |
| 1640 | 11.0 ± 5.39 AC | 11.47 ± 3.35 A | 400 ± 57.01 A | 875 ± 183.71 A | 40 ± 10.95 B | |
| 1940 | 13.0 ± 8.56 A | 10.88 ± 3.65 A | 287 ± 102.44 A | 821 ± 350.34 AB | 31 ± 18.03 C |
a Cumulative diameter of all stems for D. viscosa. Values labeled with same lowercase letters differ not significantly (LSD, p > 0.05) between elevations for D. viscosa; values labeled with the same capital letters did not differ significantly between elevations for P. yunnanensis.
© 2018 by the authors. Licensee MDPI, Basel, Switzerland. This article is an open access article distributed under the terms and conditions of the Creative Commons Attribution (CC BY) license (http://creativecommons.org/licenses/by/4.0/).
Share and Cite
MDPI and ACS Style
Pei, J.; Yang, W.; Cai, Y.; Yi, Y.; Li, X. Relationship between Vegetation and Environment in an Arid-Hot Valley in Southwestern China. Sustainability 2018, 10, 4774. https://doi.org/10.3390/su10124774
AMA Style
Pei J, Yang W, Cai Y, Yi Y, Li X. Relationship between Vegetation and Environment in an Arid-Hot Valley in Southwestern China. Sustainability. 2018; 10(12):4774. https://doi.org/10.3390/su10124774
Chicago/Turabian StylePei, Jun, Wei Yang, Yangpeng Cai, Yujun Yi, and Xiaoxiao Li. 2018. "Relationship between Vegetation and Environment in an Arid-Hot Valley in Southwestern China" Sustainability 10, no. 12: 4774. https://doi.org/10.3390/su10124774
Note that from the first issue of 2016, this journal uses article numbers instead of page numbers. See further details here.