Article

The Variation of the Soil Bacterial and Fungal Community Is Linked to Land Use Types in Northeast China

1
Key Laboratory of Ground Water Resource and Environment, Ministry of Education, Jilin University, Changchun 130021, China
2
College of New Energy and Environment, Jilin University, Changchun 130021, China
3
State Key Laboratory of Environmental Aquatic Chemistry, Research Center for Eco-Environmental Sciences, Chinese Academy of Sciences, Beijing 100085, China
*
Author to whom correspondence should be addressed.
Sustainability 2019, 11(12), 3286; https://doi.org/10.3390/su11123286
Submission received: 29 March 2019 / Revised: 26 May 2019 / Accepted: 8 June 2019 / Published: 14 June 2019

Abstract

:
From the west to the east across Northeast China, there are three major land use types, ranging from agricultural-pastoral interlaced land, crop land, and forest land. The soil microbial community of each land use type has been reported; however, a thorough comparison of the soil microbial ecology of soils from each land use type has not been made. In the current study, soil samples from agricultural-pastoral land, crop land, and an artificial economic forest were collected from Tongliao, Siping, and Yanji, respectively. The structure and composition of bacterial and fungal communities was investigated by a next generation sequencing protocol, and soil physicochemical properties were also determined. Pair-wise analysis showed some soil parameters were significantly different between agricultural-pastoral land and crop land or forest land, while those soil parameters shared more similarities in crop land and forest land soils. Principal coordinates analysis and dissimilarity analyses jointly indicated that bacterial and fungal communities from each sampling site were quite different. Canonical correspondence analysis and a partial Mantel test showed that the community structures of bacteria and fungi were mainly affected by clay, pH, water soluble organic carbon (WSOC), and total soluble nitrogen (TN). Co-occurrence network analysis and the associated topological features revealed that the network of the bacterial community was more complex than that of the fungal community. Clay, pH, WSOC, and NH4+-N were major drivers and pH and WSOC were major factors in shaping the network of the bacterial community and the fungal community, respectively. In brief, our results indicated that microbial diversity, co-occurrence network patterns, and their shaping factors differed greatly among soils of distinct land use types in Northeast China. Our data also provided insights into the sustainable use of soils under different land use types.

1. Introduction

Soil bacteria and fungi have played crucial roles in soil nutrient biogeochemical cycling and functioning [1,2]. Depending on land use types or management strategies, microbial community composition and structures may vary greatly [3,4]. From the west to the east, there are three major land use types in Northeast China, ranging from agricultural-pastoral interlaced land, crop land (mainly black soils), and forest land (mainly artificial forest land). The land belonging to the above mentioned land use types covers more than 90% of all land in Northeast China; thus, it would be interesting to characterize and compare both soil properties and the microbial community structure and composition of those soils in order to evaluate their soil quality and soil health, aiming toward a sustainable use of soils under different land use types. Previous studies investigated the microbial community in crop land soils and forest soils [5,6], and the results showed that the bacterial diversity of forest soil was rich in some bacterial phyla, while crop land soils were dominated by other groups of bacteria. It also showed that the use of chemical fertilizers on crop land soils may result in great distinctions of soil properties and nutrient balance which may in turn influence diversity and the functioning of microorganisms [7,8,9]. However, few studies have been conducted with the aim of revealing the differences in bacteria and fungi communities in all of the three land use types in Northeast China.
Previous studies claimed that microbial composition and diversity vary more strongly with regard to soil physicochemical factors rather than the historical factor of geographic distance [6,10]. The influence exerted on the bacterial and fungal community by soil factors is never supposed to be the same. For instance, bacteria were positively associated with the soil pH, salinity, and other soil properties [3,11,12,13] while fungi were mainly influenced more by the soil total organic carbon [14,15]. The relative abundance of the microbial community assembly process may determine their structures [16], and microbial networks may reveal the complexity and stability of the community organization [17,18,19]. However, few studies have compared the network profiles of bacteria with those of fungi in the same soils.
Traditionally, methods such as polymerase chain reaction-based techniques, including PCR-denaturing gradient gel electrophoresis and PCR-terminal restriction fragment length polymorphism analyses [2,20], have been unable to analyze microbes with relatively lower abundance (<0.1%). High-throughput amplicon sequencing was developed to explore fungal and bacterial community compositions and structures in broad and fine scales [5,21,22]. In this study, we investigated the microbial community structures in 20 soils from three typical land types in Northeast China using the Illumina sequencing technique. The objectives of this research were (1) to compare the soil properties and microbial communities in soils from three land use types, and (2) to examine which soil factors were important in shaping bacterial and fungal community structures.

2. Material and Methods

2.1. Soil Sampling and Characterization

A total of 20 samples were collected from three areas in Northeast China at the beginning of May, in 2017. Specifically, eight samples were collected from agricultural-pastoral interlaced land in Tongliao (TL), six samples were collected from the crop land in Siping (SP), and six samples were collected from the artificial economic forest in Yanji (YJ). Each sample was a mixture of three to five soil cores (0–20 cm) within an area of 25 m2 and transported to the lab on ice. The collected samples were mixed and sieved through a 2 mm sieve to remove the roots, stones, and plant residues. A portion of each sample was stored at −80 °C until soil DNA extraction, and the rest were air-dried, bagged, and archived at 4 °C in the dark for further characterization. Soil pH was determined with a pH meter (soil-to-water ratio, 1:2.5). Water soluble NH4+-N (mg/kg) and NO3-N (mg/kg) and water soluble total nitrogen (TN) were determined using a UV–Vis spectrophotometer (MapData, Shanghai, China) after water extraction (soil-to-water ratio, 1:2). Soil water soluble organic carbon (WSOC, mg/kg) was extracted by Milli-Q water and measured using dichromate oxidation (Mebius 1960). The chloroform–fumigation–extraction method was used to determine the soil microbial biomass carbon (MBC, mg/kg) [23].

2.2. Soil DNA Extraction, Illumina Sequencing, and Data Analysis

Soil DNA was extracted from the soil samples following the manufacturer’s instructions. The quality of DNA was assayed by running an aliquot of soil DNA on a 1.0% agarose gel, while NanoDrop was used to determine the quantity of DNA. The extracted DNA was dissolved in a TE buffer (10 mM Tri-HCl, 1 mM EDTA, pH 8.0) and stored under −20 °C for further analysis.
A portion of the extracted DNA from each sample served as a template for amplification using a TruSeq Nano DNA LT Library Prep Kit. According to the bacterial 16S rDNA amplicon library construction, primers 338 (5′-ACTCCTACGGGAGGCAGCA) and 806R (5′-GGACTACHVGGGTWTCTAAT) were used for amplifying hypervariable regions V3 and V4. In terms of fungi, ITS1 was amplified with primers ITS5F (5′-GGAAGTAAAAGTCGTAACAAGG) and ITS1R (5′-GCTGCGTTCTTCATCGATGC). PCR reactions were performed in a 25 μL mixture. The amplification was accomplished as follows: 98 °C for 2 min, followed by 25–30 cycles of 98 °C for 15 s, annealing at 55 °C for 30 s, 72 °C for 30 s, and a final extension at 72 °C for 5 min. Each sample was amplified in triplicate, and gel electrophoresis was used to confirm qualified PCR products. High-throughput sequencing was conducted on an Illumina Hiseq 2000 platform at Shanghai Personal Biotechnology Co., Ltd. (Shanghai, China).
Trimmomatic was first performed to separate clean reads from low quality reads, and then to obtain the raw contigs from the paired-aligning paired-end (PE) reads using the dist.seqs function in Mothur [24]. After cutting off the barcode and primer sequences, clean contigs were separated into different samples by QIIME. Considering the errors described in previous studies, only the following sequences were adapted: Sequence length > 200 bps in length, without ambiguous bases and with at least an 80% match to the reference 16S rDNA database (RDP Gold database). At the 97% similarity level, sequences were clustered into operational taxonomic units (OTUS) using UCLUST. The Greengenes Database (http://greengenes.secondgenome.com/) [25] was used to determine the 16S rDNA gene sequence for bacteria, while the UNITE Database (https://unite.ut.ee/) [26] was used for the internal transcribed space (ITS) sequence of fungi. Given that diversity and richness estimators tend to suffer from sample size bias, we randomly selected 9000 samples from each library for subsequent community analysis, including principal coordinates analysis (PCoA), canonical correspondence analysis (CCA), dissimilarity analysis, and partial Mantel tests.

2.3. Statistical Analysis

Dissimilarity analyses based on the Bray–Curtis distance of community structures in soils from three different land use types were calculated by a Pearson correlation with SPSS 19 (IBM, Armonk, NY, USA). Principal coordinates analysis (PCoA), canonical correspondence analysis (CCA) [27], and Partial Mantel tests were all performed using R package v3.3.2. Differences of soil properties were portrayed by OriginPro 9.0 (OriginLab, Northampton, MA, USA). The linear discriminant analysis (LDA) effect size (LEfSe) method (http://huttenhower.sph.harvard.edu/lefse) was performed to identify features with significant differences among three sites by biomarkers and to evaluate the effect size of each feature [28]. A threshold of 3.5 and a significant α of 0.5 were chosen.

2.4. Network Construction and Statistical Analysis

Molecular Ecological Network Analysis (MENA) (http://ieg2.ou.edu/MENA) was conducted to model, analyze, and manage the microbial networks based on 16S rDNA sequencing data. This method is remarkable in that it uses random matrix theory to determine the suitable similarity threshold automatically, and it is robust to noise. The process can be divided into two phases. The first one mainly includes data collection and standardization, similarity matrix calculation, and the adjacency matrix determination using the random matrix theory (RMT) based approach. The second one is network analysis such as topology characterization or module detection [29]. The network analysis has been widely applied in environmental ecology [17], as well as in environmental management [30], to visualize the role and influence of network members.
Specifically, merely operational taxonomic units (OTUs, 0.97 threshold) occurring in >90% of the overall samples were adapted for network calculation. The Spearman correlation coefficient (r value) was used to measure the correlation between each of the two detected microorganisms, and then by taking the absolute values, the matrix was transformed into the similarity matrix. Similarity values above a certain threshold were screened out to calculate matrix eigenvalues. The optimal similarity threshold was found from 0.30 to 1.00 with intervals of 0.01 until the eigenvalue distribution followed a Poisson distribution.
We selected an identical cut-off of 0.83 to construct the microbial networks. Positive connections in the networks implied similar commonly preferred environmental conditions, cross-feeding, niche overlapping, or co-aggregation, while negative connections always indicated competition, niche partitioning, or predation in a food chain [19,31]. At last, the networks were visualized with Gephi 0.9.2 [32].

3. Results

3.1. Soil Physicochemical Properties

Selected soil characteristics and the MBC of the 20 samples are summarized in Table S1. Soils in TL were mainly classified as sandy or sandy loam soil, while the remaining 12 samples in SP and YJ were all silty loam soils. Soil pH varied from 5.64 to 8.57. Clay content ranged from 6.36 to 96.10%. Soil WSOC and TN varied from 0 to 135.59 mg kg−1 and from 14.77 to 116.38 mg kg−1, respectively. Furthermore, NH4+-N and NO3-N ranged from 0.22 to 9.87 mg kg−1 and from 0.80 to 35.67 mg kg−1, respectively. Compared with the soils from the other two sites, YJ soils contained higher levels of WSOC and NH4+-N, while soil samples from SP had more MBC and TN. In TL soils, however, the levels of NO3-N and clay were much lower than those in others soils (Table S1).
Some soil parameters were compared in all soil from three sampling sites (Figure 1). WSOC and NH4+-N contents in the YJ samples were higher compared to the soils from SP and TL (p < 0.05), and the content of clay in samples from TL was considerably lower (p < 0.01). The pH values of the soils from Yanji were lower (p < 0.05) in comparison with those of the soils from the other two sites. The results from a random forest model showed that clay was the most significant soil property for the differentiation of soils of different sites (Table 1).

3.2. Differences in the Microbial Community in Three Sampling Sites

Figure 2 shows the relative abundances (relative abundance > 1% for bacteria and >0.1% for fungi) of major groups of bacteria and fungi at phylum and class levels. At the phylum level, Actinobacteria was the most abundant bacterial phylum in TL, SP, and YJ, averaging 42.30%, 32.46%, and 35.00%, respectively (Figure 2a). In TL soils, the abundance of Actinobacteria was relatively higher while that of Proteobacteria was lower than that in soils from the other two sites (p < 0.05). Furthermore, phylum Verrucomicrobia was more abundant in YJ but not in TL and SP soils (p < 0.05, abundance <0.3%). Additionally, 19 rare phyla were also identified, whose abundance was less than 0.5%. At the class level (Figure 2b), the most abundant bacteria belonged to Actinobacteria, followed by Alphaproteobacteria. For fungi, Ascomycota was the most abundant phylum with mean relative abundances being 84.45%, 87.28%, and 71.22%, respectively (Figure 2c). Basidiomycota, the second most abundant phylum, was more abundant in YJ soils (p < 0.01, averaging 7.96%, 8.02%, and 20.20%, respectively). At the class level, Sordariomycetes was most abundant with an average of 30.15%, 47.11%, and 34.98% in TL, SP, and YJ. It is noteworthy that Dothideomycetes was more abundant in TL, but not in SP and YJ soils (Figure 2d).
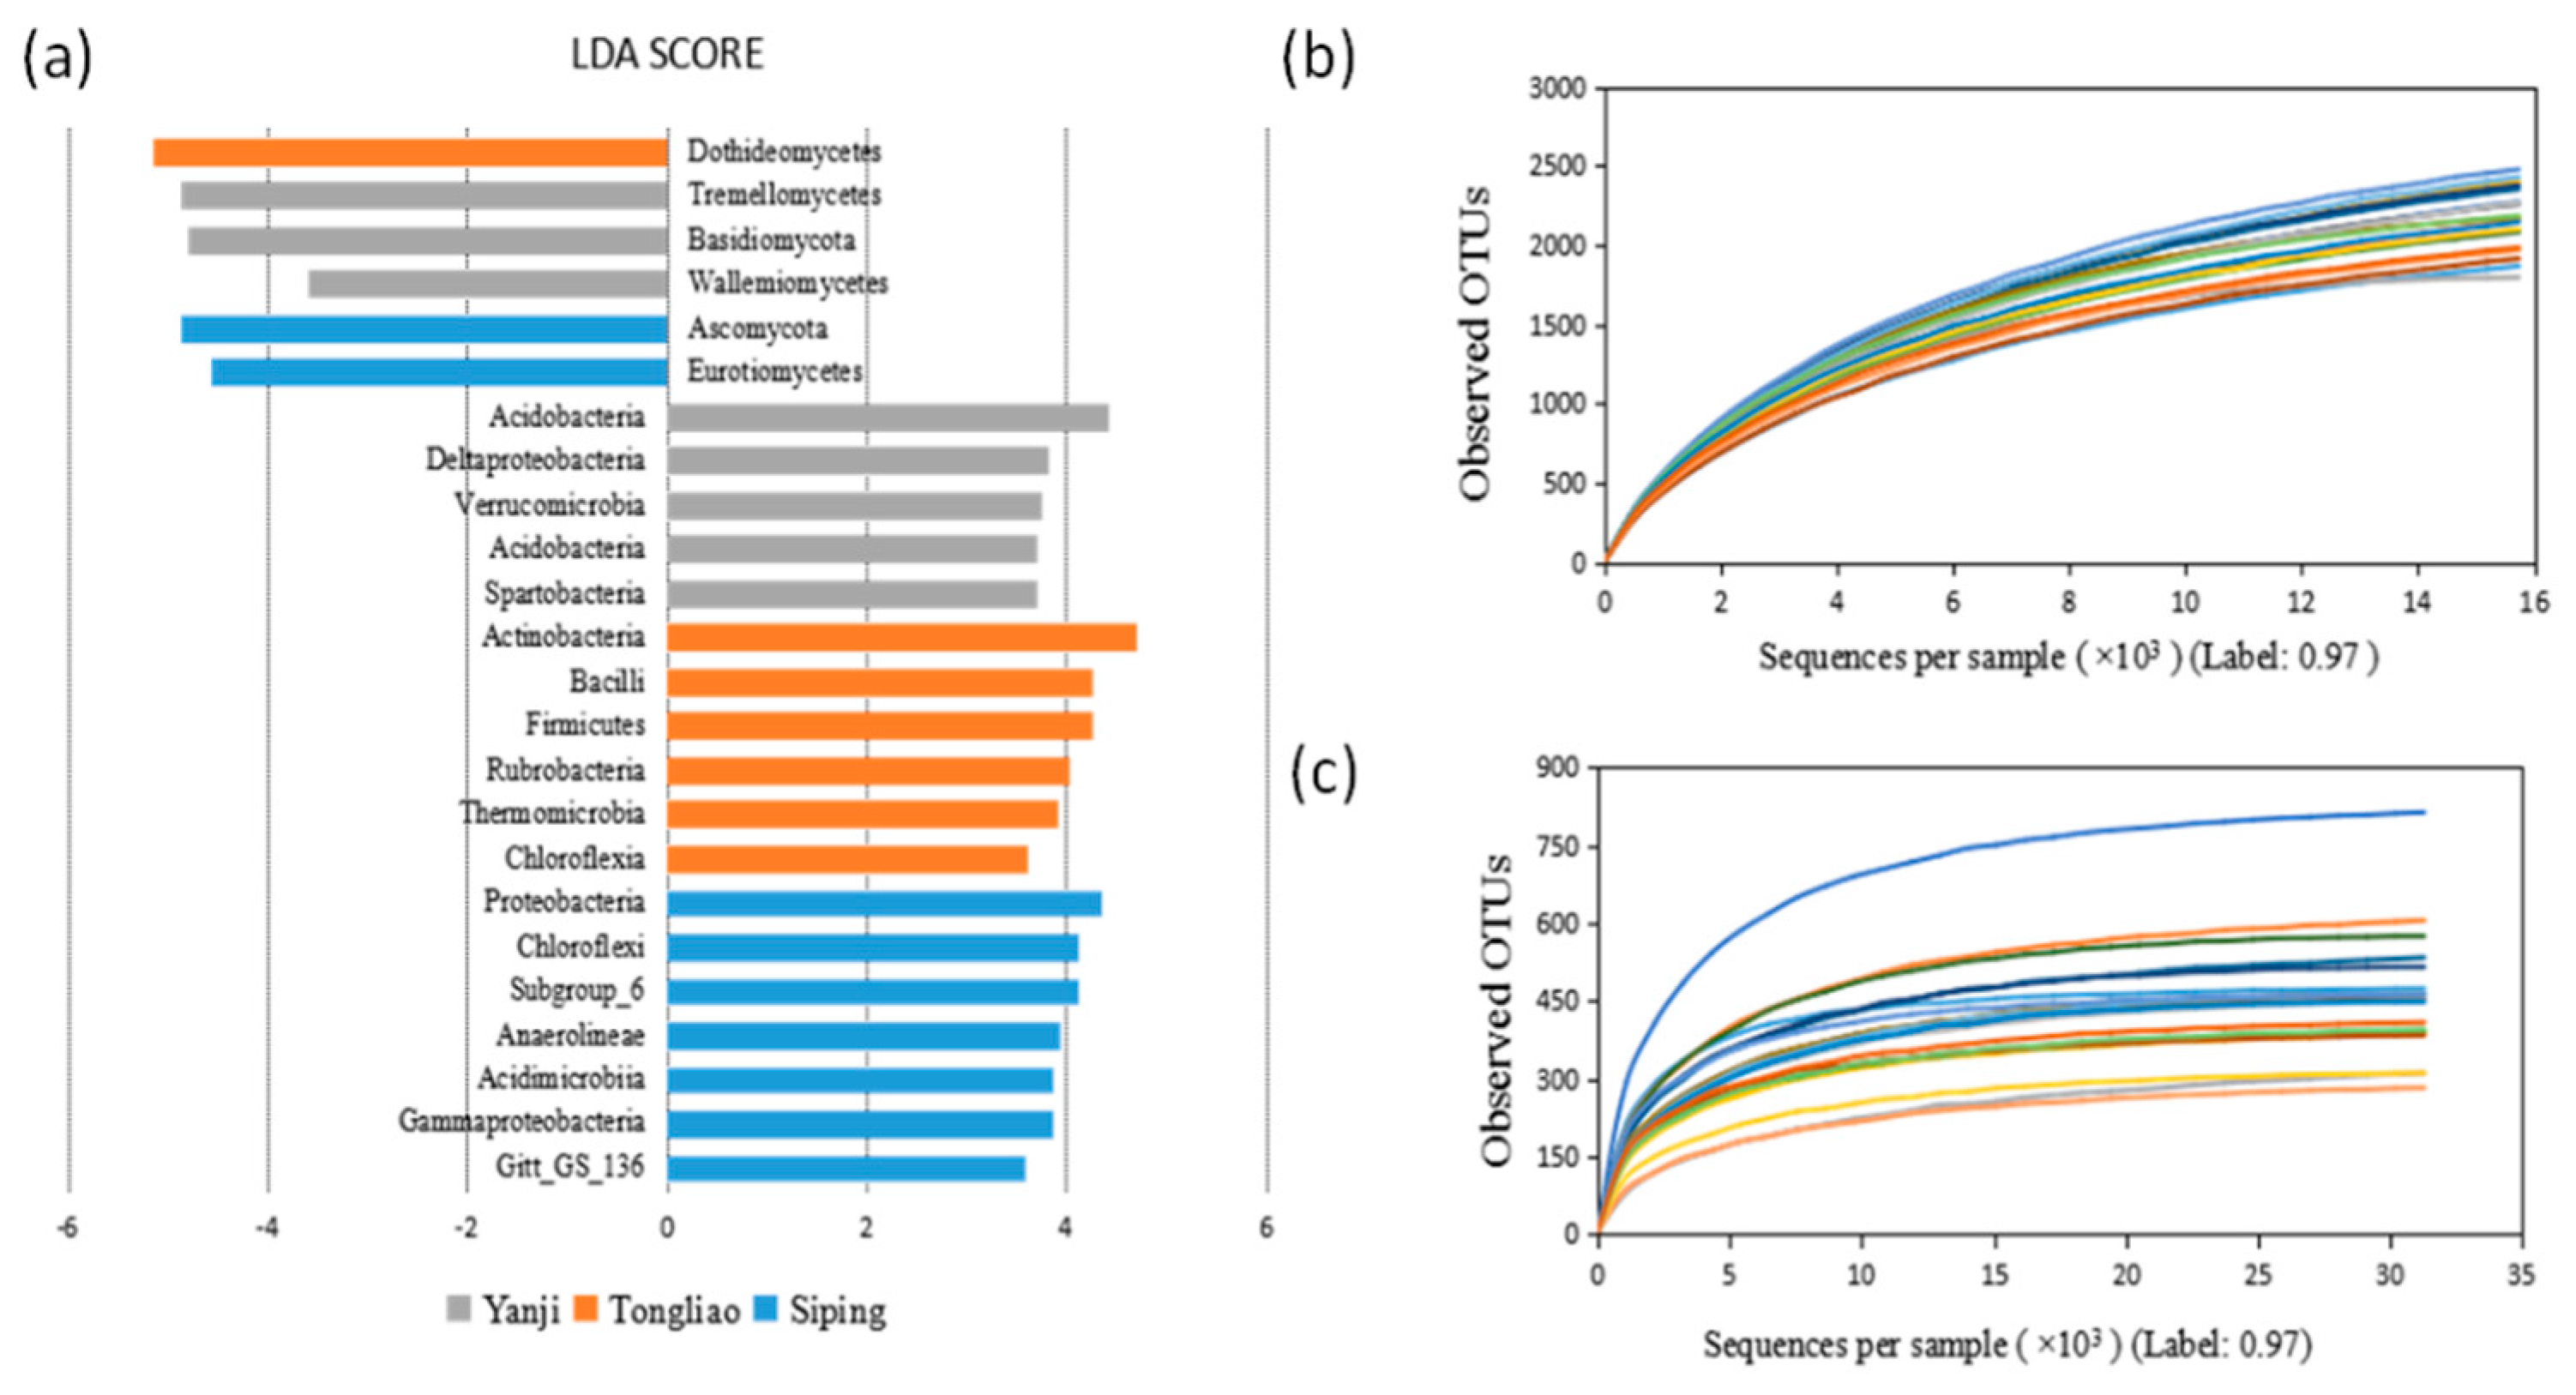
Figure 3 further illustrates the results of LEfSe, which showed the potential marker bacterial and fungal groups specific for soils from each of the sampling sites. A total of 18 bacterial and six fungal clades were identified based on LDA scores. Acidobacteria, Deltaproteobacteria, Verrucomicrobia, Spartobacteria, Tremellomycetes, Basidimycota, and Wallemimycetes were marker microbes in Yanji soils; Dothidemycetes, Actinobacteria, Bacilli, Firmicutes, Rubrobacteria, Thermomicrobia, and Chlorflexia were marker microorganisms in Tongliao soils, while Ascomycota, Acidobacteria GP-6, and GammaProteobacteria could be marker microbes in Siping soils.
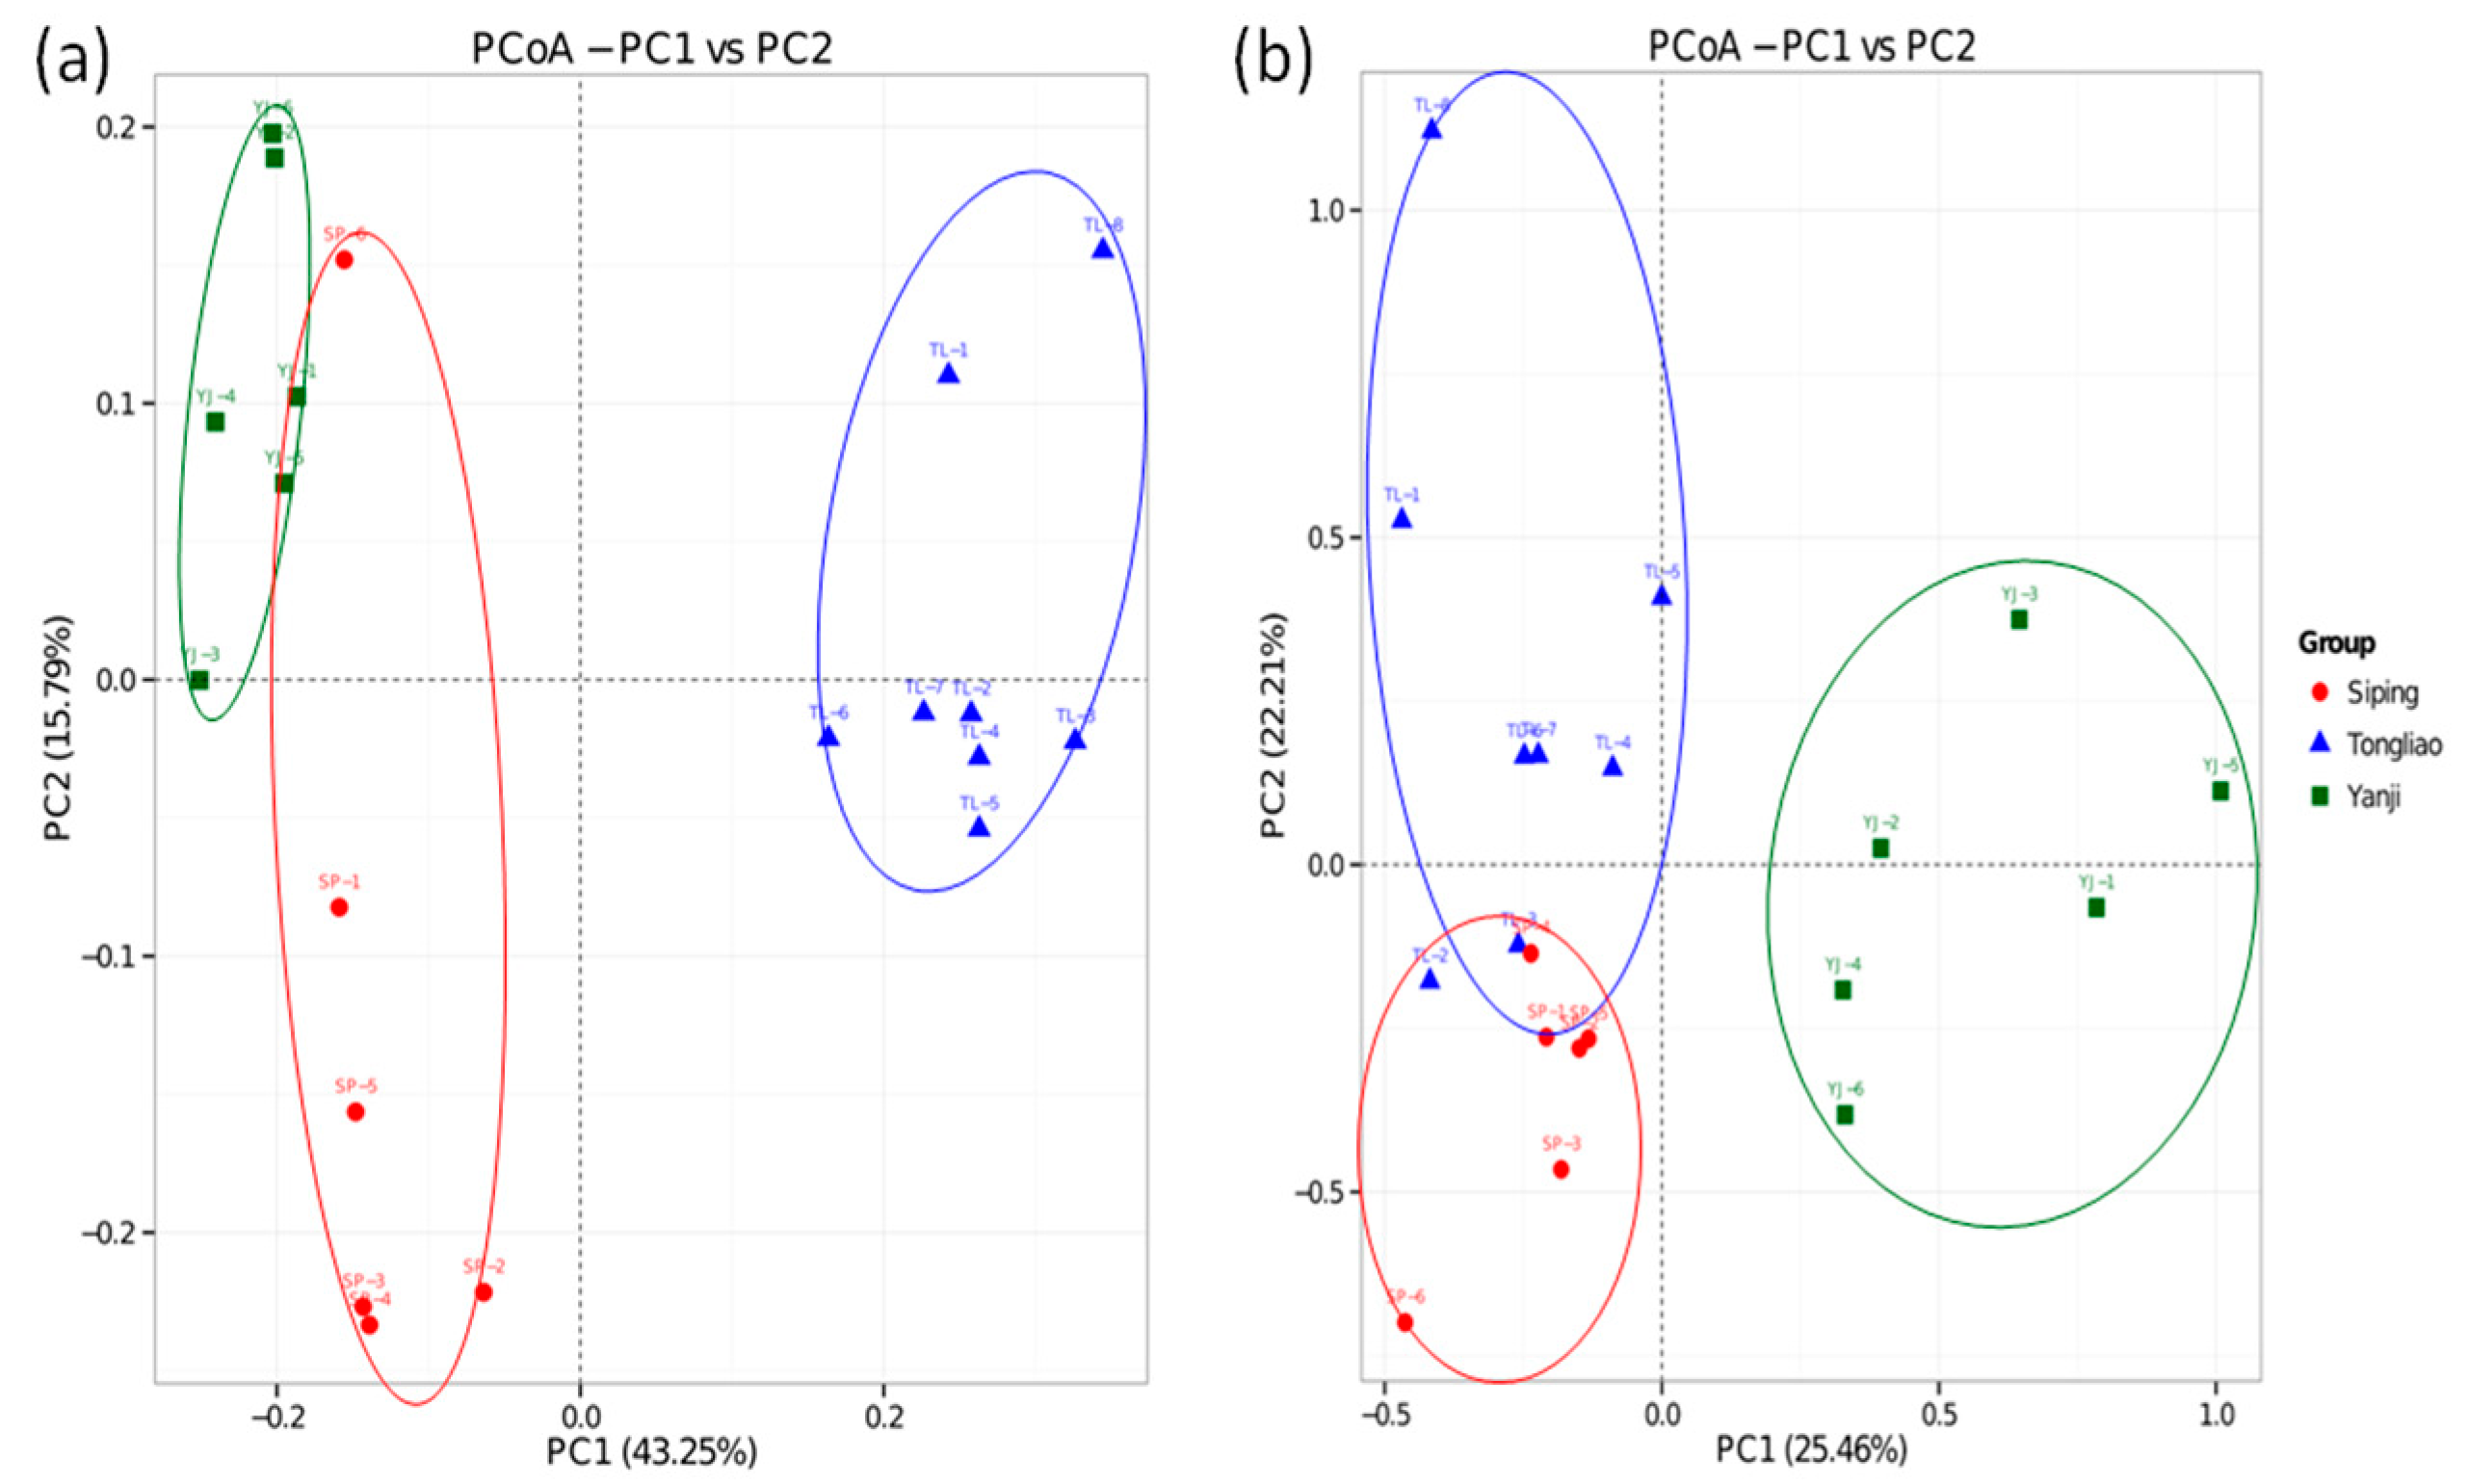
Principal coordinates analysis (PCoA) showed that, roughly, soils from TL, SP, and YJ were well separated from each other by PCoA1 or PCoA2 based on bacterial and fungal community structures, and the first two axles (PCoA1 and PCoA2) explained about 60% and 50% of the total variation in bacteria and fungi communities, respectively (Figure 4). Further dissimilarity analysis based on the Bray–Curtis distance also showed the same trend, i.e., the soils of three land use types had a different bacterial and fungal community structure (Table 2).
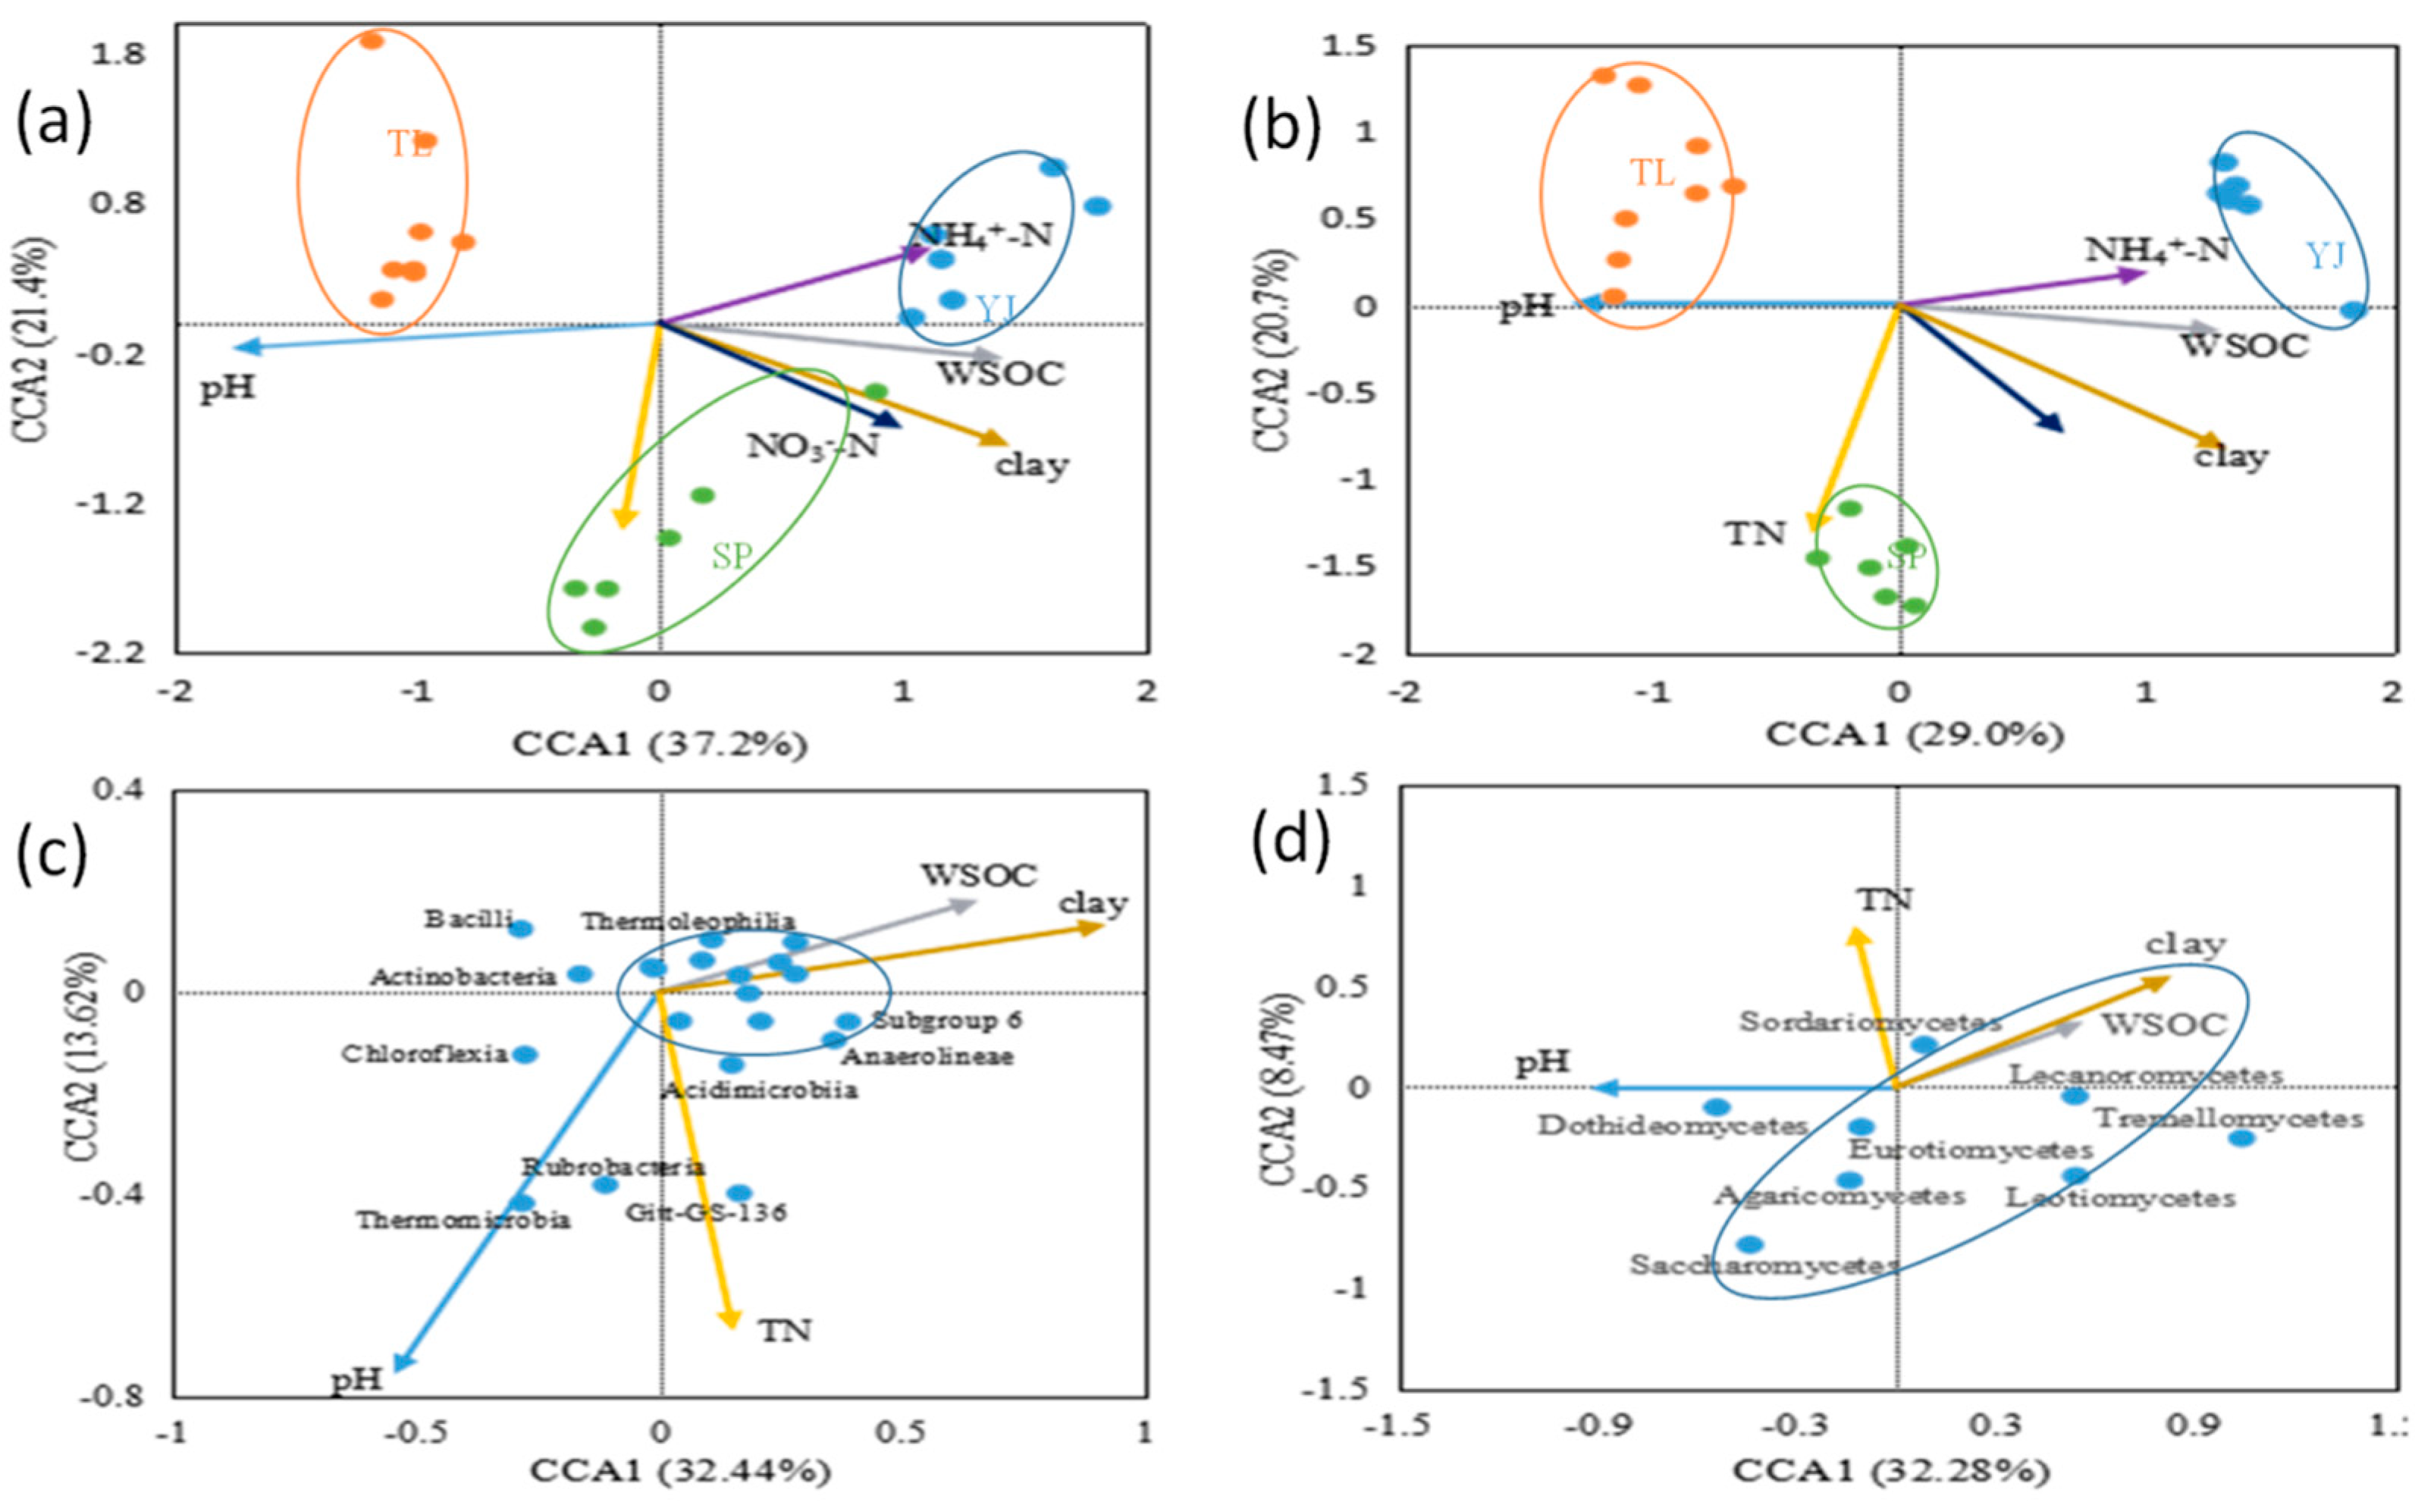
Partial Mantel tests revealed that four soil properties, including pH, TN, WSOC, and clay were major factors shaping the microbial community (Table 3). Specifically, pH was more correlated with both the bacterial and the fungal community (r = 0.511, p = 0.001 for bacteria, r = 0.352, p = 0.002 for fungi). The result was further supported by canonical correspondence analysis (CCA), Figure 5a,b show that all samples were roughly separated into three groups according to their corresponding locations. Of all the environmental variables, soil pH was the most significant soil parameter in shaping the microbial community. According to Figure 5c, 12 out of 18 dominant bacterial classes were negatively correlated with pH and TN and positively correlated with WSOC and clay. Furthermore, six out of eight dominant fungal classes negatively responded to TN (Figure 5d).

3.3. Comparison of Soil Microbial Co-Occurrence Networks

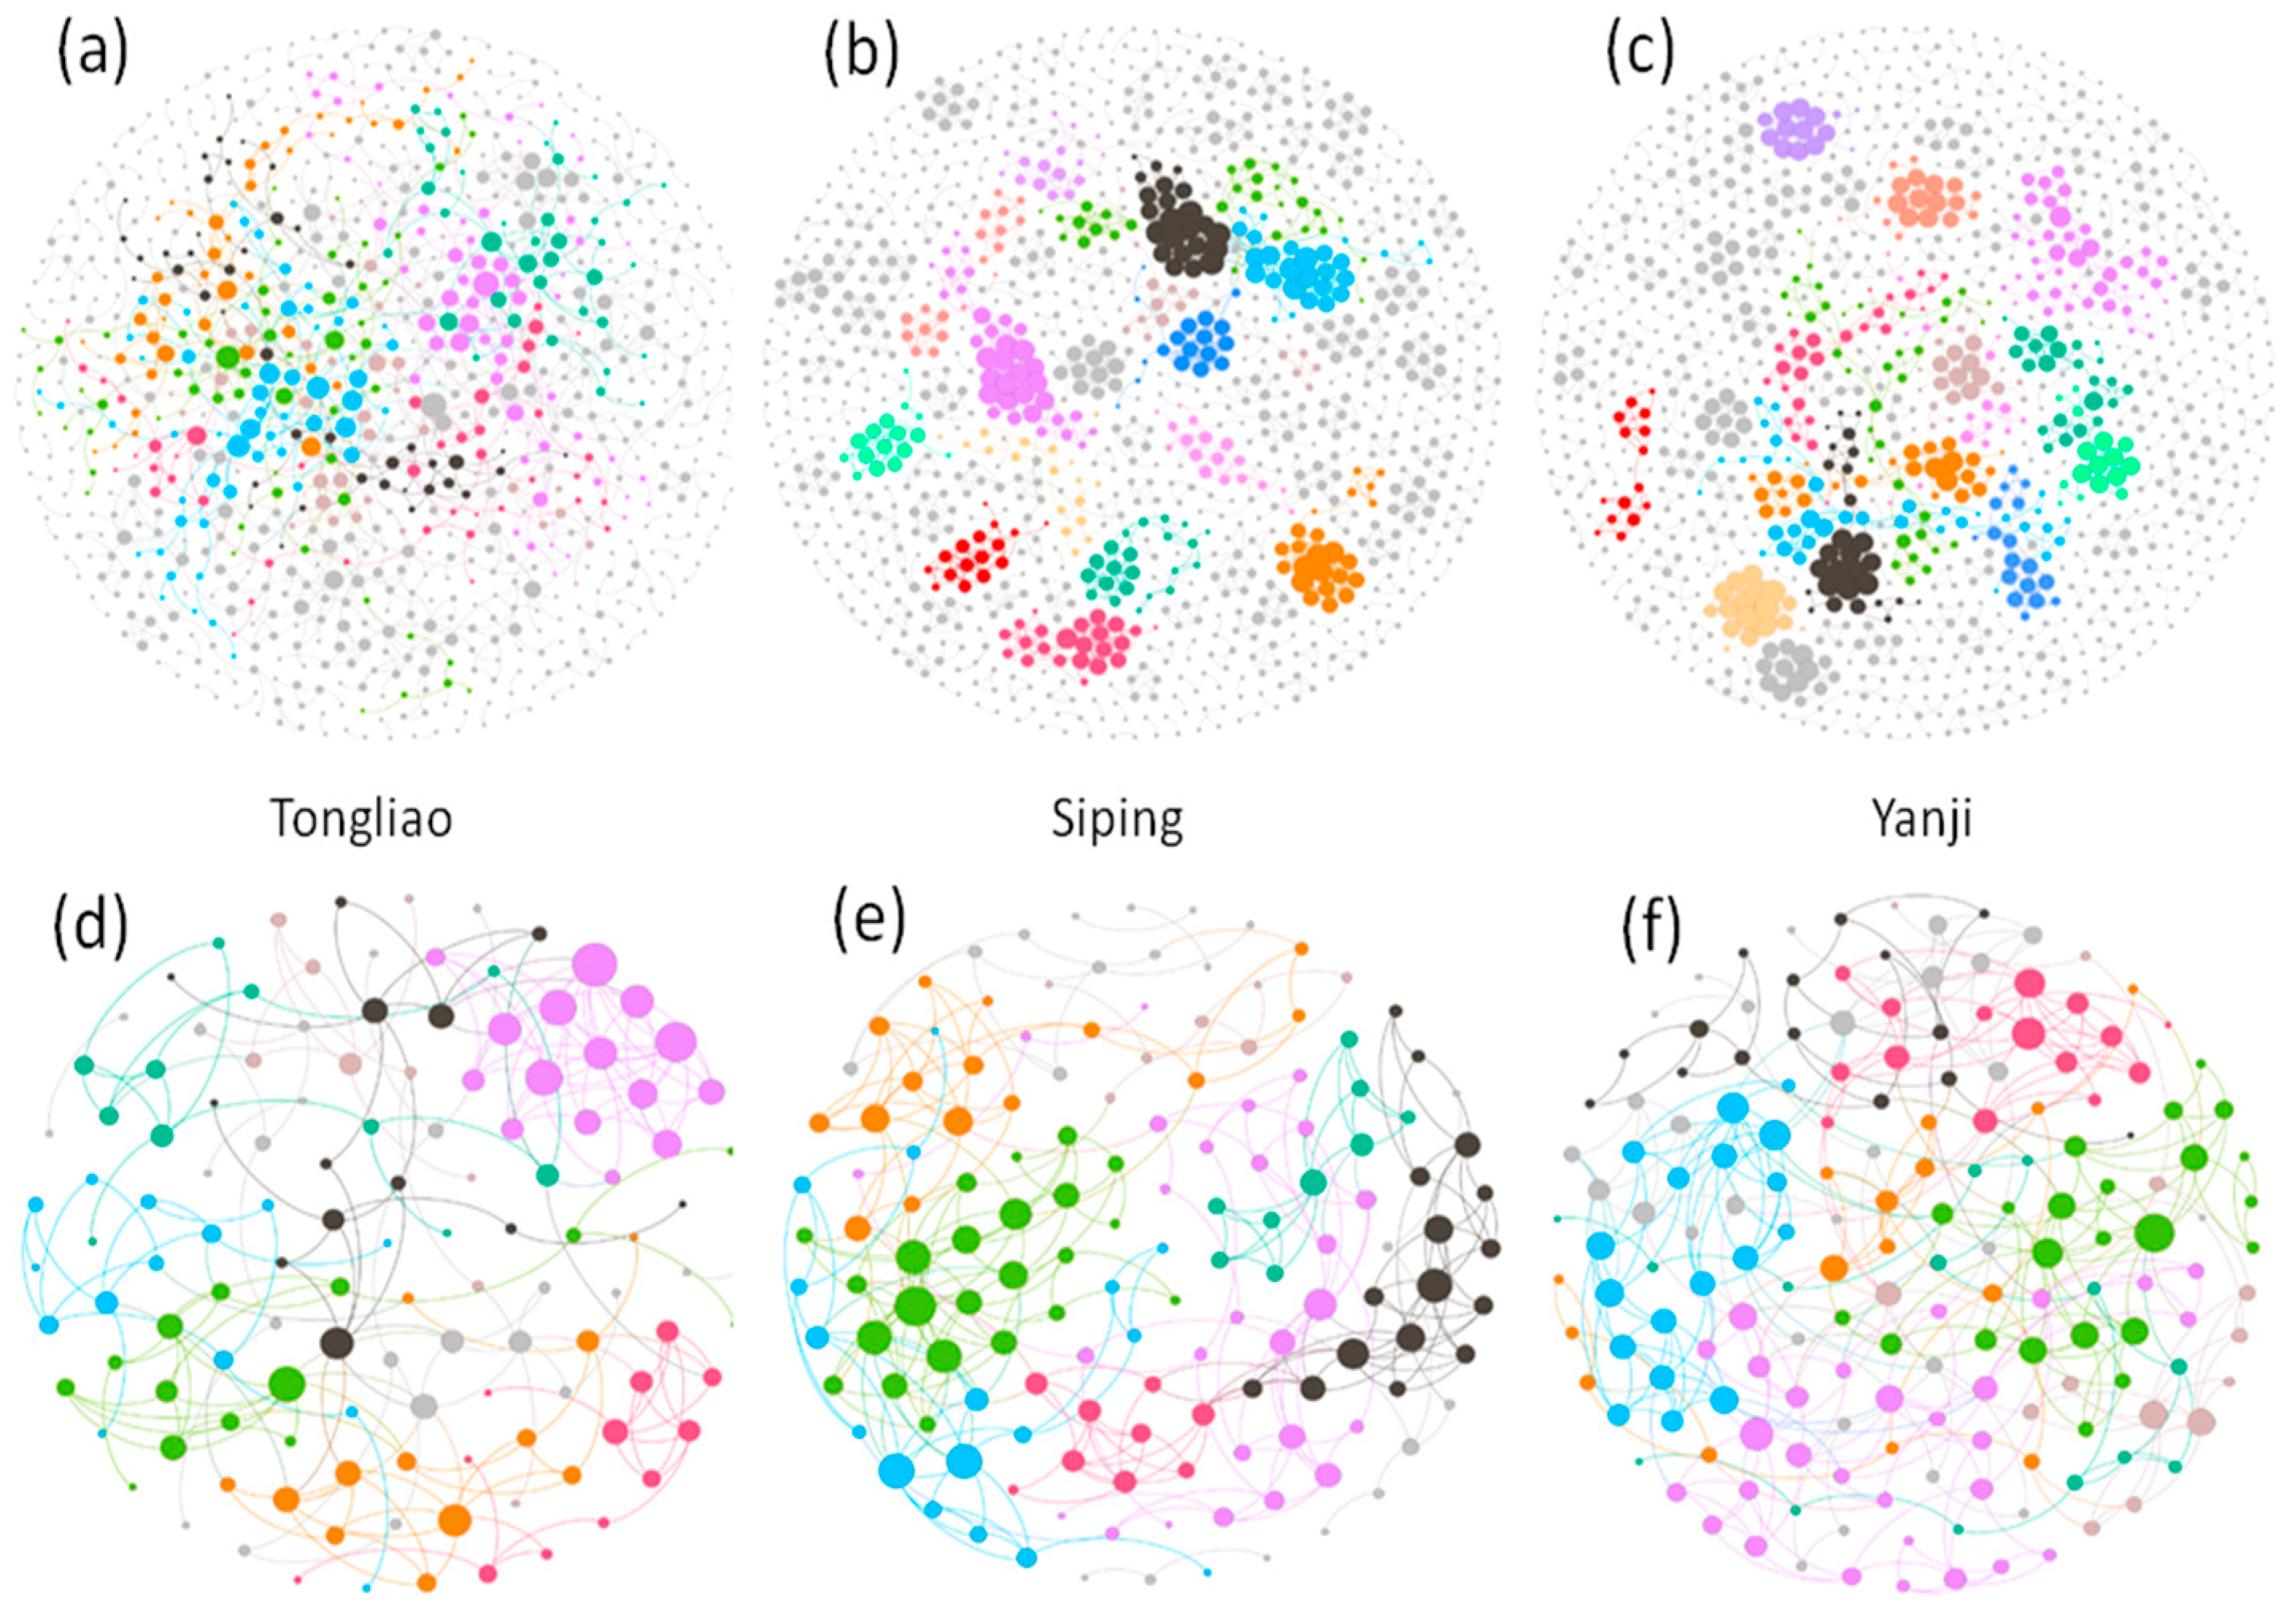
The network analysis of the bacterial and fungal community was performed individually, and their topological parameters were calculated (Figure 6 and Table 4). The networks were scale free, meaning that most nodes had few neighbors while few nodes had more neighbors. The connectivity distribution was well fitted with the power-law model with R2 values ranging from 0.81 to 0.87 (data not shown). According to high modularity values, all networks were able to be isolated into multiple modules. The modules identified in the network represented a group of microbial taxa that either have similar phylogeny, or potentially interact or share similar niches. Overall, the bacterial community network was more complex than that of the fungal community, as identified by the increased average connectivity and smaller modularity (Table 4), and both the bacterial and fungal networks of Siping and Yanji shared more similarities as evidenced by the similar nodes number, links numbers, average degree, modularity, and average clustering coefficient (Table 4).
Partial Mantel tests were performed to further explore the effect of environmental factors on overall networks (Table 5). The bacterial network was significantly associated with pH, clay, WSOC, and NH4+-N (p < 0.01), while only pH and WSOC were responsible for the variation of the fungal network structure (p < 0.01). No significant correlations were detected in microbial network connectivity with NO3-N and TN.

4. Discussion

4.1. Comparison of Soil Characterizations Among Three Land Use Types

The selected soil properties, including clay, pH, WSOC, TN, NO3-N, and NH4+-N varied a lot in the agricultural-pastoral interlaced land, crop land, and artificial economic forest land (p < 0.05). Due to desertification resulting from over grazing, TL soils become sandy soil, which has less organic matter and lower water holding capability. In contrast, soils from SP and YJ contain more clay and organic matter indicating that those soils are more suitable for crop and forest growth. Thus it was hypothesized that clay has the closest relation with the microbial community, rather than pH, which has been reported as the best predictor in other studies [13]. Moreover, higher WSOC content and lower TN in soils from YJ indicates that organic carbon rich fertilizers might have been applied there, while more nitrogen rich inorganic fertilizers might have been applied in SP soils. The application of different fertilizers may exhibit different effects on microbial communities [33,34,35]. In addition, fertilization could alter WSOC, TN, and TP contents in soils [9,36].

4.2. Comparison of Bacterial and Fungal Composition and Abundance

The current study revealed that soils from all three land types had the same microbial compositions, while their abundance varied a lot. With regard to bacteria, Actinobacteria and Proteobacteria accounted for 60% of the abundance in all three land types and have also been identified as keystone taxa in large continent scales [37]. In line with previous studies, Actinobacteria played a crucial role in the desert grassland soil, followed by Proteobacteria, a more significant phylum in the typical grassland soil [38]. Similarly, TL soil was under agriculture-pastoral interlaced management and had quite the same characteristics as desert grassland, while Actinobacteria was also the biomarker of TL soils. It is noteworthy that the abundance of Actinobacteria was lower by the addition of inorganic N compared with unfertilized, grassland soils [39], while the slightly higher abundance in YJ, instead of SP, was contradictory to its ecological characterization as an oligotrophic phylum in previous studies [33]. The same situation happened in Acidobacteria, one of the oligotrophic phyla abundant in soils from YJ where the WSOC content was relatively higher. This finding was also in contrast with previous studies in which the abundance of Acidobacteria was negatively correlated with high organic carbon soils [40,41]. This can be explained by the fact that an entire phylum is unlikely to share common ecological features. Several studies have also demonstrated that Acidobacteria or Actinobacteria can grow well in soils with organic manure [9,42,43,44]. It was even found that six-year fertilization did not lead to a significant increase in microbial abundance [45]. Furthermore, the effect of fertilization on microbial biomass could also be influenced by the organic manure type, application time, or soil environmental conditions such as temperate and humidity [46,47]. In brief, these taxa could not be distinctly classified into copiotrophic or oligotrophic groups, and fertilization effects were case-by-case. It was found that the Acidobacteria abundance decreased in order of Yanji, Siping, and Tongliao soils, which could be a result of the increase in soil aridity [48]. Firmicutes, the other biomarker of TL, was also more abundant in dryland soils with lower precicitation [4], and the higher abundance of Firmicutes was in agreement with the fact that Firmicutes can produce spores when dealing with adverse circumstances such as low temperature and desiccation and that the abundance of Firmicutes declined exponentially with the increase of precipitation [38].
The only phylum (abundance > 1%) which specifically existed in YJ was Verrucomicrobia (p < 0.05). As a type of methanotrophic bacteria, the Verrucomicrobia phylum prefers to grow in acid circumstances [26]. As ecto- and Endosymbionts of eukaryotes, Verrucomicrobia were associated with nematodes, such as Xiphinema, a kind of genus feeding on fruit crops [49,50]. As a result, a lower pH value and apple pear growth in YJ could be the reasonable explanation for it having the highest abundance of Verrucomicrobia among all soils. Another primary phylum, Proteobacteria, was more abundant in farmland (SP), whose activities were closely related to agricultural practices or other human activities [51]. Moreover, agricultural practices may also influence the abundance of Gemmatimonadetes and Chloroflexi, which were less than 1% [52,53].
It was demonstrated that the major fungal phyla in global soils were Ascomycota and Basidiomycota (90%) [54]. Interestingly, the ratio of Ascomycota to Basidiomycota showed differences with respect to land types. The proportion in Grasslands and shrublands was almost twice as high as that in temperate deciduous forests, which could reasonably explain why YJ had a lower ratio than that in TL and SP.

4.3. The Influence of Soil Properties on Bacterial and Fungal Community

In our study, pH still had the strongest correlations with the microbial community. Previous reports [11,55,56] conducted experiments across different land use types at a given location and proved that pH was the best predictor for microbial community structure. Several studies claimed that most bacterial taxa exhibit narrow pH ranges for optimal growth [21]. Our results also pointed out that the influence of pH on the fungal community was much weaker compared to that on the bacterial community. It showed that fungal species could survive in a wider pH range, up to 5–9 pH units [57]. When bacterial growth was inhibited, high fungal abundance appeared at all pH values [58]. Our results also showed that the pH effect on a certain phylum or class could be totally different. For example, within the Proteobacteria, the abundance of class alphaproteobactia decreased with soil pH, while the abundance of class betaproteobacteria was positively linked to pH [4].
In our study, it was found that clay was also a major driver in shaping microbial community structure. Clay provided protection for microbial growth; for example, by determining binding sites for the needed nutrient adjusting the soil pH range, absorbing toxic metabolites, and protecting microbes from desiccation as well as predation [59]. High bacterial population was likely to exist in soils with high clay content which had greater aggregated stability, organic matters, and refuge against larger predators [60]. However, the benefits for fungi were more trivial, since the larger size of fungi makes most of them unable to reside in micropores [61]. Fungi were generally found in larger pores or the surfaces of soil aggregates, vulnerable to their predators and drying conditions [62]. Some studies suggested that sandy soils were able to form a large number of hydrated isolated microhabitats, causing spatial differentiation of bacterial community composition and diversity thanks to less competition [63,64].
TN and WSOC were also correlated with the microbial community and other factors (p < 0.05). On the one hand, the nutrient in soils indeed directly affected the growth and composition of microbes [39], although the change tendency was not clear as we mentioned above in Section 4.2 [65]. On the other hand, the effect of fertilization was indirect. For instance, the addition of organic matter influenced soil capacity to capture moisture, so that posed a threat to microbial survival. It should be noticed that soil TC content was considered to be the best parameter for the fungal community [66]. It was contended that fungal abundance could be facilitated by a mineral fertilizer and inhibited by organic matter, while fungal growth was lower in high TC content soils [9,14].

4.4. Topological Features of Microbial Structures

Our study revealed that the bacterial community structure was much more complex and clustered than that of fungi (Figure 6). This could be explained, in part, by some technical limitations such as the core fungal genes targeted [67] or the imperfect methods of documenting phylogenetic differences. Both networks of bacteria and fungi, under extreme conditions such as drought [68] and in an Alpine Landscape [69], showed a larger, more connected and smaller modularity in bacterial co-occurrence networks. Interestingly, the environmental factors which affected microbial abundance were not consistent with those that affected microbial networks.
In summary, the bacterial and fungal communities in soils under different land use types are significantly different as indicated by the overall community profiling, biomarker microbial groups, distinct con-occurrence networks, and different environmental factors shaping their communities; all those data provide some insights into the management strategy design for soils under different land management toward a sustainable land use in Northeast China.

Supplementary Materials

The following are available online at https://www.mdpi.com/2071-1050/11/12/3286/s1, Table S1: Soil properties of soils belong to three different land use types, agricultural-pastoral interlaced land (Tongliao, TL), crop land (Siping, SP), and artificial economic forest land (Yanji, YJ). Figure S1 Sampling map of soil samples from three different land use types, agricultural-pastoral interlaced land (Tongliao. TL), crop land (Siping, SP), and artificial economic forest land (Yanji, YJ).

Author Contributions

Conceptualization, J.M., S.N. and Z.H.; methodology, R.Z., H.L., L.Z., and J.L.; formal analysis, S.N. and G.N.; investigation, R.Z., H.L., L.Z.; resources, J.M.; data curation, G.H.; writing—original draft preparation, J.M. and S.N.; writing—review and editing, S.N. and J.M.; supervision, J.M.; project administration, J.M.; funding acquisition, J.M.

Funding

This research was funded by National Natural Science Foundation of China (No. 41571304, 41571474, 41722110) and the APC was funded by National Natural Science Foundation of China, No. 41571304.

Conflicts of Interest

The authors declare no conflict of interest.

References

  1. Basilio, A.; Gonzalez, I.; Vicente, M.F.; Gorrochategui, J.; Cabello, A.; Gonzalez, A.; Genilloud, O. Patterns of Antimicrobial Activities from Soil Actinomycetes Isolated under Different Conditions of Ph and Salinity. J. Appl. Microbiol. 2003, 95, 814–823. [Google Scholar] [CrossRef] [PubMed]
  2. Hartmann, M.; Widmer, F. Community Structure Analyses Are More Sensitive to Differences in Soil Bacterial Communities Than Anonymous Diversity Indices. Appl. Environ. Microbiol. 2006, 72, 7804–7812. [Google Scholar] [CrossRef] [PubMed]
  3. Baath, E.; Anderson, T.H. Comparison of Soil Fungal/Bacterial Ratios in a Ph Gradient Using Physiological and Plfa-Based Techniques. Soil Biol. Biochem. 2003, 35, 955–963. [Google Scholar] [CrossRef]
  4. Nacke, H.; Thürmer, A.; Wollherr, A.; Will, C.; Hodac, L.; Herold, N.; Schöning, I.; Schrumpf, M.; Daniel, R. Pyrosequencing-Based Assessment of Bacterial Community Structure Along Different Management Types in German Forest and Grassland Soils. PLoS ONE 2011, 6, e17000. [Google Scholar] [CrossRef] [PubMed]
  5. Shen, C.; Xiong, J.; Zhang, H.; Feng, Y.; Lin, X.; Li, X.; Liang, W.; Chu, H. Soil Ph Drives the Spatial Distribution of Bacterial Communities Along Elevation on Changbai Mountain. Soil Biol. Biochem. 2013, 57, 204–211. [Google Scholar] [CrossRef]
  6. Liu, J.; Sui, Y.; Yu, Z.; Shi, Y.; Chu, H.; Jin, J.; Liu, X.; Wang, G. High Throughput Sequencing Analysis of Biogeographical Distribution of Bacterial Communities in the Black Soils of Northeast China. Soil Biol. Biochem. 2014, 70, 113–122. [Google Scholar] [CrossRef]
  7. Marschner, P.; Kandeler, E.; Marschner, B. Structure and Function of the Soil Microbial Community in a Long-Term Fertilizer Experiment. Soil Biol. Biochem. 2003, 35, 453–461. [Google Scholar] [CrossRef]
  8. Stark, C.; Condron, L.M.; Stewart, A.; Di, H.J.; O’Callaghan, M. Influence of Organic and Mineral Amendments on Microbial Soil Properties and Processes. Appl. Soil Ecol. 2007, 35, 79–93. [Google Scholar] [CrossRef]
  9. Dong, W.Y.; Zhang, X.Y.; Dai, X.Q.; Fu, X.L.; Yang, F.T.; Liu, X.Y.; Sun, X.M.; Wen, X.F.; Schaeffer, S. Changes in Soil Microbial Community Composition in Response to Fertilization of Paddy Soils in Subtropical China. Appl. Soil Ecol. 2014, 84, 140–147. [Google Scholar] [CrossRef]
  10. Bahram, M.F.; Hildebrand, S.K.; Forslund, J.L.; Anderson, N.A.; Soudzilovskaia, P.M.; Bodegom, J.; Bengtsson-Palme, S.; Anslan, L.P.; Coelho, H.; Harend, J.; et al. Structure and Function of the Global Topsoil Microbiome. Nature 2018, 560, 233–237. [Google Scholar] [CrossRef]
  11. Lauber, C.L.; Strickland, M.S.; Bradford, M.A.; Fierer, N. The Influence of Soil Properties on the Structure of Bacterial and Fungal Communities across Land-Use Types. Soil Biol. Biochem. 2008, 40, 2407–2415. [Google Scholar] [CrossRef]
  12. Rath, K.M.; Fierer, N.; Murphy, D.V.; Rousk, J. Linking Bacterial Community Composition to Soil Salinity Along Environmental Gradients. ISME J. 2019, 13, 836. [Google Scholar] [CrossRef] [PubMed]
  13. Rousk, J.; Bååth, E.; Brookes, P.C.; Lauber, C.L.; Lozupone, C.; Caporaso, J.G.; Knight, R.; Fierer, N. Soil Bacterial and Fungal Communities across a Ph Gradient in an Arable Soil. ISME J. 2010, 4, 1340–1351. [Google Scholar] [CrossRef] [PubMed]
  14. Liu, J.; Sui, Y.; Yu, Z.; Shi, Y.; Chu, H.; Jin, J.; Liu, X.; Wang, G. Soil Carbon Content Drives the Biogeographical Distribution of Fungal Communities in the Black Soil Zone of Northeast China. Soil Biol. Biochem. 2015, 83, 29–39. [Google Scholar] [CrossRef]
  15. de Boer, W.; Verheggen, P.; Gunnewiek, P.J.K.; Kowalchuk, G.A.; van Veen, J.A. Microbial Community Composition Affects Soil Fungistasis. Appl. Environ. Microbiol. 2003, 69, 835–844. [Google Scholar] [CrossRef] [PubMed] [Green Version]
  16. Stegen, J.C.; Lin, X.; Konopka, A.E.; Fredrickson, J.K. Stochastic and Deterministic Assembly Processes in Subsurface Microbial Communities. ISME J. 2012, 6, 1653–1664. [Google Scholar] [CrossRef] [PubMed]
  17. Zhou, J.; Deng, Y.; Luo, F.; He, Z.; Yang, Y. Phylogenetic Molecular Ecological Network of Soil Microbial Communities in Response to Elevated Co2. MBio 2011, 2, e00122-11. [Google Scholar] [CrossRef] [PubMed]
  18. Shi, S.; Nuccio, E.E.; Shi, Z.J.; He, Z.; Zhou, J.; Firestone, M.K. The Interconnected Rhizosphere: High Network Complexity Dominates Rhizosphere Assemblages. Ecol. Lett. 2016, 19, 926–936. [Google Scholar] [CrossRef]
  19. Deng, Y.; Zhang, P.; Qin, Y.; Tu, Q.; Yang, Y.; He, Z.; Schadt, C.W.; Zhou, J. Network Succession Reveals the Importance of Competition in Response to Emulsified Vegetable Oil Amendment for Uranium Bioremediation. Environ. Microbiol. 2016, 18, 205–218. [Google Scholar] [CrossRef]
  20. Kozdroj, J.; van Elsas, J.D. Structural Diversity of Microbial Communities in Arable Soils of a Heavily Industrialised Area Determined by Pcr-Dgge Fingerprinting and Fame Profiling. Appl. Soil Ecol. 2001, 17, 31–42. [Google Scholar] [CrossRef]
  21. Rousk, J.; Brookes, P.C.; Bååth, E. Investigating the Mechanisms for the Opposing Ph Relationships of Fungal and Bacterial Growth in Soil. Soil Biol. Biochem. 2010, 42, 926–934. [Google Scholar] [CrossRef]
  22. Schmidt, S.K.; Nemergut, D.R.; Darcy, J.L.; Lynch, R. Do Bacterial and Fungal Communities Assemble Differently During Primary Succession? Mol. Ecol. 2014, 23, 254–258. [Google Scholar] [CrossRef] [PubMed]
  23. Vance, E.D.; Brookes, P.C.; Jenkinson, D.S. An Extraction Method for Measuring Soil Microbial Biomass C. Soil Biol. Biochem. 1987, 19, 703–707. [Google Scholar] [CrossRef]
  24. Schloss, P.D.; Westcott, S.L.; Ryabin, T.; Hall, J.R.; Hartmann, M.; Hollister, E.B.; Lesniewski, R.A.; Oakley, B.B.; Parks, D.H.; Robinson, C.J.; et al. Introducing Mothur: Open-Source, Platform-Independent, Community-Supported Software for Describing and Comparing Microbial Communities. Appl. Environ. Microbiol. 2009, 75, 7537–7541. [Google Scholar] [CrossRef] [PubMed]
  25. DeSantis, T.Z.; Hugenholtz, P.; Keller, K.; Brodie, E.L.; Larsen, N.; Piceno, Y.M.; Phan, R.; Andersen, G.L. Nast: A Multiple Sequence Alignment Server for Comparative Analysis of 16s Rrna Genes. Nucleic Acids Res. 2006, 34, W394–W399. [Google Scholar] [CrossRef] [PubMed]
  26. Dunfield, P.F.; Yuryev, A.; Senin, P.; Smirnova, A.V.; Stott, M.B.; Hou, S.; Ly, B.; Saw, J.H.; Zhou, Z.; Ren, Y.; et al. Methane Oxidation by an Extremely Acidophilic Bacterium of the Phylum Verrucomicrobia. Nature 2007, 450, 879–882. [Google Scholar] [CrossRef]
  27. Niţă, A.; Buttler, A.; Rozylowicz, L.; Pătru-Stupariu, I. Perception and Use of Landscape Concepts in the Procedure of Environmental Impact Assessment: Case Study—Switzerland and Romania. Land Use Policy 2015, 44, 145–152. [Google Scholar] [CrossRef]
  28. Segata, N.; Izard, J.; Waldron, L.; Gevers, D.; Miropolsky, L.; Garrett, W.S.; Huttenhower, C. Metagenomic Biomarker Discovery and Explanation. Genome Biol. 2011, 12, R60. [Google Scholar] [CrossRef]
  29. Deng, Y.; Jiang, Y.H.; Yang, Y.; He, Z.; Luo, F.; Zhou, J. Molecular Ecological Network Analyses. BMC Bioinform. 2012, 13, 113. [Google Scholar] [CrossRef]
  30. Manolache, S.; Nita, A.; Ciocanea, C.M.; Popescu, V.D.; Rozylowicz, L. Power, Influence and Structure in Natura 2000 Governance Networks. A Comparative Analysis of Two Protected Areas in Romania. J. Environ. Manag. 2018, 212, 54–64. [Google Scholar] [CrossRef]
  31. Faust, K.; Raes, J. Microbial Interactions: From Networks to Models. Nat. Rev. Microbiol. 2012, 10, 538–550. [Google Scholar] [CrossRef] [PubMed]
  32. Bastian, M.; Heymann, S.; Jacomy, M. Gephi: An Open Source Software for Exploring and Manipulating Networks. In Proceedings of the Third international AAAI Conference on Weblogs and Social Media, San Jose, CA, USA, 17–20 May 2009. [Google Scholar]
  33. Peacock, A.G.; Mullen, M.D.; Ringelberg, D.B.; Tyler, D.D.; Hedrick, D.B.; Gale, P.M.; White, D.C. Soil Microbial Community Responses to Dairy Manure or Ammonium Nitrate Applications. Soil Biol. Biochem. 2001, 33, 1011–1019. [Google Scholar] [CrossRef]
  34. Cookson, W.R.; Abaye, D.A.; Marschner, P.; Murphy, D.V.; Stockdale, E.A.; Goulding, K.W. The Contribution of Soil Organic Matter Fractions to Carbon and Nitrogen Mineralization and Microbial Community Size and Structure. Soil Biol. Biochem. 2005, 37, 1726–1737. [Google Scholar] [CrossRef]
  35. Elfstrand, S.; Hedlund, K.; Mårtensson, A. Soil Enzyme Activities, Microbial Community Composition and Function after 47 Years of Continuous Green Manuring. Appl. Soil Ecol. 2007, 35, 610–621. [Google Scholar] [CrossRef]
  36. Galvez, A.; Sinicco, T.; Cayuela, M.L.; Mingorance, M.D.; Fornasier, F.; Mondini, C. Short Term Effects of Bioenergy by-Products on Soil C and N Dynamics, Nutrient Availability and Biochemical Properties. Agric. Ecosyst. Environ. 2012, 160, 3–14. [Google Scholar] [CrossRef]
  37. Banerjee, S.; Schlaeppi, K.; Van Der Heijden, M.G. Keystone Taxa as Drivers of Microbiome Structure and Functioning. Nat. Rev. Microbiol. 2018, 16, 1. [Google Scholar] [CrossRef]
  38. Wang, X.B.; Lü, X.T.; Yao, J.; Wang, Z.W.; Deng, Y.; Cheng, W.X.; Zhou, J.Z.; Han, X.G. Habitat-Specific Patterns and Drivers of Bacterial Beta-Diversity in China’s Drylands. ISME J. 2017, 11, 1345–1358. [Google Scholar] [CrossRef] [PubMed]
  39. Clegg, C.D.; Lovell, R.D.; Hobbs, P.J. The Impact of Grassland Management Regime on the Community Structure of Selected Bacterial Groups in Soils. FEMS Microbiol. Ecol. 2003, 43, 263–270. [Google Scholar] [CrossRef] [PubMed]
  40. Fierer, N.; Bradford, M.A.; Jackson, R.B. Toward an Ecological Classification of Soil Bacteria. Ecology 2007, 88, 1354–1364. [Google Scholar] [CrossRef]
  41. Jones, R.T.; Robeson, M.S.; Lauber, C.L.; Hamady, M.; Knight, R.; Fierer, N. A Comprehensive Survey of Soil Acidobacterial Diversity Using Pyrosequencing and Clone Library Analyses. ISME J. 2009, 3, 442–453. [Google Scholar] [CrossRef]
  42. Eichorst, S.A.; Breznak, J.A.; Schmidt, T.M. Isolation and Characterization of Soil Bacteria That Define Terriglobus Gen. Nov., in the Phylum Acidobacteria. Appl. Environ. Microbiol. 2007, 73, 2708–2717. [Google Scholar] [CrossRef] [PubMed]
  43. Liu, J.; Sui, Y.; Yu, Z.; Yao, Q.; Shi, Y.; Chu, H.; Jin, J.; Liu, X.; Wang, G. Diversity and Distribution Patterns of Acidobacterial Communities in the Black Soil Zone of Northeast China. Soil Biol. Biochem. 2016, 95, 212–222. [Google Scholar] [CrossRef]
  44. de Castro, V.H.L.; Schroeder, L.F.; Quirino, B.F.; Kruger, R.H.; Barreto, C.C. Acidobacteria from Oligotrophic Soil from the Cerrado Can Grow in a Wide Range of Carbon Source Concentrations. Can. J. Microbiol. 2013, 59, 746–753. [Google Scholar] [CrossRef] [PubMed]
  45. Bardgett, R.D.; McAlister, E. The Measurement of Soil Fungal: Bacterial Biomass Ratios as an Indicator of Ecosystem Self-Regulation in Temperate Meadow Grasslands. Biol. Fertil. Soils 1999, 29, 282–290. [Google Scholar] [CrossRef]
  46. Lovell, R.D.; Jarvis, S.C.; Bardgett, R.D. Soil Microbial Biomass and Activity in Long-Term Grassland: Effects of Management Changes. Soil Biol. Biochem. 1995, 27, 969–975. [Google Scholar] [CrossRef]
  47. De Vries, F.T.; Hoffland, E.; van Eekeren, N.; Brussaard, L.; Bloem, J. Fungal/Bacterial Ratios in Grasslands with Contrasting Nitrogen Management. Soil Biol. Biochem. 2006, 38, 2092–2103. [Google Scholar] [CrossRef]
  48. Maestre, F.T.; Delgado-Baquerizo, M.; Jeffries, T.C.; Eldridge, D.J.; Ochoa, V.; Gozalo, B.; Quero, J.L.; Garcia-Gomez, M.; Gallardo, A.; Ulrich, W.; et al. Increasing Aridity Reduces Soil Microbial Diversity and Abundance in Global Drylands. Proc. Natl. Acad. Sci. USA 2015, 112, 15684–15689. [Google Scholar] [CrossRef]
  49. Wagner, M.; Horn, M. The Planctomycetes, Verrucomicrobia, Chlamydiae and Sister Phyla Comprise a Superphylum with Biotechnological and Medical Relevance. Curr. Opin. Biotechnol. 2006, 17, 241–249. [Google Scholar] [CrossRef]
  50. Newton, R.J.; Jones, S.E.; Eiler, A.; McMahon, K.D.; Bertilsson, S. A Guide to the Natural History of Freshwater Lake Bacteria. Microbiol. Mol. Biol. Rev. 2011, 75, 14–49. [Google Scholar] [CrossRef] [Green Version]
  51. Hanson, R.S.; Hanson, T.E. Methanotrophic Bacteria. Microbiol. Rev. 1996, 60, 439–471. [Google Scholar]
  52. Lauber, C.L.; Hamady, M.; Knight, R.; Fierer, N. Pyrosequencing-Based Assessment of Soil Ph as a Predictor of Soil Bacterial Community Structure at the Continental Scale. Appl. Environ. Microbiol. 2009, 75, 5111–5120. [Google Scholar] [CrossRef] [PubMed]
  53. Chu, H.; Fierer, N.; Lauber, C.L.; Caporaso, J.G.; Knight, R.; Grogan, P. Soil Bacterial Diversity in the Arctic Is Not Fundamentally Different from That Found in Other Biomes. Environ. Microbiol. 2010, 12, 2998–3006. [Google Scholar] [CrossRef] [PubMed]
  54. Tedersoo, L.; Bahram, M.; Põlme, S.; Kõljalg, U.; Yorou, N.S.; Wijesundera, R.; Ruiz, L.V.; Vasco-Palacios, A.M.; Thu, P.Q.; Suija, A.; et al. Global Diversity and Geography of Soil Fungi. Science 2014, 346, 1256688. [Google Scholar] [CrossRef] [PubMed]
  55. Jenkins, S.N.; Waite, I.S.; Blackburn, A.; Husband, R.; Rushton, S.P.; Manning, D.C.; O’Donnell, A.G. Actinobacterial Community Dynamics in Long Term Managed Grasslands. Antonie Van Leeuwenhoek 2009, 95, 319–334. [Google Scholar] [CrossRef] [PubMed]
  56. Han, Z.; Deng, M.; Yuan, A.; Wang, J.; Li, H.; Ma, J. Vertical Variation of a Black Soil’s Properties in Response to Freeze-Thaw Cycles and Its Links to Shift of Microbial Community Structure. Sci. Total Environ. 2018, 625, 106–113. [Google Scholar] [CrossRef] [PubMed]
  57. Nevarez, L.; Vasseur, V.; Le Madec, A.; Le Bras, M.A.; Coroller, L.; Leguérinel, I.; Barbier, G. Physiological Traits of Penicillium Glabrum Strain Lcp 08.5568, a Filamentous Fungus Isolated from Bottled Aromatized Mineral Water. Int. J. Food Microbiol. 2009, 130, 166–171. [Google Scholar] [CrossRef] [PubMed]
  58. Rousk, J.; Demoling, L.A.; Bahr, A.; Baath, E. Examining the Fungal and Bacterial Niche Overlap Using Selective Inhibitors in Soil. FEMS Microbiol. Ecol. 2008, 63, 350–358. [Google Scholar] [CrossRef] [PubMed]
  59. Ranjard, L.; Richaume, A. Quantitative and Qualitative Microscale Distribution of Bacteria in Soil. Res. Microbiol. 2001, 152, 707–716. [Google Scholar] [CrossRef]
  60. Ma, J.; Ibekwe, A.M.; Yang, C.H.; Crowley, D.E. Bacterial Diversity and Composition in Major Fresh Produce Growing Soils Affected by Physiochemical Properties and Geographic Locations. Sci. Total Environ. 2016, 563, 199–209. [Google Scholar] [CrossRef]
  61. Klein, D.A.; McLendon, T.; Paschke, M.W.; Redente, E.F. Nitrogen Availability and Fungal-Bacterial Responses in Successional Semiarid Steppe Soils. Arid Soil Res. Rehabil. 1996, 10, 321–332. [Google Scholar] [CrossRef]
  62. Denef, K.; Six, J.; Bossuyt, H.; Frey, S.D.; Elliott, E.T.; Merckx, R.; Paustian, K. Influence of Dry-Wet Cycles on the Interrelationship between Aggregate, Particulate Organic Matter, and Microbial Community Dynamics. Soil Biol. Biochem. 2001, 33, 1599–1611. [Google Scholar] [CrossRef]
  63. Zhou, J.; Xia, B.; Treves, D.S.; Wu, L.Y.; Marsh, T.L.; O’Neill, R.V.; Palumbo, A.V.; Tiedje, J.M. Spatial and Resource Factors Influencing High Microbial Diversity in Soil. Appl. Environ. Microbiol. 2002, 68, 326–334. [Google Scholar] [CrossRef] [PubMed] [Green Version]
  64. Mummey, D.; Holben, W.; Six, J.; Stahl, P. Spatial Stratification of Soil Bacterial Populations in Aggregates of Diverse Soils. Microb. Ecol. 2006, 51, 404–411. [Google Scholar] [CrossRef] [PubMed]
  65. Bohme, L.; Langer, U.; Bohme, F. Microbial Biomass, Enzyme Activities and Microbial Community Structure in Two European Long-Term Field Experiments. Agric. Ecosyst. Environ. 2005, 109, 141–152. [Google Scholar] [CrossRef]
  66. Li, H.; Parent, L.E.; Karam, A.; Tremblay, C. Potential of Sphagnum Peat for Improving Soil Organic Matter, Water Holding Capacity, Bulk Density and Potato Yield in a Sandy Soil. Plant and Soil 2004, 265, 355–365. [Google Scholar] [CrossRef]
  67. Pereira e Silva, M.C.; Dias, A.C.F.; van Elsas, J.D.; Salles, J.F. Spatial and Temporal Variation of Archaeal, Bacterial and Fungal Communities in Agricultural Soils. PLoS ONE 2012, 7, e51554. [Google Scholar] [CrossRef] [PubMed]
  68. de Vries, F.T.; Griffiths, R.I.; Bailey, M.; Craig, H.; Girlanda, M.; Gweon, H.S.; Hallin, S.; Kaisermann, A.; Keith, A.M.; Kretzschmar, M.; et al. Soil Bacterial Networks Are Less Stable under Drought Than Fungal Networks. Nat. Commun. 2018, 9, 3033. [Google Scholar] [CrossRef] [PubMed]
  69. Zinger, L.; Lejon, D.P.; Baptist, F.; Bouasria, A.; Aubert, S.; Geremia, R.A.; Choler, P. Contrasting Diversity Patterns of Crenarchaeal, Bacterial and Fungal Soil Communities in an Alpine Landscape. PLoS ONE 2011, 6, e19950. [Google Scholar] [CrossRef]
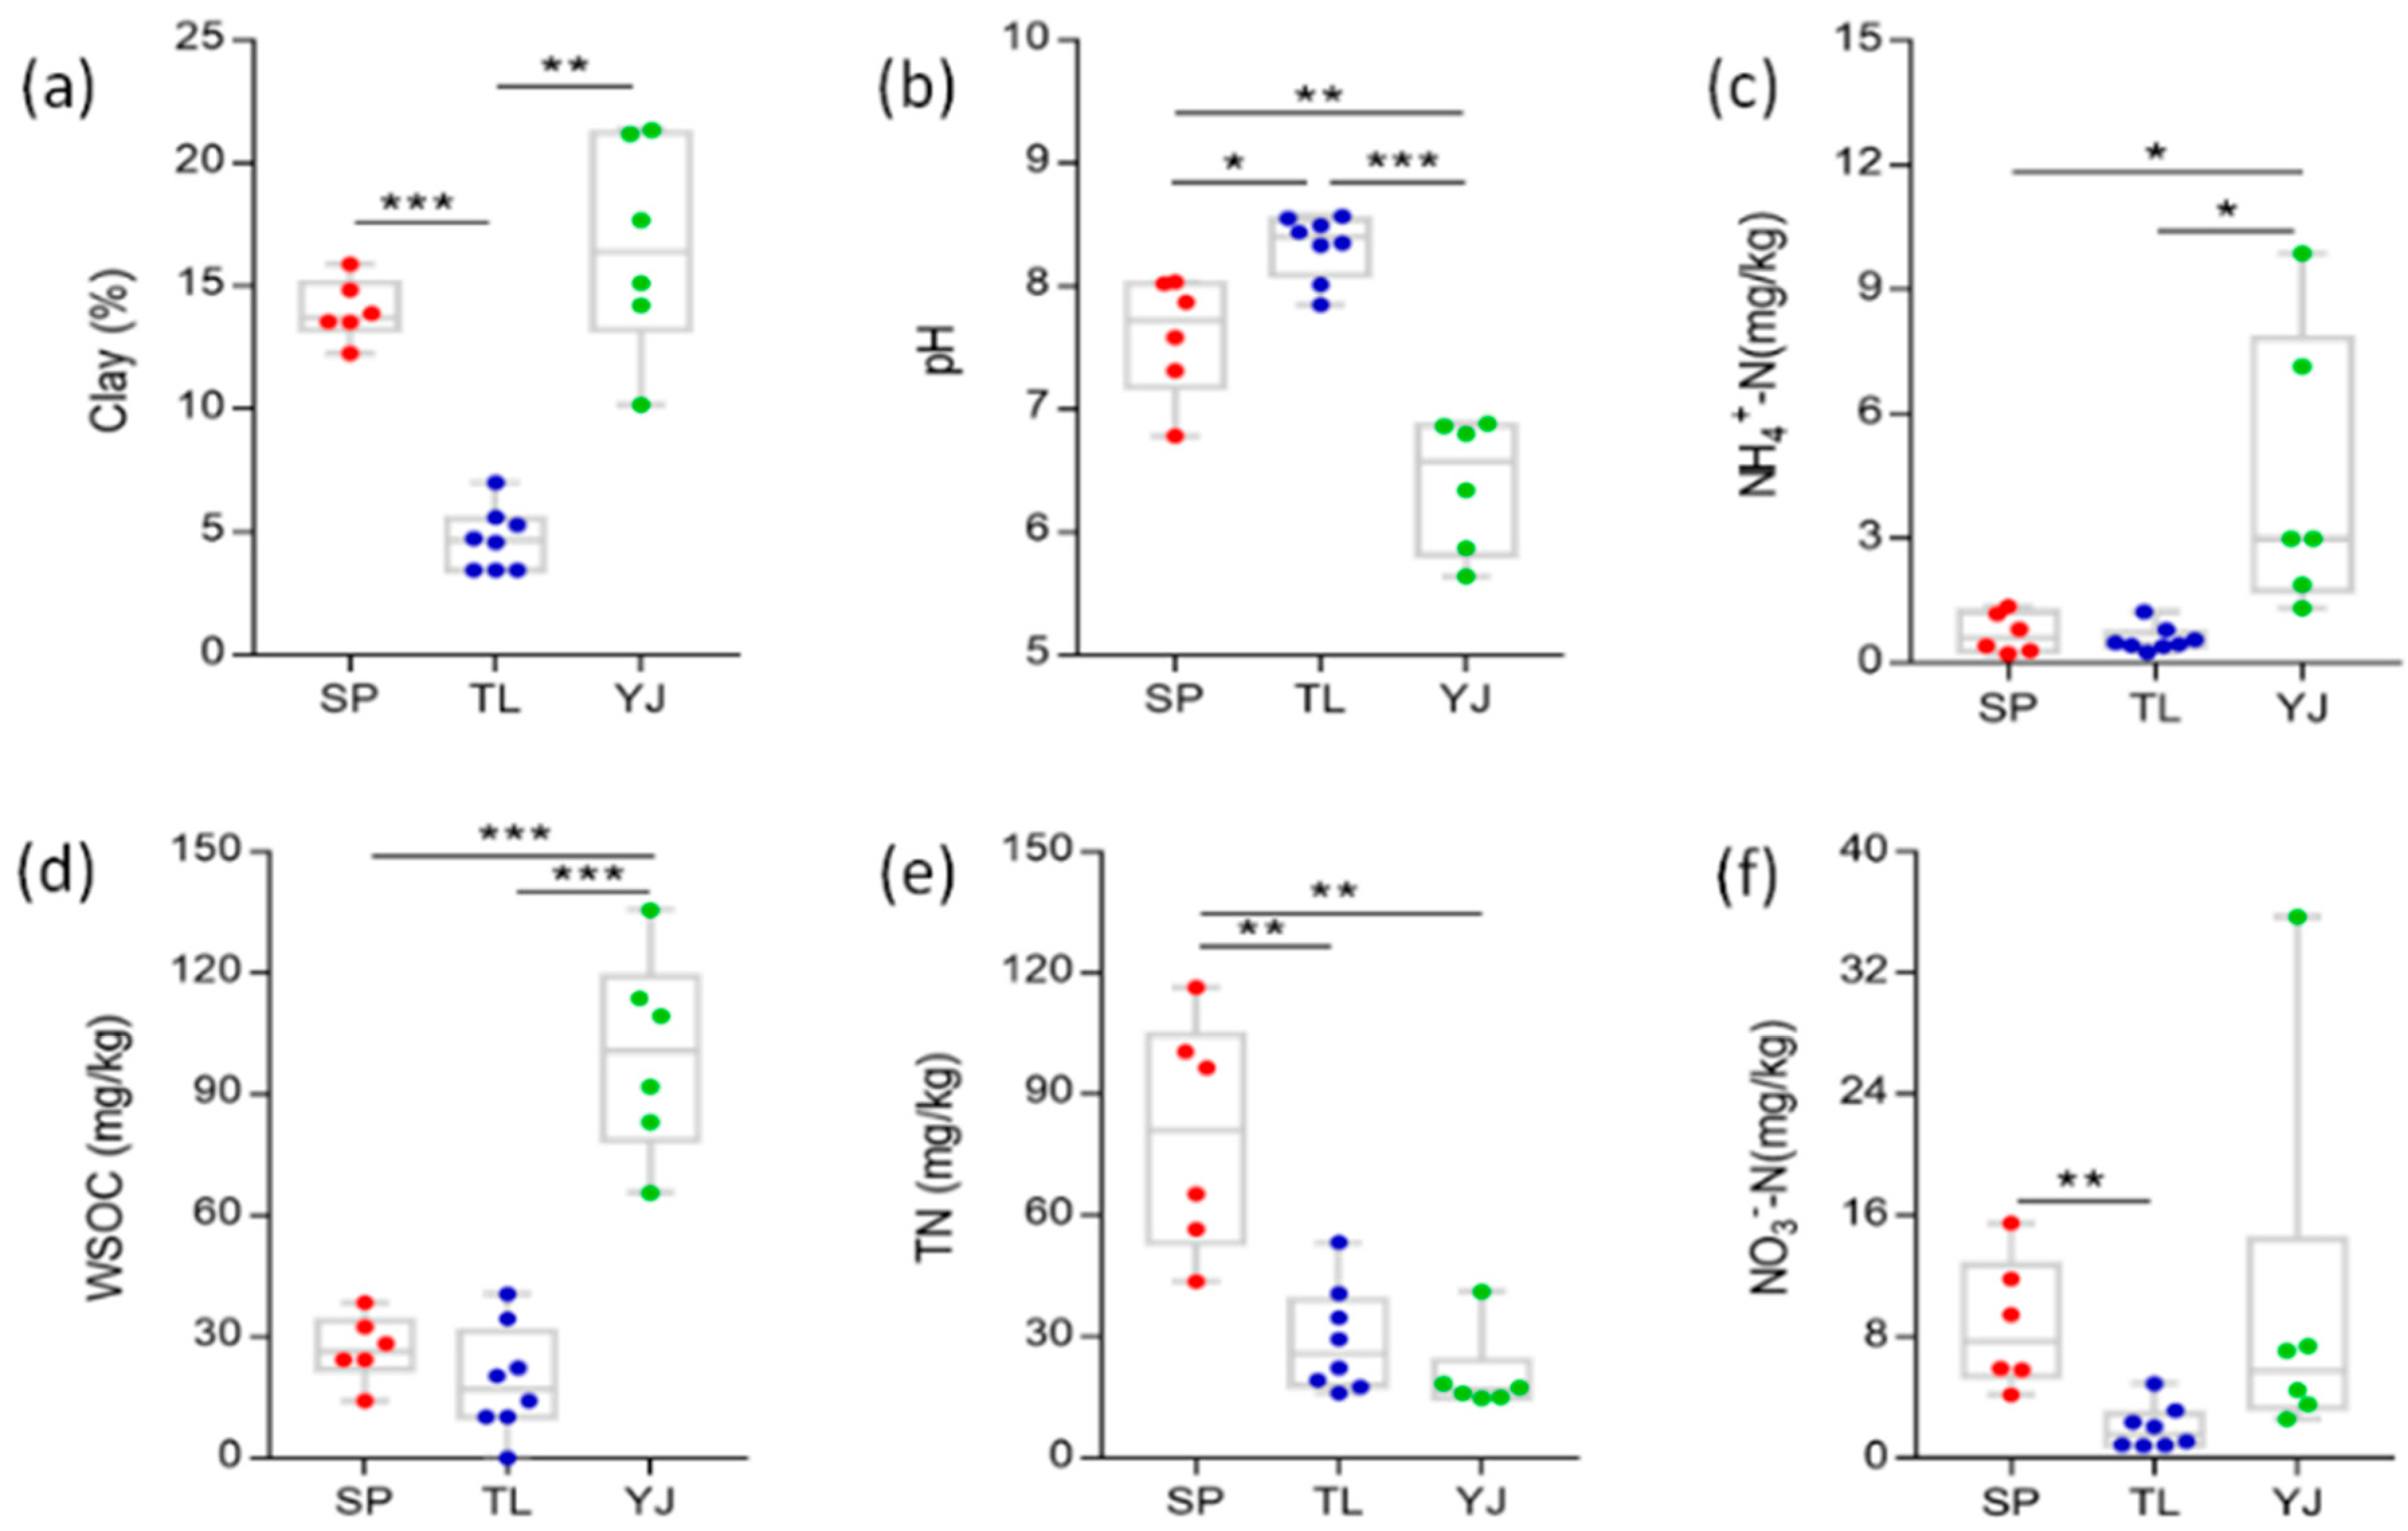
Figure 1. Soil physicochemical properties among crop land (Siping, SP, red dotsr), agricultural-pastoral interlaced land (Tongliao, TL, blue bots), and artificial economic forest land (Yanji, YJ, green dots). (af) represents clay content, pH, NH4–N, WSOC, TN, and NO3–N, respectively. Significant levels of each path were as follows: * p < 0.05, ** p < 0.01, and *** p < 0.001. WSOC, water soluble organic carbon; TN, total soluble nitrogen. Different land use types.
Sustainability 11 03286 g001
Figure 2. Bacterial and fungal community composition at the phyla level (a,c) and class level (b,d) in soils of different land use types, agricultural-pastoral interlaced land (Tongliao, TL), crop land (Siping, SP), and artificial economic forest land (Yanji, YJ).
Sustainability 11 03286 g002
Figure 3. Effect size (LEfSe) analysis of microbial abundance in soil of different land use types, agricultural-pastoral interlaced land (Tongliao), crop land (Siping), and artificial economic forest land (Yanji). Linear discriminant analysis (LDA) scores of fungal biomarkers are on the left side and those of bacterial biomarkers are on the right (a). Rarefaction curves of bacteria (b), and fungi (c).
Sustainability 11 03286 g003
Figure 4. Principal coordinates analysis (PCoA) of the bacterial community (a) and fungal community (b) based on weighted UniFrac distance in soils of different land use types, agricultural-pastoral interlaced land (Tongliao), crop land (Siping), and artificial economic forest land (Yanji).
Sustainability 11 03286 g004
Figure 5. Canonical correspondence analysis (CCA) of environmental variables and the dominant (a) bacterial community (>1%), (b) fungal community (>0.1%), and (c) bacterial classes and (d) fungal classes in soils of different land use types, agricultural-pastoral interlaced land (Tongliao, TL), crop land (Siping, SP), and artificial economic forest land (Yanji, YJ).
Sustainability 11 03286 g005
Figure 6. Network analysis depicting association patterns among the bacterial community (ac) and the fungal community (df) in soils of different land use types, agricultural-pastoral interlaced land (Tongliao), crop land (Siping), and artificial economic forest land (Yanji). The nodes were colored according to modularity class; the size of each node was proportional to the number of the connection, that is, the degree.
Sustainability 11 03286 g006
Table 1. The importance of soil properties under different land use types, agricultural-pastoral interlaced land (Tongliao), crop land (Siping), and artificial economic forest land (Yanji). Data were calculated by Random Forest Tests a.
VariablesTongliaoSipingYanjiMDA b
Clay16.72 **10.35 **7.93 **16.22 **
pH8.44 *0.217.86 *9.31 *
WSOC7.48 **8.08 *14.88 **14.74 **
TN2.9510.70 *6.78 *10.44 *
NO3-N8.16 **6.79 *−0.188.02 **
NH4+-N4.191.867.77 *6.92 *
(a) The importance of each predictor was determined by assessing the decrease in prediction accuracy (that is, increase in the mean square error (MSE) between observations and predication) when the data for the predictor were randomly permuted with 500 trees. (b) MDA, mean decrease accuracy in the overall random forest model. Significant levels of each predictor were as follows: * p < 0.05 and ** p < 0.01.
Table 2. Dissimilarity analyses based on the Bray–Curtis distance of bacterial and fungal community structures in soils of different land use types, agricultural-pastoral interlaced land (Tongliao, TL), crop land (Siping, SP), and artificial economic forest land (Yanji, YJ). Three distance indices were calculated, including mrpp (δ), Adonis (F), and Anosim (R).
BacteriaFungi
δFRδFR
Total0.427 ***7.899 ***0.897 ***0.660 ***5.192 ***0.874 ***
TL vs. SP0.434 **6.710 ***0.831 ***0.715 ***3.457 **0.761 ***
TL vs. YJ0.420 **11.273 ***1.000 ***0.651 ***6.875 **0.959 ***
SP vs. YJ0.427 **5.614 **0.802 **0.606 **5.688 **0.926 **
Significant levels of each predictor are as follows: ** p < 0.01 and *** p < 0.001. TL, SP, and YJ indicate soil samples from Tongliao, Siping, and Yanji, respectively.
Table 3. Partial Mantel tests between soil properties and bacteria and fungi community structures in soils of different land use types, agricultural-pastoral interlaced land (Tongliao, TL), crop land (Siping, SP), and artificial economic forest land (Yanji, YJ).
BacteriaFungi
rprp
Clay0.4310.0010.3290.003
pH0.5110.0010.3520.002
WSOC0.2840.0060.2510.005
TN0.1750.0340.2170.017
NO3-N−0.3720.999−0.2400.999
NH4+-N−0.0910.833−0.2350.998
Table 4. Topological properties of the co-occurence networks of the bacterial and the fungal community in soils of different land use types, agricultural-pastoral interlaced land (Tongliao), crop land (Siping), and artificial economic forest land (Yanji).
Network ParametersBacterialFungal
TongliaoSipingYanjiTongliaoSipingYanji
nodes90110931099124142170
links113723361790217307384
average degree1.2622.1371.6291.7502.1622.276
network diameter866575
modularity0.8930.9670.9770.7640.7420.751
average clustering coefficient0.0840.3030.2620.1580.2200.223
average path length2.0931.5101.4061.6592.0821.914
Table 5. Partial Mantel tests on network connectivity versus the significance of environmental factors in the overall network of the bacterial and the fungal community.
BacteriaFungi
rprp
clay0.1150.0020.0130.337
pH0.2450.0010.1970.002
WSOC0.1710.0010.2320.002
TN−0.1080.999−0.0590.871
NO3-N−0.0680.973−0.1150.981
NH4+-N0.1300.009−0.1060.977
TN, total soluble nitrogen; WSOC, water soluble organic carbon.