Linking Soil Health to Sustainable Crop Production: Dairy Compost Effects on Soil Properties and Sorghum Biomass


1
Department of Biology, Eastern New Mexico University, Portales, NM 88130, USA
2
Department of Plant and Environmental Sciences, New Mexico State University, Las Cruces, NM 88003, USA
3
Agricultural Science Center, New Mexico State University, 2346 State Road 288, Clovis, NM 88101, USA
*
Author to whom correspondence should be addressed.
Sustainability 2019, 11(13), 3552; https://doi.org/10.3390/su11133552
Submission received: 17 May 2019
/
Revised: 11 June 2019
/
Accepted: 24 June 2019
/
Published: 28 June 2019
(This article belongs to the Special Issue Agroecology: Principles and Application for Efficient and Sustainable Agricultural Production)
Abstract
:Dairy compost is utilized in agricultural fields to supplement nutrients, yet its role in optimizing nutrient supply and health of semiarid soils is not clear. A greenhouse study was conducted over two months to evaluate soil properties and forage sorghum production under various compost rates. The study had six treatments and four replications. Treatments included compost application rates at 6.7 (C1), 13.5 (C2), 20.2 (C3), 26.9 (C4), and 33.6 Mg ha−1 (C5) and a control (C0). Soil samples were analyzed for soil organic carbon (SOC), potentially mineralizable carbon (PMC), total nitrogen (N), inorganic N, potentially mineralizable N (PMN), available phosphorus (P), potassium (K), calcium (Ca), magnesium (Mg), and sulfur (S). Plant biomass production and biomass C, N, and lignin contents were also estimated. High compost rates improved soil properties significantly (p < 0.05) indicated by increased SOC, N, P, K, Ca, and cation exchange capacity (CEC). Sorghum biomass production did not increase significantly with compost rate, while shoot N content increased at higher rates of compost. A nutrient management plan that integrates dairy compost application has potential to improve soil health and support sustainable forage production in semiarid regions.
1. Introduction
Increasing awareness of soil health and sustainable agriculture has emphasized the role of the livestock sector—specifically the dairy industry—in crop and forage production in the semiarid southern High Plains of the USA. Dairy cattle not only supply nutrients to crops through manure but also provide milk and milk products. In 2017, total milk production in the USA was 94.83 billion liters [1], which has made the US one of the major producers and exporters of milk in the world. Dairies in the mountainous states, which include New Mexico, Montana, Idaho, Arizona, Utah, Colorado, Wyoming, and Nevada, accounted for 16.4% of total milk production in 2017. In the state of New Mexico, the share of the dairy industry is 45.1% of the total agricultural economy [2]. Manure and compost coming from the cattle industry are not included in this estimate. With an average of 9.7 kg of dry manure produced by a lactating cow each day, 329,000 milking cows produce about 1,164,824 metric tons of dry manure annually in New Mexico [1,3], which supports agricultural production and profitability.
Dairy farmers require a good nutrient management program in forage crops to keep the dairy industry profitable, while maintaining crop production and the quality of soil, feed, and milk and milk products. Different organic or inorganic fertilizers are applied to fulfill the nutrient requirement of crops and improve soil health. Organic fertilizers such as manure and compost are slower in releasing nutrients compared to inorganic fertilizers. However, the compost contributes to soil organic matter storage and increases soil biological activity [4]. The soil organic carbon (SOC) contribution from compost, manure, and other organic sources increases nutrient availability and supports forage production [4,5], benefits agroecosystems by improving soil health and nutrient cycling, and supports the economy of the dairy industry [6,7]. Dairy compost also supports soil aggregation, increases water holding capacity, and enhances soil aeration and permeability [4,5,6]. Furthermore, adding compost to soil increases the soil microbial population, activity, and diversity. High heat generation during composting reduces weed seeds and pathogens [6,8,9]. Well-decomposed compost contains more stable forms of nitrogen (N) than raw manure [6] and is preferred over raw manure for having less odor, volume, weight, and greater ease of handling [10,11,12]. Compost is more beneficial than inorganic fertilizers from a sustainable agriculture perspective [11,13] because chemical fertilizers can have negative impacts on the environment [14]. However, the practice of using compost based on the N content may create an imbalance in plant nutrient availability [10,15]. Compost also contains organically bound N, phosphorus (P), potassium (K), calcium (Ca), and micronutrients, which support crop production through their effects on various physical and chemical processes in the soil [7,10].
The rate of compost application varies from farmer to farmer, but in general, the rate is determined with its N content [7], which depends upon the feed type, bedding materials, confinement time, and the duration of composting [11]. The high rate of compost application often supports crop production by improving soil health and nutrient availability [15], but it can lead to salt accumulation and negatively affect root growth and biomass production. High salt concentration in soils decreases microbial population, affects soil structure, organic matter mineralization, and nutrient availability [16]. Salt accumulation also decreases soil water potential creating a water deficit condition, and subsequently reduces the water use efficiency of crops. A high rate of compost application also accumulates P and K in the soil and thereby increases runoff and leaching of these nutrients, often leading to eutrophication in downstream water bodies [9,12,14,17,18]. In addition, compost-applied soils are at a high risk of ammonia volatilization and breakdown of soil structure because of sodium (Na) accumulation to the soil exchange complex [11].
Sorghum (Sorghum bicolor L. Moench) is one of the important forage crops that support the dairy industry in New Mexico. In 2017 alone, 42,674 metric tons of grain sorghum and 169,643 metric tons of silage sorghum were harvested from 19,424 and 6,879 ha, respectively [2]. Optimizing nutrient supply while minimizing negative environmental impacts due to nutrient leaching could support sustainable sorghum production [19]. The response of compost rate on sorghum, however, also depends on soil type, climate, soil fertility, and management practices [20]. The high rate of cattle feed yard waste increased dry matter biomass of forage sorghum in Amarillo fine clay loam soil, but the response was not significant in Pullman clay loam soil [21]. Increases in shoot biomass and N content in sorghum with the application of N fertilizers, including organic manure, were reported in a rhizobox study under Haplic Fluvisols [13]. A significant positive correlation of supplied NO3−-N with tissue N concentration was observed in wheat (Triticum aestivum L.), barley (Hordeum vulgare L.), pea (Pisum sativum L.), and common bean (Phaseolus vulgaris L.) [22]. Similarly, inorganic N supplement in perennial grasses showed significant differences in shoot N content [23]. Studies on the effects of organic amendments on forage production, specifically the use of composted cattle manure, are limited for semiarid regions of North America. A better understanding of long- and short-term impacts of composted cattle manure will increase forage production and support the farm economy in these semiarid areas.
This study hypothesized that the compost addition would improve soil properties and enhance nutrient content in sorghum to produce quality forage. Specifically, changes in soil health indicators such as SOC, total and inorganic N, available P and K, secondary nutrients (Ca, magnesium (Mg), sulfur (S), and potentially mineralizable carbon (PMC) and potentially mineralizable nitrogen (PMN), as well as estimating plant growth parameters (number of leaves, plant height, and root and shoot biomass), and carbon (C), N, and lignin contents in sorghum plants, were monitored.
2. Materials and Methods
2.1. Experimental Site and Treatments
The experiment was conducted during summer 2018 in a greenhouse at the New Mexico State University Agricultural Science Center (ASC) at Clovis, NM (34°35′N, 103°12′W, and elevation 1348 m above mean sea level). The study area had an average maximum and minimum temperatures of 22.6 °C and 5.3 °C, respectively, with an average annual precipitation of 429 mm [24]. Soil for the experiment was collected from a conventionally tilled field at ASC Clovis, and was classified as an Olton clay loam soil (fine, mixed, superactive, thermic Aridic Paleustolls) in USDA soil classification system [25]. Soil properties and available nutrients concentrations were analyzed at the time of experiment establishment using the procedures outlined in Gavlak et al. [26] (Table 1).
The compost used in this study was obtained from a local dairy farm in Clovis, NM. The compost was processed by aerobic decomposition of straw-free dairy cattle manure stockpiled in a windrow for about three months with repeated turning. A subsample of compost was analyzed for basic chemical characteristics and nutrient concentrations before mixing with the soil in each pot (Table 1).
The experiment had six treatments and four replications organized in a completely randomized design. Treatments included application rates of 6.7 (C1), 13.5 (C2), 20.2 (C3), 26.9 (C4), and 33.6 (C5) Mg ha−1 dairy compost on a wet weight basis (on dry weight basis: C1= 4.13, C2 = 8.27, C3 = 12.4, C4 = 16.5, and C5 = 20.7 Mg ha−1) and a control (C0) treatment with no compost addition. The compost rates were selected based on suggestions from area farmers. Typically, farmers in eastern New Mexico apply 13.5 to 26.9 Mg ha−1 (6 to 12 tons per acre) of dairy compost to their crops. In this study, compost was weighed based on the treatment application rate and thoroughly mixed with 15 kg of soil. Each pot was subjected to a one-time compost application. The mixture was added to 30-cm-deep plastic pots with a capacity of 15.1 liters (4 gallons) and allowed to settle for six days. Pots were watered to bring soil moisture to 75% of field capacity before seeding sorghum. The greenhouse temperature was maintained between 25 to 30 °C throughout the research period. Water was circulated through evaporative cooling pads to maintain the moisture level and temperature inside the greenhouse. The greenhouse was covered with shade cloth to control excessive heating.
2.2. Sorghum Planting, Management, and Data Collection
Eight seeds of sorghum variety NK5418 were sown in each pot. Thinning was done 12 days after sowing, and only three sorghum plants were grown afterward. Hand weeding was done for controlling weeds, and the uprooted weeds were allowed to decompose in the same pot. No chemical pesticides or chemical fertilizers were applied. Watering was done every other day to maintain soil moisture at 17% (75% of the field capacity) at all times. The plants were maintained for 56 days in the greenhouse.
Plant height and number of leaves per plant were observed as growth parameters on 15, 22, 29, 36, 43, and 50 days after sowing (DAS). A wooden meter stick was used to measure the plant height from the soil level to the top of the plant without bending or stretching the leaves. Several leaves were counted, excluding the cotyledon leaves. The root and shoot biomass were estimated at the end of the study.
Sorghum shoots were harvested by clipping off all aboveground biomass using clippers. Harvested shoots were dried in an oven at 65 °C for 96 h to get the dry weight. Samples of approximately 400 g of root-free soil samples were taken from each pot for laboratory analysis. Root biomass was estimated by soaking the rest of the pot soils in a container with tap water for 30 minutes. The soil that adhered to roots was then washed with pressured water flow in a 2-mm sieve. The collected roots were washed thoroughly and dried overnight at room temperature and transferred to an oven (65 °C for 72 h) to get the dry weight.
2.3. Soil and Plant Sampling and Analysis
Soil water content was determined by using a gravimetric method. Soil inorganic N [sum of NO3− and NH4+] was determined by extracting 5-g soil subsamples in 25 mL 1-molar potassium chloride solution and analyzing in an automated TL-2800 single channel ammonia analyzer (Timberline Instruments, Boulder, CO, USA). For estimating PMC, 20 g soil subsamples were incubated for 28 days following the aerobic procedures described in detail in Ghimire et al. [27]. The same incubated soil samples were subjected to estimate PMN using an automated TL-2800 single channel ammonia analyzer. Soil subsamples were sent to a commercial laboratory (Ward laboratories Inc., Kearney, NE, USA) to determine SOC, total and inorganic N, available P and K, secondary nutrients (Ca, Mg, and S), soil pH, electrical conductivity (EC), and cation exchange capacity (CEC).
Root and shoot biomass samples were ground in a Thomas Wiley laboratory mill (Arthur H. Thomas Company, Swedesboro, NJ, USA), passed through a 2-mm screen, and sent to a commercial laboratory (Ward laboratories Inc., Kearney, NE, USA) for the analysis of biomass C and N and lignin contents.
2.4. Statistical Analysis
Data were analyzed using a mixed procedure (PROC MIXED) of Statistical Analysis System (SAS Institute Inc. Cary, NC, USA) in which soil properties and plant nutrient concentrations were response variables, and compost treatments were the explanatory variables. Replication was considered as a random effect in the model. The least-square mean procedure (PROC LSMEANS) was used to separate means at p < 0.05 unless otherwise stated. Pearson correlation coefficient was calculated to estimate the relationship among soil properties and crop biomass production, whereas simple linear regression models were used to predict the dependent variables using correlation (PROC CORR) and regression (PROC REG) procedures, respectively, in SAS.
3. Results
3.1. Basic Soil Properties
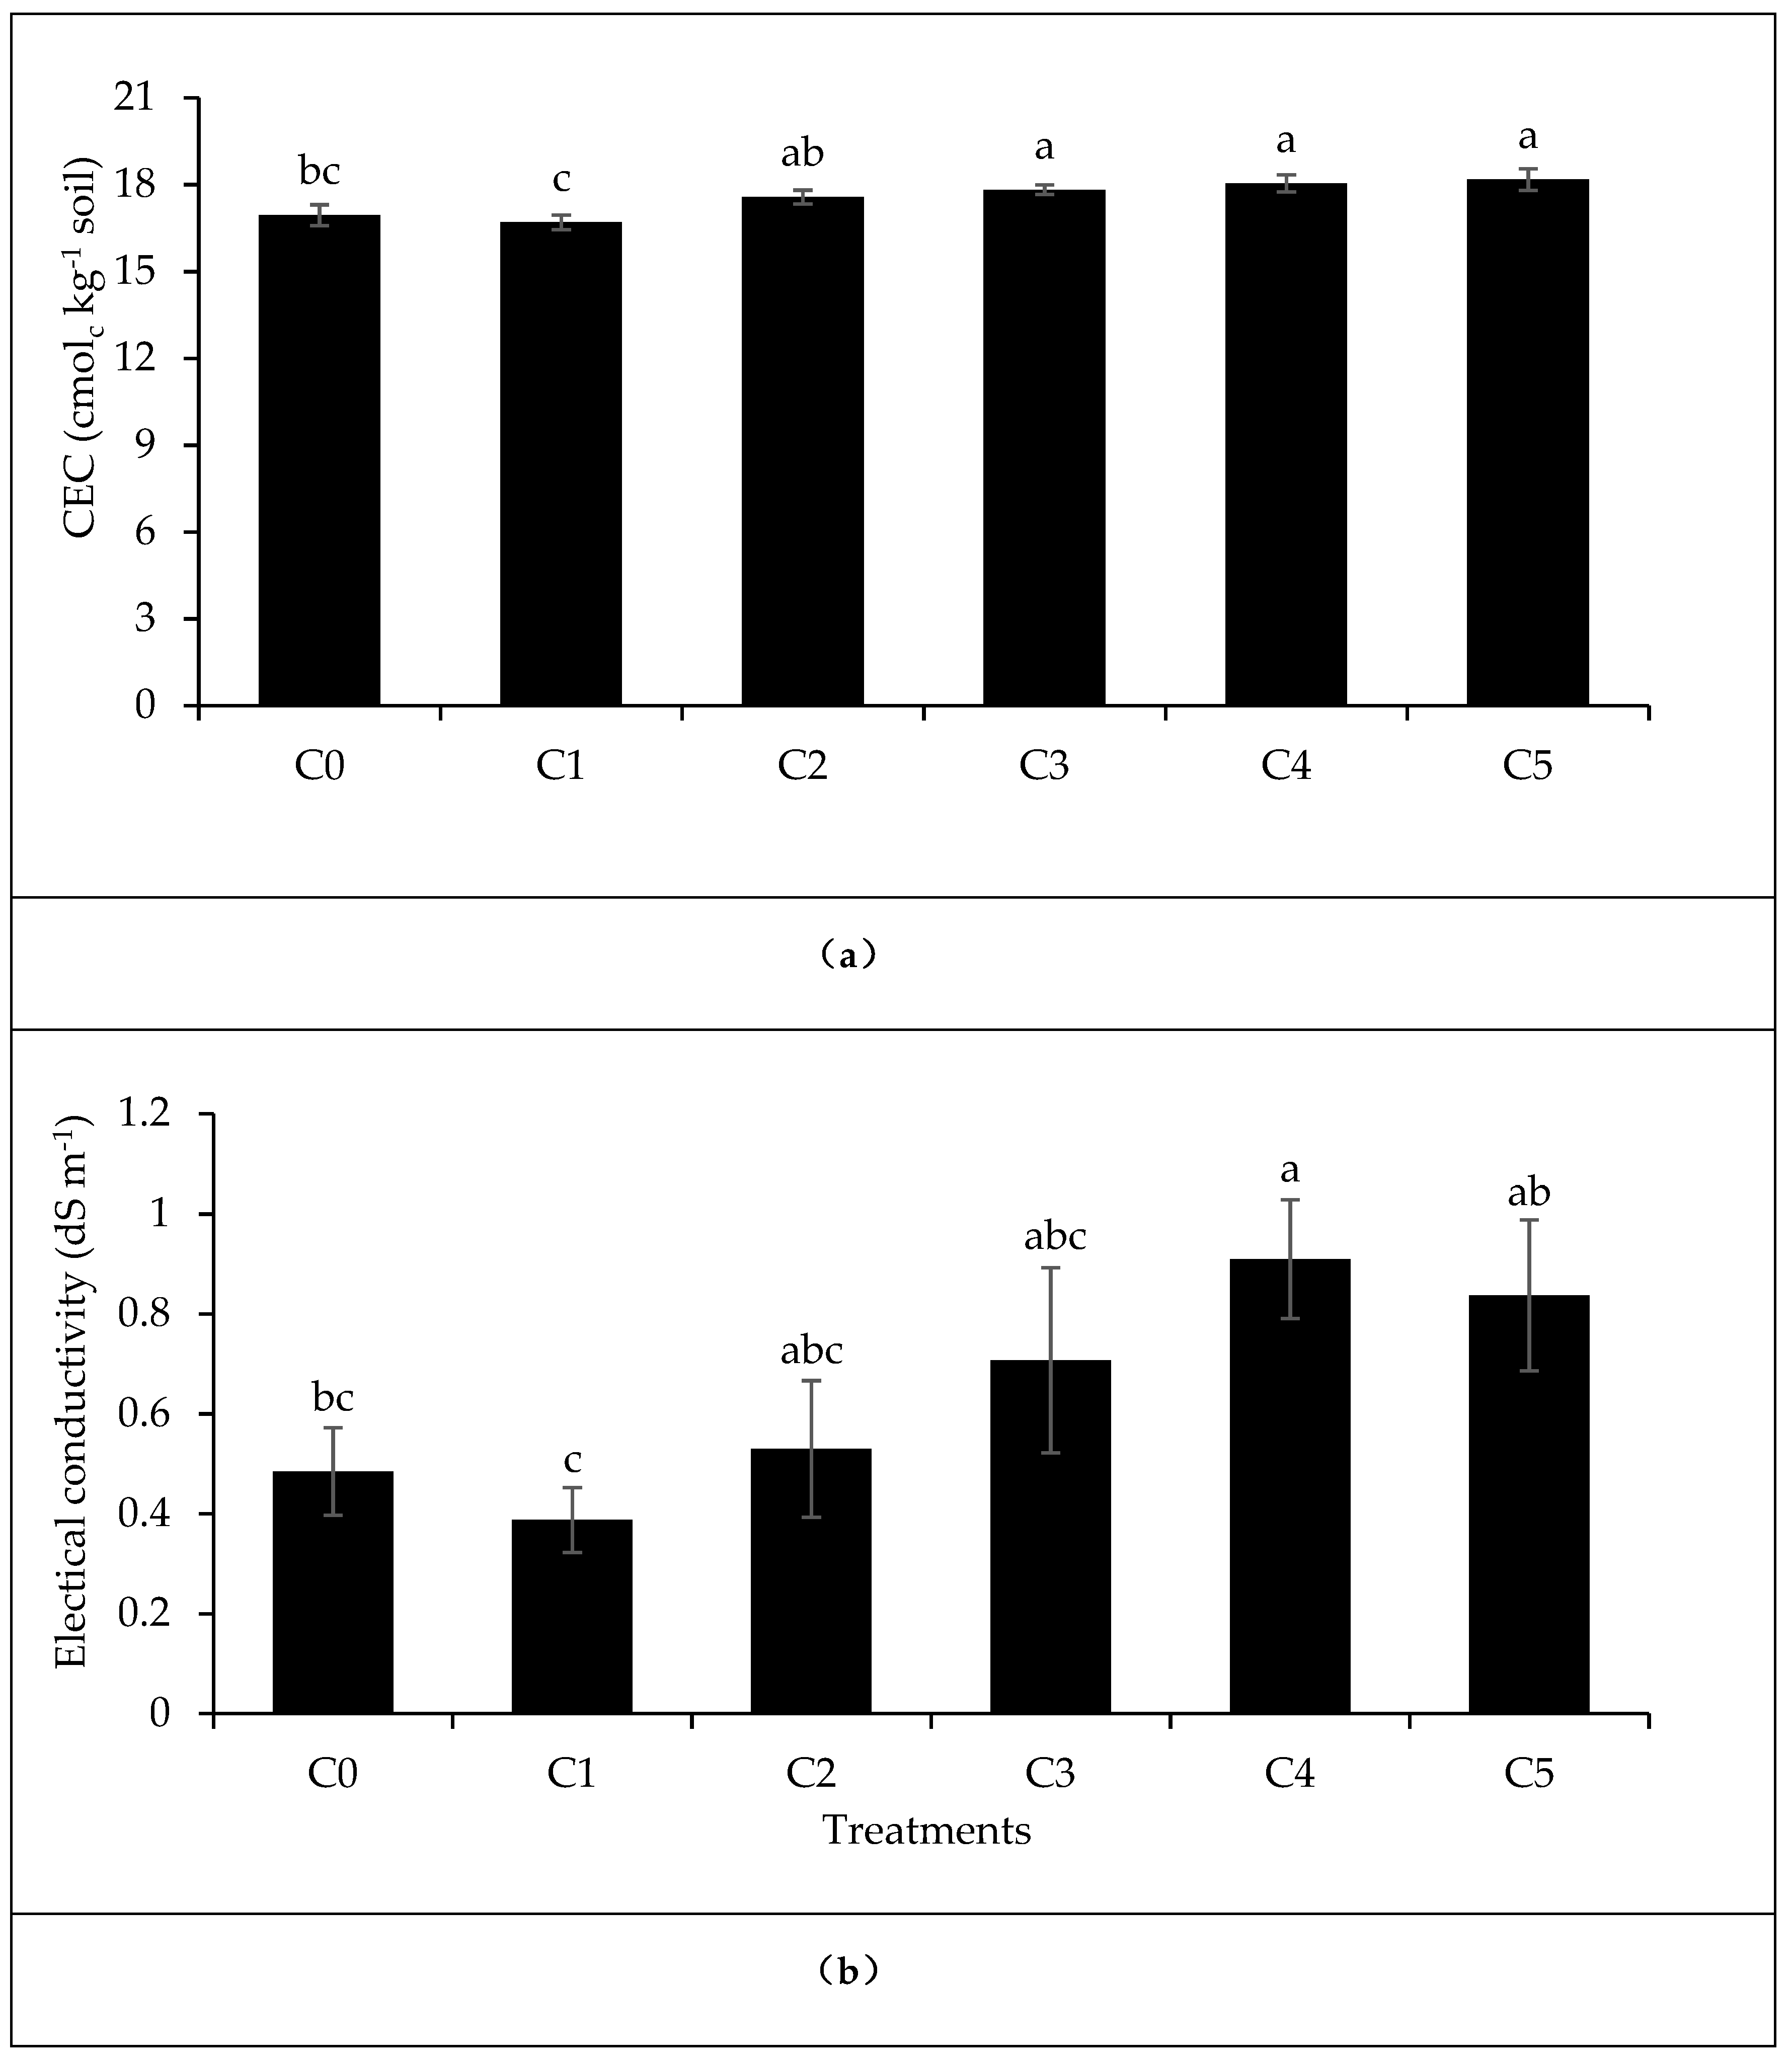
Soil pH was not significantly different among treatments and ranged from 7.4 to 7.8. Soil CEC varied significantly among treatments. It was higher in C3, C4, and C5 by 5% to 9 % than C0 and C1, while C2 was intermediate of C0 and higher compost rate treatments and not different from either (Figure 1). Soil EC increased with compost rate and differed between treatments at p = 0.06 (Figure 1). The EC was 1.16 to 1.35 times higher in C4 and C5 than C1.
3.2. Soil Organic Carbon and Nitrogen Fractions
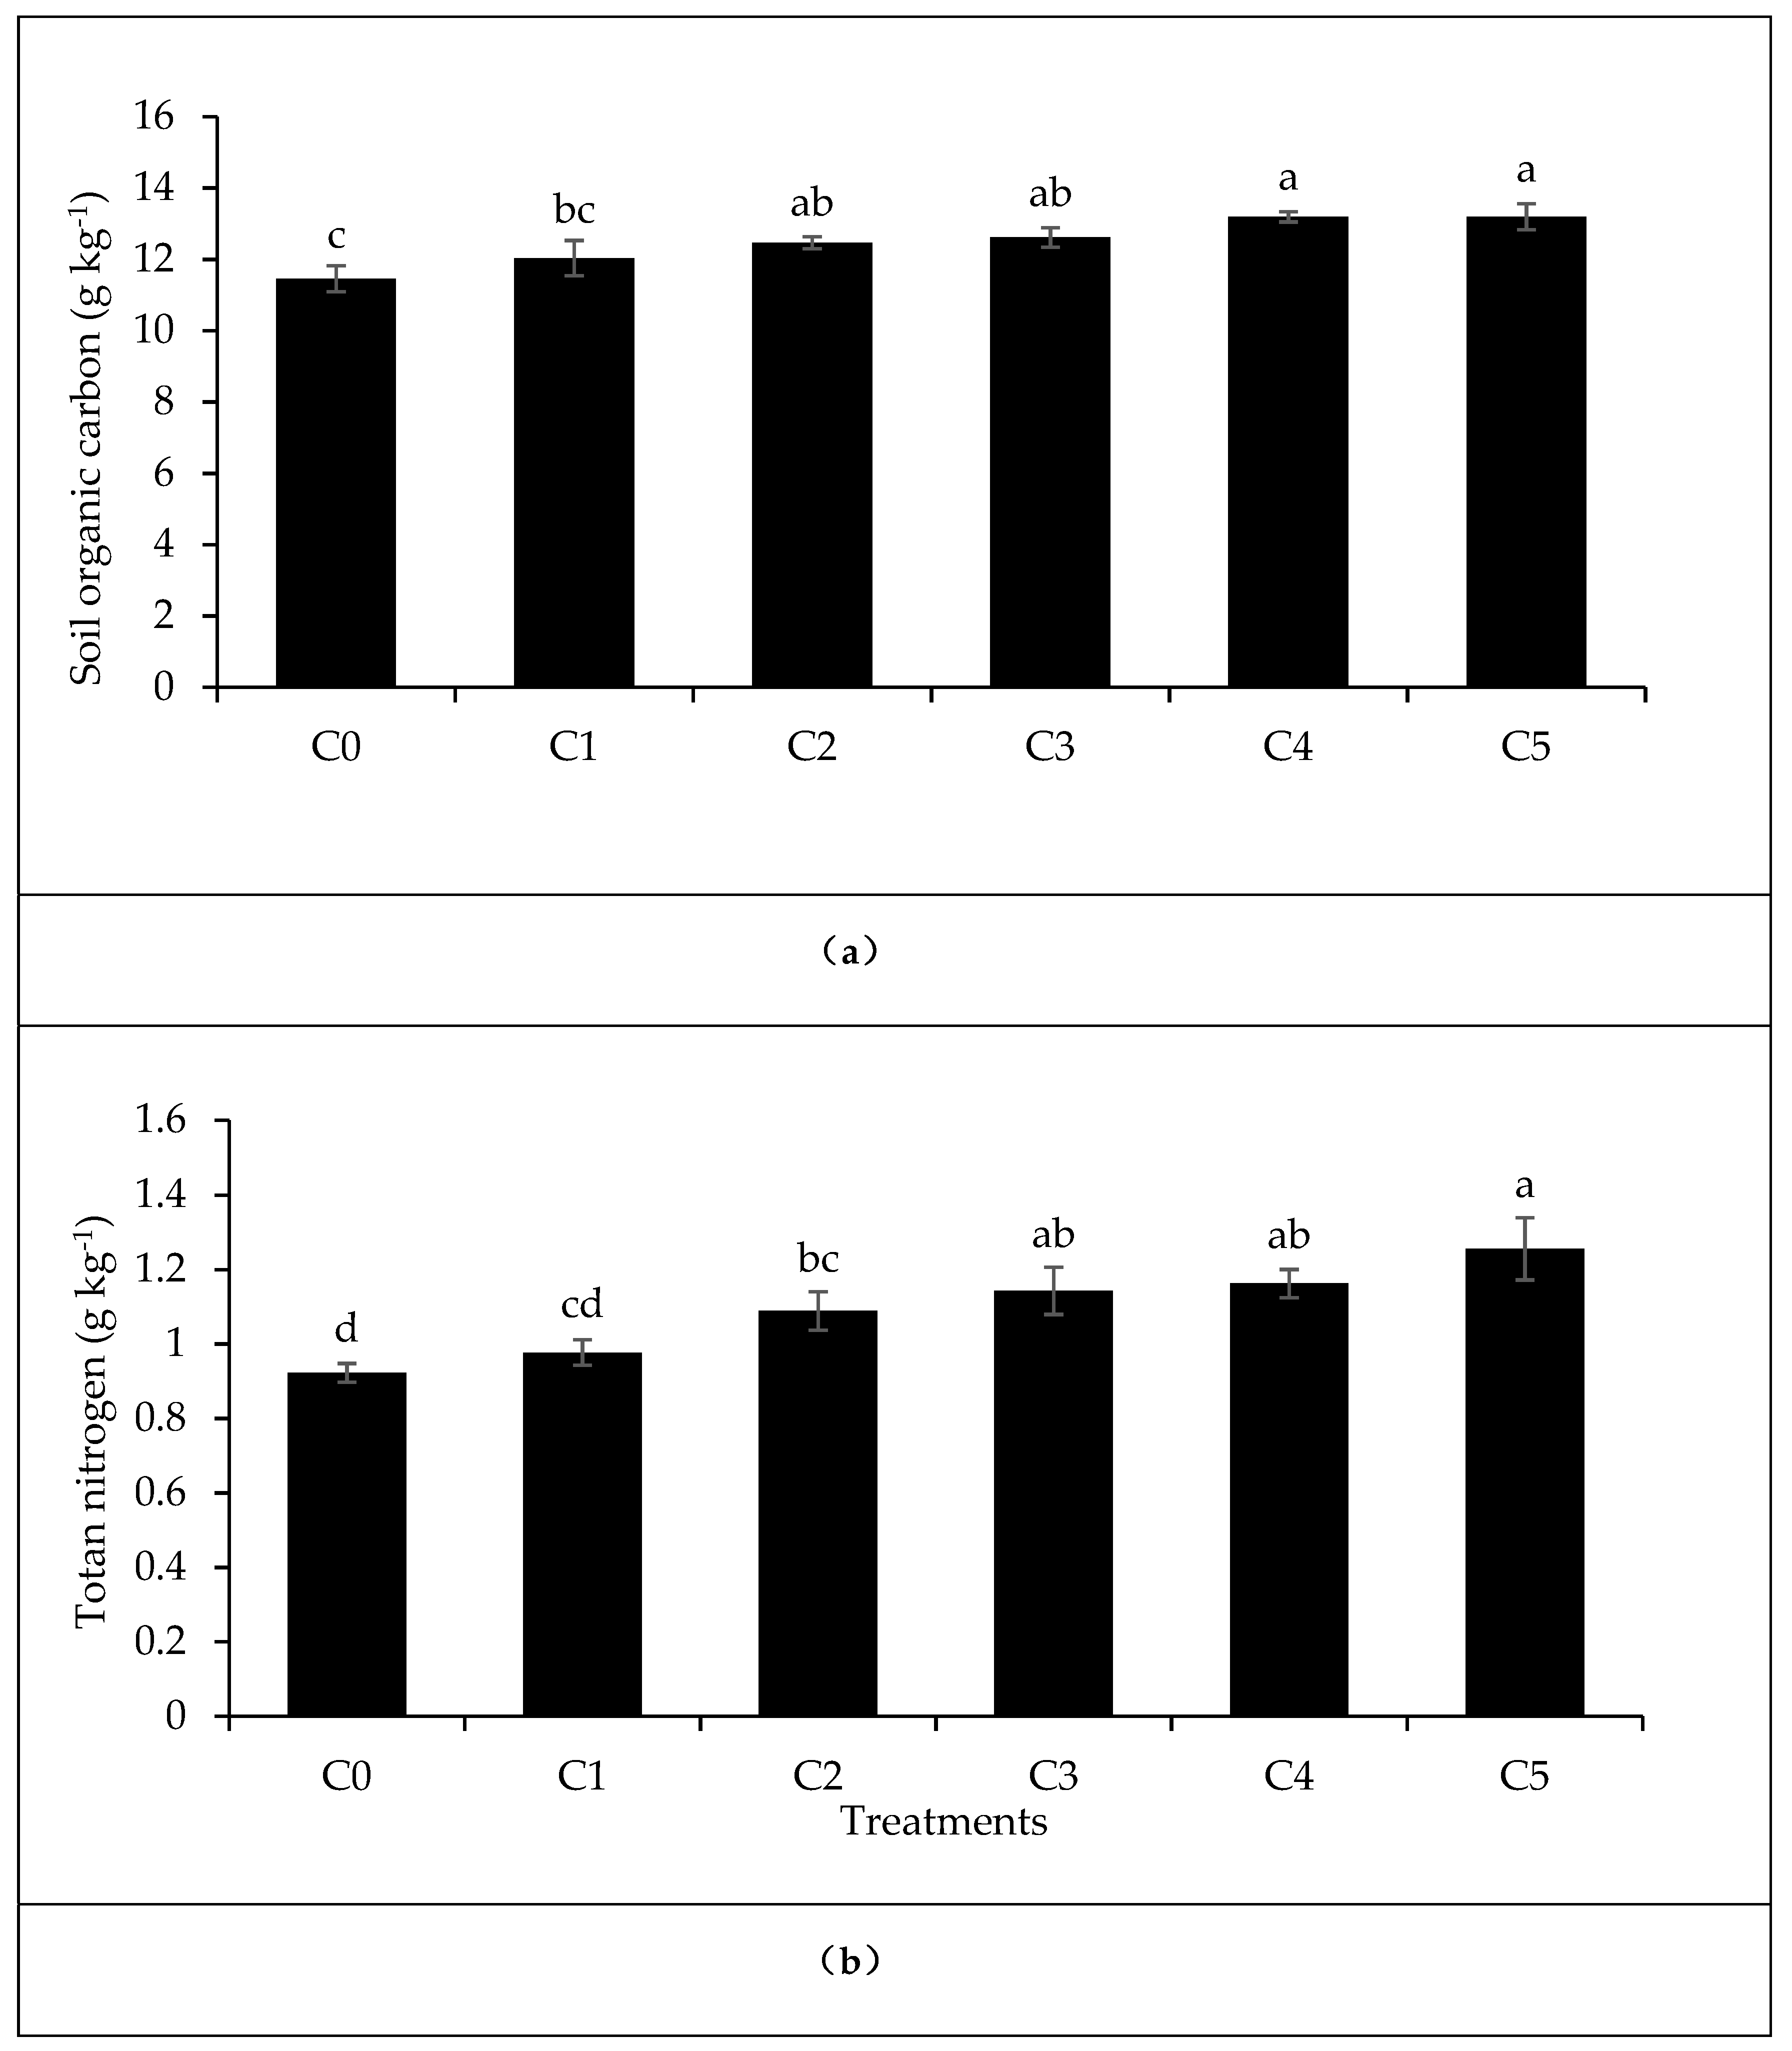
Compost rates had significant effects on SOC content. It was higher in C2, C3, C4, and C5 by 9% to 15% than C0 (Figure 2). However, 72-hr CO2-C mineralization and total PMC content (28-d incubation) did not vary significantly between treatments. The 72-hr CO2-C mineralization was in the range of 0.037 to 0.055 g kg−1 while PMC content was in a range of 0.27 and 0.36 g kg−1 of soil (Table 2). Soil PMC per kg of SOC also showed no significant differences among treatments, and the values ranged between 2.30 to 2.90% of SOC content (Table 2).
Soil total N content increased with compost application rate, and it was significantly higher in C3, C4, and C5 (17% to 36%) than in C0 and C1 (Figure 2). However, inorganic N and PMN showed no significant difference among treatments. Inorganic N content was observed between 4.29 to 13.09 mg kg−1, whereas PMN content was between 6.33 to 17.50 mg kg−1 and not significantly different within treatments. The percentage of inorganic N and PMN in total N content of soils also showed no significant differences among treatments. The percentage of inorganic N and PMN to total N ranged between 0.42 to 1.09 and 0.63 to 1.47, respectively.
3.3. Other Soil Nutrients
Available soil P and K content significantly increased at higher compost rates (Table 3). The P content in soil was highest in C5, which was significantly greater by 14% to 249% than all other treatments. Similarly, soil K content in C0 was lower by 17% to 24% than C4 and C5, while there were no significant differences among C1, C2, C3, and C4. Soil Ca content was significantly greater in C3 and C4 by 6% to 10% than C0 and C1 (Table 3), and no difference was observed among C2, C3, C4, and C5. Soil Na content showed no significant treatment effects and ranged between 0.14 to 0.16 g kg−1. Similarly, soil Mg and S did not vary with compost rate. Availability of nutrients P, K, Ca, Mg, and S significantly decreased with per unit increase in compost rate by metric ton per ha (Table 4).
3.4. Sorghum Growth and Biomass Production
Plant height and number of leaves did not vary significantly among treatments resulting in a nonsignificant difference in root and shoot biomass production. However, tissue N concentration in sorghum shoots significantly differed among compost rates and was higher in C5 by 27% to 39% than C0, C3, and C4 (Table 5). However, no significant differences in shoot N content were observed among C0, C1, C2, C3, and C4. Sorghum root N content and both root and shoot lignin contents did not differ significantly with treatments (Table 5).
3.5. Relationship between Soil Properties and Sorghum Biomass Production
The responses of various soil health indicators with fertilizer application were related (Table 6). Although soil pH was not significantly different among compost rates, it had a significant negative relationship with changes in SOC, inorganic N, PMN, EC, and CEC. Most of the C and N pools were positively related. The 72-hr CO2-C could predict changes in PMC and thereby SOC contents (Figure 3, Table 6). Although there was a visible difference in root biomass volume (Figure 4), no significant correlation was observed between plant biomass and soil nutrients: P, K, Ca, Mg, sulfate-S, inorganic N, and PMN at p < 0.05. The SOC was correlated (r2 = 0.37) with shoot biomass only at p = 0.07.
4. Discussion
The results of this study supported our hypothesis that compost application improved soil health and nutrient cycling, as indicated by changes in SOC and nutrients. Soils in the semiarid southern High Plains are low in organic matter content and soil fertility [27]. Good compost can increase SOC, total N, and other nutrients [18,28]. Boardman et al. [15] found increased NO3−-N with increasing compost rates. In our study, SOC and total N increased, but labile SOC and N fractions did not increase significantly with compost application rate. Severe disturbance due to compost mixing and preparation of the pot experiment may have produced a large amount of labile C and N pools and attenuated the differences due to compost additions. However, the decrease in soil inorganic N concentration and PMN compared to baseline soil N and the difference in sorghum biomass N at harvest suggest a difference in soil N mineralization with compost rate. Sorghum, in its vegetative stage, absorbs a large fraction of its total nutrient need [29]. The positive correlation of inorganic N (r2 = 0.42, p < 0.05) and PMN (r2 = 0.49, p < 0.05) with SOC content also suggests increased N-mineralization with compost application (Table 6). The increase in N mineralization at high compost application rate is associated with high microbial biomass and activity [16]. Although microbial activity was not measured directly, numerically higher C mineralization as indicated by 72-hr CO2-C at higher compost rate suggests changes in microbial activity and thereby improvements in soil health, nutrient cycling, and SOC storage. In addition, there was a positive relationship between 72-hr CO2-C mineralization and PMC (r2 = 0.77, p < 0.001), and both PMC and 72-hr CO2-C correlated with SOC (Table 6). There is increasing interest in rapid estimation of changes in soil health, and 72-hr CO2-C mineralization can serve this purpose. In line with our study, increase in PMC and microbial biomass C with the increasing rate of short-term CO2 flush was observed in rewetted samples [30]. Several studies report increased SOC components with compost addition [12,28,31].
In addition, compost application increased the availability of exchangeable cations such as Ca++, K+, and Mg++ possibly because the mineralization process of compost releases H+ ions, creating favorable conditions for cation exchange, a result consistent with a study by Miller et al. [32]. Studies show an increase in soil pH of acidic soils with compost application [6,33]. However, soil pH did not differ among treatments in our study. The soil and compost used in this study had a pH of 7.2 and 8.0, respectively, before establishing the experiment. Appreciable changes might not be observed with a one-time application of compost. The lack of difference could also be due to the short-term nature of the study. Interestingly, soil pH had a negative correlation with SOC, inorganic N, and PMN, suggesting a slight decrease in soil pH with increasing compost rate (Table 6). Similar results were obtained in other studies [34,35]. The significant increase in EC with increasing compost rates could be problematic, but in this study, compost application changed soil EC only at p = 0.06, unlike most compost studies [9,12,18,34]. Depleted soils of semiarid regions are vulnerable to salt accumulation, which could negatively affect soil health and crop production. Therefore, salt accumulation should be carefully considered when planning for continuous, long-term application of a high rate of compost in crop and forage fields.
Organic matter addition in soil reduces the complexes of P formed with iron (Fe), aluminum (Al), and Ca, thus releasing the phosphates in soil solution. This might be the reason for the greater response of available P to a compost application. Enhanced moisture-holding capacity with compost addition also favors in soil P availability [34]. It may also be due to the transformation of compost-associated P to plant-available forms of P [18]. Also, the sharp decrease in available soil P content after sorghum harvest suggested crop uptake and removal, although the crop P concentration was not estimated in this study (Table 1 and Table 3). Similarly, high K content with higher compost rates might be due to K addition from the compost [12,34,36,37]. Use of large quantities of compost and other nutrient-rich organic amendments could be of environmental concern because the loss of nutrient-rich topsoil and compost can lead to eutrophication in nearby water bodies [6]. The calcareous soils in the semiarid southwestern US may immobilize available P and impede possible leaching of excess P along the profile [18]. Soil Mg content did not differ with compost addition, as observed in a previous study [36]. The Ca, Mg, and S contents in sorghum plants were not estimated in this study, so the soil-plant balance of Ca, Mg, and S could not be quantified. However, nutrient (Ca, Mg, and S) contents were higher before planting than at sorghum harvest, which suggests crop removal of these nutrients. Increased CEC with increasing compost rates also suggests the increased bioavailability of nutrients, especially Ca and Mg. Consistent with this study, Whalen et al. [37] found a significant increase in soil P, K, Ca, and Mg with increased cattle manure after eight weeks of incubation. However, with a unit increase in compost rate, there was a decreasing rate of increase in nutrient availability for P, K, Ca, Mg, and S.
Improving soil health and nutrient cycling through compost application has environmental as well as agronomic significance. Studies have shown a positive correlation between total available amino acids in the soil rhizosphere and plant N content [13,29]. Organic and inorganic N supplemented by compost might have been utilized by sorghum plants during their growth and increased shoot N content. In a rhizobox study, sorghum biomass production and plant N concentration were 1.4 and 1.57 times higher, respectively, with than without cattle manure addition [13]. Similar results of an increase in N content with manure addition were reported in giant reed (Arundo donax L.) [7] and coastal bermudagrass [Cynodon dactylon (L.) Pers.] [10]. Likewise, a significant increase in root and shoot biomass was observed with manure amendment on maize (Zea mays L.) [34]. In our study, a one-time compost application did not increase sorghum biomass (root and shoot) or plant growth parameters (plant height and number of leaves), and there was no significant positive correlation between soil health responses and crop yield. However, tissue N content increased with increasing compost application. Compost also appeared to increase fine roots (Figure 4), although total biomass was not statistically different. Measurement of root length density may show the difference between compost rates. Changes in soil health due to a one-time application of compost may not be enough to supply nutrients that significantly increase sorghum root and aboveground biomass production. Considering compost nutrient contents, C1, C2, C3, C4, and C5 could supply 71.8, 144, 216, 287, and 359 kg N ha−1 and 4.4, 8.8, 13.1, 17.5, and 21.9 kg P ha−1, respectively. Although the added compost had a large number of nutrients, it might have had more recalcitrant fractions of these nutrients, which take a long time to release. Increased EC might also have interfered nutrient uptake and crop growth. A long-term field study will improve our understanding of compost responses to sustained improvements in soil health and crop productivity. This study suggests a need for rational decision making based on the knowledge of nutrient supply from compost, crop requirements, and salt accumulation to improve crop responses to compost additions.
5. Conclusions
Compost addition improved soil health and increased the quality of forage sorghum as indicated by high N content in shoot biomass. Compost increased SOC, total N, and other nutrients in the soil, but the labile SOC fractions were not affected by the application rates. The high rate of compost also increased EC, suggesting the possibility of salt accumulation. Although the study showed positive results on quality forage production with compost addition, shoot biomass did not change with compost application rate. A long-term field study may improve our understanding of the effects of compost on soil health and sustainability of forage production system. This study suggests a need for careful consideration of tradeoffs between soil health benefits and potential negative impacts due to salt accumulation when selecting a compost application rate in semiarid regions.
Author Contributions
R.G. designed the experiment; P.A. performed the experiment; P.A. and R.G. analyzed the data; R.G. contributed reagents/materials/ analysis tools; R.G. and Y.C. facilitated in funding acquisition; P.A. and R.G. wrote the paper, Y.C. reviewed, and all authors revised the manuscript.
Funding
This research was supported by initial institutional award provided to Dr. Ghimire from the Office of Vice-president of Research (startup funding) and additional support from Agricultural Experiment Station, Agricultural Science Center at Clovis.
Conflicts of Interest
The authors declare no conflict of interest. The funders had no role in the design of the study; in the collection, analyses, or interpretation of data; in the writing of the manuscript, or in the decision to publish the results.
References
- USDA Dairy Data: Milk Cows and Production by State and Region in 2017. Available online: https://www.ers.usda.gov/topics/animal-products/dairy/ (accessed on 8 March 2019).
- New Mexico Agricultural Statistics, 2017. Available online: https://www.nass.usda.gov/Statistics_by_State/ (accessed on 8 March 2019).
- Nennich, T.; Harrison, J.H.; Vanwieringen, L.M.; Meyer, D.; Heinrichs, A.; Weiss, W.P.; St-Pierre, N.R.; Kincaid, R.; Davidson, D.L.; Block, E. Prediction of manure and nutrient excretion from dairy cattle. J. Diary. Sci. 2005, 88, 3721–3733. [Google Scholar] [CrossRef]
- Delgado, J.; Follett, R. Carbon and nutrient cycles. J. Soil Water Conserv. 2002, 57, 455–464. [Google Scholar]
- El-Mageed, T.A.A.; El-Samnoudi, I.M.; Ibrahim, A.E.A.M.; El Tawwab, A.R.A. Compost and mulching modulates morphological, physiological responses and water use efficiency in (Sorghum bicolor L. Moench) under low moisture regime. Agric. Water Manag. 2018, 208, 431–439. [Google Scholar] [CrossRef]
- Butler, T.J.; Muir, J.P. Dairy manure compost improves soil and increases tall wheatgrass yield. Agron. J. 2006, 98, 1090–1096. [Google Scholar] [CrossRef]
- Ceotto, E.; Castelli, F.; Moschella, A.; Diozzi, M.; Di Candilo, M. Cattle slurry fertilization to giant reed (Arundo donax L.): Biomass yield and nitrogen use efficiency. BioEnergy Res. 2015, 8, 1252–1262. [Google Scholar] [CrossRef]
- De Araújo, A.S.F.; de Melo, W.J.; Singh, R.P. Municipal solid waste compost amendment in agricultural soil: Changes in soil microbial biomass. Rev. Environ. Sci. Biotechnol. 2010, 9, 41–49. [Google Scholar] [CrossRef]
- Eghball, B.; Power, J.F. Phosphorus-and nitrogen-based manure and compost applications corn production and soil phosphorus. Soil Sci. Soc. Am. J. 1999, 63, 895–901. [Google Scholar] [CrossRef]
- Helton, T.J.; Butler, T.J.; McFarland, M.L.; Hons, F.M.; Mukhtar, S.; Muir, J.P. Effects of dairy manure compost and supplemental inorganic fertilizer on coastal bermudagrass. Agron. J. 2008, 100, 924–930. [Google Scholar] [CrossRef]
- Muñoz, G.R.; Kelling, K.A.; Rylant, K.E.; Zhu, J. Field evaluation of nitrogen availability from fresh and composted manure. J. Environ. Qual. 2008, 37, 944–955. [Google Scholar] [CrossRef]
- Sadeghpour, A.; Ketterings, Q.M.; Vermeylen, F.; Godwin, G.S.; Czymmek, K.J. Soil properties under nitrogen-vs. phosphorus-based manure and compost management of corn. Soil Sci. Soc. Am. J. 2016, 80, 1272–1282. [Google Scholar] [CrossRef]
- Chu, Q.; Sha, Z.; Nakamura, T.; Oka, N.; Osaki, M.; Watanabe, T. Differential responses of soybean and sorghum growth, nitrogen uptake, and microbial metabolism in the rhizosphere to cattle manure application: A rhizobox study. J. Agric. Food Chem. 2016, 64, 8084–8094. [Google Scholar] [CrossRef] [PubMed]
- Garnett, T.; Conn, V.; Kaiser, B.N. Root based approaches to improving nitrogen use efficiency in plants. Plant Cell Environ. 2009, 32, 1272–1283. [Google Scholar] [CrossRef] [PubMed]
- Boardman, D.L.; Easterby, S.; Clark, K.M.; Kitchen, N.R.; Staples, J.S.; Reinbott, T.M.; Kremer, R.J. Do tillage, cover crops, and compost management within organic grain cropping affect greenhouse gas emissions? Agron. J. 2018, 110, 1893–1904. [Google Scholar] [CrossRef]
- Hodges, S.C. Soil Fertility Basics; Soil Science Extension, North Carolina State University: Raleigh, NC, USA, 2010. [Google Scholar]
- Schlegel, A. Effect of composted manure on soil chemical properties and nitrogen use by grain sorghum. J. Prod. Agric. 1992, 5, 153–157. [Google Scholar] [CrossRef]
- Mikha, M.M.; Benjamin, J.G.; Vigil, M.F.; Poss, D.J. Manure and tillage use in remediation of eroded land and impacts on soil chemical properties. PLoS ONE 2017, 12, e0175533. [Google Scholar] [CrossRef] [PubMed]
- Sainju, U.M.; Allen, B.L.; Lenssen, A.W.; Ghimire, R.P. Root biomass, root/shoot ratio, and soil water content under perennial grasses with different nitrogen rates. Field Crop. Res. 2017, 210, 183–191. [Google Scholar] [CrossRef] [Green Version]
- Bolinder, M.; Angers, D.; Bélanger, G.; Michaud, R.; Laverdière, M. Root biomass and shoot to root ratios of perennial forage crops in eastern Canada. Can. J. Plant Sci. 2002, 82, 731–737. [Google Scholar] [CrossRef] [Green Version]
- Miller, B.; Parker, D.; Sweeten, J.; Robinson, C. Response of seven crops and two soils to application of beef cattle feedyard effluent. Trans. ASAE 2001, 44, 309–315. [Google Scholar] [CrossRef]
- Andrews, M.; Raven, J.; Sprent, J. Environmental effects on dry matter partitioning between shoot and root of crop plants: Relations with growth and shoot protein concentration. Ann. Appl. Biol. 2001, 138, 57–68. [Google Scholar] [CrossRef]
- Heggenstaller, A.H.; Moore, K.J.; Liebman, M.; Anex, R.P. Nitrogen influences biomass and nutrient partitioning by perennial, warm-season grasses. Agron. J. 2009, 101, 1363–1371. [Google Scholar] [CrossRef]
- Western Regional Climate Center. Available online: https://wrcc.dri.edu/ (accessed on 8 March 2019).
- USDA Soil Survey Staff. Available online: https://websoilsurvey.sc.egov.usda.gov (accessed on 8 March 2019).
- Gavlak, R.; Horneck, D.; Miller, R.O. Soil, Plant and Water Reference Methods for the Western Region, 3rd ed.; WCC-103 Publication: Fort Collins, CO, USA, 2005. [Google Scholar]
- Ghimire, B.; Ghimire, R.; VanLeeuwen, D.; Mesbah, A. Cover crop residue amount and quality effects on soil organic carbon mineralization. Sustainability 2017, 9, 2316. [Google Scholar] [CrossRef]
- Tian, W.; Wang, L.; Li, Y.; Zhuang, K.; Li, G.; Zhang, J.; Xiao, X.; Xi, Y. Responses of microbial activity, abundance, and community in wheat soil after three years of heavy fertilization with manure-based compost and inorganic nitrogen. Agric. Ecosyst. Environ. 2015, 213, 219–227. [Google Scholar] [CrossRef]
- Barbanti, L.; Grigatti, M.; Ciavatta, C. Nitrogen release from a 15N-labeled compost in a sorghum growth experiment. J. Plant Nutr. Soil Sci. 2011, 174, 240–248. [Google Scholar] [CrossRef]
- Franzluebbers, A.; Haney, R.; Honeycutt, C.; Schomberg, H.H.; Hons, F. Flush of carbon dioxide following rewetting of dried soil relates to active organic pools. Soil Sci. Soc. Am. J. 2000, 64, 613–623. [Google Scholar] [CrossRef]
- Maillard, É.; Angers, D.A. Animal manure application and soil organic carbon stocks: A meta-analysis. Glob. Chang. Biol. 2014, 20, 666–679. [Google Scholar] [CrossRef] [PubMed]
- Miller, J.; Beasley, B.; Drury, C.; Larney, F.; Hao, X. Influence of long-term application of composted or stockpiled feedlot manure with straw or wood chips on soil cation exchange capacity. Compos. Sci. Util. 2016, 24, 54–60. [Google Scholar] [CrossRef]
- Ginting, D.; Kessavalou, A.; Eghball, B.; Doran, J.W. Greenhouse gas emissions and soil indicators four years after manure and compost applications. J. Environ. Qual. 2003, 32, 23–32. [Google Scholar] [CrossRef]
- Aziz, T.; Ullah, S.; Sattar, A.; Nasim, M.; Farooq, M.; Khan, M.M. Nutrient availability and maize (Zea mays) growth in soil amended with organic manures. Int. J. Agric. Biol. 2010, 12, 621–624. [Google Scholar]
- Agbede, T.; Ojeniyi, S.; Adeyemo, A. Effect of poultry manure on soil physical and chemical properties, growth and grain yield of sorghum in southwest, Nigeria. Am. Eurasian J. Sustain. Agric. 2008, 2, 72–77. [Google Scholar]
- Qian, P.; Schoenau, J.; King, T.; Japp, M. Effect of repeated manure application on potassium, calcium and magnesium in soil and cereal crops in Saskatchewan. Can. J. Soil Sci. 2005, 85, 397–403. [Google Scholar] [CrossRef]
- Whalen, J.K.; Chang, C.; Clayton, G.W.; Carefoot, J.P. Cattle manure amendments can increase the pH of acid soils. Soil Sci. Soc. Am. J. 2000, 64, 962–966. [Google Scholar] [CrossRef]
Figure 1.
Cation exchange capacity (CEC) (a) and electrical conductivity (EC) (b) of soils at sorghum harvest under different compost application rates. Treatments C0, C1, C2, C3, C4, and C5 represent compost rates of 0, 6.7, 13.5, 20.2, 26.9, and 33.6 Mg ha−1, respectively. Bars above the mean are mean ± standard error (n = 4). Means accompanied by different lowercase letters are significantly different at p < 0.05 for CEC and p = 0.06 for EC (Tukey test).

Figure 2.
Soil organic carbon (a) and total nitrogen (b) at sorghum harvest under different rates of compost. Treatments C0, C1, C2, C3, C4, and C5 represent compost rates of 0, 6.7, 13.5, 20.2, 26.9, and 33.6 Mg ha−1, respectively. Bars above the mean are mean ± standard error (n = 4). Means accompanied by different lowercase letters are significantly different at p < 0.05 (Tukey test).

Figure 3.
Relationship between potentially mineralizable carbon and carbon mineralized in the first 72-h of incubation (n = 24).
Figure 3.
Relationship between potentially mineralizable carbon and carbon mineralized in the first 72-h of incubation (n = 24).

Figure 4.
Root biomass with compost treatments at harvest. Treatments C0, C1, C2, C3, C4, and C5 represent compost rates of 0, 6.7, 13.5, 20.2, 26.9, and 33.6 Mg ha−1, respectively.
Figure 4.
Root biomass with compost treatments at harvest. Treatments C0, C1, C2, C3, C4, and C5 represent compost rates of 0, 6.7, 13.5, 20.2, 26.9, and 33.6 Mg ha−1, respectively.


Table 1.
Basic properties and available nutrient concentrations in soil and compost (dry weight basis) used in the study. The soil used for this study was collected from a conventionally tilled field, whereas compost was collected from a nearby dairy farm in Clovis, NM.
Table 1.
Basic properties and available nutrient concentrations in soil and compost (dry weight basis) used in the study. The soil used for this study was collected from a conventionally tilled field, whereas compost was collected from a nearby dairy farm in Clovis, NM.
| Soil Properties | Unit | Soil | Compost |
|---|---|---|---|
| Soil pH (1:1) | 7.20 | 8.00 | |
| Electrical conductivity (1:1) | dS m−1 | 0.63 | 16.0 |
| Bulk density | g cm−3 | 1.20 | - |
| Moisture content | g kg−1 | 53.7 | 385 |
| Soil organic carbon (SOC) | g kg−1 | 8.01 | 119.8 |
| Total N | g kg−1 | 1.04 | 17.4 |
| Carbon to nitrogen (C:N) ratio | - | 7.70 | 6.89 |
| Inorganic N | g kg−1 | 0.08 | 0.10 |
| Olsen P | g kg−1 | 0.04 | 1.06 |
| Potassium | g kg−1 | 0.54 | 10.9 |
| Sulfate-S | g kg−1 | 0.02 | 0.92 |
| Calcium | g kg−1 | 2.73 | 3.61 |
| Magnesium | g kg−1 | 0.55 | 2.16 |
| Sodium | g kg−1 | 0.11 | 2.54 |
| Cation exchange capacity (CEC) | cmolc kg−1 | 20.1 | 74.9 |
Table 2.
Labile soil organic carbon and nitrogen fractions at sorghum harvest under different compost application rates. Treatments C0, C1, C2, C3, C4, and C5 represent compost rates of 0, 6.7, 13.5, 20.2, 26.9, and 33.6 Mg ha−1, respectively.
Table 2.
Labile soil organic carbon and nitrogen fractions at sorghum harvest under different compost application rates. Treatments C0, C1, C2, C3, C4, and C5 represent compost rates of 0, 6.7, 13.5, 20.2, 26.9, and 33.6 Mg ha−1, respectively.
| Treatments | 72-hr CO2-C | PMC (28-days) | PMC/SOC | Inorganic N | Inorganic N/TN | PMN | PMN/TN |
|---|---|---|---|---|---|---|---|
| (mg kg−1) | (%) | (mg kg−1) | (%) | (mg kg−1) | (%) | ||
| C0 | 37.4 ± 4.81 † | 265 ± 29.1 | 2.30 ± 0.10 | 8.71 ± 3.73 | 0.93 ± 0.38 | 9.79 ± 3.57 | 1.05 ± 0.37 |
| C1 | 44.1 ± 9.96 | 331 ± 24.2 | 2.74 ± 0.99 | 4.29 ± 2.32 | 0.42 ± 0.22 | 6.33 ± 2.13 | 0.63 ± 0.20 |
| C2 | 48.3 ± 5.98 | 299 ± 24.8 | 2.42 ± 0.20 | 6.73 ± 4.43 | 0.57 ± 0.35 | 10.7 ± 4.90 | 0.93 ± 0.38 |
| C3 | 42.3 ± 7.38 | 364 ± 44.7 | 2. 76 ± 0.36 | 8.98 ± 4.38 | 0.78 ± 0.37 | 13.2 ± 5.08 | 1.15 ± 0.43 |
| C4 | 48.2 ± 8.11 | 352 ± 21.5 | 2.67 ± 0.14 | 13.1 ± 4.32 | 1.10 ± 0.35 | 17.5 ± 4.81 | 1.47 ± 0.38 |
| C5 | 43.9 ± 4.07 | 346 ± 44.9 | 2.60 ± 0.28 | 10.6 ± 3.46 | 0.80 ± 0.22 | 14.1 ± 3.53 | 1.08 ± 0.21 |
† Data in the table are means ± standard error (n = 4). 72-hr CO2-C = CO2-C mineralized in 72 h incubation, PMC = potentially mineralizable carbon, PMN = potentially mineralizable nitrogen, SOC = soil organic carbon, TN = total nitrogen.
Table 3.
Soil nutrient contents at sorghum harvest under different compost application rates. Treatments C0, C1, C2, C3, C4, and C5 represent compost rates of 0, 6.7, 13.5, 20.2, 26.9, and 33.6 Mg ha−1, respectively.
Table 3.
Soil nutrient contents at sorghum harvest under different compost application rates. Treatments C0, C1, C2, C3, C4, and C5 represent compost rates of 0, 6.7, 13.5, 20.2, 26.9, and 33.6 Mg ha−1, respectively.
| Treatments | Phosphorus | Potassium | Calcium | Magnesium | Sulphate-S |
|---|---|---|---|---|---|
| (mg kg−1) | |||||
| C0 | 18.2 ± 2.14 e,† | 388 ± 22.7 c | 2249 ± 39.3 bc | 492 ± 10.1 | 22.2 ± 3.83 |
| C1 | 26.5 ± 1.02 d | 428 ± 26.8 bc | 2164 ± 18.4 c | 498 ± 14.3 | 13.4 ± 1.51 |
| C2 | 34.5 ± 1.62 c | 422 ± 7.34 bc | 2320 ± 37.2 ab | 515 ± 12.3 | 28.6 ± 7.26 |
| C3 | 51.3 ± 0.98 b | 439 ± 19.3 bc | 2376 ± 62.6 a | 505 ± 11.1 | 34.1 ± 8.28 |
| C4 | 55.8 ± 2.56 b | 466 ± 15.4 ab | 2384 ± 44.7 a | 515 ± 16.8 | 45.5 ± 5.82 |
| C5 | 63.6 ± 4.72 a | 513 ± 25.3 a | 2352 ± 43.1 ab | 530 ± 18.2 | 31.0 ± 15.3 |
† Data in the table are means ± standard error (n = 4). Values followed by different lowercase letters within a column are significantly different at p < 0.05 (Tukey test).
Table 4.
Nutrient contents in one kg soil with a unit (one metric ton) increase in compost application rates after sorghum harvest. Treatments C0, C1, C2, C3, C4, and C5 represent compost rates of 0, 6.7, 13.5, 20.2, 26.9, and 33.6 Mg ha−1, respectively.
Table 4.
Nutrient contents in one kg soil with a unit (one metric ton) increase in compost application rates after sorghum harvest. Treatments C0, C1, C2, C3, C4, and C5 represent compost rates of 0, 6.7, 13.5, 20.2, 26.9, and 33.6 Mg ha−1, respectively.
| Treatments | SOC | TN | Phosphorus | Potassium | Calcium | Magnesium | Sulphate-S |
|---|---|---|---|---|---|---|---|
| mg kg−1 Soil Per Unit (Mg) Compost Application | |||||||
| C0 | - | - | - | - | - | - | - |
| C1 | 1789 ± 73.6 a, † | 145 ± 5.10 a | 3.94 ± 0.15 a | 63.7 ± 3.99 a | 322 ± 2.74 a | 74.0 ± 2.12 a | 2.00 ± 0.22 a |
| C2 | 927 ± 12.5 b | 80.9 ± 3.86 b | 2.56 ± 0.12 b | 31.4 ± 0.55 b | 172 ± 2.77 b | 38.3 ± 0.92 b | 2.12 ± 0.54 a |
| C3 | 625 ± 13.8 c | 56.6 ± 3.14 c | 2.54 ± 0.05 b | 21.7 ± 0.96 c | 118 ± 3.10 c | 25.0 ± 0.55 c | 1.69 ± 0.41 ab |
| C4 | 491 ± 5.39 d | 43.2 ± 1.40 d | 2.07 ± 0.10 c | 17.3 ± 0.57 cd | 88.6 ± 1.66 d | 19.1 ± 0.63 d | 1.69 ± 0.22 ab |
| C5 | 392 ± 10.9 e | 37.3 ± 2.48 e | 1.89 ± 0.14 c | 15.3 ± 0.75 d | 70.0 ± 1.28 e | 15.7 ± 0.54 e | 0.92 ± 0.45 b |
† Data in the table are means ± standard error (n = 4). Values followed by different lowercase letters within a column are significantly different at p < 0.05 (Tukey test). SOC = soil organic carbon, TN = total nitrogen.
Table 5.
Sorghum biomass production and quality measures with different compost application rates. Treatments C0, C1, C2, C3, C4, and C5 represent compost rates of 0, 6.7, 13.5, 20.2, 26.9, and 33.6 Mg ha−1, respectively.
Table 5.
Sorghum biomass production and quality measures with different compost application rates. Treatments C0, C1, C2, C3, C4, and C5 represent compost rates of 0, 6.7, 13.5, 20.2, 26.9, and 33.6 Mg ha−1, respectively.
| Treatments | Biomass (g) | Nitrogen Content (%) | Lignin Content (%) | |||
|---|---|---|---|---|---|---|
| Root | Shoot | Root | Shoot | Root | Shoot | |
| C0 | 35.0 ± 2.52 | 64.3 ± 3.76 | 1.60 ± 0.15 | 2.62 ± 0.12 b,† | 9.68 ± 1.09 | 3.65 ± 0.49 |
| C1 | 48.0 ± 6.48 | 70.0 ± 5.87 | 1.61 ± 0.11 | 2.97 ± 0.29 ab | 10.5 ± 1.47 | 3.88 ± 0.59 |
| C2 | 52.5 ± 4.97 | 82.5 ± 7.01 | 1.55 ± 0.02 | 3.16 ± 0.27 ab | 10.0 ± 1.23 | 4.57 ± 2.09 |
| C3 | 44.7 ± 6.39 | 77.0 ± 9.65 | 1.40 ± 0.25 | 2.52 ± 0.26 b | 10.6 ± 0.89 | 2.58 ± 0.05 |
| C4 | 56.3 ± 6.13 | 78.0 ± 5.87 | 1.50 ± 0.10 | 2.76 ± 0.08 b | 11.6 ± 0.71 | 2.94 ± 0.23 |
| C5 | 53.5 ± 4.66 | 75.5 ± 7.71 | 1.53 ± 0.32 | 3.50 ± 0.25 a | 9.57 ± 3.03 | 4.09 ± 0.84 |
† Data in the table are means ± standard error (n = 4). Values followed by different lowercase letters within a column are significantly different at p < 0.05 (Tukey test)
Table 6.
Relationship between soil properties affected by compost treatments.
| Soil Properties | SOC † | CEC | EC | pH | PMC | Inorganic N | PMN |
|---|---|---|---|---|---|---|---|
| CEC | 0.64 ***,‡ | ||||||
| EC | 0.61 *** | 0.77 *** | |||||
| pH | −0.39 * | −0.42 * | −0.77 *** | ||||
| PMC | 0.56 ** | 0.24 | −0.02 | 0.15 | |||
| Inorganic N | 0.42 * | 0.58 ** | 0.91 *** | −0.84 *** | −0.11 | ||
| PMN | 0.49 * | 0.63 *** | 0.93 *** | -0.86 *** | −0.05 | 0.98 *** | |
| 72-hr CO2-C | 0.47 * | 0.20 | 0.07 | −0.02 | 0.77 *** | 0.13 | 0.13 |
† Data in the table are Pearson’s correlation coefficient (r2) describing the relationship between soil properties affected by compost treatments. ‡ Significance level. ***, p < 0.001; ** p < 0.01; * p < 0.05. SOC = soil organic carbon, CEC = cation exchange capacity, EC = electrical conductivity, PMC = potentially mineralizable carbon, PMN = potentially mineralizable nitrogen.
© 2019 by the authors. Licensee MDPI, Basel, Switzerland. This article is an open access article distributed under the terms and conditions of the Creative Commons Attribution (CC BY) license (http://creativecommons.org/licenses/by/4.0/).
Share and Cite
MDPI and ACS Style
Acharya, P.; Ghimire, R.; Cho, Y. Linking Soil Health to Sustainable Crop Production: Dairy Compost Effects on Soil Properties and Sorghum Biomass. Sustainability 2019, 11, 3552. https://doi.org/10.3390/su11133552
AMA Style
Acharya P, Ghimire R, Cho Y. Linking Soil Health to Sustainable Crop Production: Dairy Compost Effects on Soil Properties and Sorghum Biomass. Sustainability. 2019; 11(13):3552. https://doi.org/10.3390/su11133552
Chicago/Turabian StyleAcharya, Pramod, Rajan Ghimire, and Youngkoo Cho. 2019. "Linking Soil Health to Sustainable Crop Production: Dairy Compost Effects on Soil Properties and Sorghum Biomass" Sustainability 11, no. 13: 3552. https://doi.org/10.3390/su11133552
Note that from the first issue of 2016, this journal uses article numbers instead of page numbers. See further details here.