Optimization of Metro Passenger Organizing of Alighting and Boarding Processes: Simulated Evidence from the Metro Station in Nanjing, China

Jiangsu Key Laboratory of Urban ITS, Jiangsu Province Collaborative Innovation Center of Modern Urban Traffic Technologies, School of Transportation, Southeast University, Nanjing 211189, China
*
Author to whom correspondence should be addressed.
Sustainability 2019, 11(13), 3682; https://doi.org/10.3390/su11133682
Submission received: 5 May 2019
/
Revised: 29 June 2019
/
Accepted: 2 July 2019
/
Published: 4 July 2019
(This article belongs to the Special Issue Human-Technology Interaction in the Use of Newly Emerging Sustainable Transportation Solutions)
Abstract
:Since the long dwell time and chaotic crowds make metro trips inefficient and dissatisfying, the importance of optimizing alighting and boarding processes has become more prominent. This paper focuses on the adjustment of passenger organizing modes. Using field data from the metro station in Nanjing, China, a micro-simulation model of alighting and boarding processes based on an improved social force paradigm was built to simulate the movement of passengers under different passenger organizing modes. Unit flow rate, delay, and social force work (SFW) jointly reflect the efficiency and, especially, the physical energy consumption of passengers under each mode. It was found that when passengers alighted and boarded by different doors, efficiency reached its optimal level which was 76.92% higher than the status quo of Nanjing, and the physical energy consumption was reduced by 16.30%. Both the findings and the model can provide support for passenger organizing in metro stations, and the concept of SFW can be applied to other scenes simulated by the social force model, such as evacuations of large-scale activities, to evaluate the physical energy consumption of people.
1. Introduction
1.1. Background
Since the mid-20th century, the excessive growth of the urban population has caused a series of problems, including traffic congestion and environmental pollution, which need to be urgently solved [1]. For many large cities with a large population, the fundamental solution for alleviating urban traffic congestion is to develop public transportation. Therefore, many cities have begun to build metro stations to carry such a large number of passengers. However, since the travel time on the metro has been getting longer due to the long dwell time, and passengers have to cross chaotic crowds to alight and board, the metro does need to improve its efficiency and level of service (LOS) and maximize the utilization of the space and infrastructure resources [2]. To achieve this, the travel time of metro passengers should be shortened, and it is necessary to organize passenger flow in a more appropriate way.
The average speed of the metro and the total travel time of metro passengers on metro vehicles are greatly affected by dwell time. Yang’s (2017) study of metro timetables shows that the metro dwell time accounts for up to 24.37% of total travel time [3], so shortening the dwell time can improve the total efficiency of the metro to some extent. Improving the smoothness of passenger flow during the alighting and boarding process can also improve the LOS of the metro and make passengers feel more comfortable.
1.2. Influencing Factors of Dwell Time
Many researchers have found that dwell time consists of two parts: The time that it takes to open and close doors, and the time that the alighting and boarding process takes [4,5,6]. The time that it takes to open and close doors is an inherent property of the vehicle. With a certain vehicle, the time cannot be changed artificially, so it is necessary to shorten the time of the alighting and boarding process.
There are many studies on the alighting and boarding process time. Previously, Levinson (1983) and Guenther et al. (1983) used a linear regression model and a natural logarithm model to describe the relationship between the alighting and boarding process time and the number of passengers [7,8]. They found that the number of passengers is a key factor that affects dwell time and that they are proportional to each other. After that, many other scholars also confirmed this in their studies [5,6,8] and found many other environmental factors that influence the alighting and boarding process. The type as well as the layout of the vehicle and the platform all have an effect on the alighting and boarding time [9,10,11,12,13,14]. In addition, the door width and the number of doors can also influence the alighting and boarding process time [5,10,15,16,17,18,19,20]. The alighting and boarding time of buses with four doors is 17% less than those with three doors, and the optimum door width is between 1.7 and 1.8 m. The horizontal and vertical gap between the doors and the platform can affect the alighting and boarding time [9,11,21,22,23]. The larger the gap, the longer is the alighting and boarding time, and Sebastian et al. (2015) also found that different sizes of the keep-out zone and passenger organizing modes can influence the time of that process [22].
These factors mentioned above all stem from the infrastructure of the metro station and the vehicle. In addition, the characteristics of passengers also affect alighting and boarding time consumption.
The types of passengers, including their age, whether they are carrying luggage or not, and their density can influence alighting and boarding efficiency [24,25,26]; for example, younger passengers move faster than older people, and passengers with luggage need more time to alight and board than those without luggage. Moreover, some determinants of other aspects were found. For example, Fernandez et al. (2010) and Tirachini et al. (2011) claimed that if the payment process takes place outside the vehicle, the alighting and boarding time is shorter than if it takes place inside the vehicle [15,26].
There is an abundance of literature on the alighting and boarding process of public transportation. However, in existing studies, scholars have mainly studied the influence of the metro station environment, including the size of the facilities and the station layout and the characteristics of passenger traffic, such as group size, density, and distribution. In fact, the suggestions of these studies are not suitable for the existing metro stations due to the high cost of adjustment. Therefore, it is necessary to study the mechanism of passengers’ movement to explore a more feasible way to improve the status quo.
1.3. Analyzing Methods of the Alighting and Boarding Process
Analyses of passenger traffic alighting and boarding processes mainly include regression analyses, simulations, real-scale experiments, and some other theories and techniques. Regression analyses are most often used to find the interrelations among several observable variables with plenty of field data, such as the studies mentioned above on the number of passengers and the alighting and boarding time [7,8,26]. Real-scale experiments are convenient because observers can record video data and organize passengers by different rules [15,20,21,22,27,28]. This method avoids the complex logical thinking and endless details involved in building a model. Real passengers can make the movement in experiments more reasonable and authentic. However, if a scene is hard to replicate or if the purpose is to study the mechanism of passengers’ movement, then a simulation can be an appropriate method.
Many scholars have carried out passenger traffic simulation research. The simulation models are often divided into two parts, the macro and the micro. Henderson (1971) first measured the velocity distribution functions for three crowd fluids in the gaseous phase [29]. Hughes (2003) described passenger flow as a fluid with a certain mobility by using the concept of fluid mechanics and successfully simulated some phenomena of passenger traffic [30]. These were all macro-simulations of the alighting and boarding process. Since the end of the 20th century, many scholars have applied cellular automation in research on passenger traffic micro-simulation. Muramatsu et al. (1999) first applied the lattice gas model, a particular form of cellular automation, to passenger traffic simulation [31]. Blue et al. (2001) used the cellular automata model to simulate passenger traffic in different states, and the comparison with field data proved the availability and effectiveness of the model [32,33]. Zhang et al. (2008) improved the cellular automata model to make the simulation more suitable for metro passengers and highlighted the simulation scene and conditions in which the results were more accurate [34]. Lu (2017) used a cellular automaton to build a simulation of the alighting and boarding process to find out what influences the efficiency of this process [35].
Another micro-simulation, the social force model, is a type of continuous model, whereas cellular automaton is discrete. Helbing et al. (1995) first proposed the model and pointed out that the movement of passengers is a complex reaction resulting from various psychological forces including their own driving force [36]. They accomplished the building of a simulation model for moving crowds by using the social force model [37]. Based on an image-processing technology, passenger feature parameters were extracted from video images, and the parameters of the social force model were modified to make the simulation results closer to the field data [38,39]. Apel et al. (2004) solved the problem of low relative efficiency of the social force model calculation by using the Verlet link cell algorithm which integrates the equations of motion of about a thousand particles in a relatively easy way [40,41]. Lakoba et al. (2005) and Ding et al. (2011) improved the social force model and proposed the behavior rule to avoid an overlap between passengers, so that the model could reflect human behavior in a more authentic way. The simulation results accorded with the passenger traffic phenomenon [42,43]. By constructing the actual simulation scene, Rudloff et al. (2011) first proposed a simulation model of the alighting and boarding process in a metro station based on the social force model and applied the model to that process for the first time [44]. According to Mehdi et al. (2011), the desired velocity direction of an individual is the tangential direction of the path taking into account the existence of other individuals and obstacles, and the desired velocity of an individual does not exceed a certain fixed value [45]. Ji et al. (2018) inserted a direction rule into the social force model and combined the model with a multi-agent concept. They built a simulation for the alighting and boarding process of buses [14].
In addition, agent-based modelling was also used to simulate the alighting and boarding process, which can mitigate the risks of investment at a much lower cost and represents luggage as a different kind of an agent from passengers [12,25].
As for the simulation of the alighting and boarding process, most models focus on a scene with a single door and the corresponding platform. The auto-agents in the simulation are only alighting and boarding passengers. However, the alighting and boarding process is the passengers’ movement taking a vehicle carriage as a unit. That means that the alighting door and the boarding door of a specific passenger may be different, but in the same vehicle carriage, and different passenger organizing modes may need more than one door, while the inactive passengers who do not participate in the alighting and boarding process and stay in the vehicle or on the platform should also be taken into consideration.
On the other hand, the analysis of the alighting and boarding process is only concerned with the efficiency of passenger flow in most studies. Subjective feelings are ignored due to the difficulty of quantifying this indicator.
In view of the above limitations, an improved social force model was built to simulate the alighting and boarding process under different passenger organizing modes. The scene in this model was a whole vehicle and the corresponding platform which was not just a single door, and inactive passengers and their impact were also added to this model. Using field data from the metro station in Nanjing, China, the parameters in the model could be calibrated. In addition, based on the social force paradigm, this study quantified the physical energy consumption of passengers and the difficulty in finishing the alighting and boarding process by calculating the social force work (SFW). With the consideration of efficiency, a multi-objective optimization model was built, and we found that when passengers alighted and boarded by different doors, efficiency reached its optimal level, and the physical energy consumption was the lowest.
2. Model Description
2.1. Classic Social Force Model
The social force model (SFM) is a multi-particle self-driven continuous micro-simulation model, the basic concept of which was proposed by Lewin (1951) [46]. After that, Helbing (1995) proposed the concept of the social force model and its calculation method [36]. Every auto-agent which represents the passenger in the simulation is subject to three kinds of forces which stem from the environment: The driving force and the forces from other passengers and obstacles [37]. The acceleration of the auto-agent is defined in Equation (1).
The change of position of the auto-agent i at the time t is showed in Equation (2).
The three parts of the right-hand-side of Equation (1) correspond to the driving force and the forces caused by other passengers and obstacles. Each of these forces is described below.
The driving force means the auto-agent’s eagerness to move towards the target. This force helps passengers to resist other forces which stem from their surroundings. The formula of the driving force is expressed in Equation (3).
where refers to the desired speed of auto-agent i at time t. It is always an experience value and, of course, can be calibrated in special situation. is the desired direction of auto-agent i at time t. The desired direction of passengers will change according to the spatial position. In other words, the auto-agent has a different target in different movement stages, and its spatial distribution is shown in Figure 1. is the actual velocity of pedestrian i at time t. is the relaxation time which is always equal to 0.5 s.
In Figure 1, the distance between each dotted line and door edge is the average radius of passengers. The desired direction outside of the dotted line points to the center of the door, while the desired direction of the rest points to the overall direction of the travel.
For alighting passengers, the desired direction can be expressed by Equation (4).
For boarding passengers, the desired direction can be expressed by Equation (5).
The second part of the right-hand-side of Equation (1) is the forces caused by other passengers. The formula is shown as follows:
where are positive constants. is the sum of the radius of passengers i and j. is the straight-line distance between passengers i and j. is the direction from passenger j to passenger i. is the tangential direction of the link of the two passengers. is the difference between the tangential velocity of pedestrian i and j. The first part of the right-hand-side of Equation (6) is the psychological force of passenger i to avoid other passengers. The second part is the extrusion force between two passengers when they touch each other. The third part is the force perpendicular to the direction of the extrusion force, which is related to the tangential velocity difference.
The forces which stem from obstacles are in the same form as those from passengers. The detailed formula is shown as follows:
Based on all of the calculations above, the updated velocity of the auto-agent i is expressed by Equation (14).
And the updated position is shown as Equation (15).
2.2. Model Improvement
2.2.1. Definition of a Friction Surface
Passengers who are focused on a target can only perceive impact within a very short distance. According to an existing study and field data [47], perceived distance is set as three meters, which means that passengers and obstacles inside a circle of an auto-agent with a radius of three m can affect the auto-agent, and the auto-agent will ignore the impact from those outside of the circle.
The alighting and boarding process in a metro vehicle is a special movement process that includes two opposite directions of passengers, and the crowd density in this process is extremely high at peak hours, so that there exist intense and frequent collisions and squeezes among passengers in two directions. In addition, it was found that passengers moving in the same direction have a following effect, while passengers moving in the opposite direction rub against each other, and their difficulty in crossing doors increases [48]. In order to simulate this psychology of passengers, the concept of friction surface was proposed and integrated into the social force model.
Friction surface is a physical concept that represents the surface of contact between two objects that are being rubbed against each other. In this paper, friction surface refers to the surface composed of passengers directly facing the opposite passengers, as shown by the yellow lines in Figure 2. In the figure, the green points represent alighting passengers, and the orange points are boarding passengers. The gray ones are inactive passengers. Passengers on the friction surface have the responsibility of opening up a passage. The following passengers at the rear of the friction surface do not need to worry about opening up a passage. Instead, they choose to closely follow the passengers in front of them. In this way, the influence of the opposite passengers on the crowd behind the friction surface is weakened. In summary, passengers on the friction surface bear all of the friction forces from the opposite passengers, and passengers behind the friction surface do not.
After determining the position of the friction surface, the social forces of the passengers are calculated according to the rules mentioned above. The next section will introduce the method for checking whether passengers are in a position on the friction surface.
2.2.2. Algorithm of the Friction Surface
The friction surface is visible from any static state of passengers’ positions, but it cannot be recognized by a computer. The work in this section is to make a computer recognize the category of each passenger.
To check whether the auto-agent is on the friction surface, an evolutionary K-Nearest-neighbor (KNN) algorithm is used to train the collected data. The KNN algorithm is a mature method in theory, and was proposed by Cover and Hart (1968) [49]. Its concept is very simple and direct, with the advantage of being easy to operate quickly and of having a low error rate. The basic concept of the KNN algorithm is this: Calculate the distance between sample x and each training sample according to the distance function, select the nearest K samples to be the K nearest neighbors of x, and finally decide the category of x according to what category most of the K nearest neighbors belong to [50]. In this study, sample x represented the single auto-agent who participated in the alighting and boarding process, and each of them went through the process of becoming sample x. When the number of neighbors used for deciding the category of sample x is set as different values, the accuracy of the decision changes accordingly, and the value of K with the highest accuracy is selected as the final number of neighbors. The calculation method of the specific evolutionary KNN algorithm is as follows.
For alighting passengers,
refers to the walking direction attribute of the passengers; passengers in the same direction are marked as 1, while others are marked as 0; is the value of the Y-coordinate of passenger i. The next step is to rank the distances between auto-agent i and other passengers from small to large and then to choose the first K passengers as neighbors.
represents passenger j who is the kth nearest neighbor of pedestrian i. Next, check the attribution of K neighbors.
If the value of is 1, that means that passenger i is at a position on the friction surface. If the value is 0, passenger i is not. If there are opposite passengers within the perceptual range of three m, the auto-agents on the friction surface operate under normal social forces, whereas for the other passengers who are not on the friction surface, there is no force from the opposite passengers.
Take the field video data as the experimental sample set. As shown in the black circle in Figure 2, the center of the circle is the sample x whose category is needed to be decided, and the K nearest neighbors are selected. If there are one or more than one opposite passengers among the K nearest neighbors, then both the central one and the opposite one(s) are on the friction surface. Figure 3 shows the accuracy of the algorithm when K is set at a different value. The calculation of the accuracy is as follows:
The accuracy of a different K value is determined by the number of correct predictions (NCP) and the total number of predictions (TNP). The experimental samples are passengers who can be determined at the friction surface for certain in the video. The value of NCP is the sum of . TNP is the amount of experimental samples extracted from the video.
Figure 3 shows that when K equals 5 or 6, the accuracy is high enough. When the value of K is lower than 5, some of the passengers on the friction surface are decided as not being there, so the accuracy is low. On the contrary, when the value of K is more than 6, someone that is not on the friction surface can also be placed into the wrong category. The accuracy is also low. In order to reduce the amount of calculation in the codes, K = 5 is set; that is, if there are opposite passengers in the five nearest neighbors of the auto-agent, it can be decided that both of them are on the friction surface.
2.3. Definition of Indicators
The optimization objective of different passenger organizing modes of the alighting and boarding process on the metro is not only to shorten time consumption; the consumption of passengers’ energy should also be taken into account. Therefore, in this paper, three indicators are proposed (social force work, average unit flow rate, and average delay) to measure the physical energy consumption and efficiency of passengers during the alighting and boarding process.
2.3.1. Social Force Work
Every auto-agent in the simulation is subject to various forces from the environment and from other passengers. To complete the alighting and boarding process, the auto-agent is driven to overcome all of the impeding forces and move towards the goal by the driving force. During the moving process, the impeding forces do negative work on the auto-agent. In the case of the same displacement, the amount of negative work can be used to measure the difficulty of the completion of the process. The value of negative work is the consumption of energy [51]. Applying this concept to the alighting and boarding process, the value of negative work is the physical energy consumption of passengers. The magnitude of the negative work, or physical energy consumption, can be used to measure with how much difficulty these passengers complete the alighting and boarding process. When passengers feel relaxed when crossing the door, they need to overcome fewer impeding forces and do less social force work, and the physical energy consumption is lower. The formulation of SFW is shown below:
where is the total social force work of the alighting and boarding process (); , are the end time of the process and the number of the alighting and boarding passengers, respectively; and is the social force that passenger i needs to resist at time t.
In the process of simulation, the model outputs the total social force work of alighting and boarding passengers during the whole process. Under different crowd densities, the number of passengers changes a lot, so the total social force work has less value than the average social force work.
where is the average social force work. Next, the operation of social force work in the social force model will be explained.
Social force work is the integral of force with respect to displacement. The integral of a function represents the area between the graph of the function and the X-axis. When x is divided into minimal segments, the integral can be equivalent to the sum of areas of several rectangles [52].
In the model in this study, the displacement during an iteration step is small enough as a minimal segment. The forces in the opposite direction of the desired direction are those that the passengers need to overcome. Multiplying the force of each minimal time segment by the displacement occurring in this small period, and completing the integral of the force with respect to the displacement of the whole moving process, gives us the social force work of the whole process.
2.3.2. Unit Flow Rate
When the amount of alighting and boarding passengers is not the same, the total time of the alighting and boarding process does not have the value to measure the efficiency of the process. Therefore, the ratio between the total amount of alighting and boarding passengers and the time of this process, that is, the amount of passengers passing through a door in a unit time, is selected as the indicator of the speed of passengers in this process.
where is the amount of passengers passing the door in unit time.
2.3.3. Average Delay
Boarding passengers need to wait outside the warning line. It is accepted that the space between the warning line and the vehicle is named the door-space. When a passenger is in the door-space, it is necessary to find a gap to pass through the door to complete boarding or alighting. Under different passenger organizing modes, the boarding or alighting speed of passengers is different. In the simulation, the average time taken by passengers from entering the door-space to leaving the space is recorded, which represents the average delay of the alighting and boarding process.
where is the delay while passengers are in the door-space. is the time spent on passengers passing the door-space.
2.4. Model Operation
In summary, the social force model describes that in the process of passengers moving towards their destination, other people and obstacles will have a psychological force of repulsion to the moving pedestrian, thus generating a series of behaviors of avoiding obstacles and other people. Based on the model description above, the complete simulation can be generated. The operation process of the model is shown in Figure 4.
3. Simulation Preparation
3.1. Data Collection
This study took the Nanjing metro station as the prototype for establishing the simulation. There are various types of metro stations, such as transfer stations, terminal stations, intermediate stations, and so on. However, in different types of metro stations, passengers move in the same way during the alighting and boarding process, and the type of station has no influence on the behaviors of alighting and boarding. However, different platform layouts, vehicle types, and crowd densities can affect the experimental results. Therefore, the station where the data is collected should be typical, and during the collection, the crowd density should have a wide range of variations.
According to the above data collection requirements, Daxinggong metro station was selected for the field observation. Daxinggong station is one of the busiest metro stations in Nanjing, China. It is a transfer station between Line 2 and Line 3. The geographical location, the surroundings of the station, and the environment inside the station are shown in Figure 5 and Figure 6.
The equipment used to record videos was HD Smart Wireless Ip Camera XJB-DWF04 (1080P, 2.8 MM). This is a kind of mini camera and was installed high up on the wall. It is tiny enough that passengers did not notice it, and it did not interfere with the movement of passengers, in which way the observation error was avoided. The software used to extract data from the videos was Tracker 5.0.6. By using Tracker, the coordinate, velocity, and motion trail of each passenger could be extracted from the videos. These data were used to adjust the parameters in our model to make the simulation close to reality.
There are five doors on each side of the vehicle on Nanjing metro Line 3, as shown in Figure 7. To simplify the scene, only one side of the doors has been drawn. The green areas are the doors of the metro vehicle, and the yellow area is the warning line. Passengers are not allowed to step on the warning line while they are waiting outside the vehicle.
Passengers at this station were recorded from 18:30 to 19:30 on 17 December 2018, a period from the evening peak to the end of the peak hours on a weekday. Three doors were selected for continuous video recording. The video recorded the alighting and boarding process 84 times, including 2032 alighting and boarding passengers. Figure 8 shows the time consumption and unit flow of different amounts of passengers who completed the process. Figure 9 shows the arrival interval of the vehicle and the arrival rate of passengers.
The findings show that the survey data were concentrated in medium and high crowd densities, which is in line with the purposes of this study, to optimize passenger organizing. The arrival interval of vehicles in off-peak hours is significantly larger than it in peak hours, and the arrival rate of passengers is smaller in off-peak hours than in peak hours.
The parameters of the simulation model were adjusted according to the field data, and an error range of 15% was set [18]. The calibration of model parameters is judged by running the simulation model several times and comparing the simulation results with actual investigation results. If the deviation from actual investigation results is within the error range, the model parameters are reasonable, and the calibration process will be stopped. The model parameters are determined. Otherwise, one would need to adjust the internal model parameters, rerun the model, and modify the parameters until the model results meet the error range.
3.2. Passenger Organizing Modes
Most of the existing research on the alighting and boarding process in metro stations has focused on a scene with a single door and the corresponding platform. Due to the limitation of this scene, the influence of inactive passengers who do not participate in the alighting and boarding process is not taken into consideration, and the disappearance of passengers after crossing the door is not taken into consideration, either. To remedy this problem, this study expanded the simulation scene from a single door to an entire vehicle, and added the inactive passengers. This represented the entire alighting and boarding process in a more comprehensive way.
The simulation scene was the same as that in Line 3 of the Nanjing metro. Passengers were generated randomly to queue around the door and were controlled by different rules of passenger organizing modes. The three different modes that passengers can be organized into are shown as follows:
- Scenario 1: passengers alight through the middle of each door while boarding on the two sides of the door, which is shown in Figure 10.
- Scenario 2: passengers alight from the left side of each door while boarding on the right side of the door, which is shown in Figure 11.
- Scenario 3: passengers alight from different doors than those used for boarding, which is shown in Figure 12.
The resistance of the passengers in the boarding and alighting process comes from two parts at least:
- Passengers need to compete for the doorway to pass through the doors.
- Passengers need to compete for space to settle down in the vehicle or platform after passing through the doors.
Due to the complexity of resistance factors, which scenario is optimal was not obvious. Therefore, micro-simulation and indicators were needed to assist the analysis.
Crowd density influences the alighting and boarding process, such as whether the inactive passengers in the vehicle and on the platform can avoid others in time, and whether alighting and boarding passengers can find a gap to cross the door in a short time. In the same scenario, different crowd densities were compared. The study compared the physical energy consumption and efficiency under these different conditions and found the most suitable passenger organizing mode.
According to the field survey, during evening peak hours, the proportion of alighting passengers, boarding passengers, and inactive passengers is approximately 3:3:4, respectively. In the following simulation, passengers’ generation was based on field data.
4. Results and Discussion
First, it is necessary to make the differences among the three passenger organizing modes clear. Table 1 shows a comparison of the number of friction surfaces, unit flow rates, and average delays in these scenarios.
The findings show that as the number of friction surfaces increases, the average delay also increases. When the number of friction surfaces per door increased from 0 to 1, the delay increased by 14.13%. When the number of friction surfaces increased from 1 to 2, the delay increased by 6.67%. Also, the unit flow rate decreased by 18.86% and 11.75% with the number of friction surfaces adding up from 0 to 1 and 1 to 2. respectively.
When the crowd density is at different levels, the trends of the three indicators are clearly different, and thus, the three indicators at different crowd density levels should be analyzed separately. In the simulation, the relative crowd density of 1 represented the extremely empty metro station, and the relative density of 7 represented the extremely crowded situation. Next, we divided all the density levels into three parts, and defined 1–3 as low density, 3–5 as medium density, and 5–7 as high density.
As can be seen in Table 2, the study found that at all three levels, delay increased with the increase in crowd density. The existence of friction surfaces had a significant impact on the traffic rate in the crowded state, and the higher the number of friction surfaces, the higher the impeding forces at every density level were. With density increasing from the low level to the high one, the unit flow rate in Scenario 2 was 20.32%, 10.05%, and 11.81% larger than it was in the current scenario (Scenario 1), respectively. In Scenario 3, the corresponding increment was 77.46%, 41.80%, and 28.30%, respectively. As for the average delay, in Scenario 2 it was 15.28%, 8.52%, and −10.00% larger than it was in the current scenario with the density increasing. In Scenario 3, the delay was 6.25%, 0, and 23.46% smaller than the current scenario. Although efficiency in Scenario 3 was prominently high, there was a strange phenomenon in the analysis above. The unit flow rate in Scenario 2 was higher than that in the current scenario with any density, but the delay in Scenario 2 was larger than that in the current scenario when the density level was low and mid. Also, according to Figure 13, it can be observed that the delay in Scenario 2 was extremely unstable.
In this paper, the difference between the competitiveness of passengers in the two directions is called competitiveness gap, which is shown in Table 3. In Scenario 2, the competitiveness gap was 0. That means that boarding passengers had the same competitiveness as alighting passengers. The competition for space of these passengers was fiercer than it was in other scenarios where the competitiveness gap was larger. This may have caused the instability in Scenario 2.
In addition to the unit flow rate and delay, there were clear differences in the physical energy consumption among the three scenarios. Figure 14 shows the comparison of the trends of SFW in different scenarios. The SFW of Scenario 1 was selected as the unit value, and the ratios of SFW of Scenarios 2 and 3 to Scenario 1 were taken as the measurement indicators to obtain the visual comparison chart of SFW in the three scenarios.
When crowd density was at a low level, space resources were sufficient. The competition between passengers going in different directions is not obvious. With crowd density increasing, the competition gradually became more intense. This phenomenon is verified in Figure 14. In Scenario 2, the SFW was clearly larger than it was in the current scenario at the medium and high densities. Although the efficiency of the boarding and alighting process was higher than it was in the current situation, the consumption of SFW was still higher than the current level. That means that the physical energy consumption was the highest among the three scenarios in mid and high density in Scenario 2. Similarly, in Scenario 3, there was no space competition between the two different directions of passengers; there was only competition between the alighting or boarding passengers and the inactive passengers Thus, the SFW or physical energy consumption of Scenario 3 in a medium crowd density was lower than that of other scenarios, as in the low crowd density. Therefore, the physical energy consumption of passengers was the lowest in Scenario 3, especially in the low and mid density. Although the efficiency in Scenario 2 was larger than that in Scenario 1, the physical energy consumption was too large in mid and high crowd density.
When the operators organize the passenger flow, it is necessary to make the emphasis of each situation clear. For example, in some special vehicles, like the women’s vehicle in Guangzhou, China, only women and children can get on. In this situation, the physical energy consumption is more important than efficiency. Based on such emphasis, the optimal measure can be determined.
This paper has made an adjustment and an improvement to the existing social force model. Using field data from the Nanjing metro station, the study performed a simulation of passenger flow over the whole metro vehicle and the corresponding platform. It simulated the alighting and boarding process under different passenger organizing modes. The delay, unit flow rate, and social force work jointly determine the efficiency of the alighting and boarding process and physical energy consumption of passengers under different passenger organizing modes. The comparison of different modes showed that when passengers alighted and boarded by different doors, efficiency reached its optimal level, and the physical energy consumption was the lowest. It was also found that, sometimes, a more efficient scenario may not be the more energy-saving one. When making decisions, operators need to make choices according to where emphasis is placed.
In the process of model building, to describe the phenomenon of passengers moving in the same direction having a following effect, the KNN algorithm was used to determine the friction surface. If there is an opposite pedestrian among the five nearest neighbors of the auto-agent, it is judged that both of them are at a position on the friction surface. Passengers at a position on a friction surface can feel the force from others going in the opposite direction. Through the simulation in this study, the efficiency and the physical energy consumption of the alighting and boarding process under different passenger organizing modes were analyzed.
Compared with existing studies, the contribution of this paper is mainly reflected in these three aspects:
- (1)
- A full scenario was simulated both in the environment mock-up and the auto-agent generation. The simulation scenario was expanded from a single door to a whole vehicle and the corresponding platform, and inactive passengers who do not participate in the alighting and boarding process were added. This made the simulation more integrated, and the needs of different passenger organizing modes could also be met.
- (2)
- The existing social force model was improved by differentiating between passengers’ positions. They were divided into two groups: On friction surfaces or not. Passengers in different groups follow different rules to move. In this way, the existing social force model was improved in terms of both rationality and accuracy.
- (3)
- In the process of analyzing the simulation results, social force work was used to quantify the subjective feelings of the physical energy consumption and the difficulty degree in completing the alighting and boarding process, so as to establish a more comprehensive evaluation index system for the evaluation of the efficiency and LOS of passenger organizing.
The evolution of public transport is similar from mode to mode. Concerning bus services in China, single-door boarding and alighting has been improved by more efficient front-door boarding and back-door alighting. During the transition process, bus passengers were guided by conductors’ instructions and voice broadcasting. Then, they gradually accepted this management measure. For another example, the metro in Guangzhou, one of the largest cities in China, has already applied different passenger organizing modes at the same time, including Scenarios 1 and 2 (shown in Figure 15) in this study, and some other modes unmentioned in this paper. Passengers can follow the instructions of different modes very well. Hence, with the appropriate guidance signs and administrators’ instructions, the adjustment of passenger organizing will be accepted smoothly.
Regarding the existing measures for optimizing the alighting and boarding process in a metro station, no matter the way they increase spatial resources or separate conflicts between passengers in space or time, they all aim to reduce conflict between passengers, making their movements smoother and more efficient. This is also a key issue that transit operators need to consider when organizing passengers or setting up the facilities of a metro station. There are still some weaknesses in this study. For example, the different queue lengths at different doors of a metro vehicle were not taken into account, and the priority of passengers in different directions was not discussed in detail. The study of the interaction between passenger organizing and resources was poor, and so was the analysis of sustainable development. In subsequent research, it is necessary to overcome the above shortcomings and conduct some research on the relationship between transportation and the environment [53,54], the interaction between resources utilization and its pattern of utilization [55], and the impact of public transit on urban life [56,57].
Author Contributions
Q.G. and J.Y. recorded and processed the video data of the metro station. Y.J., L.G. and J.Y. improved the existing social force model and wrote this paper.
Funding
This work was financially supported by the National Key R&D Program of China (2018YFB1600900) and National Natural Science Foundation of China (51561135003).
Acknowledgments
We are grateful to all the members of the SRTP of SEU and the metro company in Nanjing, China.
Conflicts of Interest
The authors declare no conflict of interest. The founding sponsors had no role in the design of the study; in the collection, analyses, or interpretation of data; in the writing of the manuscript, and in the decision to publish the results.
References
- Rana, M.; Parves, M. Urbanization and sustainability: Challenges and strategies for sustainable urban development in bangladesh. Environ. Dev. Sustain. 2011, 13, 237–256. [Google Scholar] [CrossRef]
- Du, C.; Xiao, M.; Zhou, X. Research on urban public transport status and countermeasure of yinzhou district in ningbo city. In Proceedings of the 2015 Ninth International Conference on Management Science and Engineering Management, Karlsruhe, Germany, 21–23 July 2015; Volume 362, pp. 471–481. [Google Scholar]
- Yang, X.; Chen, A.; Ning, B.; Tang, T. Bi-objective programming approach for solving the metro timetable optimization problem with dwell time uncertainty. Transp. Res. Part E Logist. Transp. Rev. 2017, 97, 22–37. [Google Scholar] [CrossRef]
- Pretty, R.L. The planning of bus transport for developling urban form. Aust. Road Res. 1988, 18, 82–88. [Google Scholar]
- Harris, N.G. Train boarding and alighting rates at high passenger loads. J. Adv. Transp. 2010, 40, 249–263. [Google Scholar] [CrossRef]
- Jia, N.; Wang, Y. A Model of High-Density Passenger Boarding and Alighting in Urban Rail Transit Station; Springer: Singapore, 2018; pp. 779–789. [Google Scholar]
- Levinson, H.S. Analyzing Transit Travel Time Performance. Transp. Res. Rec. 1983, 915, 1–6. [Google Scholar]
- Guenthner, R.P.; Sinha, K.C. Modeling Bus Delays Due to Passenger Boardings and Alightings. Transp. Res. Rec. 1983, 915, 7–13. [Google Scholar]
- Heinz, W. Passenger Service Times on Trains Theory, Measurements, and Models. Ph.D. Thesis, Royal Institute of Technology, Stockholm, Sweden, 2003. [Google Scholar]
- Harris, N.G.; Graham, D.J.; Anderson, R.J.; Li, H. The Impact of Urban Rail Boarding and Alighting Factors. In Proceedings of the Transportation Research Board 93rd Annual Meeting, Washington, DC, USA, 12–16 January 2014. [Google Scholar]
- Sun, L.; Tirachini, A.; Axhausen, K.W.; Erath, A.; Lee, D.-H. Models of bus boarding and alighting dynamics. Transp. Res. Part A Policy Pract. 2014, 69, 447–460. [Google Scholar] [CrossRef] [Green Version]
- Coxon, S.; Chandler, T.; Wilson, E. Testing the efficacy of platform and train passenger boarding, alighting and dispersal through innovative 3d agent-based modelling techniques. Urban Rail Transit 2015, 1, 87–94. [Google Scholar] [CrossRef]
- Shi, X.; Ye, Z.; Shiwakoti, N.; Tang, D.; Lin, J. Examining effect of architectural adjustment on pedestrian crowd flow at bottleneck. Phys. A Stat. Mech. Appl. 2019, 522, 350–364. [Google Scholar] [CrossRef] [Green Version]
- Ji, Y.; Gao, L.; Chen, D.; Ma, X.; Zhang, R. How does a static measure influence passengers’ boarding behaviors and bus dwell time? Simulated evidence from nanjing bus stations. Transp. Res. Part A Policy Pract. 2018, 110, 13–25. [Google Scholar] [CrossRef]
- Fernandez, R.; Zegers, P.; Weber, G.; Tyler, N. Effect of Door Width, Platform Height and Fare Collection on Bus Dwell Time. A Laboratory Study. In Proceedings of the World Conference on Transport Research, Lisbon, Portugal, 11–15 July 2010. [Google Scholar]
- Schelenz, T.; Suescun, Á.; Wikström, L.; Karlsson, M. Passenger-centered design of future buses using agent-based simulation. Procedia Soc. Behav. Sci. 2012, 48, 1662–1671. [Google Scholar] [CrossRef]
- Schelenz, T.; Suescun, A.; Karlsson, M.; Wikstrom, L. Decision making algorithm for bus passenger simulation during the vehicle design process. Transp. Policy 2013, 25, 178–185. [Google Scholar] [CrossRef]
- Rexfelt, O.; Schelenz, T.; Karlsson, M.; Suescun, A. Evaluating the effects of bus design on passenger flow: Is agent-based simulation a feasible approach? Transp. Res. Part C Emerg. Technol. 2014, 38, 16–27. [Google Scholar] [CrossRef]
- Liu, Y.; Liu, Z.; Jia, R. Deeppf: A deep learning based architecture for metro passenger flow prediction. Transp. Res. Part C Emerg. Technol. 2019, 101, 18–34. [Google Scholar] [CrossRef]
- Thoreau, R.; Holloway, C.; Bansal, G.; Gharatya, K.; Roan, T.-R.; Tyler, N. Train design features affecting boarding and alighting of passengers. J. Adv. Transp. 2016, 50, 2077–2088. [Google Scholar] [CrossRef] [Green Version]
- Li, Y.; Wang, Y. Urban rail transit platform passenger alighting and boarding movement and experiment research. In Proceedings of the International Conference on Electrical and Information Technologies, Changsha, China, 20–22 October 2017; pp. 889–898. [Google Scholar]
- Seriani, S.; Fernandez, R. Pedestrian traffic management of boarding and alighting in metro stations. Transp. Res. Part C Emerg. Technol. 2015, 53, 76–92. [Google Scholar] [CrossRef]
- Cheng, L.; Chen, X.; Yang, S.; Cao, Z.; De Vos, J.; Witlox, F. Active travel for active ageing in china: The role of built environment. J. Transp. Geogr. 2019, 76, 142–152. [Google Scholar] [CrossRef]
- Yuan, Y.; Yang, M.; Wu, J.; Rasouli, S.S.; Lei, D. Assessing bus transit service from the perspective of elderly passengers in harbin, china. Int. J. Sustain. Transp. 2019, 16, 1–16. [Google Scholar] [CrossRef]
- Kamizuru, T.; Tomii, N. Multi-agent model based simulation of passenger flow on a shinkansen station platform in the peak season. IEEJ Trans. Ind. Appl. 2014, 134, 750–759. [Google Scholar] [CrossRef]
- Tirachini, A. Bus dwell time: The effect of different fare collection systems, bus floor level and age of passengers. Transportmetrica 2013, 9, 28–49. [Google Scholar] [CrossRef]
- Fernandez, R.; Zegers, P.; Weber, G.; Tyler, N. Influence of platform height, door width, and fare collection on bus dwell time: Laboratory evidence for santiago de chile. Transp. Res. Rec. 2010, 2143, 59–66. [Google Scholar] [CrossRef]
- Gu, X.; Abdelaty, M.; Xiang, Q.; Cai, Q.; Yuan, J. Utilizing uav video data for in-depth analysis of drivers’ crash risk at interchange merging areas. Accid. Anal. Prev. 2019, 123, 159–169. [Google Scholar] [CrossRef]
- Henderson, L.F. The statistics of crowd fluids. Nature 1971, 229, 381–383. [Google Scholar] [CrossRef] [PubMed]
- Hughes, R.L. The flow of human crowds. Annu. Rev. Fluid Mech. 2003, 35, 169–182. [Google Scholar] [CrossRef]
- Muramatsu, M.; Irie, T.; Nagatani, T. Jamming transition in pedestrian counter flow. Phys. A Stat. Mech. Appl. 1999, 267, 487–498. [Google Scholar] [CrossRef]
- Blue, V.J.; Adler, J.L. Cellular automata microsimulation for modeling bi-directional pedestrian walkways. Transp. Res. Part B Methodol. 2001, 35, 293–312. [Google Scholar] [CrossRef]
- Cheng, Q.; Liu, Z.; Szeto, W.Y. A cell-based dynamic congestion pricing scheme considering travel distance and time delay. Transp. B Transp. Dyn. 2019, 7, 1286–1304. [Google Scholar] [CrossRef]
- Qi, Z.; Baoming, H.; Dewei, L. Modeling and simulation of passenger alighting and boarding movement in beijing metro stations. Transp. Res. Part C Emerg. Technol. 2008, 16, 635–649. [Google Scholar]
- Lu, Y. Passenger Alighting and Boarding Model and Simulation Based on Cellular Automata. Master’ Thesis, Beijing Jiaotong University, Beijing, China, 2017. [Google Scholar]
- Helbing, D.; Molnar, P. Social force model for pedestrian dynamics. Phys. Rev. E 1995, 51, 4282–4286. [Google Scholar] [CrossRef] [Green Version]
- Helbing, D.; Farkas, I.J.; Vicsek, T. Simulating dynamical features of escape panic. Nature 2000, 407, 487–490. [Google Scholar] [CrossRef] [PubMed] [Green Version]
- Johansson, A.; Helbing, D.; Shukla, P.K. Specification of the social force pedestrian model by evolutionary adjustment to video tracking data. Adv. Complex Syst. 2007, 10, 271–288. [Google Scholar] [CrossRef]
- Johansson, A.; Helbing, D. Analysis of Empirical Trajectory Data of Pedestrians; Springer: Berlin/Heidelberg, Germany, 2010; pp. 203–214. [Google Scholar]
- Apel, M. Simulation of Pedestrian Flows Based on the Social Force Model Using the Verlet Link Cell Algorithm. Master’ Thesis, Poznan University of Technology, Poznan, Poland, 2004. [Google Scholar]
- Verlet, L. Computer “experiments” on classical fluids. I. Thermodynamical properties of lennard-jones molecules. Phys. Rev. 1967, 159, 98–103. [Google Scholar] [CrossRef]
- Lakoba, T.I.; Kaup, D.J.; Finkelstein, N.M. Modifications of the helbing-molnár-farkas-vicsek social force model for pedestrian evolution. Simulation 2005, 81, 339–352. [Google Scholar] [CrossRef]
- Ding, Q.; Wang, X.; Shan, Q.; Zhang, X. Modeling and simulation of rail transit pedestrian flow. J. Transp. Syst. Eng. Inform. Technol. 2011, 11, 99–106. [Google Scholar] [CrossRef]
- Rudloff, C.; Bauer, D.; Matyus, T.; Seer, S. Mind the gap: Boarding and alighting processes using the social force paradigm calibrated on experimental data. In Proceedings of the International Conference on Intelligent Transportation Systems, Washington, DC, USA, 5–7 October 2011; pp. 353–358. [Google Scholar]
- Moussaid, M.; Helbing, D.; Theraulaz, G. How simple rules determine pedestrian behavior and crowd disasters. Proc. Natl. Acad. Sci. USA 2011, 108, 6884–6888. [Google Scholar] [CrossRef] [PubMed] [Green Version]
- Eysenck, H.J.; Lewin, K. Field theory in social science. Br. J. Sociol. 1952, 3, 371. [Google Scholar] [CrossRef]
- Guo, R. Simulation of spatial and temporal separation of pedestrian counter flow through a bottleneck. Phys. A Stat. Mech. Appl. 2014, 415, 428–439. [Google Scholar] [CrossRef]
- Xue, Y.; Li, C.; Huanhuan, T.; Liyun, D. Experimnts of unidirectional and bidirectional pedestrian flows through a bottleneck in a channel. J. Shanghai Univ. 2014, 21, 8. [Google Scholar]
- Hart, P.E. The condensed nearest neighbor rule. IEEE Trans. Inf. Theory 1968, 14, 515–516. [Google Scholar] [CrossRef]
- Zhang, M.; Zhou, Z. Ml-knn: A lazy learning approach to multi-label learning. Pattern Recognit. 2007, 40, 2038–2048. [Google Scholar] [CrossRef]
- Minetti, A.E.; Ardigo, L.P.; Reinach, E.; Saibene, F. The relationship between mechanical work and energy expenditure of locomotion in horses. J. Exp. Biol. 1999, 202, 2329–2338. [Google Scholar] [PubMed]
- Zilbergleit, A.S. Uniform asymptotic expansions of some definite integrals. Ussr Comput. Math. Math. Phys. 1976, 16, 36–44. [Google Scholar] [CrossRef]
- Nakamura, K. The spatial relationship between pedestrian flows and street characteristics around multiple destinations. Iatss Res. 2016, 39, 156–163. [Google Scholar] [CrossRef] [Green Version]
- Pan, Y.; Chen, S.; Qiao, F.; Ukkusuri, S.V.; Tang, K. Estimation of real-driving emissions for buses fueled with liquefied natural gas based on gradient boosted regression trees. Sci. Total Environ. 2019, 660, 741–750. [Google Scholar] [CrossRef] [PubMed]
- Li, C.; Gao, X.; He, B.; Wu, J.; Wu, K. Coupling coordination relationships between urban-industrial land use efficiency and accessibility of highway networks: Evidence from beijing-tianjin-hebei urban agglomeration, china. Sustainability 2019, 11, 1446. [Google Scholar] [CrossRef]
- Xu, T.; Zhang, M.; Aditjandra, P. The impact of urban rail transit on commercial property value: New evidence from wuhan, china. Transp. Res. Part A Policy Pract. 2016, 91, 223–235. [Google Scholar] [CrossRef]
- Sorialara, J.A. Handbook on transport and urban planning in the developed world. Transp. Rev. 2016, 36, 816–817. [Google Scholar] [CrossRef]
Figure 1.
Desired direction of alighting and boarding processes in a metro vehicle and corresponding platform.
Figure 1.
Desired direction of alighting and boarding processes in a metro vehicle and corresponding platform.

Figure 2.
Friction surfaces in the alighting and boarding process.

Figure 3.
Accuracy of the evolutionary K-Nearest-neighbor (KNN) algorithm.

Figure 4.
Model operation process.

Figure 5.
Geographical location of Daxinggong metro station.
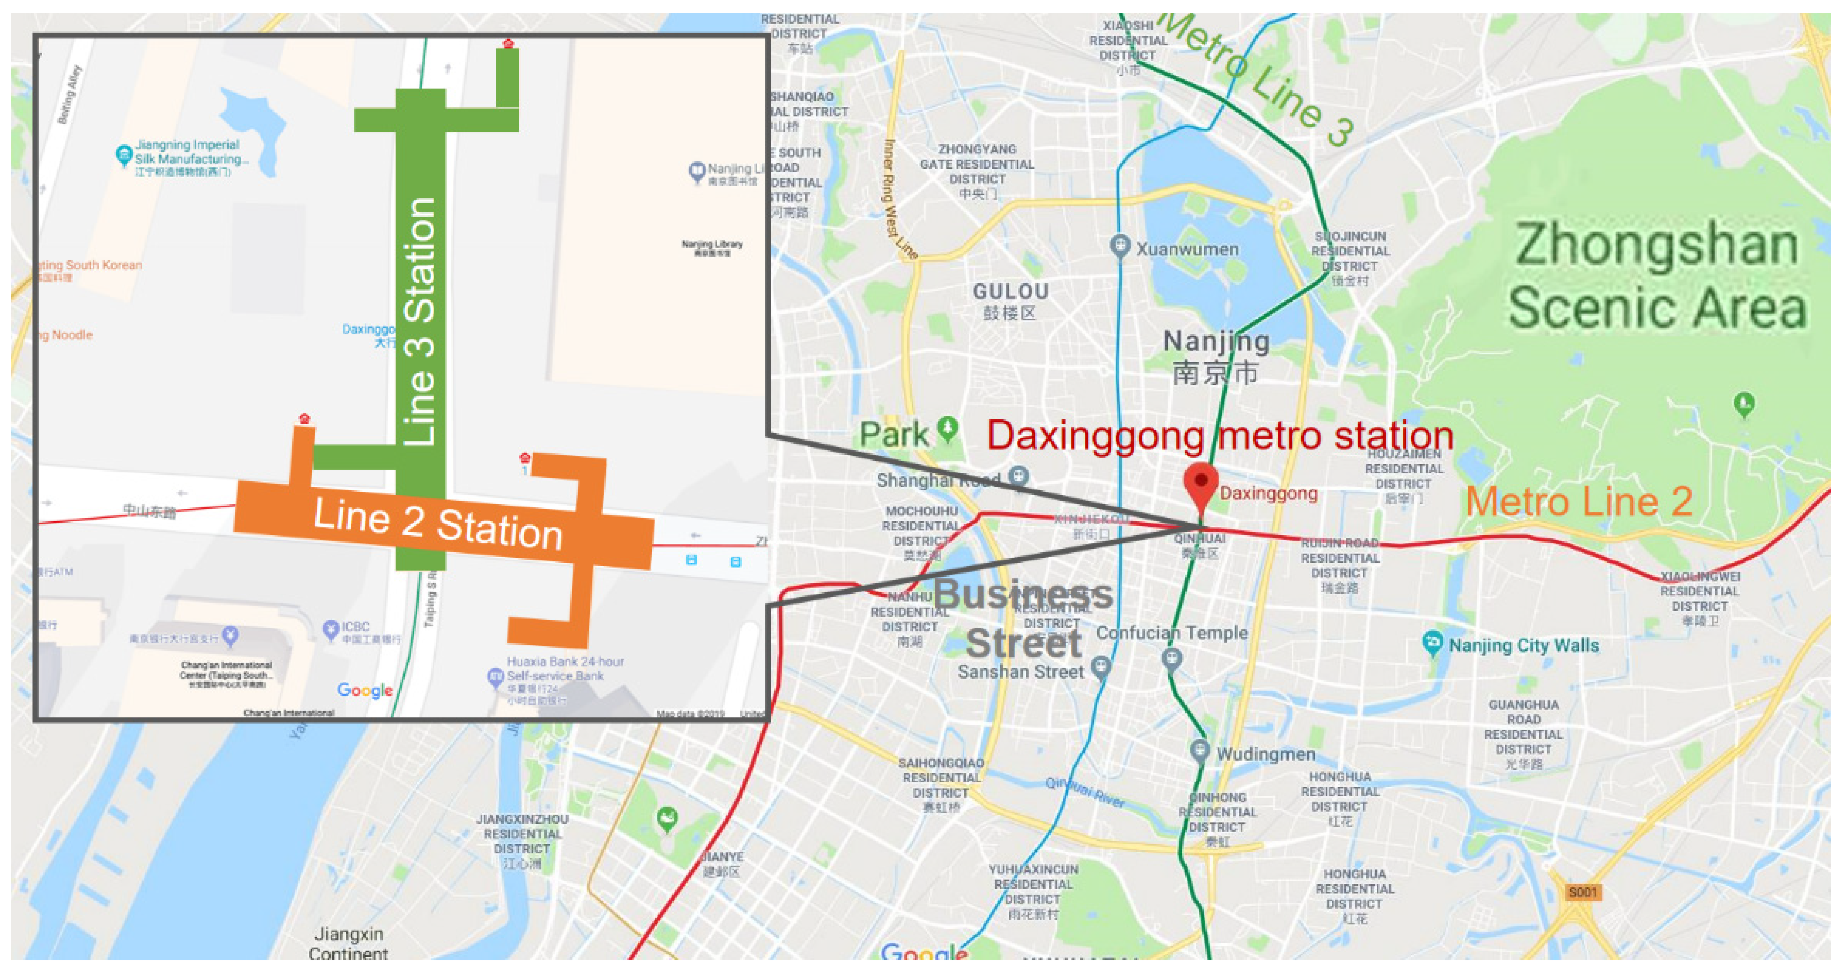
Figure 6.
Platform and the vehicle of Daxinggong metro station: (a) Environment of station platform; (b) environment of vehicle.
Figure 6.
Platform and the vehicle of Daxinggong metro station: (a) Environment of station platform; (b) environment of vehicle.
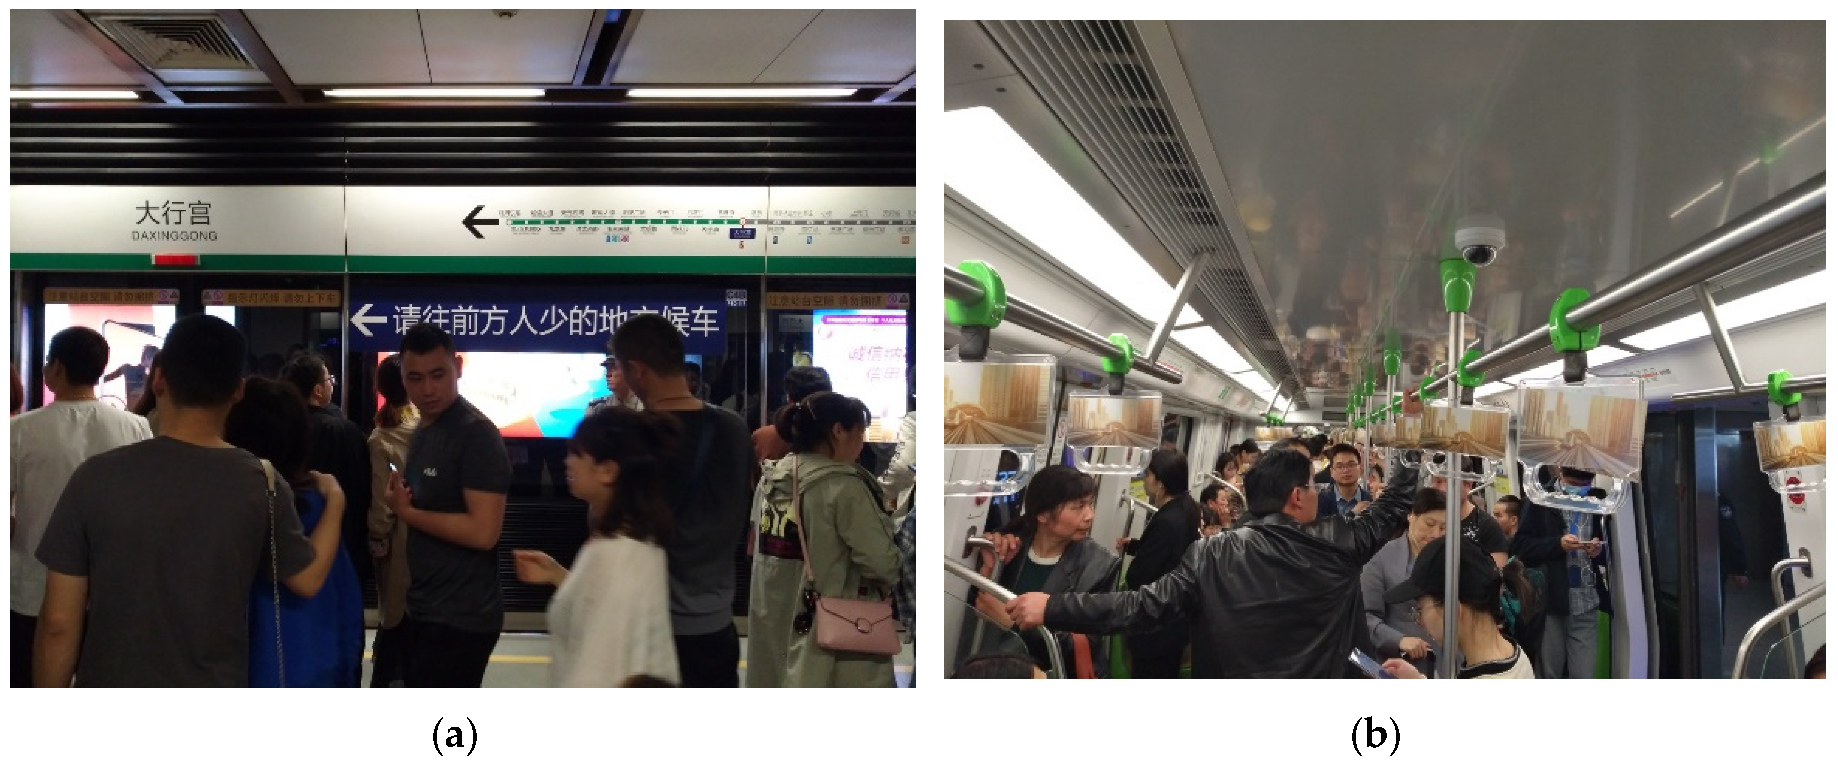
Figure 7.
Schematic diagram of the simulation scene.

Figure 8.
Time consumption and unit flow rate of the alighting and boarding process of the field data: (a) Time consumption of the alighting and boarding process; (b) Unit flow rate of the alighting and boarding process.
Figure 8.
Time consumption and unit flow rate of the alighting and boarding process of the field data: (a) Time consumption of the alighting and boarding process; (b) Unit flow rate of the alighting and boarding process.

Figure 9.
Arrival interval of vehicles and arrival rate of passengers: (a) Arrival interval of the vehicle from peak hours to off-peak hours; (b) Arrival rate of passengers from peak hours to off-peak hours.
Figure 9.
Arrival interval of vehicles and arrival rate of passengers: (a) Arrival interval of the vehicle from peak hours to off-peak hours; (b) Arrival rate of passengers from peak hours to off-peak hours.

Figure 10.
Passenger organizing in scenario 1.
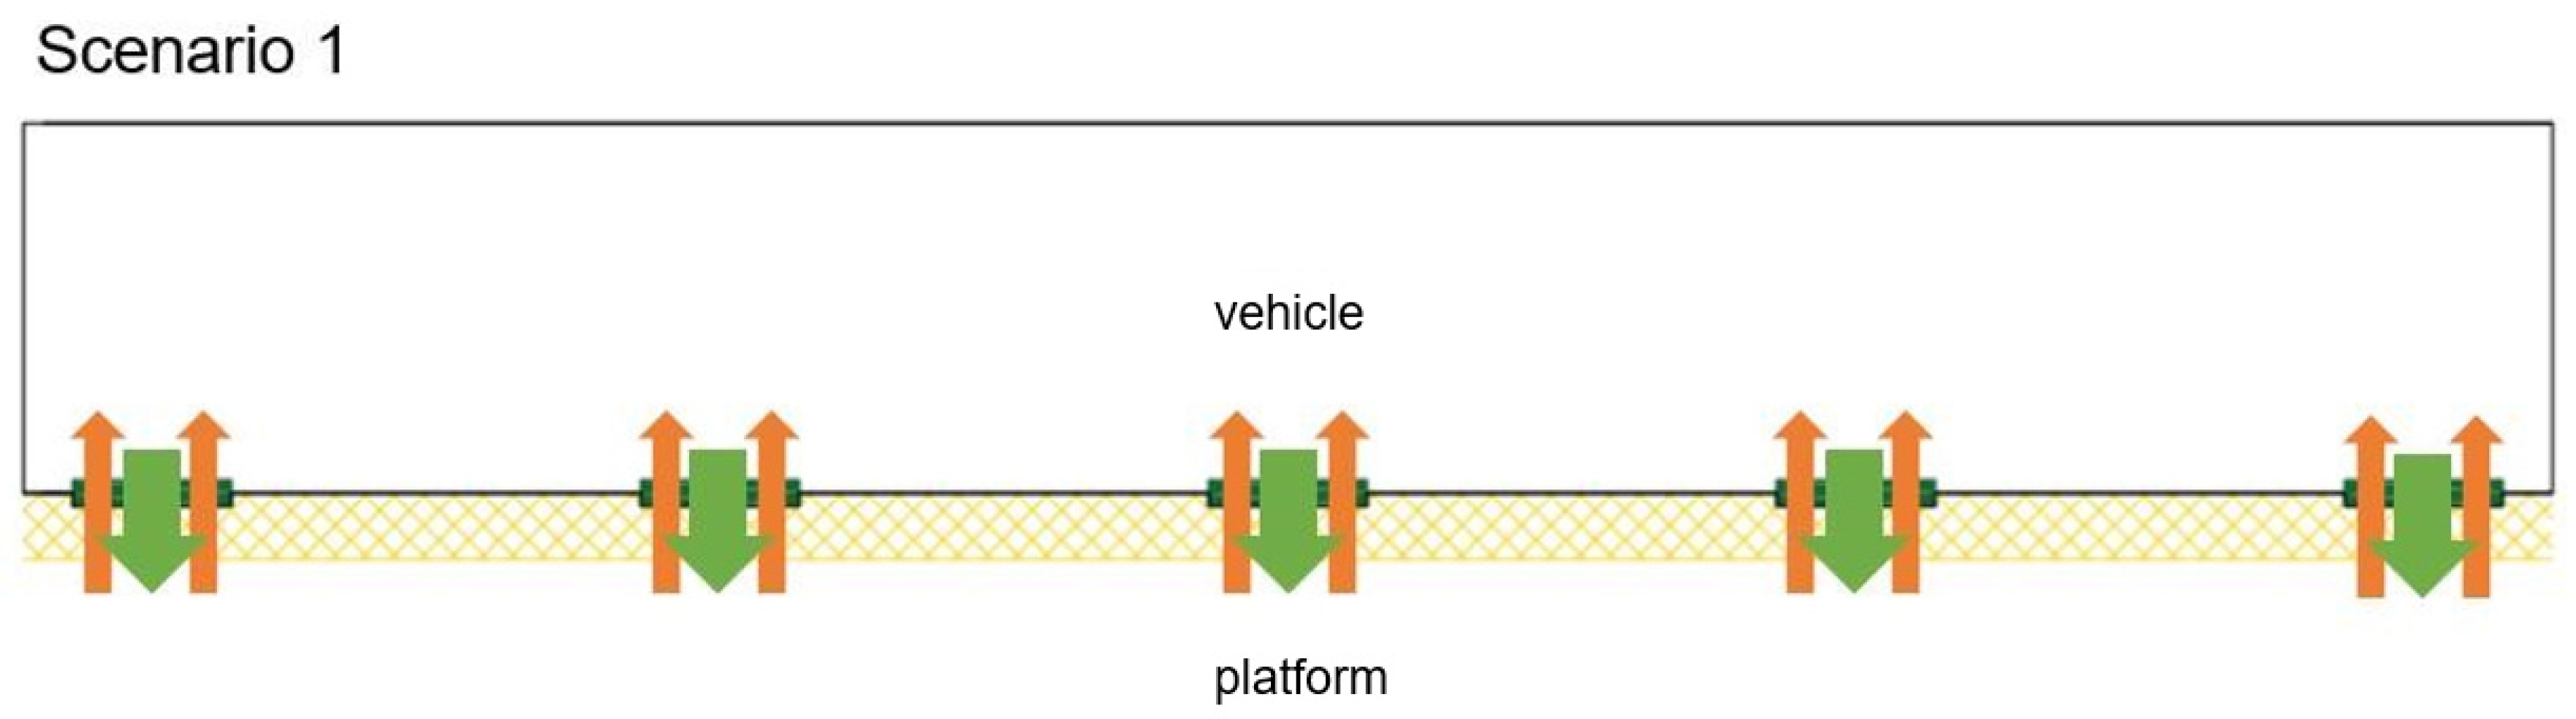
Figure 11.
Passenger organizing in scenario 2.
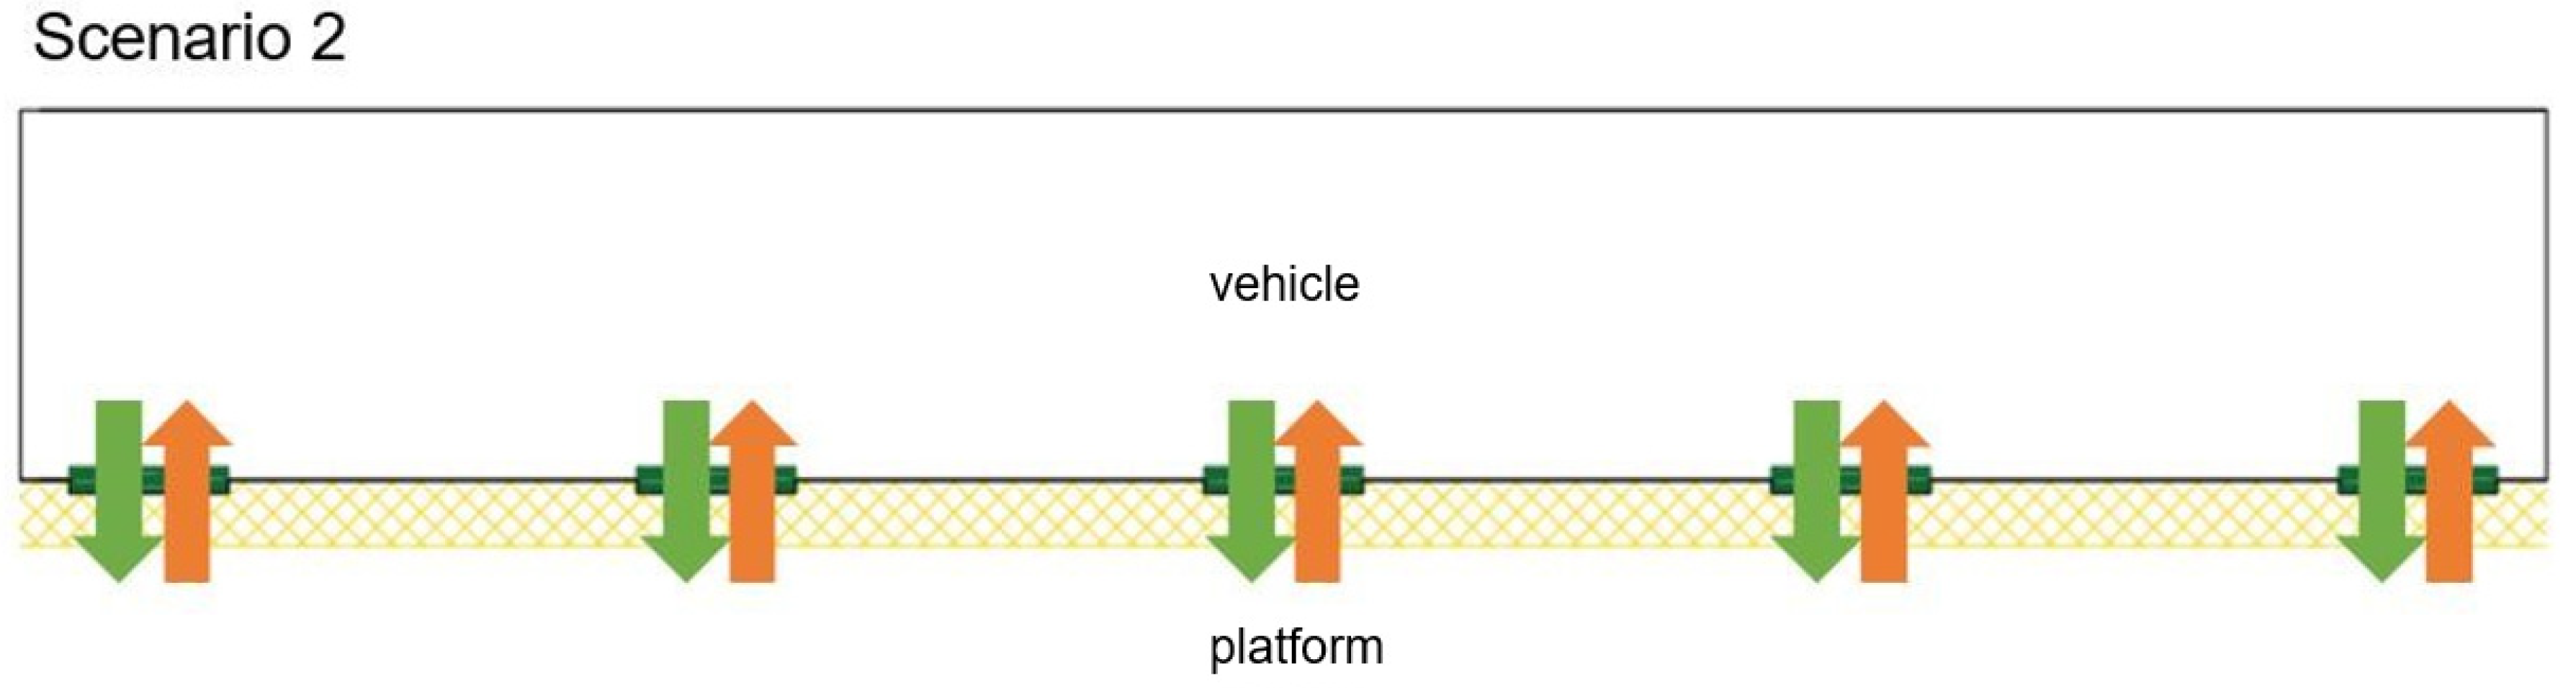
Figure 12.
Passenger organizing in scenario 3.

Figure 13.
Unit flow rate and delay at different density levels: (a) Unit flow of each scenario; (b) delay of each scenario.
Figure 13.
Unit flow rate and delay at different density levels: (a) Unit flow of each scenario; (b) delay of each scenario.

Figure 14.
Comparison of social force work (SFW) in different scenarios.
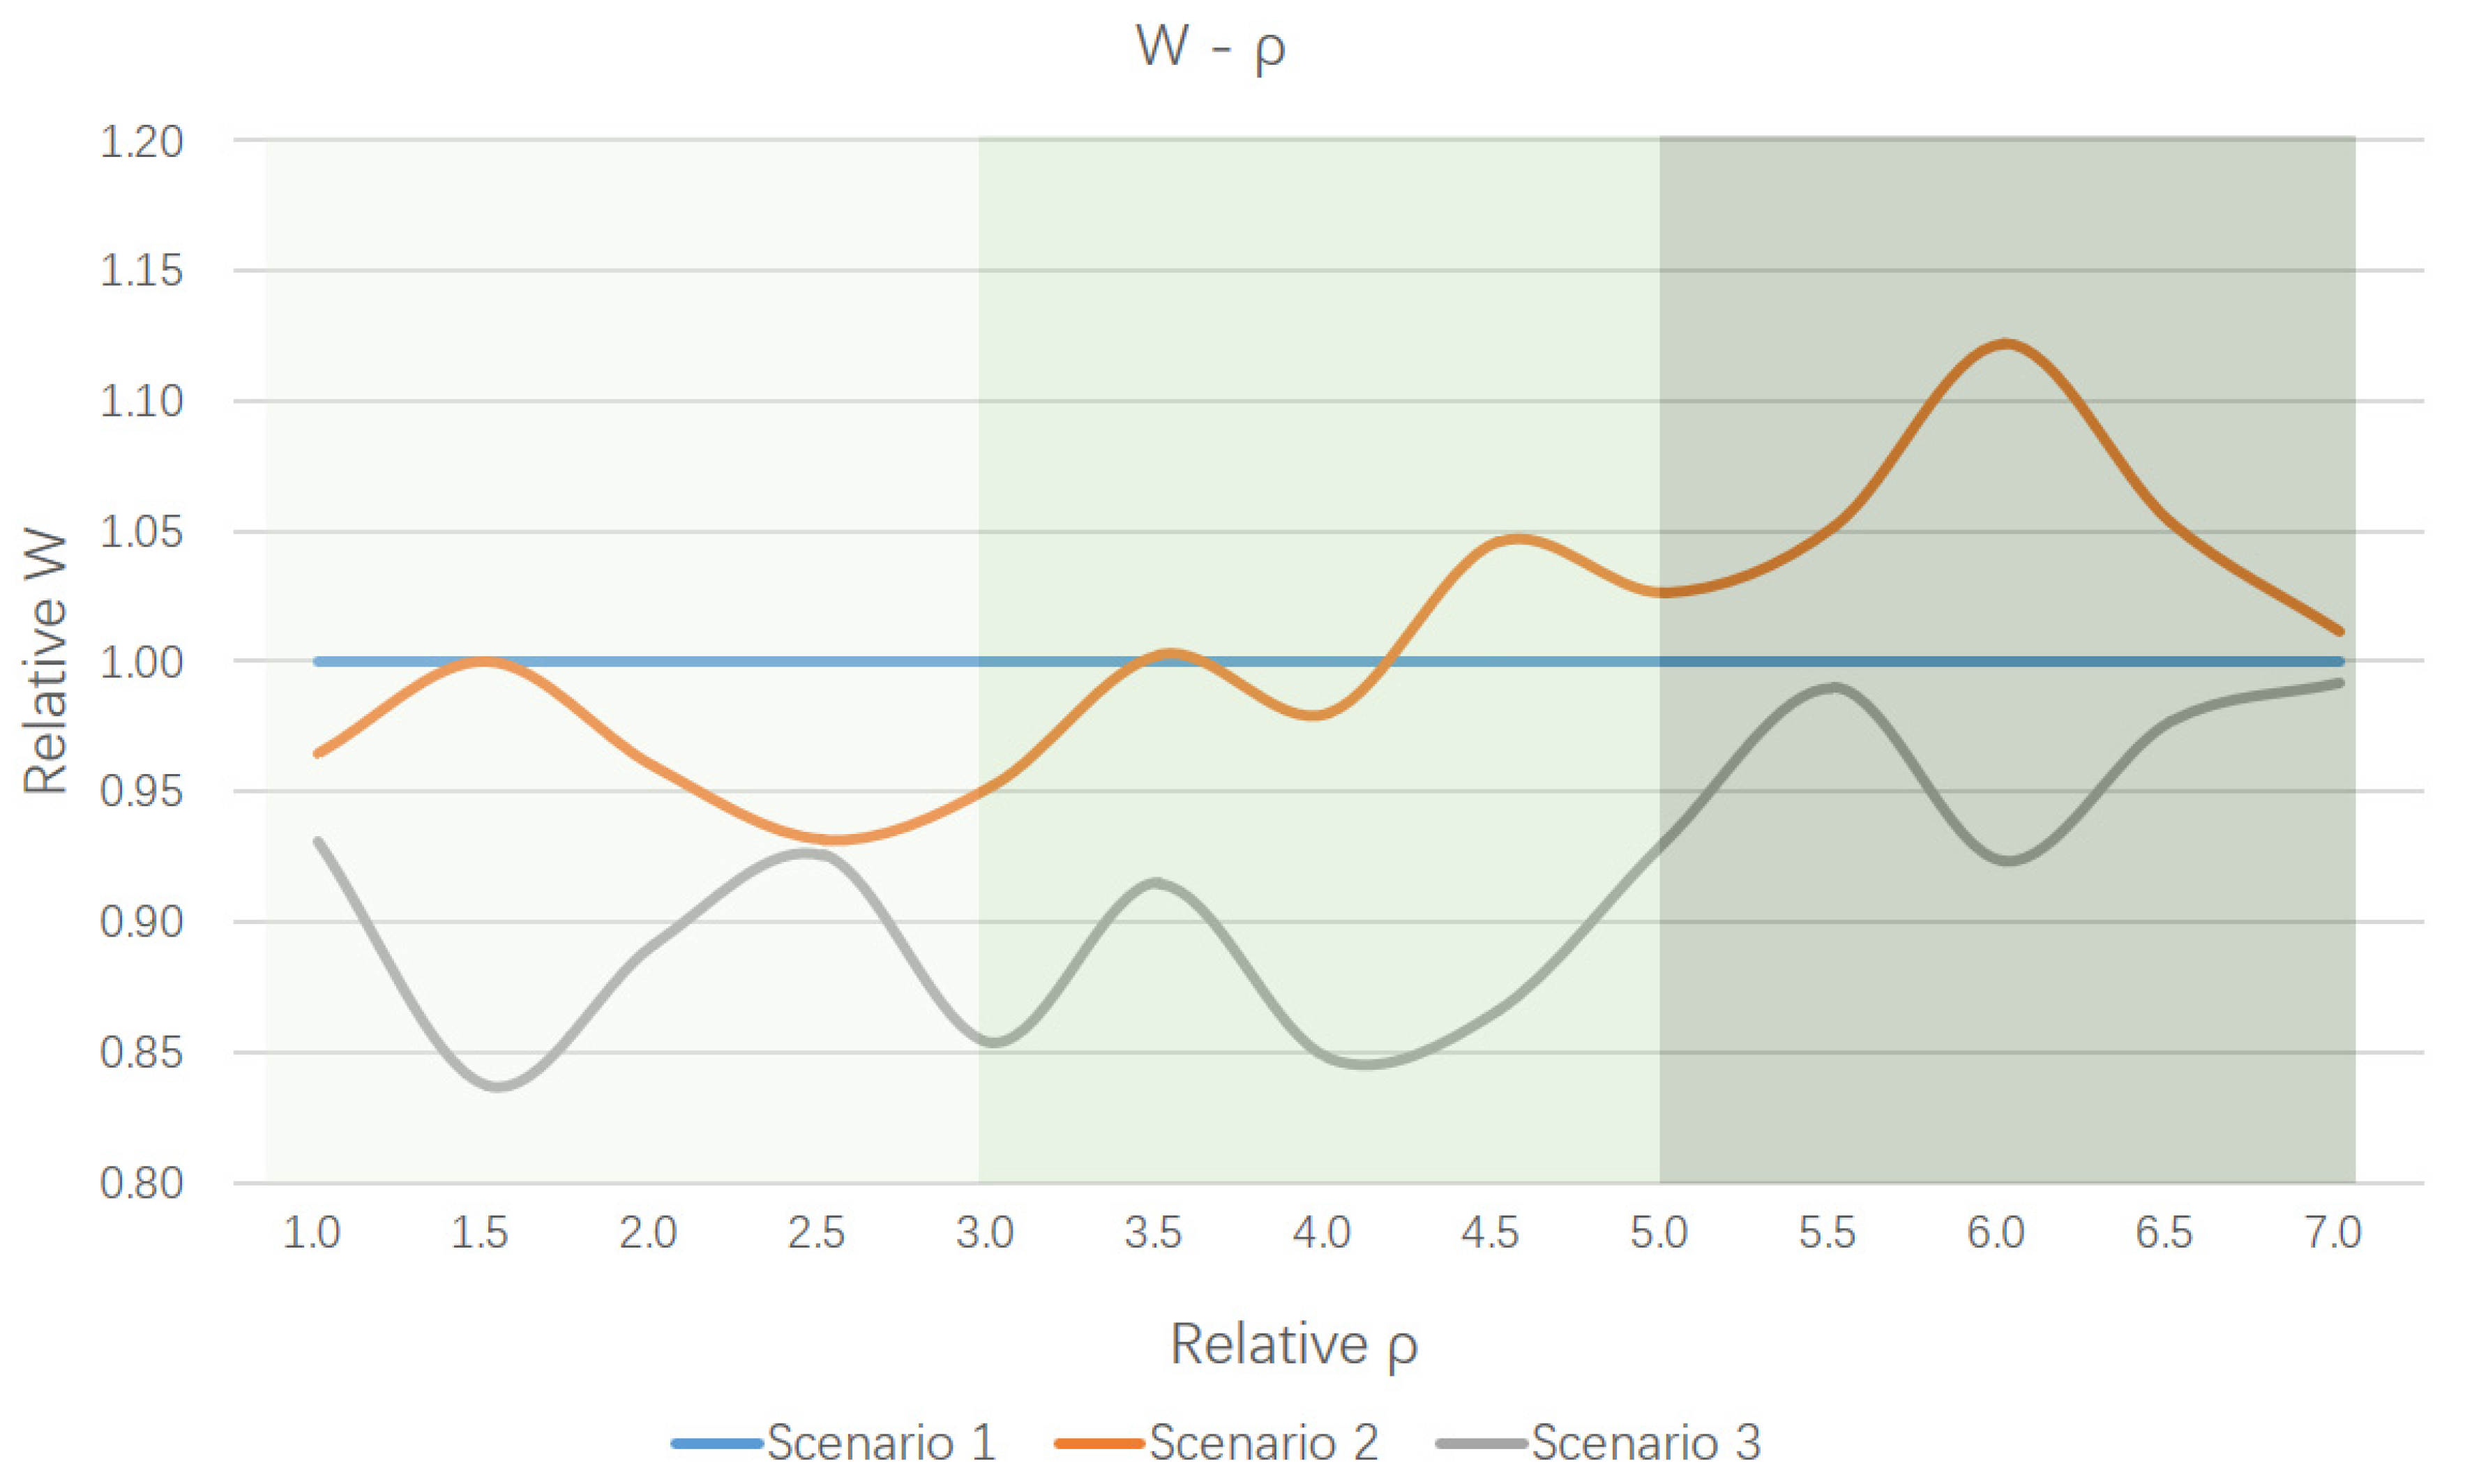
Figure 15.
Examples of instructions in Scenarios 1 & 2: (a) Guidelines of Scenario 1; (b) guidelines of Scenario 2; the Chinese words on the floor mean boarding area and alighting area.
Figure 15.
Examples of instructions in Scenarios 1 & 2: (a) Guidelines of Scenario 1; (b) guidelines of Scenario 2; the Chinese words on the floor mean boarding area and alighting area.


Table 1.
Overall comparison of each scenario.
| Number of Friction Surfaces | Unit Flow Rate (peds/s) | Average Delay (s) | |
|---|---|---|---|
| Scenario 1 | 2 | 3.53 | 2.24 |
| Scenario 2 | 1 | 4.00 | 2.10 |
| Scenario 3 | 0 | 4.93 | 1.84 |
Table 2.
Indicators in different levels of density.
| Low Density | Mid Density | High Density | |||
|---|---|---|---|---|---|
| Scenario 1 | Unit flow rate (peds/s) | Mean | 3.15 | 3.78 | 3.64 |
| S.D. | 0.23 | 0.28 | 0.40 | ||
| Delay (s) | Mean | 1.44 | 1.76 | 2.60 | |
| S.D. | 0.34 | 0.14 | 0.61 | ||
| Scenario 2 | Unit flow rate (peds/s) | Mean | 3.79 | 4.16 | 4.07 |
| S.D. | 0.42 | 0.37 | 0.41 | ||
| Delay (s) | Mean | 1.66 | 1.91 | 2.34 | |
| S.D. | 0.33 | 0.33 | 0.35 | ||
| Scenario 3 | Unit flow rate (peds/s) | Mean | 5.59 | 5.36 | 4.67 |
| S.D. | 0.39 | 0.62 | 0.33 | ||
| Delay (s) | Mean | 1.35 | 1.76 | 1.99 | |
| S.D. | 0.38 | 0.18 | 0.19 |
Table 3.
Comparison of the competitiveness gap in each scenario.
| Scenario | 3 | 2 | 1 |
|---|---|---|---|
| Number of the friction surfaces | 0 | 1 | 2 |
| Competitiveness gap | 1 | 0 |
© 2019 by the authors. Licensee MDPI, Basel, Switzerland. This article is an open access article distributed under the terms and conditions of the Creative Commons Attribution (CC BY) license (http://creativecommons.org/licenses/by/4.0/).
Share and Cite
MDPI and ACS Style
Yu, J.; Ji, Y.; Gao, L.; Gao, Q. Optimization of Metro Passenger Organizing of Alighting and Boarding Processes: Simulated Evidence from the Metro Station in Nanjing, China. Sustainability 2019, 11, 3682. https://doi.org/10.3390/su11133682
AMA Style
Yu J, Ji Y, Gao L, Gao Q. Optimization of Metro Passenger Organizing of Alighting and Boarding Processes: Simulated Evidence from the Metro Station in Nanjing, China. Sustainability. 2019; 11(13):3682. https://doi.org/10.3390/su11133682
Chicago/Turabian StyleYu, Jiajie, Yanjie Ji, Liangpeng Gao, and Qi Gao. 2019. "Optimization of Metro Passenger Organizing of Alighting and Boarding Processes: Simulated Evidence from the Metro Station in Nanjing, China" Sustainability 11, no. 13: 3682. https://doi.org/10.3390/su11133682
Note that from the first issue of 2016, this journal uses article numbers instead of page numbers. See further details here.