Application of Roadway Backfill Mining in Water-Conservation Coal Mining: A Case Study in Northern Shaanxi, China


1
Key Laboratory of Deep Coal Resource Mining, Ministry of Education of China, China University of Mining & Technology, Xuzhou 221116, China
2
School of Energy, Xi’an University of Science and Technology, Xi’an 710054, China
*
Author to whom correspondence should be addressed.
Sustainability 2019, 11(13), 3719; https://doi.org/10.3390/su11133719
Submission received: 24 May 2019
/
Revised: 24 June 2019
/
Accepted: 28 June 2019
/
Published: 8 July 2019
(This article belongs to the Section Energy Sustainability)
Abstract
:The mining induced subsidence and strata deformation are likely to affect the stability of the aquiclude, resulting in loss of water resources in the mining area. In order to reduce the disturbance of coal mining to the overlying strata and to preserve the water resources in the coal mining area, the roadway backfill mining (RBM) method was trialed in Yuyang coal mine in Northern Shaanxi, China. Based on pressure arch theory and ultimate strength theory, a mechanical model was developed to analyze the stability of coal pillars. Then the maximum number of vacant roadways between the mining face and the backfilling face was determined according to the stability of coal pillar and filling body. The method to calculate aquiclude subsidence and deformation was also proposed. Furthermore, as indicated by FLAC3D numerical simulations, the maximum tensile stress subjected by the aquiclude was 0.14 MPa, which is smaller than its tensile strength; the horizontal deformation was 0.24 mm/m, which is also smaller than the critical deformation of failure. Field monitoring data demonstrated a maximum of 2.76 m groundwater level drop in the mining area after mining. The groundwater level was determined to be 4.45~10.83 m below surface, ensuring the normal growth of surface vegetation and realizing the water-conservation coal mining (WCCM).
1. Introduction
Coal is the primary energy source in China. It is estimated that by 2050, coal will still account for 40% of China’s energy consumption [1]. The underground mining method is used for about 92% of the coal resources extraction in China [2]. However, high-intensity underground coal mining has brought about a series of social and environmental problems [3,4]. The overlying strata of coal seam will collapse and subside after coal extraction. This is likely to damage the aquiclude of surface water and ground water, changing the recharge, runoff and discharge conditions and causing water resources pollution and loss. In regions with arid climate and lack of rainfall, the water loss caused by mining-induced damage to the aquiclude can bring about severe ecological consequences [5,6].
To achieve water-conservation coal mining (WCCM), it is necessary to reduce the mining-induced disturbance to the overlying strata, so that the mining-induced stress and deformation of the aquiclude are smaller than the tensile strength and critical deformation of failure [7]. At present, WCCM is achieved by partial mining and backfill mining [8,9]. The former includes strip mining, and room and pillar mining. In partial mining, only part of the coal is mined, while the remaining coal is left to support the roof so as to reduce the movement and deformation of the overlying strata (including the aquiclude). However, the coal recovery rate is usually lower than 40% [10,11]. Backfill mining mainly contains longwall backfill mining and roadway backfill mining (RBM). During longwall backfill mining, as the mining face advances, roof strata behind the face will cave into the mining void (gob), and it takes time for the filling body to reach its designed strength, therefore, a certain amount of subsidence and deformation will occur in the overlying strata. In addition, as the mining operation and backfilling operation are conducted in the same limited space (i.e., the longwall face), the efficiency of each operation will be affected by each other [12]. Compared with the longwall backfill mining, in the RBM, the mining and backfilling are operated in different roadways, so these two operations can be conducted in parallel without causing interference to each other. Moreover, only the roadway roof is exposed and the two sides of the roadway are always supported by either the coal pillar or the filling body. As a result, the roof deformation and subsidence can be reduced significantly; the controlling effect of the filling body on overlying strata movement and aquiclude deformation can be improved as well [13,14,15,16].
Compared with longwall backfill mining, the RBM takes roadway as the basic unit of mining and backfilling. Firstly, the roadways are skip-mined so the roofs will be supported by coal pillars between the mined roadways. Then the mined roadways are backfilled. After the filling bodies reach the designed strength, the coal pillars between the mined roadways are recovered and the roofs are supported by filling bodies [12]. The properties of filling material, the stability of coal pillars and the mechanism of rock subsidence and deformation are the main contents of study on RBM [17,18,19]. In order to reduce the cost of backfilling, gangue, fly ash, aeolian sand and other solid waste near the mining area are generally used as filling aggregate. Before conducting trials underground, the strength and compressibility of the filling material with different components and proportions will be tested in laboratory [20,21,22]. Previous studies showed that coal pillar strength and geometry were the main factors affecting its stability [23,24]. However, the majority of these coal pillar stability studies are carried out under normal mining condition without backfilling, aiming at determining the safety dimensions of coal pillars. In backfill mining, the load bearing stage of coal pillar, filling body, and jointed coal pillar and filling body should be considered for coal pillar stability analysis [13]. Although some studies have shown that backfilling can improve coal pillar strength [25,26], these studies mainly focused on the stability of a single coal pillar in room-pillar mining, rather than the stability of coal pillar group in RBM. In respect of strata subsidence and deformation mechanism, Zhang et al. [27] established a mechanical model to determine the water conducted fracture height in the overlying strata in RBM using the elastic foundation beam theory. Liu et al. [16] analyzed the control mechanism of RBM on mining-induced fracture in the overlying strata. Deng et al. [28] studied the surface subsidence features of layer mining in thick coal seam where RBM is used. The above studies addressed overlying strata movement and fracture development rules in RBM, promoting the use of RBM to achieve WCCM. However, these studies were based on the assumption that the mining roadways were fully backfilled, and the influence of the vacant roadways (VRs) caused by different rates of mining and backfilling on the subsidence and deformation of overlying strata was not considered. In fact, with the increase of VRs number, the load subjected by pillars between VRs increases, as well as the subsidence and deformation of overlying strata. Therefore, the stability of coal pillars together with the subsidence and deformation of overlying strata must be taken into consideration in RBM to ensure the stability of aquiclude, then the mechanism of RBM in WCCM can be revealed and its effect can be evaluated, which would help the promoted application of RBM to WCCM.
In this paper, a mechanical model was developed to analyze the chain failure mechanism of coal pillar group based on pressure arch theory and ultimate strength theory. Then the maximum number of VRs between the mining face and the backfilling face was determined according to the stability of coal pillar and filling body. In addition, the method to calculate mining-induced subsidence of each stratum (including aquiclude and surface) was proposed. Finally, the WCCM effects of RBM trialed at Yuyang coal mine in Northern Shaanxi were presented.
2. Research Background
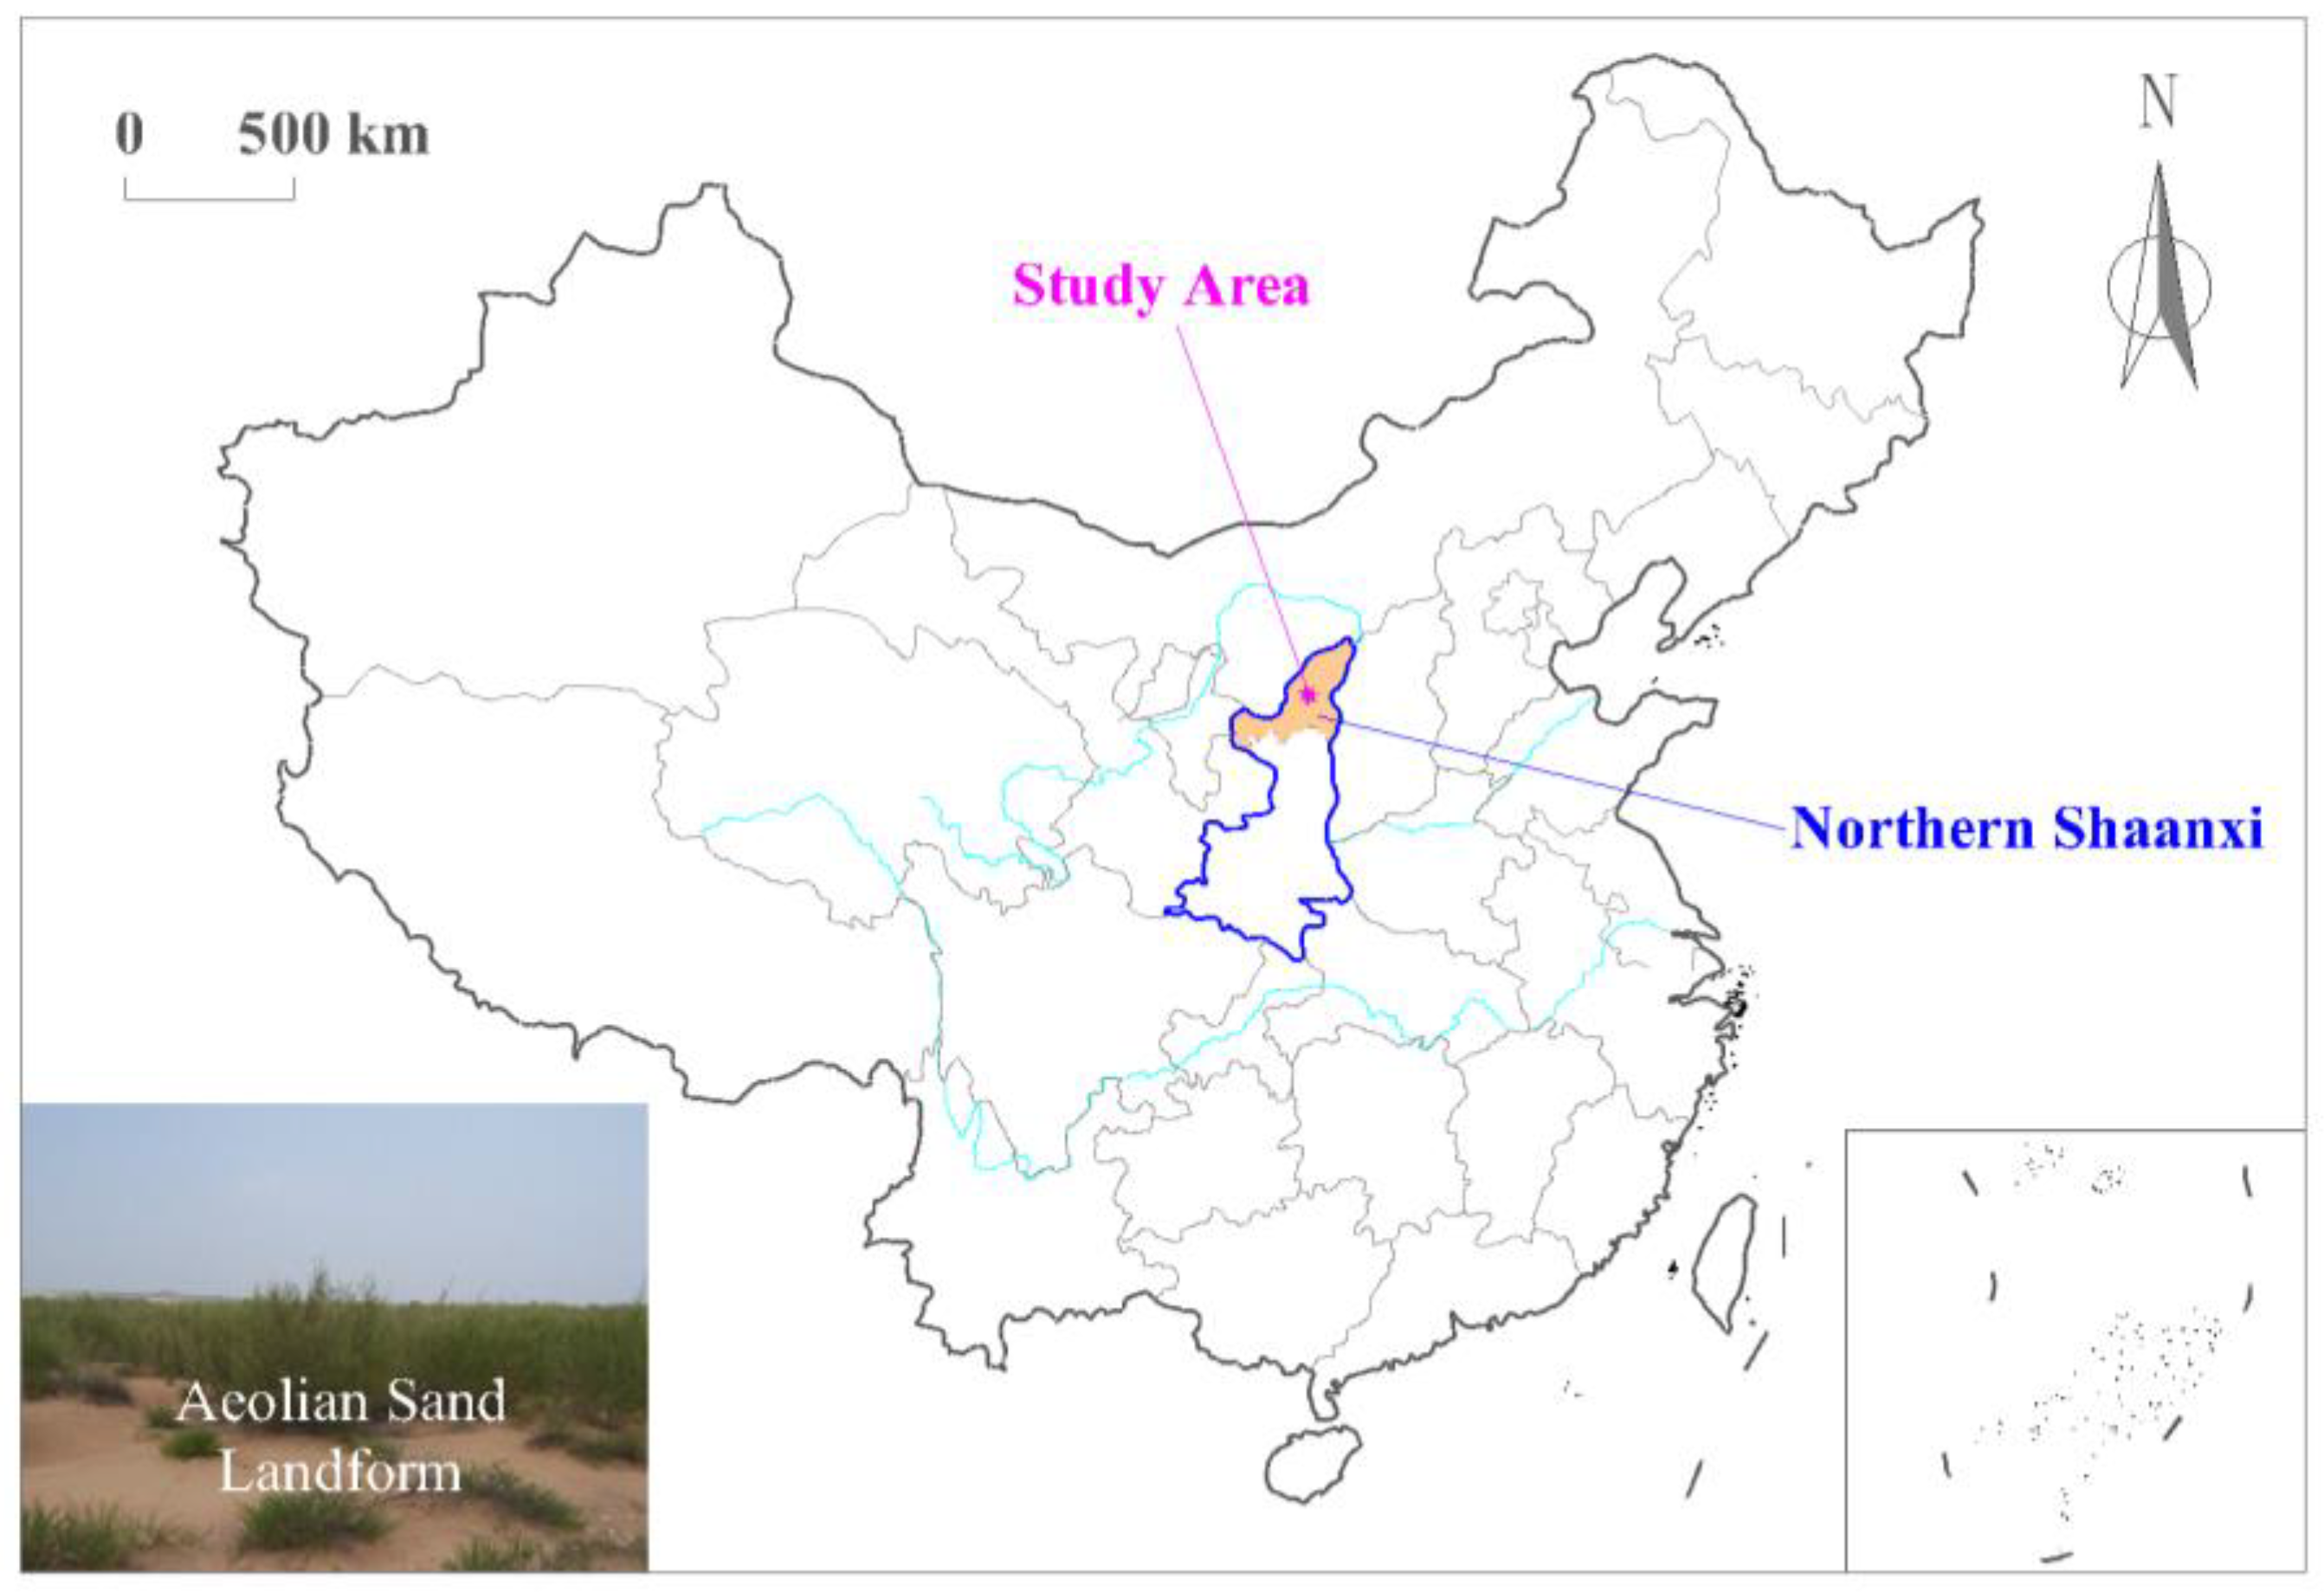
Yuyang coal mine is located in North of Shaanxi, China, on the southern margin of Mu Us Desert, where the ground surface is dominated by sand and semi-fixed dunes (Figure 1) [29]. This region has an arid climate and lacks in precipitation, with an annual precipitation of only about 400 mm. Groundwater is vital for industrial and agricultural development as well as a healthy ecosystem [30]. The RBM scheme designed by Tiandi Science & Technology Co. Ltd. was implemented in Yuyang coal mine, where the gravity driven flow system was used as the backfilling approach. The paste backfilling material mainly consisted of aeolian sand. The surface aeolian sand in the mining area is mainly composed of quartz, feldspar and mica, with particle sizes vary between 0.075 mm and 0.600 mm (0.249 mm on average), which belongs to superfine sand. Therefore, the filling material could be easily transported using pipelines with little chance of blockage [31].
The No.3 coal seam, with an average thickness of 4 m, dip angle of 0.3~3° and burial depth of 100 m~120 m, was extracted in Yuyang coal mine. There is a loose sandy aquifer covering the surface. The underlying weathered strata, with an average thickness of 30 m, acts as the main aquiclude. The stratigraphic column of the mining area is shown in Figure 2.
In RBM, the transport roadway was driven along the strike in the middle of the mining panel. The mining roadways (MRs), with an average length of 85 m and width of 5.5 m, were arranged on each side of the transport roadway. The MRs were successively numbered, mined and backfilled in two separate stages. In the first stage, skip mining was performed for the odd-numbered MRs; and in the second stage, skip mining was performed for the remaining even-numbered MRs. Each MR was sealed with brick wall built at the MR ends and backfilled with paste backfilling material as soon as the coal was extracted, then the mining of the next roadway began. In this process, the backfilling face was always closely behind the mining face (Figure 3). While during the actual underground production, the mining rate and backfilling rate were not always the same due to specific geological conditions of the coal seam and technical constraints, thus a number of VRs would be generated between the mining face and backfilling face (Figure 4). The coal pillars between VRs would therefore bear the overlying load of VRs.
Protodyakonov’s equilibrium arch (PEA) theory is a classical theory for the evaluation of roadways stability [32]. According to the PEA theory, during the excavation of a roadway, an arch-like zone is developed in the strata above the roadway [33]. Strata within this zone will subside and deform, while beyond this zone, the rocks remain stable and a self-bearing arch is formed. When there are several adjacent VRs, the arch structures above each roadway may join together forming a new arch, which can be referred as extended pressure arch structure (Figure 5), and pillars between roadways will only subject to the overburden loads below the arch [34].
If there are few VRs, the extended pressure arch is small, as well as the load to coal pillars and subsidence. With the increase of VRs number, the arch extends further upward, and the load to coal pillars and subsidence also increase. When the arch reaches the aquiclude, the aquiclude will deform and subside, which may result in failure. In addition, the width of coal pillars between VRs are generally small (width-height ratio is less than 2) for the convenience of mining. If one of the coal pillars fails under heavy load, the load is then transferred to adjacent coal pillars, increasing the chance of chain damage of the coal pillar group. Therefore, it is necessary to determine the maximum number of VRs between mining face and backfilling face while ensuring that the coal pillars will not fail.
Figure 5 shows the influence of the VRs on overlying strata. For a stratum at a certain height, if there is only one VR (VR 1), a pressure arch is formed (arch a). As the stratum is above the top of arch a, no subsidence and deformation would occur on the stratum. If there are two VRs (VR 1 and VR 2), an extended pressure arch will be formed (arch b). Part of the stratum (CD section) falls into the range of arch b, then slight deformation and subsidence would occur, e.g., the straight line CD gradually becomes the arc CD. If there are three VRs (VR 1, VR 2 and VR 3), a larger pressure arch will be formed (arch c). If the majority of the stratum falls in the range of arch c, significant deformation and subsidence would then occur, e.g., the straight line BE turns into the arc BE.
3. Coal Pillar Stability
3.1. Coal Pillar Load
3.1.1. Protodyakonov’s Equilibrium Arch Theory
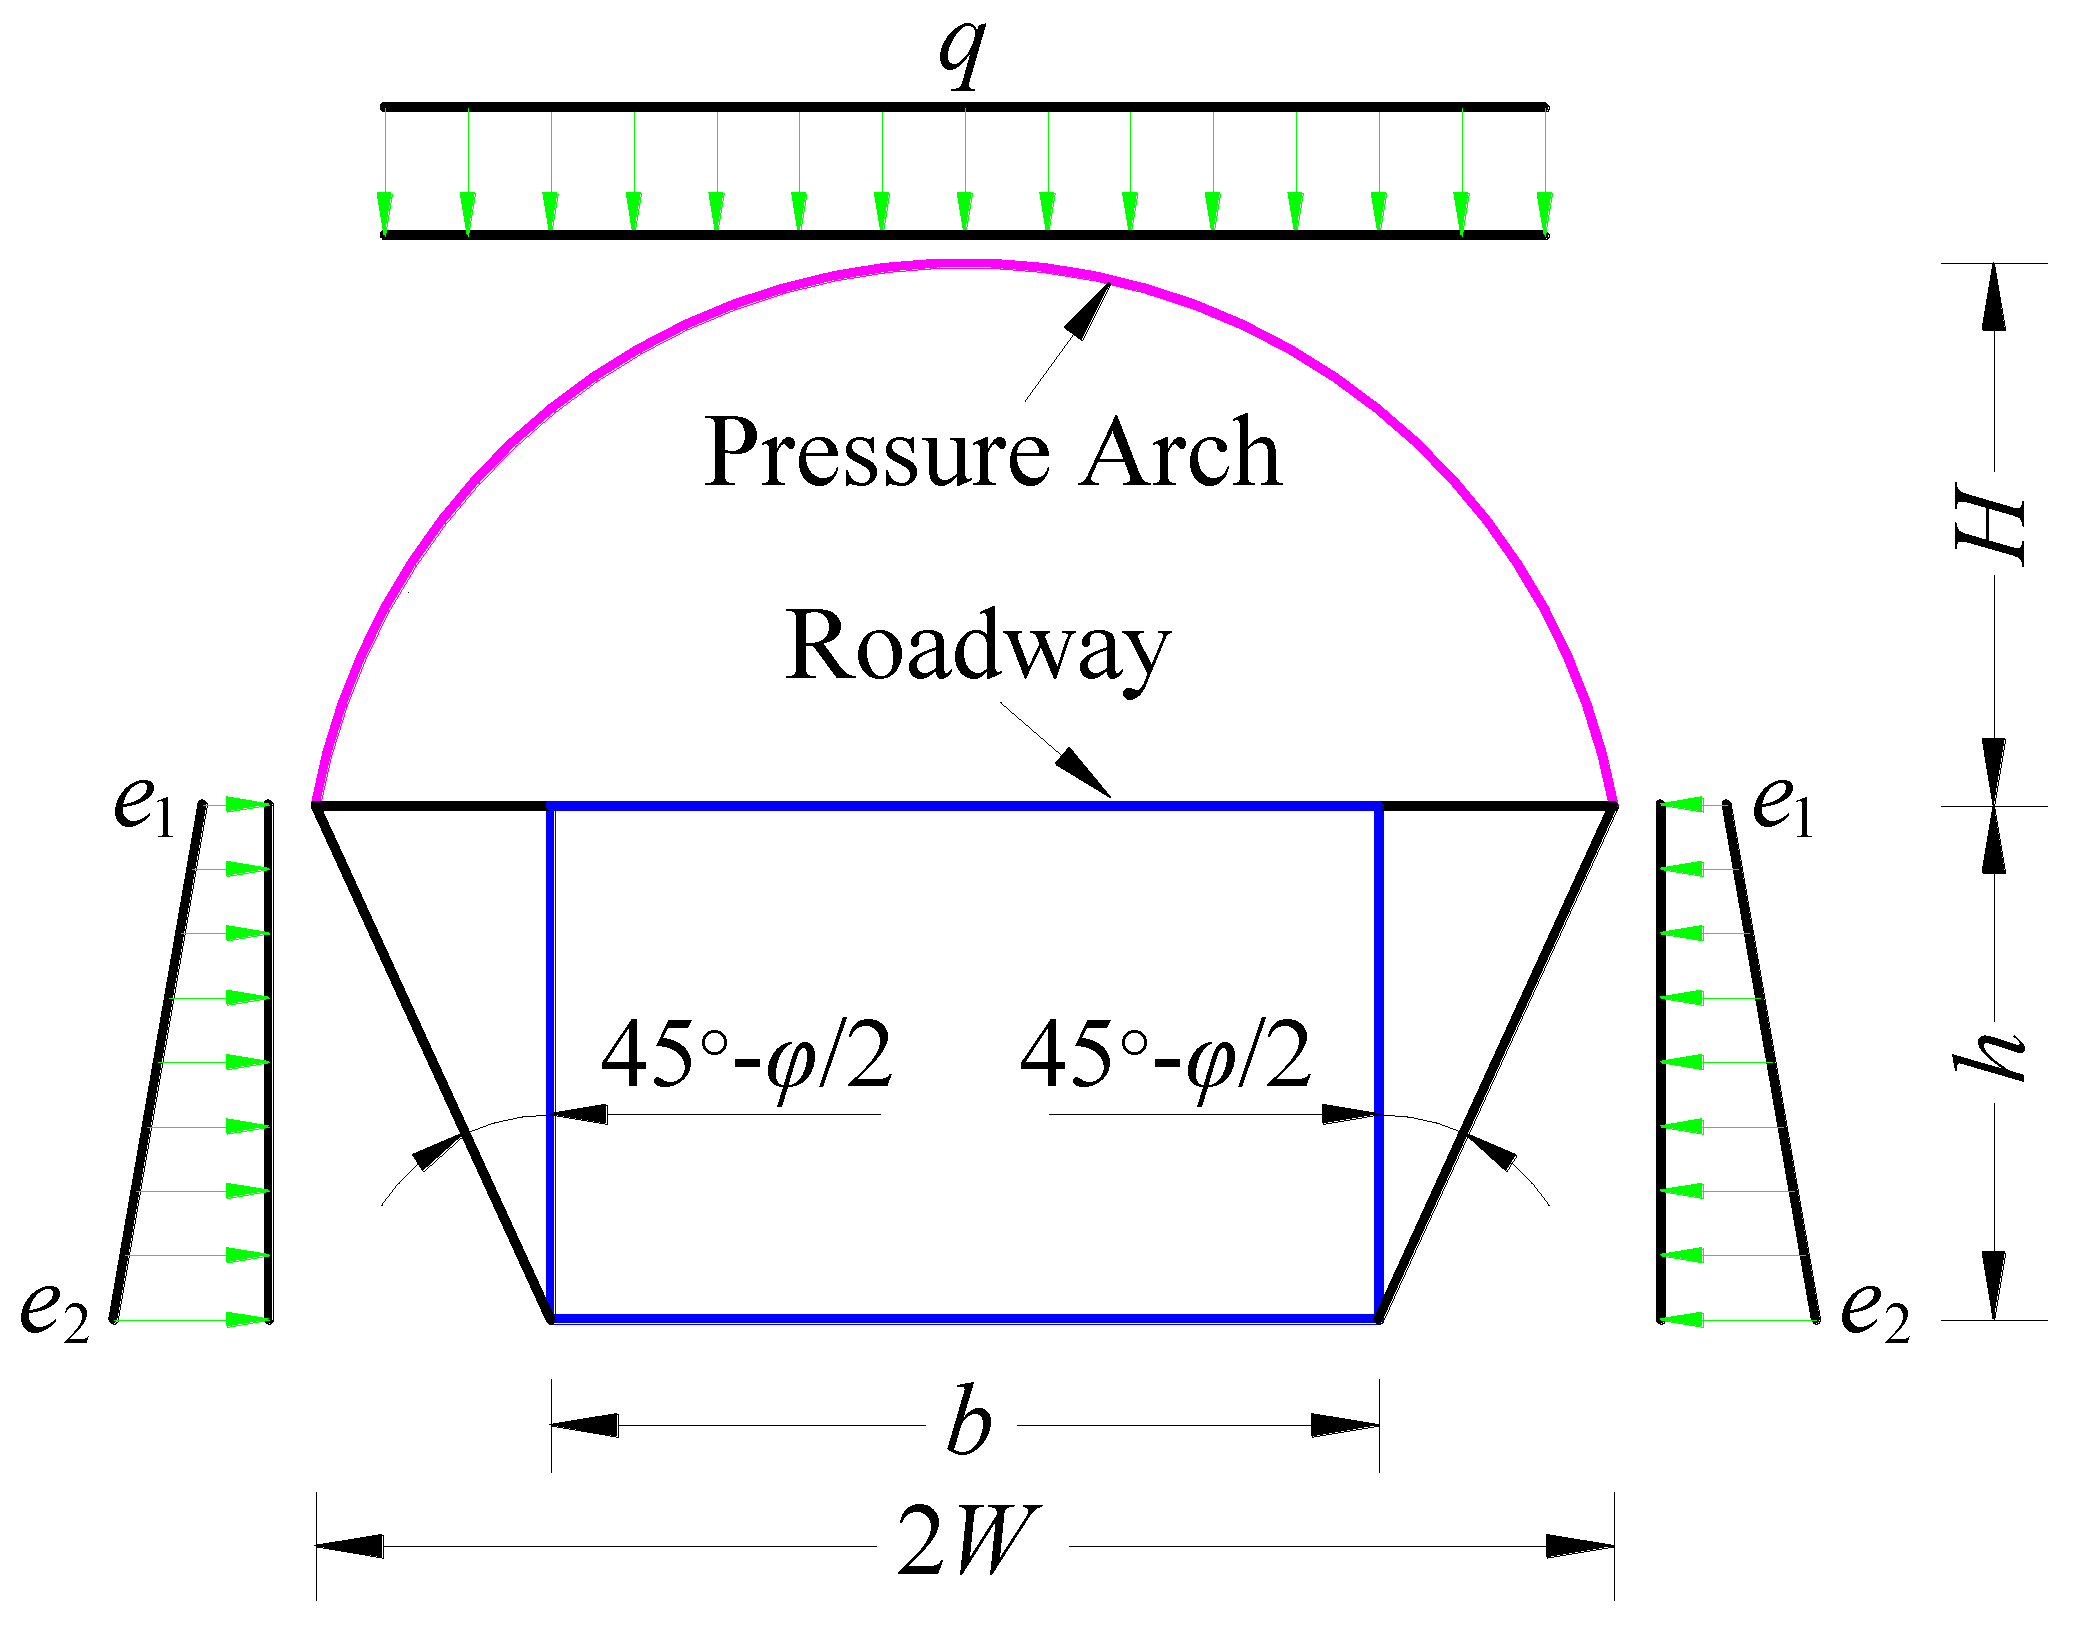
Figure 6 illustrates the general structure of the PEA. h is the mining height and b is the width of the MR (the dimension of MR is identical to VR and coal pillar between VRs, so h and b can also respectively represent the height and width of VR and coal pillar). H and 2W represent the height and width of the arch, respectively. The angle between the slip planes and the roadway ribs is 45° − φ/2, where φ is the internal friction angle of the overlying strata [33]. Based on the PEA theory, roadway roof pressure q can be calculated as follows:
where γ is the average bulk density of the overlying strata within the pressure arch (N/m3). The horizontal pressures e1 and e2 are evaluated as
The span of the PEA can be calculated as follows:
Given the symmetry of the PEA, only the left half of the arch is analyzed (Figure 7). Taken the arch top as the origin, a rectangular coordinate system is built. If the axial force at the origin is T, according to the PEA theory, the torque balance equation at any point M(x,y) on the arch is [34]:
The value of the axial force T acting on the arch top equals to the horizontal thrust T′ at the arch feet, but they are opposite in direction. In order to ensure the structural stability of the PEA, the horizontal thrust T′ should meet the following condition:
That is, the horizontal thrust T′ should be less than or equal to the friction generated by the vertical pressure of the overlying strata. The Protodyaknove’s number f can be approximately calculated as one tenth of the uniaxial compressive strength of the surrounding rock or coal [33]. For safety reasons, T′ usually takes the value as half of the friction force, [34] i.e.,:
According to Formulas (5) and (7), the arch line equation for the PEA can be written as:
and the maximum height of the PEA is:
3.1.2. Extended Pressure Arch Structure
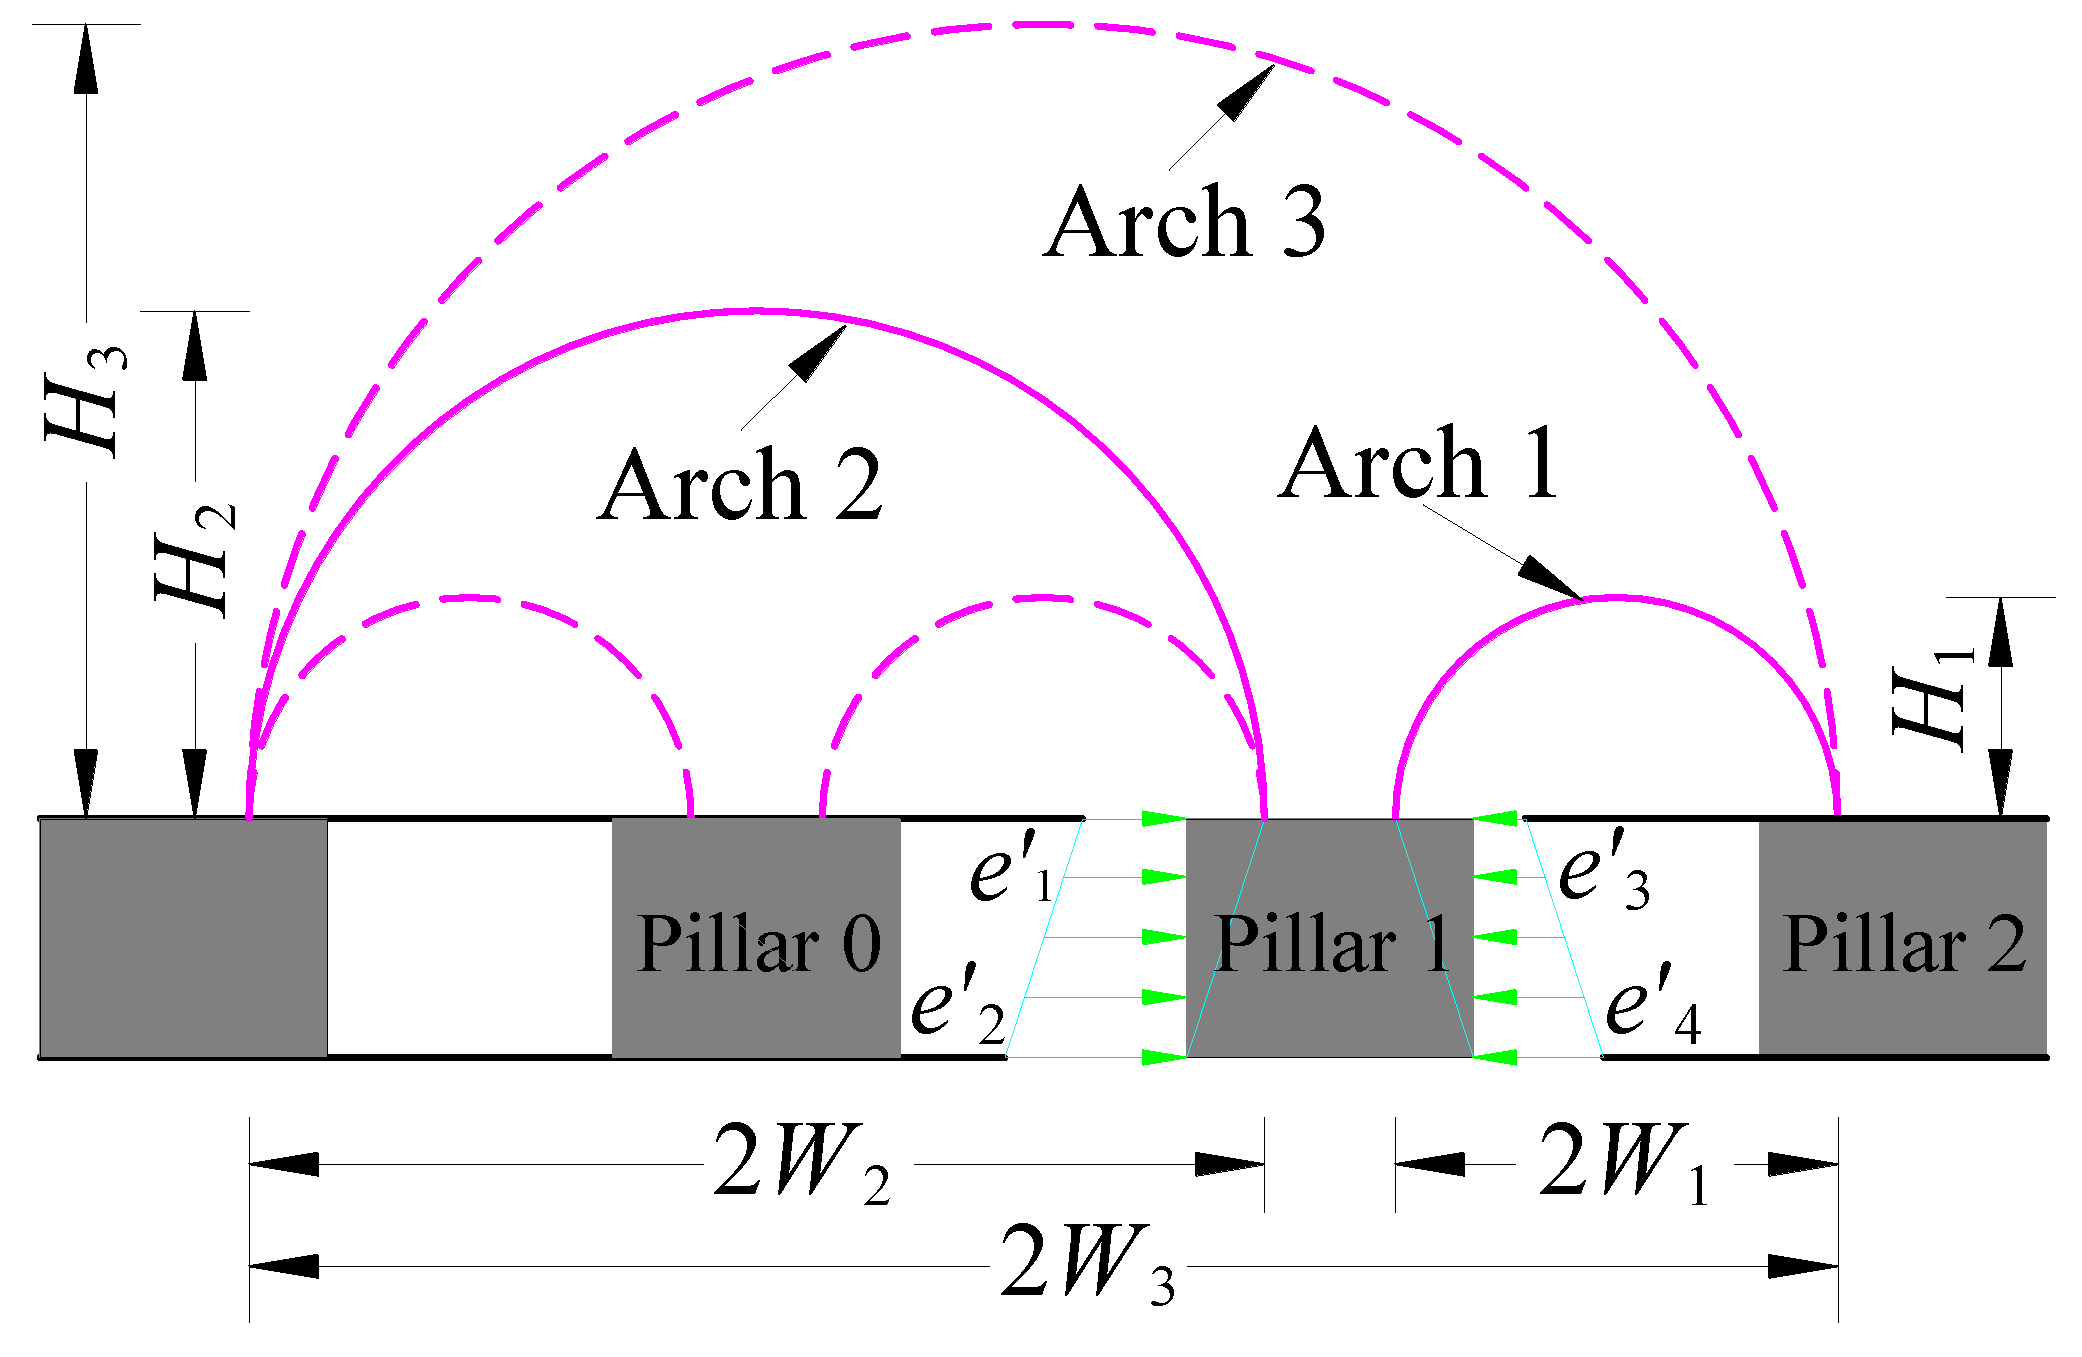
As shown in Figure 8, if the number of VRs between the mining face and backfilling face is too large, a weak coal pillar, referred as pillar 0, may fail due to primary fissures in coal pillar or stress concentration induced by mining, then the two arches on both sides of the failed pillar would join together to form a new arch, which is referred as arch 2. Thus the coal pillar adjacent to the failed pillar, named pillar 1, will subject to two different horizontal forces from arch 1 and arch 2, and the resultant force is
This resultant force will cause increased deformation of pillar 1, leading to the stress transfer from pillar 1 to pillar 2. Thus a bigger arch (i.e., arch 3) is formed. For the ease of expression, pillars without sufficient supporting force, like pillar 0 and pillar 1, are referred as “failed pillars”. Then the horizontal resultant force on a pillar is:
where m is the number of failed pillars.
According to Formula (11), the more the failed pillars, the greater the horizontal resultant force. A greater horizontal resultant force will cause the failure of the next pillar, resulting in continued damage of the coal pillar group until the horizontal force is balanced by the horizontal thrust from unmined coal seam [34,35]. This will eventually result in the extended pressure arch structure, as shown in Figure 9 [36,37].
According to Formulas (4), (8) and (9), the span and height of the extended pressure arch are respectively:
where N is the number of VRs.
As known from the effective area theory [38], the support area of the k-th coal pillar is Ak (Figure 9). Therefore, the load subjected by the k-th coal pillar on the left (right) side of the Y axis is:
The pillar bearing the maximum load is the first coal pillar on the left (right) side of the Y axis, i.e.,:
3.2. Coal Pillar Strength
The coal pillar strength depends on the shape and size of the coal pillar, and the strength of coal sample as well. The commonly used empirical formula for coal pillar strength determination is given in Table 1.
According to the ultimate strength theory, when the load subjected by the coal pillar exceeds its compressive strength, the coal pillar will fail. Since coal pillar with b/h < 2 is more likely to fail, a safety factor is introduced to ensure the stability of the coal pillar [39,40].
where F is the safety factor (1.5~2); Pmax is the maximum load borne by the coal pillar (MPa).
3.3. Maximum Number of VRs
Combining Formulas (16) and (17), together with the pillar strength σp obtained through empirical formulas in Table 1, the critical safety distance We between mining face and backfilling face can be determined. Substituting We into Formula (12), then the integral part of the solution N will be the maximum number of VRs which could ensure the stability of coal pillars.
3.3.1. Uncertainties of the Analysis
In Yuyang coal mine, the mechanical properties of rocks were obtained from laboratory tests with standard samples (Φ50 mm × 100 mm). Mining parameters such as width of the MR and mining height were analyzed as influencing factors of the maximum number of VRs by orthogonal experiment. The mining height is set as 3~4.5 m. In order to improve mining efficiency and reduce the roof subsidence before backfilling, the width of the MR is set as 5~6 m [12]. Each factor was applied to several levels, i.e., 3 m, 3.5 m, 4 m and 4.5 m for the mining height, and 5 m, 5.5 m and 6 m for the MR width. All the values of parameters are shown in Table 2.
3.3.2. Results and Analysis
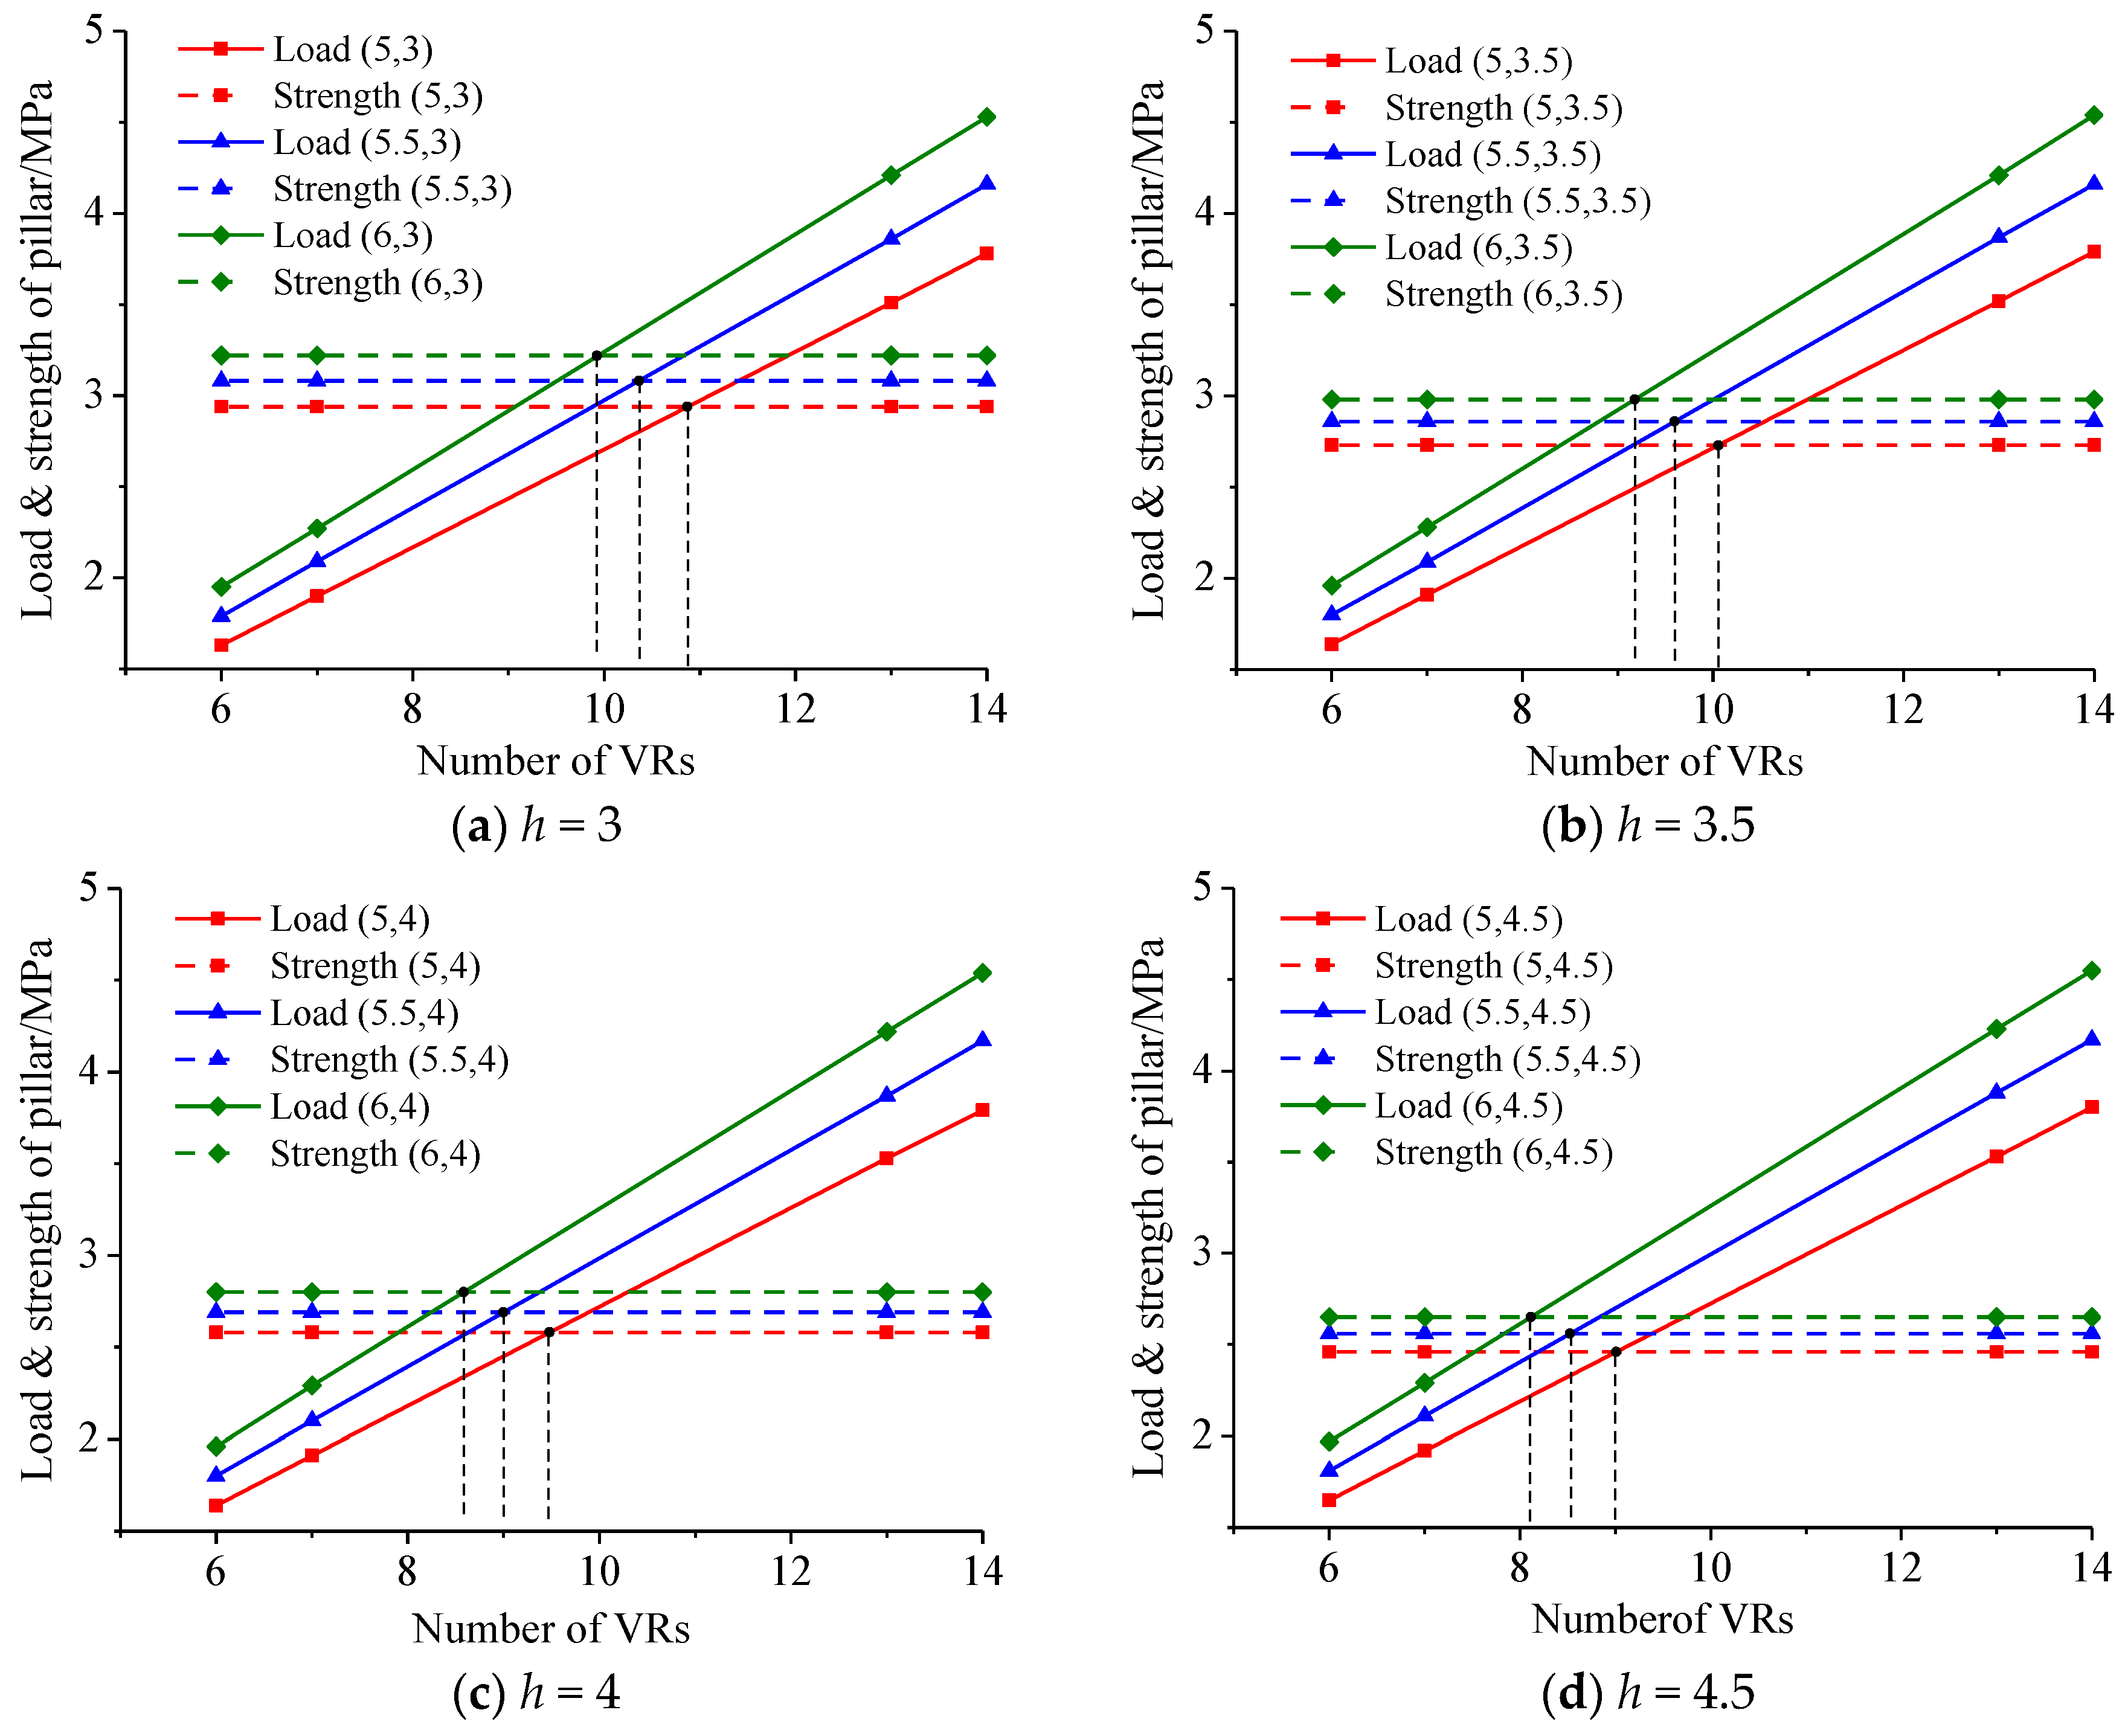
Figure 10 shows the calculated results of the maximum load and strength of pillar with different number of VRs, mining height and width of the MR. For the determined values of each group (b,h), there is an intersection between the load-number of VRs curve and strength-number of VRs curve. Then the integral part of horizontal axis values of the intersection point is the maximum numbers of VRs ensuring no instability failure of the coal pillars. During the second stage of mining, the coal pillars were replaced with filling bodies. Using the same method and all the parameters shown in Table 2 (except the uniaxial compressive strength of filling body which is 4.80 MPa), the maximum numbers of VRs in the second stage can also be calculated. The maximum numbers of VRs with different values of b and h during the two stages are presented in Table 3.
It can be observed from Figure 10 that the maximum load subjected by coal pillar showed an approximately linear increase with the increase of VRs number, while the pillar strength is irrelevant to the number of VRs. When the number of VRs reaches a certain value, the maximum load will be greater than the pillar strength indicating the possibility of failure of coal pillar. With the increase of MR width, the strength of pillar and the maximum load also increase. It is noted that the former (i.e., pillar strength increase) is conducive to maintain the stability of coal pillars while the latter (i.e., load increase) has negative influence on pillars stability. As the increasing rate of the maximum pillar load is higher than that of pillar strength, the maximum numbers of VRs decrease with the increase of MR width. Mining height has a significance influence on pillar strength while its influence on pillar load is minor. With the increase of mining height, the pillar strength decreases, which will cause the decrease of VRs numbers. In summary, although using large size of MR could reduce the times of movements for mining face and backfilling face and improve mining efficiency, its influence on stability of coal pillar is negative. Therefore, the parameters need to be optimized further according to the actual situation.
It can be concluded from Table 3 that, with the width of the MR vary from 5 m to 6 m and mining height vary from 3 m to 4.5 m, the maximum number of VRs in the first mining stage is 8~10, while in the second stage it is 3~4. Considering mining safety, mining efficiency and backfilling effects, the width of MR is determined as 5.5 m and the maximum number of VRs is determined as 8 in the first stage and 3 in the second stage.
4. Overlying Strata Subsidence
4.1. Immediate Roof Subsidence
During the two stages of RBM, the roof subsidence U mainly consists of three parts, the roof subsidence (U1) after mining in the first stage, the roof subsidence (U2) after mining in the second stage, and the roof subsidence (U3) after final stabilization of overlying strata, i.e.,:
After the extraction of roadways in the first stage, the load above the roadway is transferred to the coal pillars on each side of the roadway. The immediate roof subsides under extra loading, and the subsidence is U1. So the height of the filling body in the first stage is h-U1. During solidification of the paste backfill material which is mainly composed of aeolian sand, the size of the filling body reduces slightly. With small roof subsidence after backfilling, the support provided by the filling body is insufficient and the load is mainly borne by the coal pillar.
During the second stage of mining, the load previously borne by the coal pillars is transferred to the filling body as the recovery of coal pillars, leading to compression of the filling body and the subsidence of immediate roof with an amount of U2. Thus the height of the filling body in the second stage is h-U1-U2.
As the expansion of mining area, the extent of mining-induced overlying strata subsidence will eventually develop upwards to the ground surface. At this stage, the load of the coal seam is the weight of all strata ranging from the roof to the ground surface, and the immediate roof subsidence is U3.
4.1.1. Roof Subsidence U1
After mining in the first stage, the two sides of the coal pillars are subjected to bidirectional compression. Under high load, the coal pillars tend to yield characterized with low load bearing capacity and considerable horizontal deformation. The middle section of the coal pillars is subjected to tri-directional compression characterized with high load bearing capacity and small horizontal deformation, which is beneficial to maintain its supporting capacity. From the sides to the inside of the coal pillars, the plastic zone and elastic zone are successively developed. The overall load bearing pattern is an isosceles trapezoid [41].
As shown in Figure 11, the load acting on elastic zone of coal pillar is:
Due to the short existence time of the coal pillars, the creep characteristics are ignored. Then the width of the plastic zone bp can be calculated as follows [42]:
where λ is the lateral pressure coefficient which can be calculated using Poisson’s ratio ν (i.e., λ = ν/(1 − ν)); C is the cohesion (Pa). According to Formulas (16), (19) and (20), the load σ can be calculated, and the maximum roof subsidence after mining in the first stage is given by:
where Ec is the Young’s modulus of the coal pillar (Pa).
4.1.2. Roof Subsidence U2
During mining in the second stage, the overlying roof is supported by the filling body constructed in the first stage. According to Formulas (16), (19) and (20), the load σ′ can be calculated using mechanical parameters of the filling material. Thus the maximum roof subsidence after mining in the second stage can be calculated as:
where Ef is the Young’s modulus of the filling body (Pa); σ′ is the load borne by filling body in the second stage (Pa).
4.1.3. Roof Subsidence U3
After the stabilization of overlying strata movement, the weight of all the overlying strata will be acted on the backfilling bodies constructed during the two mining stages. According to the condition of static equilibrium, the following formula can be obtained:
where γ′ is the average bulk density of all the overlying strata (N/m3); H′ is the burial depth of coal seam (m). According to Formula (23), the roof subsidence U3 can be determined by:
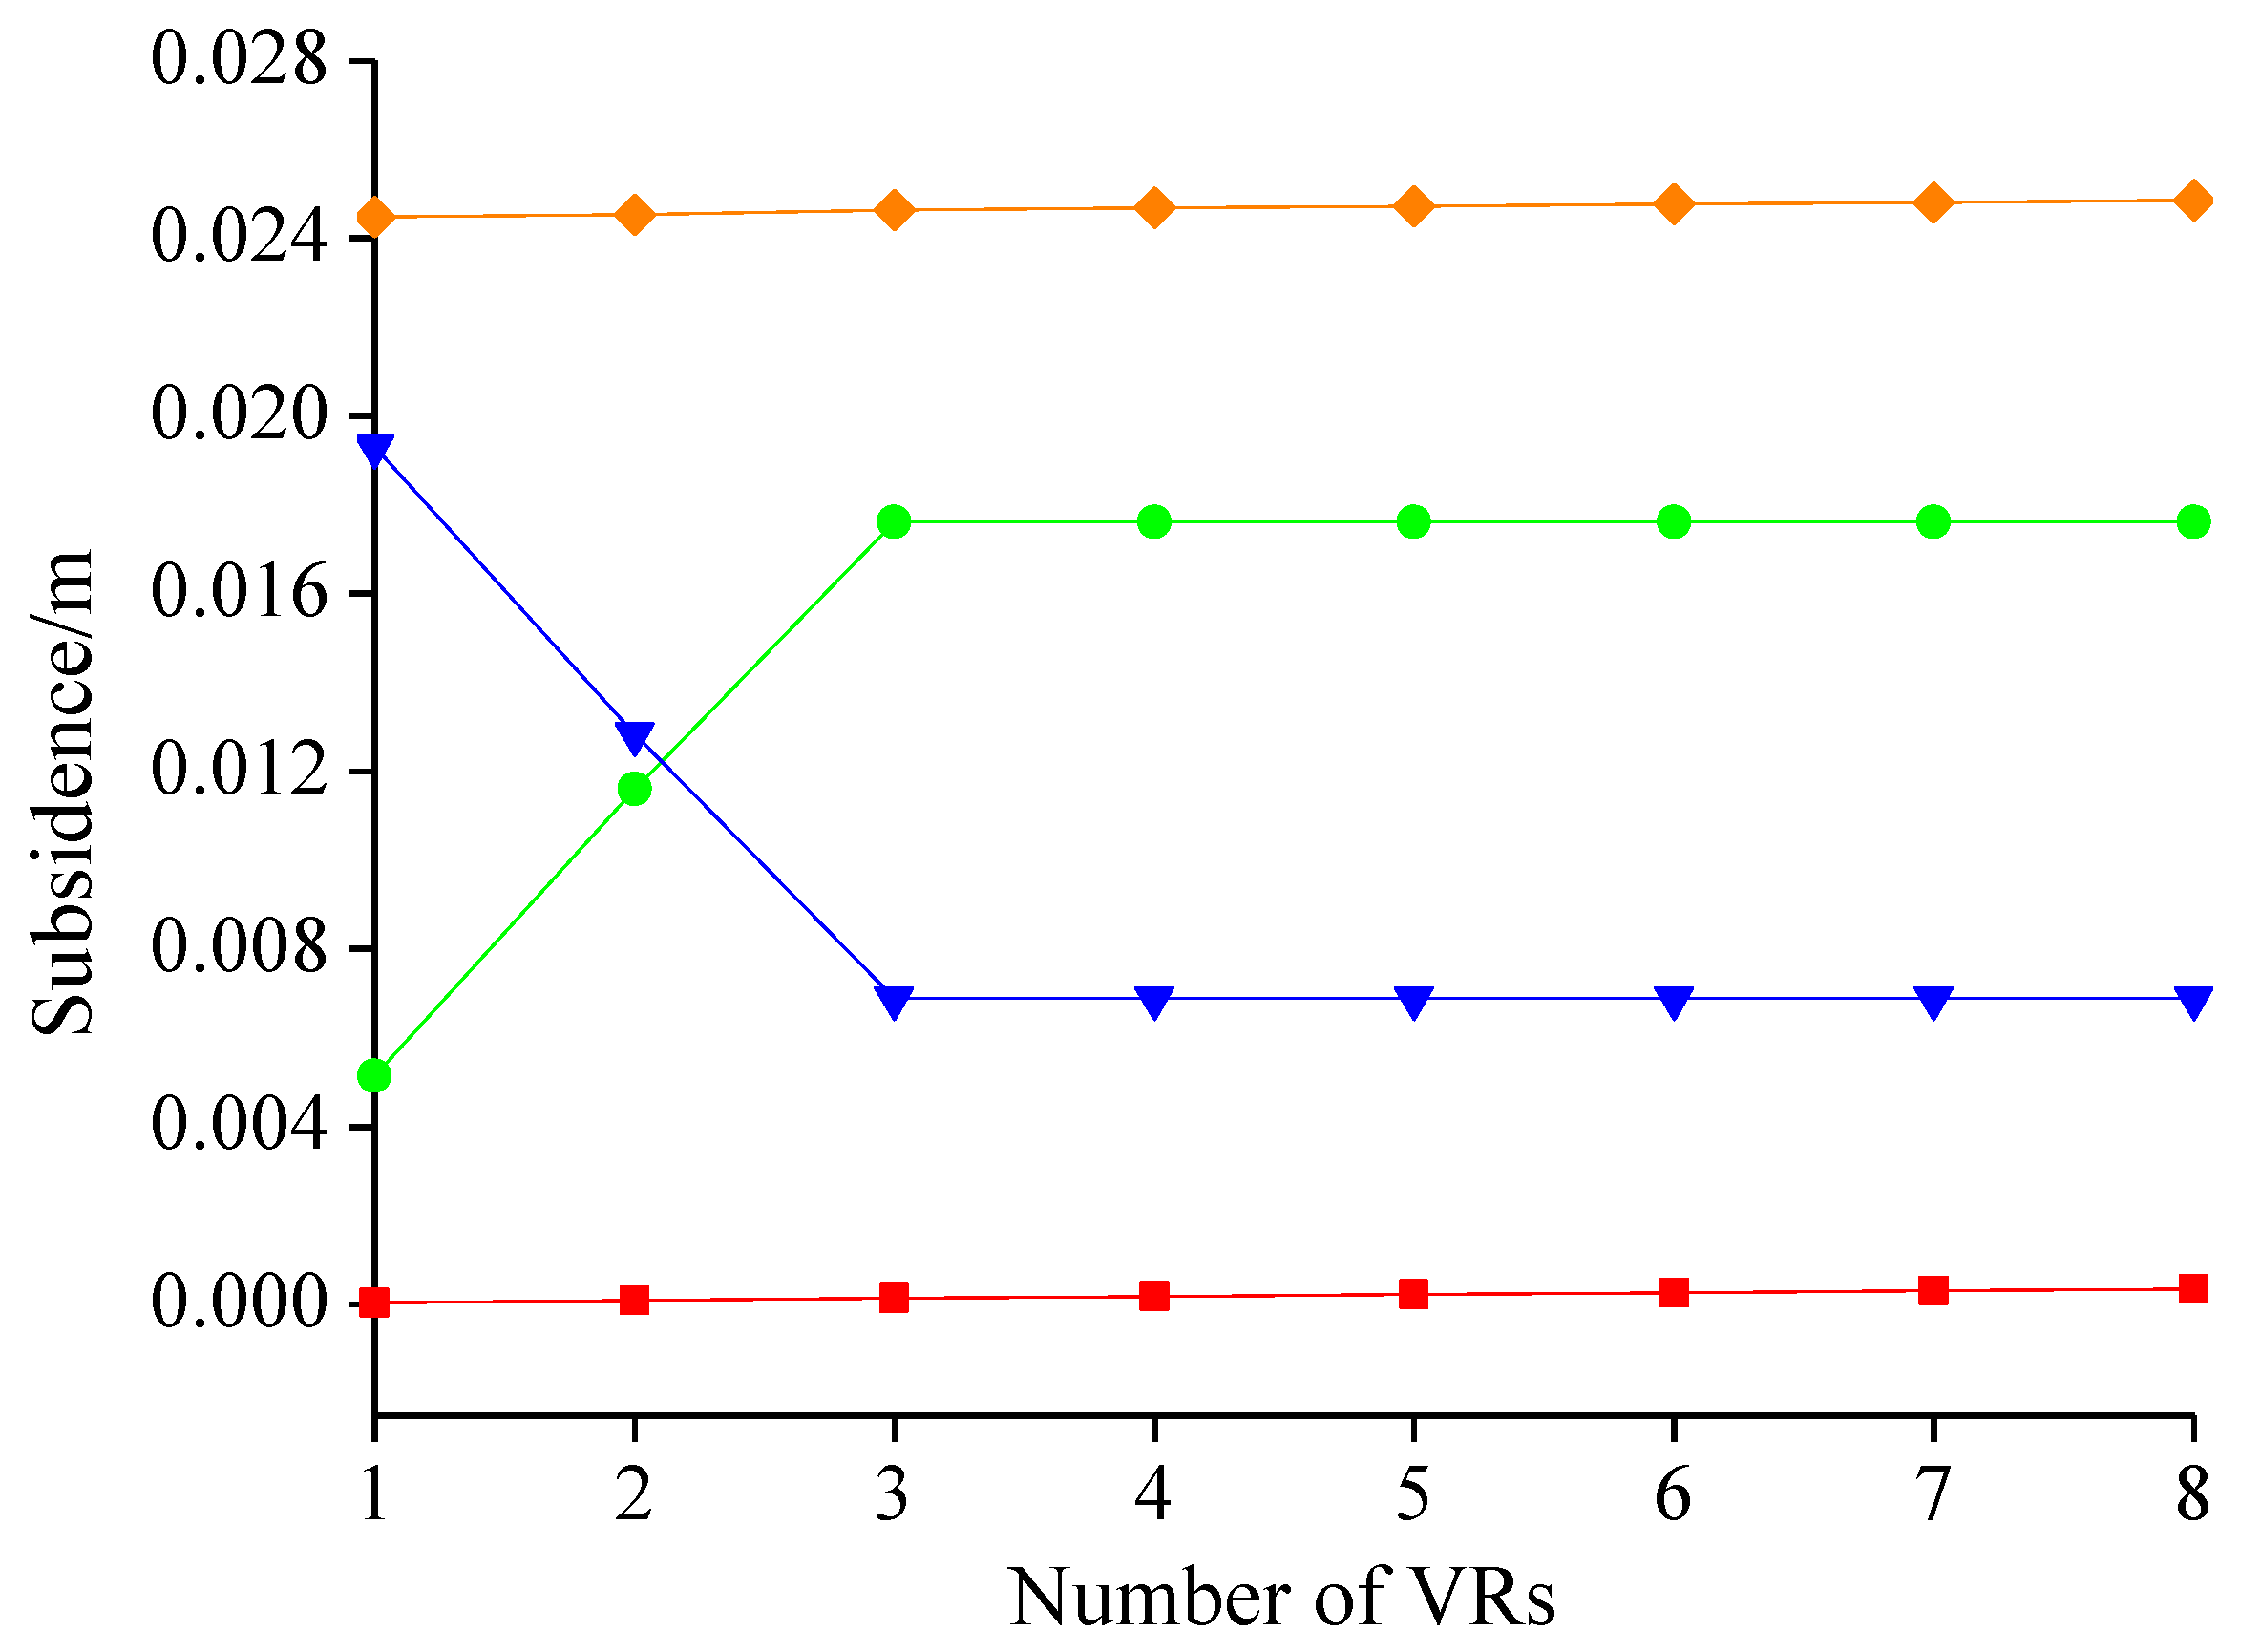
Uniaxial compressive tests of the standard samples (Φ50 mm × 100 mm) of the coal and filling body were carried out in laboratory. Then the slope of the axial stress-axial strain curves in elastic deformation stage of the standard samples was estimated for the Young’s modulus and the slope of the lateral strain-axial strain curves was estimated for the Poisson’s ratio [29,31], and the corresponding values are Ec = 3.26 GPa, νc = 0.25, Ef = 0.13 GPa, νf = 0.29, respectively. According to Formulas (18), (21), (22) and (24), the maximum roof subsidence U1, U2, U3 and U can be calculated (Figure 12). U1 and U2 are caused by the weight of rocks within the arch in the first and second stage, while U3 is caused by the weight of strata ranging from arch top to the ground surface. So with the increase of VRs number, the height of the arch increases while the height of strata from arch top to the ground surface decreases, leading to the increase of U1 and U2 and the decrease of U3. Regarding U, with the increase of U1 and U2, the height of filling bodies in the first and second stage (i.e., h-U1 and h-U1-U2.) will decrease, resulting in the decrease of U.
4.2. Subsidence of Aquiclude and Surface
A planar mechanical model as shown in Figure 13 is developed to investigate the overlying strata subsidence in RBM. Assuming the subsidence area of the i-th stratum on this plane to be Si (from Figure 2, i ≤ 10), then
where n is the total number of MRs; Hi is the distance from the upper surface of the i-th stratum to the upper surface of the coal seam (m); α is the influence angle of overlying strata subsidence (°); wi(x) is the subsidence of the i-th stratum (m).
After backfilling, bending deformation with a small deflection occurs to the strata above the main roof (i ≥ 2). It is reasonable to treat the subsidence curve as straight lines [43], therefore, the subsidence area Si of the i-th stratum can be expressed as the area of an inverted isosceles trapezoid, i.e.,
where β is the angle of full subsidence (°). Assuming the maximum subsidence of the main roof is equal to that of the immediate roof, i.e., w2(0) = U, then S2 can be written as:
It is assumed that each stratum above the main roof has the same subsidence area, i.e., Si = S2 (i ≥ 2), then the maximum subsidence at the top of the i-th stratum is expressed as:
The equation for the subsidence curve at the top of the i-th stratum is written as:
When calculating the subsidence of each stratum by Formula (28), the load bearing capacity of each stratum is not considered, so verification is carried out on the calculation. Assuming each overburden stratum is Euler-Bernoulli beam with unit width, then the overburden load Qi and length li of the i-th stratum are respectively:
where γj is the bulk density of the j-th stratum (kN/m3); hj is the thickness of the j-th stratum (m). If the stiffness and thickness of the i-th stratum are large enough to bear the overlying load, bed separation may occur in its underneath. In this case, the maximum subsidence of the i-th stratum can be calculated as the deflection of a clamped-clamped beam subjected to uniform load, i.e.,
where Ei is the Young’s modulus of the i-th stratum (GPa); hi is the thickness of the i-th stratum (m). If wi(0) ≤ wi′(0), the i-th stratum subsides with the underlying stratum together and the subsidence is wi(0); If wi(0) > wi′(0), the i-th stratum is separated from the underlying stratum and the subsidence of the i-th stratum is wi′(0).
The geological condition of Yuyang coal mine is simple. There is little change in the thickness and burial depth of coal seam. Considering the small research area which was only limited to the RBM panel, the thickness and Young’s modulus were assumed to be constant. The thickness of each stratum was determined according to the drilling data. As for the Young’s modulus, the uniaxial compression tests were performed on five rock samples from each stratum, then the slopes of the axial stress-axial strain curves in elastic deformation stage were averaged to obtain the Young’s modulus of the stratum. The parameters used for the calculation of overlying strata subsidence are shown in Table 4.
From Table 4, it can be observed that wi(0) < wi′(0) for each stratum, indicating the subsidence of the i-th stratum is wi(0). The study showed that all the overlying strata subside together and there was no separation between two adjacent strata using RBM. The maximum subsidence of the aquiclude and surface are 23 mm and 22 mm respectively.
5. Numerical Simulation of Aquiclude Stability
5.1. Numerical Model
FLAC3D (Fast Lagrangian Analysis of Continua in 3 Dimensions), an explicit finite-difference program developed by Itasca Consulting Group Inc., is one of the most widely used numerical simulation software in mining and geo-engineering [22]. The mohr-coulomb model is a classical constitutive model used to describe yield and failure behaviors of soil and rock [24]. In this study, FLAC3D simulations were conducted to investigate the stress and deformation of the aquiclude using mohr-coulomb model. The transport roadway was developed along the x-axis of the numerical model, and a total of 100 MRs were designed on the two sides of the transport roadway. Considering the boundary effect, the model was developed with an extra 200 m wide boundary coal pillar surrounding the mining area as Figure 14b shows. The model size was 680 m × 585 m × 190 m, and the finite difference meshes generated by FLAC3D was shown in Figure 14a. Roller constraint was assigned to the four sides of the model, fixed constraint were used at the bottom of the model, and no constraint was applied to the top. The mechanical properties of rocks and backfilling materials used for the simulation were shown in Table 5 [29,31].
5.2. Modeling Scheme
As can be seen from Section 4.2, the subsidence of overlying strata increases with the increase of VRs number, so the numerical simulation was carried out with 8 VRs in the first stage and 3 VRs in the second stage which was taken as the worst condition. During the numerical modeling, mining was simulated by applying null model to the MR which was Mohr–Coulomb model, backfilling of a VR was simulated by applying Mohr–Coulomb model to the VR which was null model.
5.3. Aquiclude Stability
The subsidence curve of aquiclude and surface obtained from numerical simulation are compared with that determined by Formula (29) (Figure 15). Tensile stress and deformation of the aquiclude was calculated to evaluate the stability of aquiclude (Figure 16, Figure 17, Figure 18 and Figure 19). The correlation coefficient between two subsidence curves of the aquiclude is 0.94. And for the two surface subsidence curves, the correlation coefficient is 0.96. The maximum subsidence of aquiclude calculated by Formula (29) is 23 mm, which is 11.5% smaller than the numerical simulation results (26 mm); the maximum subsidence of surface calculated by formula (29) is 22 mm, which is 4.3% smaller than the numerical simulation results (23 mm). It demonstrates the good agreement between the theoretical model and the numerical model.
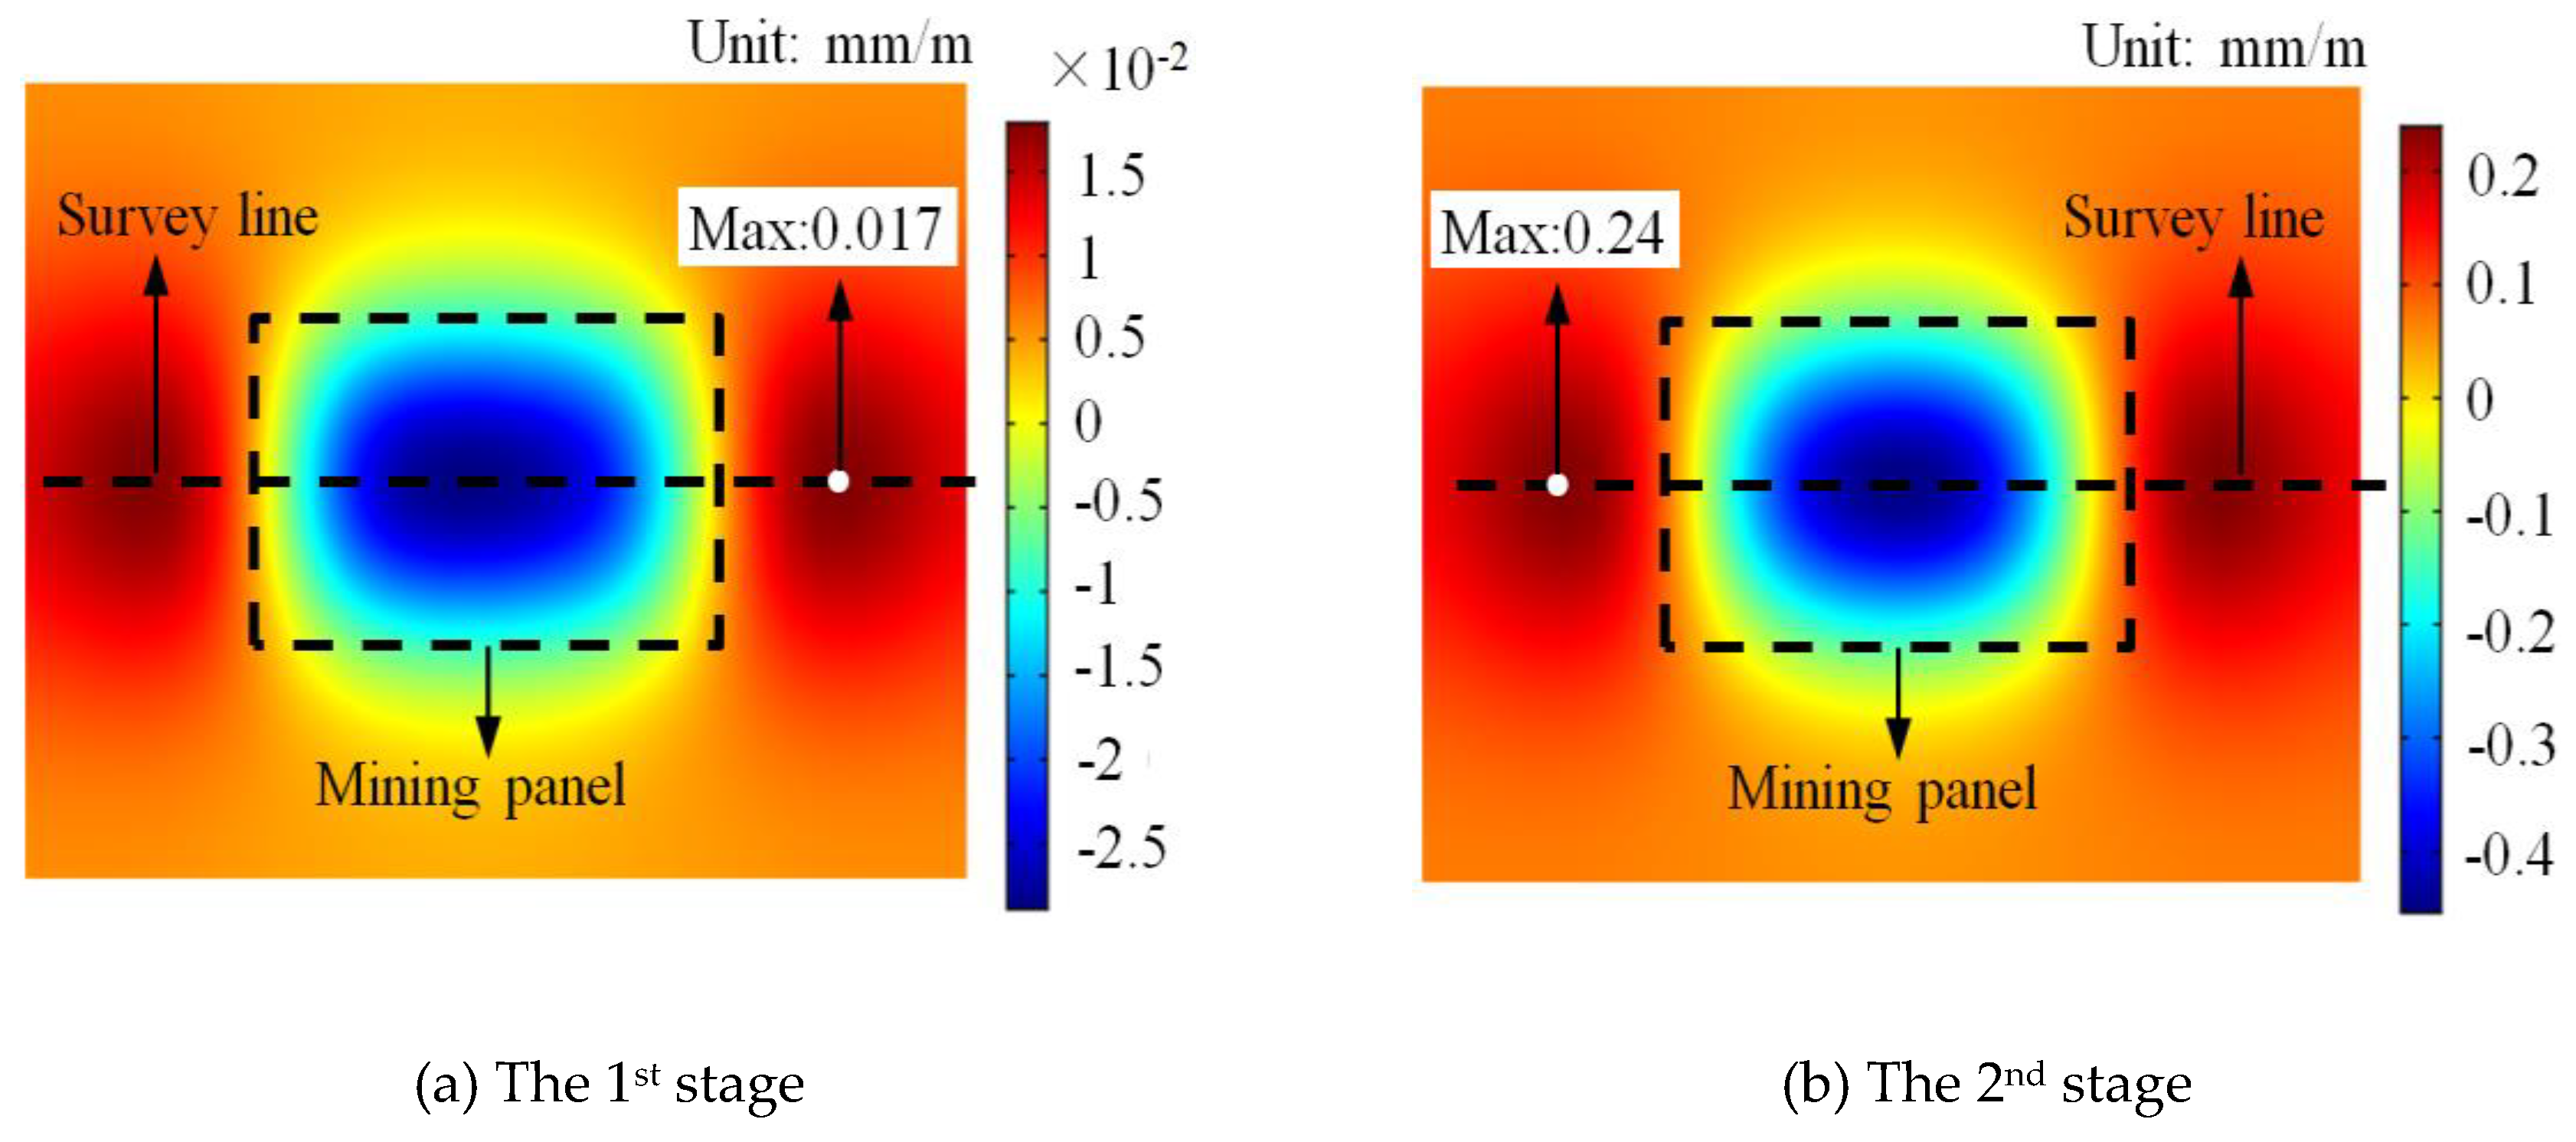
After backfilling, the maximum tensile stress of the aquiclude was calculated to be 0.14 MPa, which was smaller than its tensile strength; the maximum horizontal stretching deformation was 0.24 mm/m, which was smaller than the critical deformation for failure (Table 6). Therefore, it can be concluded from the model results that the aquiclude will remain stable during the mining process, through which both the ground water and surface water resources could be effectively preserved [29,44].
6. Analysis of An Engineering Application
In Yuyang mine, all of the MRs were backfilled after mining, and brick walls with a thickness of 700 mm were built at both ends of the MRs to prevent filling material from flowing out of the MRs. To ensure the stability of coal pillar, the number of VRs between mining face and backfilling face was kept at 4 or lower. In the first stage, a number of 120 MRs were mined and backfilled. One month after the first stage was over, field tests were conducted onsite to ensure the strength of filling body and its roof supporting rate meet the requirements, mining and backfilling in the second stage could then begin. A total of 278 000 tons of coal had been extracted using RBM, and more than 212 000 tons of filling material had been used to control the subsidence of overlying strata.
Both subsidence and water level were monitored during the application of RBM at Yuyang mine to evaluate its impact on water conservation. The maximum subsidence above the backfill mining area was measured to be 21 mm, which was significantly lower than that of fully mechanized longwall caving faces (86 mm) of the mine [45]. It is noted that, two boreholes (ZK0905 and ZK0906 as shown in Figure 20) were originally employed for water level observation before and after mining. However, due to some construction and maintenance issues, water level data after mining were not available at these two boreholes. Therefore, three more boreholes (YYT1, YYT2 and YYT3 in Figure 20) were drilled after mining to investigate the water levels. Table 7 shows the water levels monitored at each observation hole. Considering the relative positions of the boreholes, water altitudes at the area near ZK906 and YYT1 were compared, and a decrease of 2.76 m was found; water altitudes near ZK905 and YYT2 were also compared showing a 0.45 m drop.
When the groundwater level is within 8~15 m below the surface, the surface vegetation can grow normally [46]. After coal mining in the studied area, the water level was 4.45~10.83 m (7.33 m on average) below surface, and it was less than 8 m for most of the region; therefore, the normal growth of surface vegetation was ensured. Field survey also demonstrated the generally good surface vegetation in the mining area, indicating the achievement of WCCM.
7. Discussion
Compared with the longwall backfill mining, it is more flexible to arrange the working face of RBM. The mining system and backfilling system is able to operate independently in different roadways, which not only ensures efficiency, but also avoids mutual interference. The exposed roof area is smaller after coal extraction from the roadway and the two sides of the roadways are always supported by the coal rib or the filling body. Therefore, the roof deformation and subsidence are small before backfilling, which is beneficial to the effective control of overlying strata and aquiclude. Considering these advantages, RBM has great application potential in WCCM.
In order to reduce the subsidence of the roadway roof and facilitate mining, the width of roadway or coal pillar is generally less than 6 m, which can be categorized into slender pillar (b/h < 2). The slender pillar is likely to fail under additional loads. Once failed, it will transfer pressure to adjacent pillars, resulting in the formation of an extended pressure arch structure. Therefore, with the increase of pillar width, the load subjected by coal pillar increases, the maximum number of VRs thus decreases. However, when the pillar width reaches a certain degree, there is an original stress zone in the middle of the wide coal pillar, then the pressure arch on the two sides of the wide coal pillar will not be able to form a new extended pressure arch. In this case, there is no limit on the number of VRs. If the coal pillar does not need to be recovered in the second stage, and the MRs can be mined without backfilling in the first stage, the RBM then becomes the traditional strip mining.
The paste backfill material is mainly composed of aeolian sand, and it takes time for the filling body to reach its designed strength. Within a short time after backfilling, the roof is still not effectively supported. So the number of roadways that have been backfilled but without effective roof support should be calculated according to mining rate, backfilling rate, and the properties change of filling body over time. These roadways should also be considered as VRs when determining the maximum number of VRs.
The subsidence curves of aquiclude and surface calculated by theoretical analysis were compared with that predicted by numerical simulation, and the correlation coefficients were 0.96 and 0.94 respectively, indicating good agreement of the two methods. Surface subsidence in RBM area was studied by theoretical analysis, numerical simulation and field measurement, and the results were 22 mm, 23 mm and 28 mm respectively. The results obtained from theoretical analysis and numerical simulation were similar, both of which were smaller than the field measurement. The reason for this difference could be attributed to the slightly reduced volume of filling material during its solidification, resulting in decreased roof supporting rate.
RBM was trialed at the studied mining panel. However, the adjacent mining panel was mined without backfilling and the roof strata caved into the gob after coal extraction. Although the overlying aquiclude above the studied mining panel is effectively preserved, the groundwater can still flow towards adjacent zones where backfilling was not used. Therefore, water may run off laterally along the aquifer or even leak further downwards. Consequently, the decline of groundwater level after mining cannot realistically reflect the WCCM effect of RBM. If RBM were applied to the entire mining area, the WCCM effect would be further enhanced.
8. Conclusions
Based on pressure arch theory and ultimate strength theory, a mechanical model was developed to analyze the stability of coal pillar group. The influence of mining height and MR width on the maximum number of VRs between mining face and backfilling face was analyzed. With a mining height of 3~4.5 m and MR width of 5.5 m, the maximum number of VRs in the two stages were 8 and 3, respectively. Then the stability of coal pillar could be ensured.
Based on the pressure arch theory, the stratum subsidence equation was derived, which was then verified by the subsidence equation developed by clamped beam theory considering the bearing capacity of each stratum. It was found that the stratum subsidence decreases with the decrease of stratum depth. The maximum subsidence of aquiclude and surface were calculated to be 23 mm and 22 mm, respectively.
The theoretical model was in good agreement with the numerical model as indicated by the high correlation coefficients (0.96 for the aquiclude subsidence curves and 0.94 for surface subsidence curves). Through numerical simulation, the maximum horizontal tensile stress and horizontal deformation of the aquiclude was 0.14 MPa and 0.24 mm/m respectively, which were lower than the tensile strength and the critical deformation for horizontal tensile failure, indicating the aquiclude would remain intact after mining.
After RBM, the surface subsidence of the mining panel decreased by 21 mm. The groundwater level in the mining area dropped by a maximum of 2.76 m, and the ground water level was 4.45~10.83 m below surface, which is sufficient to ensure the normal growth of surface vegetation. Therefore, it can be concluded that WCCM is achieved at Yuyang Mine by RBM.
Author Contributions
Y.Y. conceived the research and wrote the paper. L.M. revised and reviewed the manuscript. All authors have read and approved the final manuscript.
Acknowledgments
This work was supported by the Fundamental Research Funds for the Central Universities (2017XKQY096), and the Priority Academic Program Development of Jiangsu Higher Education Institutions.
Conflicts of Interest
The authors declare that they have no competing financial interests.
References
- Qian, M.G.; Xu, J.L. Concept and Technical Framework of Sustainable Mining. J. China Univ. Min. Technol. 2011, 13, 1–7. [Google Scholar]
- Hu, Z.; Xiao, W. Optimization of concurrent mining and reclamation plans for single coal seam: A case study in northern Anhui, China. Environ. Earth Sci. 2013, 68, 1247–1254. [Google Scholar] [CrossRef]
- Booth, C.J. Confined-unconfined changes above longwall coal mining due to increases in fracture porosity. Environ. Eng. Geosci. 2007, 13, 355–367. [Google Scholar] [CrossRef]
- Booth, C.J. Groundwater as an environmental constraint of longwall coal mining. Environ. Geol. 2006, 49, 796–803. [Google Scholar] [CrossRef]
- Altun, A.O.; Yilmaz, I.; Yildirim, M. A short review on the surficial impacts of underground mining. Sci. Res. Essays 2010, 5, 3206–3212. [Google Scholar]
- Ma, L.Q.; Du, X.; Wang, F.; Liang, J.M. Water-preserved Mining Technology for Shallow Buried Coal Seam in Ecologically-vulnerable Coal field, A case study in the Shendong Coal field of China. Disaster Adv. 2013, 6, 268–278. [Google Scholar]
- Adhikary, D.P.; Guo, H. Modelling of Longwall Mining-Induced Strata Permeability Change. Rock Mech. Rock Eng. 2015, 48, 345–359. [Google Scholar] [CrossRef]
- Madzivire, G.; Ramasenya, K.; Tlowana, S.; Coetzee, H.; Vadapalli, V.R.K. Application of mine water leaching protocol on coal fly ash to assess leaching characteristics for suitability as a mine backfill material. J. Environ. Sci. Health 2018, 53, 467–474. [Google Scholar] [CrossRef]
- Ma, L.Q.; Cao, X.Q.; Liu, Q.; Zhou, T. Simulation study on water-preserved mining in multi-excavation disturbed zone in close-distance seams. Environ. Eng. Manag. J. 2013, 12, 1849–1853. [Google Scholar] [CrossRef]
- Scott, B.; Ranjtih, P.G.; Choi, S.K.; Khandelwal, M. Geological and geotechnical aspects of underground coal mining methods within Australia. Environ. Earth Sci. 2010, 60, 1007–1019. [Google Scholar] [CrossRef]
- Guo, Z.P.; Li, J.Z.; Li, C.H.; Ge, H.B. Short wall box style mining method of strip coal pillar under town. Appl. Mech. Mater. 2011, 121–126, 4146–4150. [Google Scholar] [CrossRef]
- Ma, L.Q.; Zhang, D.S.; Wang, S.K.; Xie, Y.S.; Yu, Y.H. Water-preserved mining with the method named “backfilling while mining”. J. China Coal Soc. 2018, 43, 62–69. [Google Scholar]
- Cao, Z.; Xu, P.; Li, Z.; Zhang, M.; Zhao, Y.; Shen, W. Joint Bearing Mechanism of Coal Pillar and Backfilling Body in Roadway Backfilling Mining Technology. CMC-Comput. Mater. Contin. 2018, 54, 137–159. [Google Scholar]
- Sun, Q.; Zhang, J.X.; Zhou, N.; Qi, W.Y. Roadway Backfill Coal Mining to Preserve Surface Water in Western China. Mine Water Environ. 2018, 37, 366–375. [Google Scholar] [CrossRef]
- Zhang, J.X.; Sun, Q.; Zhou, N.; Jiang, H.Q.; Germain, D.; Abro, S. Research and application of roadway backfill coal mining technology in western coal mining area. Arab. J. Geosci. 2016, 9, 558. [Google Scholar] [CrossRef]
- Liu, J.W.; Sui, W.H.; Zhao, Q.J. Environmentally sustainable mining: A case study of intermittent cut-and-fill mining under sand aquifers. Environ. Earth Sci. 2017, 76, 562. [Google Scholar] [CrossRef]
- Bai, E.; Guol, W.B.; Tan, Y.; Yang, D. The analysis and application of granular backfill material to reduce surface subsidence in China’s northwest coal mining area. PLoS ONE 2018, 13, e0201112. [Google Scholar] [CrossRef] [PubMed]
- Yilmaz, T.; Ercikdi, B.; Deveci, H. Utilisation of construction and demolition waste as cemented paste backfill material for underground mine openings. J. Environ. Manag. 2018, 222, 250–259. [Google Scholar] [CrossRef]
- Cao, W.H.; Wang, X.F.; Li, P.; Zhang, D.S.; Sun, C.D.; Qin, D.D. Wide Strip Backfill Mining for Surface Subsidence Control and Its Application in Critical Mining Conditions of a Coal Mine. Sustainability 2018, 10, 700. [Google Scholar] [CrossRef]
- Skrzypkowski, K. Compressibility of materials and backfilling mixtures with addition of solid wastes from flue-gas treatment and fly ashes. In Proceedings of the E3S Web of Conferences, Szklarska Poręba, Poland, 22–25 May 2018. [Google Scholar]
- Skrzypkowski, K.; Korzeniowski, W.; Poborska-Mlynarska, K. Binding capability of ashes and dusts from municipal solid waste incineration with salt brine and geotechnical parameters of the cemented samples. Arch. Min. Sci. 2018, 63, 903–918. [Google Scholar]
- Sun, Q.; Zhang, J.; Zhou, N. Study and discussion of short-strip coal pillar recovery with cemented paste backfill. Int. J. Rock Mech. Min. Sci. 2018, 104, 147–155. [Google Scholar] [CrossRef]
- Bertuzzi, R.; Douglas, K.; Mostyn, G. An Approach to model the strength of coal pillars. Int. J. Rock Mech. Min. Sci. 2016, 89, 165–175. [Google Scholar] [CrossRef]
- Poulsen, B.A.; Adhikary, D.P. A numerical study of the scale effect in coal strength. Int. J. Rock Mech. Min. Sci. 2013, 63, 62–71. [Google Scholar] [CrossRef]
- Zhang, J.X.; Huang, P.; Zhang, Q.; Li, M.; Chen, Z.W. Stability and control of room mining coal pillars-taking room mining coal pillars of solid backfill recovery as an example. J. Cent. South Univ. 2017, 24, 1121–1132. [Google Scholar] [CrossRef]
- Wang, H.; Poulsen, B.A.; Shen, B.; Xue, S.; Jiang, Y. The influence of roadway backfill on the coal pillar strength by numerical investigation. Int. J. Rock Mech. Min. Sci. 2011, 48, 443–450. [Google Scholar] [CrossRef]
- Zhang, Y.; Cao, S.G.; Guo, S.; Wan, T.; Wang, J.J. Mechanisms of the development of water-conducting fracture zone in overlying strata during shortwall block backfill mining: A case study in Northwestern China. Environ. Earth Sci. 2018, 77, 543. [Google Scholar] [CrossRef]
- Deng, X.J.; Zhang, J.X.; Zhou, N.; de Wit, B.; Wang, C.T. Upward slicing longwall-roadway cemented backfilling technology for mining an extra-thick coal seam located under aquifers: A case study. Environ. Earth Sci. 2017, 76, 789. [Google Scholar] [CrossRef]
- Jiang, Z.Q.; Lv, W.H. The engineering geological conditions of water-preserved mining in Yuyang Coal Mine. Shaanxi Coal 2014, 33, 29–34. [Google Scholar]
- Fan, L.M. Scientific connotation of water-preserved mining. J. China Coal Soc. 2017, 42, 27–35. [Google Scholar]
- Liu, P.L.; Zhang, H.X.; Cui, F.; Sun, K.H.; Sun, W.M. Technology and practice of mechanized backfill mining for water protection with aeolian sand paste-like. J. China Coal Soc. 2017, 42, 118–126. [Google Scholar] [CrossRef]
- Xia, B.W.; Zhang, X.; Yu, B.; Jia, J.L. Weakening effects of hydraulic fracture in hard roof under the influence of stress arch. Int. J. Min/ Sci. Technol. 2018, 28, 951–958. [Google Scholar] [CrossRef]
- Li, P.; Wang, F.; Fan, L.; Wang, H.; Ma, G. Analytical scrutiny of loosening pressure on deep twin-tunnels in rock formations. Tunn. Undergr. Space Technol. 2019, 83, 373–380. [Google Scholar] [CrossRef]
- Huang, Q.X.; Zheng, C. Theory of self-stable ring in roadway support. Rock Soil Mech. 2016, 37, 1231–1236. [Google Scholar]
- Salmi, E.F.; Nazem, M.; Karakus, M. The effect of rock mass gradual deterioration on the mechanism of post mining subsidence over shallow abandoned coal mines. Int. J. Rock Mech. Min. Sci. 2017, 91, 59–71. [Google Scholar] [CrossRef]
- Li, Y.; Li, X.; Yin, G.; Yao, J. Similar material experimental study on the “domino effect” of the stope pillar unstable failure of gently inclined and medium thick phosphate rock under pillar and room caving. Disaster Adv. 2012, 5, 77–82. [Google Scholar]
- Wu, Q.; Shen, J.J.; Wang, Y. Mining techniques and engineering application for “Coal-Water” dual-resources mine. J. China Coal Soc. 2017, 42, 8–16. [Google Scholar]
- Poulsen, B.A. Coal pillar load calculation by pressure arch theory and near field extraction ratio. Int. J. Rock Mech. Min. Sci. 2010, 47, 1158–1165. [Google Scholar] [CrossRef]
- Liu, Z.X.; Luo, T.; Li, X.; Li, X.B.; Huai, Z.; Wang, S.F. Construction of reasonable pillar group for undersea mining in metal mine. Trans. Nonferrous Metals Soc. China 2018, 28, 757–765. [Google Scholar] [CrossRef]
- Zhang, J.X.; Miao, X.X.; Mao, X.B.; Chen, Z.W. Research on waste substitution extraction of strip extraction coal-pillar mining. Chin. J. Rock Mech. Eng. 2007, 26, 2687–2693. [Google Scholar]
- Gao, W.; Ge, M. Stability of a coal pillar for strip mining based on an elastic-plastic analysis. Int. J. Rock Mech. Min. Sci. 2016, 87, 23–28. [Google Scholar] [CrossRef]
- Yao, Q.; Zhou, J.; Li, Y.; Tan, Y.; Jiang, Z. Distribution of Side Abutment Stress in Roadway Subjected to Dynamic Pressure and Its Engineering Application. Shock Vib. 2015, 2015, 929836. [Google Scholar]
- Miao, X.X.; Ju, F.; Huang, Y.L.; Guo, G.L. New development and prospect of backfilling mining theory and technology. J. China Univ. Min. Technol. 2015, 44, 391–399. [Google Scholar]
- Ma, L.Q.; Jin, Z.Y.; Liang, J.M.; Sun, H.; Zhang, D.S.; Li, P. Simulation of water resource loss in short-distance coal seams disturbed by repeated mining. Environ. Earth Sci. 2015, 74, 5653–5662. [Google Scholar] [CrossRef]
- Fan, H.; Xu, Q.; Hu, Z.; Du, S. Using temporarily coherent point interferometric synthetic aperture radar for land subsidence monitoring in a mining region of western China. J. Appl. Remote Sens. 2017, 11, 026003. [Google Scholar] [CrossRef]
- Wang, S.M.; Huang, Q.X.; Fan, L.M.; Yang, Z.Y.; Shen, T. Study on overburden aquclude and water protectionmining regionazation in the ecological fragile mining area. J. China Coal Soc. 2010, 35, 7–14. [Google Scholar]
Figure 1.
Location of the study area.

Figure 2.
Stratigraphic column.

Figure 3.
Panel layout and working process.

Figure 4.
Formation of the vacant roasways (VRs).

Figure 5.
Influence of the VRs on overlying strata.

Figure 6.
The Protodyakonov’s equilibrium arch (PEA) theory model.

Figure 7.
Arch line mechanical model.

Figure 8.
Extended pressure arch structure.

Figure 9.
Extended pressure arch mechanical model.

Figure 10.
Load (b,h) and strength (b,h) of coal pillar.

Figure 11.
Distribution pattern of load borne by coal pillar; bp—Width of plastic zone; be—Width of elastic zone; σ—load acting on elastic zone of coal pillar.
Figure 11.
Distribution pattern of load borne by coal pillar; bp—Width of plastic zone; be—Width of elastic zone; σ—load acting on elastic zone of coal pillar.

Figure 12.
Subsidence of immediate roof with different numbers of VRs; The maximum numbers of VRs in the two stages are 8 and 3 respectively, so the roof subsidence in the second stage remains constant when the number of VRs is greater than 3.
Figure 12.
Subsidence of immediate roof with different numbers of VRs; The maximum numbers of VRs in the two stages are 8 and 3 respectively, so the roof subsidence in the second stage remains constant when the number of VRs is greater than 3.

Figure 13.
The planar mechanical model for the overlying strata subsidence and deformation.

Figure 14.
Numerical simulation model.

Figure 15.
Subsidence of aquiclude and surface by theoretical analysis and numerical simulation.

Figure 16.
Horizontal stress of the aquiclude.

Figure 17.
Horizontal stress on the survey line.

Figure 18.
Horizontal deformation of the aquiclude.

Figure 19.
Horizontal deformation on the survey line.

Figure 20.
Layout of water level observation holes.


| Empirical Formula | K or K′ | α or α′ | β or β′ |
|---|---|---|---|
| 7.2 | 0.46 | 0.66 | |
| 8.6 | 0.51 | 0.84 | |
| 6.88 | 0.50 | 0.70 | |
| 0.64 | 0.36 | ||
| 5.12 | 0.56 | 0.44 |
In the table, σp is the strength of the coal pillar (MPa); σs is the uniaxial compressive strength of the coal sample (MPa); D is the diameter of the cylindrical coal sample (m).
Table 2.
The parameters for calculating the maximum load subjected by coal pillar.
| Average Bulk Density (γ) /kN·m−3 | Average Internal Friction Angle (φ) /° | Uniaxial Compressive Strength of Coal (σs) /MPa | Mining Height (h) /m | Width of the MR (b) /m |
|---|---|---|---|---|
| 23.32 | 38.4 | 20.1 | 3, 3.5, 4, 4.5 | 5, 5.5, 6 |
Table 3.
The maximum numbers of VRs with different values of b and h in the two stages.
| Width of the MR (b) /m | Mining Height (h) /m | The MAXIMUM Numbers of Vrs in the First Stage | The Maximum Numbers of VRs in the Second Stage |
|---|---|---|---|
| 5 | 3 | 10 | 4 |
| 5.5 | 3 | 10 | 3 |
| 6 | 3 | 9 | 3 |
| 5 | 3.5 | 10 | 4 |
| 5.5 | 3.5 | 9 | 3 |
| 6 | 3.5 | 9 | 3 |
| 5 | 4 | 9 | 4 |
| 5.5 | 4 | 8 | 3 |
| 6 | 4 | 8 | 3 |
| 5 | 4.5 | 8 | 4 |
| 5.5 | 4.5 | 8 | 3 |
| 6 | 4.5 | 8 | 3 |
Table 4.
Parameters used for the calculation of overlying strata subsidence.
| Lithology | Number (i) | Ei/GPa | hi/m | Qi/MPa | li/m | wi(0)/m | wi′(0)/m |
|---|---|---|---|---|---|---|---|
| Sand bed | 10 | 0.05 | 20 | 0.29 | 357.89 | 0.022 | 355.88 |
| Loess | 9 | 0.57 | 30 | 0.89 | 347.17 | 0.023 | 26.29 |
| Mudstone | 8 | 4.57 | 16 | 1.28 | 331.09 | 0.023 | 25.66 |
| Siltstone | 7 | 6.57 | 16 | 1.66 | 322.52 | 0.023 | 20.89 |
| Fine sandstone | 6 | 8.07 | 25 | 2.22 | 313.94 | 0.024 | 5.35 |
| Medium sandstone | 5 | 6.91 | 10 | 2.44 | 300.55 | 0.024 | 90.01 |
| Mudstone | 4 | 4.57 | 13 | 2.76 | 295.19 | 0.024 | 65.19 |
| Siltstone | 3 | 6.57 | 18 | 3.19 | 288.22 | 0.025 | 17.96 |
| Fine sandstone | 2 | 8.07 | 14 | 3.5 | 278.57 | 0.025 | 29.79 |
| Sandy mudstone | 1 | 5.25 | 2 | 3.55 | 271.07 | 0.025 | 14,272.02 |
Table 5.
Physical and mechanical parameters of rock strata used for numerical simulation.
| Lithology | Bulk Density /kN·m−3 | Cohesion /MPa | Internal Friction Angle /° | Bulk Modulus /GPa | Shear Modulus /GPa | Tensile Strength /MPa |
|---|---|---|---|---|---|---|
| Sand bed (aquifer) | 14.7 | 0.4 | 24 | 0.05 | 0.02 | / |
| Loess (aquiclude) | 19.7 | 1.7 | 27 | 0.35 | 0.23 | 0.4 |
| Mudstone | 24.7 | 1.6 | 35 | 2.82 | 1.86 | 0.6 |
| Siltstone | 23.9 | 2.0 | 38 | 4.06 | 2.67 | 1.3 |
| Fine sandstone | 22.3 | 3.3 | 39 | 4.33 | 3.39 | 2.8 |
| Medium sandstone | 22.0 | 2.9 | 38 | 3.84 | 2.88 | 2.3 |
| Mudstone | 24.7 | 1.6 | 35 | 2.82 | 1.86 | 0.6 |
| Siltstone | 23.9 | 2.0 | 38 | 4.06 | 2.67 | 1.3 |
| Fine sandstone (main roof) | 22.3 | 3.3 | 39 | 4.33 | 3.39 | 2.8 |
| Sandy mudstone (immediate roof) | 25.2 | 2.3 | 37 | 3.02 | 2.17 | 0.9 |
| Coal | 13.2/16 | 1.2/1.0 | 30/28 | 2.2/0.1 | 1.3/0.05 | 1.2/0.2 |
| Sandy mudstone | 25.2 | 2.3 | 37 | 3.02 | 2.17 | 0.9 |
| Siltstone | 23.9 | 2.0 | 38 | 4.06 | 2.67 | 1.3 |
Table 6.
Key parameters for aquiclude stability assessment.
| Maximum Tensile Stress/MPa | Tensile Strength/MPa | Maximum Horizontal Deformation/mm·m−1 | Critical Horizontal Deformation/mm·m−1 |
|---|---|---|---|
| 0.14 | 0.4 | 0.24 | 2~3 |
Table 7.
Water levels at the observation holes.
| Observation Holes | ZK906 (before Mining) | ZK905 (before Mining) | YYT1 (after Mining) | YYT2 (after Mining) | YYT3 (after Mining) |
|---|---|---|---|---|---|
| Water altitude/m | 1162.10 | 1149.46 | 1159.34 | 1149.01 | 1149.97 |
| Water level below surface/m | / | / | 4.45 | 6.72 | 10.83 |
© 2019 by the authors. Licensee MDPI, Basel, Switzerland. This article is an open access article distributed under the terms and conditions of the Creative Commons Attribution (CC BY) license (http://creativecommons.org/licenses/by/4.0/).
Share and Cite
MDPI and ACS Style
Yu, Y.; Ma, L. Application of Roadway Backfill Mining in Water-Conservation Coal Mining: A Case Study in Northern Shaanxi, China. Sustainability 2019, 11, 3719. https://doi.org/10.3390/su11133719
AMA Style
Yu Y, Ma L. Application of Roadway Backfill Mining in Water-Conservation Coal Mining: A Case Study in Northern Shaanxi, China. Sustainability. 2019; 11(13):3719. https://doi.org/10.3390/su11133719
Chicago/Turabian StyleYu, Yihe, and Liqiang Ma. 2019. "Application of Roadway Backfill Mining in Water-Conservation Coal Mining: A Case Study in Northern Shaanxi, China" Sustainability 11, no. 13: 3719. https://doi.org/10.3390/su11133719
Note that from the first issue of 2016, this journal uses article numbers instead of page numbers. See further details here.