Estimating Lifetimes and Stock Turnover Dynamics of Urban Residential Buildings in China


1
Energy Policy Research Group, University of Cambridge, Cambridge CB2 1AG, UK
2
Department of Engineering, University of Cambridge, Cambridge CB2 1PZ, UK
3
School of Engineering and Innovation, Open University, Milton Keynes MK7 6AA, UK
*
Author to whom correspondence should be addressed.
Sustainability 2019, 11(13), 3720; https://doi.org/10.3390/su11133720
Submission received: 5 June 2019
/
Revised: 5 July 2019
/
Accepted: 5 July 2019
/
Published: 8 July 2019
(This article belongs to the Special Issue Low Energy Architecture and Low Carbon Cities: Exploring Links, Scales, and Environmental Impacts)
Abstract
:Building lifetime and stock turnover are both key determinants in modelling building energy and carbon. However in China, aside from anecdotal claims that urban residential buildings are generally short-lived, there are no recent official statistics, and empirical data are extremely limited. We present a system dynamics model where survival analysis is used to characterise the dynamic interplay between new construction, aging, and demolition of residential buildings in urban China. The uncertainties associated with building lifetime were represented using a Weibull distribution, whose shape and scale parameters were calibrated based on official statistics on floor area up to 2006. The calibrated Weibull lifetime distribution allowed us to estimate the dynamic stock turnover of Chinese urban residential buildings for 2007 to 2017. We find that the average lifetime of urban residential buildings was around 34 years, and the overall residential stock size reached 23.7 billion m2 in 2017. The resultant age-specific sub-stocks provide a baseline for the overall stock, which—along with the calibrated Weibull lifetime distribution—can be used in further modelling and for analysis of policies to reduce the whole-life embodied and operational energy and CO2 emissions in Chinese residential buildings.
1. Introduction
As the largest energy consumer and CO2 emitter worldwide [1,2,3,4], China’s progress along a low-carbon development pathway has a significant impact on global efforts towards climate change mitigation. For the building sector, China is a major driving force of energy and emissions growth. According to the World Energy Outlook [5,6,7,8], final energy consumption of buildings in China increased by approximately 53% from 1990 to 2012, when China (480 million tonnes of oil equivalent, Mtoe) overtook the US (464 Mtoe), becoming the world’s largest building energy consumer. By 2014, buildings in China were consuming 529 Mtoe, representing 18% of the total energy demand of buildings globally. Underlying the continued and rapid increase of building energy consumption in China are the increasing population, rapid urbanisation and consistently strong economic growth that have been driving the expansion of building floorspace and demand for energy services and thermal comfort in buildings [9]. Over the past decade, between 2.4 and 3.4 billion m2 of new building floor area were constructed every year [10]. By 2015, the stock was estimated to have reached 57.2 billion m2, representing 25.6% of global total building floor area (223.4 billion m2) [11]. The expansion of building stock far outpaced the energy efficiency improvement gained from more stringent building design standards and enhanced performance of building service systems and equipment, thereby leading to continued increase in total energy consumption [12,13,14]. This presents a critical challenge to the Chinese government’s pledge to peak its overall emissions by 2030 [15,16]. Strategically, China’s building sector needs to undergo a transition towards low-carbon development whereby the increase of annual building energy consumption and emissions begins to decelerate. This challenge urgently calls for a sector-specific policy and regulatory framework governing the envisaged sector-wide transformation.
To inform policies, it is essential to have a holistic and in-depth understanding of the current status of the existing building stock, which will serve as the baseline for assessing possible future energy and carbon trajectories under various policy scenarios. This is problematic in the Chinese context not only because of the magnitude of the building stock, but also because of the lack of authoritative official statistics. The latest publicly accessible statistics on urban residential building stock were published in the China Statistical Yearbook in 2006. Therefore, forecasting possible trajectories of building stock expansion and the associated energy and emissions for the future starting from 2019 will first and foremost require estimating how the building stock has evolved over the period from 2006 to 2018. The evolution and expansion of the building stock is driven by the dynamic interplay between new construction, meeting incremental demand growth as a result of economic growth and rising living standards, existing buildings remaining in use but undergoing an ageing process, and old buildings, which are either physically demolished or functionally disused.
Building lifetime is a critical factor in the dynamic relationship between old and new buildings in the stock. In the Chinese context, it has been suggested that the average lifetime of buildings is as short as 25–30 years in urban areas and 15 years or even less in rural areas [17,18,19,20]—significantly shorter than buildings in developed countries [21,22]. The short lifetimes are due to various factors, including quality of building materials, design standards, construction techniques and practices, maintenance and renovation, inappropriately accelerated demolition as a result of rapid urbanisation and city rebuilding, etc. [23,24].
The high “turnover” rate reflects the fact that the building stock is being constantly rapidly replenished as a result of old buildings with short lifetimes being removed and new buildings being constructed to meet demands, as well as the great complexity and uncertainty associated with building-stock characteristics. These have significant implications for stock-wide energy use and emissions over the medium- to long-term. On the one hand, a faster turnover rate would imply that the Chinese residential building stock is less prone to the risk of operational energy and carbon “lock-in” [22,25,26,27,28] compared to its counterparts in other countries with longer lifetimes and thus slower turnover rates. On the other hand, however, turnover has significant implications for building energy from a lifecycle perspective. Massive construction and demolition require significant amounts of energy for building materials production, construction activities, demolition and disposal, collectively known as “embodied energy” [29]. From 2004 to 2012, the embodied energy of buildings in China steadily increased [30], reaching 455 Mtoe in 2013, and accounting for 16% of China’s total primary energy consumption [14]. This is comparable in size to the 529 Mtoe used in operational energy in existing buildings in 2014. The considerable impact of embodied energy and carbon due to building stock turnover must therefore not be overlooked in the decision-making process for sustainable design, construction and use of buildings in order to make real reductions in greenhouse gas (GHG) emissions [31].
The two conflicting arguments suggest the need for some sort of trade-off, but both clearly demonstrate that building stock turnover is key to understanding total life cycle energy impacts from buildings. Building lifetime is a determinant factor underlying the dynamics of building stock turnover. We therefore present a system dynamics model to calibrate residential building lifetime in China and estimate the stock size and age profile for the recent historical period of 2007 to 2017.
The rest of the paper is organised as follows. Section 2 presents a review of literature closely relating to Chinese building stock, identifies some common issues associated with the methodological approaches taken and justifies the relevance of the present study. Section 3 introduces the methodological framework, which is followed by Section 4 dedicated to conceptualising and developing the model structure and discussing the empirical data needed to parameterise the model. In Section 5, the modelling results are presented and compared with other studies. Section 6 discusses potential applications of the model to the whole-life energy and carbon of buildings and draws some conclusions.
2. Literature Review
Whilst the building stock has a fundamental impact on macro-level energy consumption and carbon emissions with significant policy implications, studies investigating the complexities and dynamics of building stock appear to be rather limited—substantially less than the wide range of studies at the individual building level.
One of the first simplified models of the Chinese building and infrastructure stock was developed by Yang and Kohler [23], who set 2005 as the base year. The existing stock in 2005 was set as the initial stock, which included buildings built between 1978 and 2005, and was assumed to be composed of several age cohorts. For buildings built from 2005 onwards, a cohort-based approach was applied to define the average age of buildings to model the stock evolution during the period from 2005 to 2050 on a five-year basis. While their model did not explicitly represent the dynamically aging process of buildings, Yang and Kohler [23] pointed out the considerable influence of the probable lifespan of buildings on future mass flows and environmental impacts. Similar to Yang and Kohler [23], a static approach was taken by the High Efficiency Buildings model developed by the Centre for Climate Change and Sustainable Energy Policy, known as the 3CSEP-HEB model [32]. Their model assumed the Chinese building stock had an annual demolition rate of 0.5% and a retrofit rate of 1.4%, which implied a homogeneity of Chinese buildings in terms of lifetime.
Taking a more dynamic perspective, Hu, Bergsdal, et al. [18] analysed the Chinese building stock by assuming a normal distribution function for building’s lifetime. The size of building stock was estimated using population and per-capita floor area sourced from China Statistical Yearbooks. The authors explored various scenarios of future demand for building materials such as steel and concrete for Chinese residential buildings, both at the national level [33] and at the city level [34]. In fact, the study by Hu, Bergsdal, et al. [18] appears to have been the first attempt to apply the concept of lifetime distribution to the Chinese building stock. For example, drawing from the work by Hu, Bergsdal, et al. [18], Huang et al. [35] carried out a similar study investigating the materials demand and environmental impact of buildings, where it was assumed that the lifetime of concrete buildings is normally distributed, assuming an average lifetime of 30 years for brick-concrete buildings and 40 years for reinforced concrete buildings. In Hong et al. [36], the same methodological approach was applied to develop a building stock turnover model underlying the projected trajectories of demand for building materials and the corresponding embodied energy over the period from 2010 to 2050. Both residential and commercial buildings were assumed to follow normal distributions in terms of their lifetimes, with the standard deviation being set to be 1/3 of the average lifetime. Similarly, investigating the impact of technical progress and the use of renewable energy in the building sector over the period from 2010 to 2050, Shi et al. [37] applied the China TIMES model and represented the lifetime distribution of buildings using a normal distribution. In these studies, historical per-capita floor area was sourced from China Statistical Yearbooks to derive possible future trajectories of per-capita floor area and overall floor area.
It is noteworthy that the use of historical per-capita floor area published in past China Statistical Yearbooks used in building stock and energy modelling has also been common in previous studies that were less explicit or dynamic, often where buildings were one component of a much larger model. For example, the residential building sector in the China End-Use Energy Model developed by the Lawrence Berkeley National Laboratory used per-capita floor area from the Yearbooks to estimate the overall stock size and develop a 2050 outlook for energy and emissions [38,39,40,41]. Yu et al. [42] studied the potential impacts of alternative building energy code scenarios on building energy use and associated emissions in China, using a detailed building energy model nested in the Global Change Assessment Model (GCAM) long-term integrated assessment framework [43]. In their model, Yearbook data on per-capita floor area were used to calibrate the modelling of floor area expansion before 2010, and it was assumed that buildings would retire at an annual rate of 1/30 of the remaining stock. Delmastro et al. [44] developed the Energy for Buildings (EfB) model as part of the Energy Demand Projection Model for China (EDPM-CN) to analyse the residential energy consumption trends up to 2030 under various technological and policy scenarios. Along with other drivers of energy demand in their model, the historical per-capita floor area published in the Yearbooks was a key variable. Similarly, to explore various scenarios of carbon emissions from Chinese buildings through 2050, Yang et al. [45] applied a grey modelling technique based on the historical per-capita floor area data published in past China Statistical Yearbooks to forecast the future trend of building stock size for the period up to 2020 and scenario analysis for the period beyond 2020.
Essentially, there are three main methodological concerns associated with previous research: (i) arbitrary choice of mean and standard deviation; (ii) ambiguity associated with existing building stock size and age profile in the start year for the modelling; and (iii) use of per-capita floor area data, leading to inflated estimates. Firstly, the few studies using a distribution to represent the lifetime of buildings assumed that building lifetime is normally distributed. For a substantially under-researched area, as discussed below in Section 4.2, there will inevitably be multiple approaches that could be taken, and a normal distribution is not unreasonable. However, what is more critical and potentially questionable is the approach of defining the parameters of the normal distribution without validation or calibration using empirical data. In previous studies, the mean representing the average building lifetime was assumed to take values in the range of 30–50 years. Furthermore, the standard deviation was commonly assumed to be 30% of the mean. The range of values for the mean was based on anecdotal evidence drawn from limited or individual cases. Moreover, the assumption used for the standard deviation was purely arbitrary. Taken together, these parameters specify inadequately substantiated shapes of the distributions that govern the lifecycle of buildings, thereby rendering high uncertainties of the building stock turnover and calling into question the calculations of energy consumption and carbon emissions that build on the stock turnover dynamics.
In addition to the somewhat arbitrary parameters used in the distributions, there is a general absence of detail on how the initial stock in the start year of the observation period is treated in the models. Regardless of which specific year is chosen as the start year for modelling, the size of the existing stock in that year and especially the age profile of the buildings are key determinants of the subsequent evolution of the stock. For a given stock size with a pre-defined normal distribution governing the lifetime distribution (e.g., a mean value of 50 and a standard deviation of 15), the age profile of the existing buildings in the stock makes a significant difference in the remaining lifetime of buildings and the overall size of the stock. As an extreme example, an age profile with over 90% of buildings younger than 30 years means the stock will remain standing much longer than an age profile with over 90% of buildings older than 70 years. Moreover, the removal of buildings from the stock to a large extent determines the incoming new buildings which will then be subject to various probabilities of demolition over time. Hence, the age profile in the initial stock technically has a knock-on effect on stock evolution over time. Of course, such effects may be marginal for a very small initial stock in a start year that is several decades ago if the modelling focus is on current status or future trends. However, for an initial stock in a fairly recent year (e.g., 2010 in the case of [37] and [36]), its overall size is large and comparable with the stock size for the modelling period. The composition of the stock in terms of building age profiles cannot be overlooked. In fact, the simplified model by Yang and Kohler [23] was the only one we could find which explicitly but briefly introduced how the initial stock in the base year was treated in the modelling. However, the lack of sufficient quantitative detail makes it difficult to gain a full understanding of their considerations and therefore evaluate the implications for modelling results relating to not only stock itself but also energy. In summary, a review of these studies suggests that there has been a general inadequacy of robustness and transparency with regard to applying a normal distribution to building stock.
Finally, directly using the per-capita floor area for urban residential buildings as published in the China Statistical Yearbooks leads to substantially inflated estimates of building stock size. The annual data reported in the yearbooks, supplied by the Ministry of Housing and Urban-Rural Development (MOHURD), was collected through sampling targeting urban family households with a registered permanent residence. The sampling excluded urban dwellers without permanent residence status, such as university students and young professionals recently graduated from universities who usually have so-called “collectively registered” status, as well as a large number of unregistered rural migrant workers living in cities. As opposed to the registered family households, they are not “permanent” but “floating” in that most are not homeowners and instead rent their accommodations. The per-capita floor area of the floating population is substantially less than that of registered family households, and their accommodation conditions were not reflected in the sampling [46,47,48]. This means that the Yearbook data on per-capita floor area for urban residential buildings has been over-estimated [49,50]. Accordingly, multiplying the over-estimated per capita data by actual urban population data to derive the total stock size will in no way reflect the real situation. In fact, the real situation in terms of total stock size of urban residential buildings in China is unknown, at least for the most recent historical period of 2007 to 2018 (MOHURD stopped publishing official statistics after 2006). The absence of official statistics makes calibration of model estimates impossible, and therefore at least partially explains the considerable variation in estimated building stock size over this period as found in the literature. For example, estimates of the urban residential building stock size in 2010 ranged from 14 billion m2 [45] to 17 billion m2 [35], 20 billion m2 [18,23], and 21 billion m2 [36]. To obtain a reasonably accurate estimate of the overall stock size of urban residential buildings, either the Yearbook data should be adjusted downwards by accounting for the urban population who rent, or some alternative method of avoiding the use of per-capita floor area.
The problems discussed above suggest a research gap that needs to be addressed. It is not meant to downplay the value of previous studies which collectively made significant contributions to this under-researched but fundamentally and strategically important area. Inspired by and building on previous studies, we propose an alternative method to estimate the Chinese urban residential building stock. Underlying the estimated stock is a calibrated building lifetime distribution function, which can serve as the basis for further modelling and policy analysis on building lifetime energy consumption and carbon emissions.
3. Methodology
We used system dynamics to model the stock turnover of urban residential buildings in China. System Dynamics is a modelling paradigm focusing on dynamic complexity arising from the structure, feedbacks, non-linearity and time lags of the system in question [51,52,53]. The model was developed and implemented using Vensim, a commercial software for System Dynamics modelling [54], as well as using the R statistical computing and graphics environment [55]. The model presented here treats building stock evolution as a continuous process of introducing new cohorts which age over time, capturing the dynamic interplay between new construction, operation and demolition. Building lifecycle is regarded as a survival process subject to various factors. Demolition of buildings is modelled as a stochastic process based on a hazard function derived from a Weibull distribution, whose parameters were estimated using historical data relating to building stock.
4. Model Development
4.1. Dynamics in Building Demolition
A fundamental consideration of dynamic building stock is that future development is strongly influenced by past activities. In particular, building demolition activities are likely to be a function of construction activities in previous years and the expected lifetimes of buildings in use. By the end of a year, the total volume of demolition will be the sum of all existing buildings constructed in previous years that have reached the end of their lifetimes, for whatever reasons, in this particular year. Similarly, the buildings remaining in the stock are those which are either newly constructed in this particular year or those which were previously constructed but have not reached the end of their lifetime. We acknowledge that a building may be disused functionally but still not demolished physically. Since the ultimate interest of modelling building stock turnover is in energy consumed by buildings, a functionally disused building no longer consumes energy and therefore was considered equivalent to a physically demolished building from an energy perspective. Hence, in the rest of this study, demolition and disuse are used interchangeably.
There could be various factors which accelerate demolition. While the degrees to which different factors play out are context specific and therefore may differ significantly, the explicit direct result is a fast “turnover” of building stock. Therefore, building lifetime is critical to the turnover dynamics of building stock. There is often a lack of authoritative statistics relating to building lifetime, particularly in developing countries. At the country level, given the huge volume of buildings and significant heterogeneity in terms of their physical characteristics and socio-economic contexts, it would be highly unrealistic to expect that buildings constructed and put into use in various cities across a country in a given year would be in service for exactly the same period and then demolished/disused simultaneously. Hence, it would be inappropriate to use a constant to represent building lifetime. As an intuitive and reasonable alternative, a profile in some form of probability density function (PDF) can be used to approximate the likely lifetime distribution of buildings constructed in a given year, so as to recognise and represent the uncertainties associated with the factors collectively influencing lifetime of buildings.
Mathematically, for any year t, the amount of demolition is the integral of the new construction in year s weighted by the probability of the new construction in year s having a lifetime equal to (t − s) years. That is to say, those buildings constructed in year s with a lifetime of (t − s) years will have reached the end of their lifetime and therefore will have been demolished or disused in year t. Interpreted in another way, the curve expressed by (1 − the cumulative distribution function (CDF) of the lifetime profile) represents the probability that a building constructed and put into use in year s remains in use in year t.
In year s, the building stock accumulates the difference between new construction as input and demolition as output. The accumulated difference is the buildings that remain in use in year t. In the most simplistic situation where the stock is initially empty and new buildings are constructed in base year t0 only and not in any following years, the stock in year t is a mix of buildings belonging to this same cohort, which is the group of buildings built in the same year, but with different remaining lifetimes. If new buildings are built every year, then the stock in year t has (t − t0 + 1) cohorts of buildings. In a more general situation where new buildings are constructed every year and the initial stock includes existing buildings constructed previously (e.g., for each of the past 10 years before year t0), then the stock in year t has (t − t0 + 1 + 10) cohorts of buildings.
4.2. Building Survival Analysis
The dynamic lifecycle of buildings suggests the suitability of applying the general framework and key features of survival analysis to this research. Survival is used to describe a lifespan or a living process involving sequential occurrences of events or status changes. Survival analysis emphasises describing, measuring and analysing the events of interest for making predictions about not only survival itself but also the so-called “time-to-event”, which refers to the length of time until the occurrence of an event or the change of status [56,57].
As this research targets the Chinese residential building stock, which is on a scale of billions of square meters, it is worth clarifying that a “building” in this context is taken as a flexible and continuous aggregation of floor area (measured in square meters) that can be “partially” demolished or disused, mathematically. The physical demolition or functional disuse of a building designates the particular “event” of interest, whose time at occurrence is the “time-to-event” in the survival analysis framework. At a given time, for a building in use, a predicted time in the future at which the building will be physically demolished or functionally disused means the termination of the survival process of the building—namely, the end of the building’s life. The corresponding time interval is the expected remaining lifetime of the building. If the time at which the building was originally constructed and put into use is taken as the beginning of the time interval, then the time interval is the expected entire lifetime of the building. In this context, the expiry of building lifetime due to physical demolition or functional disuse is modelled as a stochastic process based on a hazard function. Conceptually, the hazard function represents the conditional probability that a building will expire in year t + 1, provided that it has successfully survived to year t. Mathematically, the hazard function is the ratio of the lifetime PDF to the survival function, which is the complement of lifetime CDF.
In general, a range of parametric survival distribution functions are available to describe the survival process in various fields. However, there is extremely limited literature on survival analysis or lifetime data analysis of buildings. In probably one of the most relevant studies, Miatto et al. [58] tested various PDFs and found that lognormal distribution offered the best fit to a large volume of real data on the lifespans of buildings in Nagoya and Wakayama, Japan, where buildings were short-lived, with average lifespans shorter than 30 years. The same study also conducted a smaller-scale study on buildings in Salford, UK, where buildings were much older, and a Gompertz distribution turned out to best fit the lifespan data. They pointed out that the lack of a proper building cohort dataset was a fundamental issue facing building material stock accounting, such as building demolition wastes. From an economic perspective, buildings can be regarded as a type of capital asset, hence building stock can be regarded as capital stock [59,60]. A range of PDFs have been used as proxies to approximately represent service lives and retirement/discard patterns of capital stocks in different countries, including normal, log-normal, Gompertz, Weibull, and Winfrey distributions [59,60,61,62,63,64]. For example, in the Dutch survey, information on capital stocks and capital discards was used to compute empirical survival probabilities of various types of asset and industry—including buildings, which were found to be well approximated by two-parameter Weibull distributions [60].
We used the Weibull distribution to approximate the lifetime distribution of urban residential buildings in China. The Weibull distribution has been widely used as the functional form for lifetime distribution in mortality and reliability applications [60,65,66]. It is defined through a shape parameter α (α > 0) and a scale parameter λ (λ > 0). Table 1 summarises the key representations of the Weibull distribution. Specifying any one of the four representations allows the other three to be ascertained.
In the above table, if x is used to represent “time-to-failure”, the Weibull distribution is characterised by the fact that the hazard function is proportional to a power of time. Hence, the shape parameter α can be interpreted as a measure of change in the risk of an asset (e.g., a building, failing and therefore being demolished/disused). For 0 < α < 1, the risk decreases over time, suggesting significant “infant mortality”. For α = 1, the risk remains constant throughout an asset’s lifetime. For α > 1, the Weibull distribution exhibits characteristics of decay, where the older the asset is, the more likely it will fail in the near future. This indicates an “aging” process in which the value of α determines the shape of the hazard function curve (i.e., the change of failure rate over time) [57,60,65,67,68,69]. In practice, it would be more reasonable to expect buildings to have an α above 1 than below 1.
4.3. Model Structure and Components
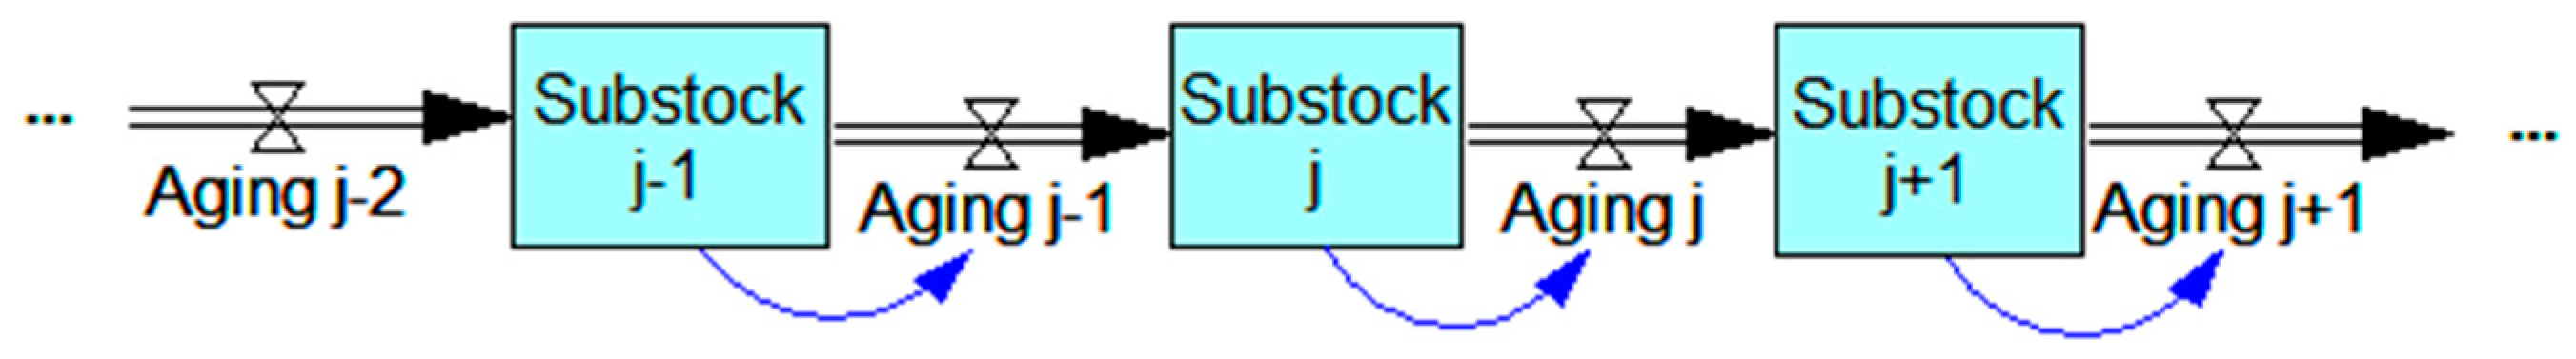
The shape and scale parameters of the Weibull distribution were calibrated so that the approximated building lifetime distribution would fit the empirically observed data to the greatest extent possible. However, there are no official statistics on building ages in China, and past studies related to building lifetime in China are limited, as discussed above. Therefore, the calibration was performed by achieving the best-possible fit of the modelled annual aggregated floor area to the corresponding historical data on floor area, using the emergent behaviour of the building stock turnover model. To do so, the building stock in the turnover model was disaggregated into a series of cascading sub-stocks of buildings forming an “aging chain”, with each sub-stock representing a particular building age group. The basic mechanism is that, on the aging chain, sub-stock j receives the outflow of sub-stock j − 1 as its inflow, undergoes an aging process, and subsequently sends its outflow to sub-stock j + 1 (Figure 1).
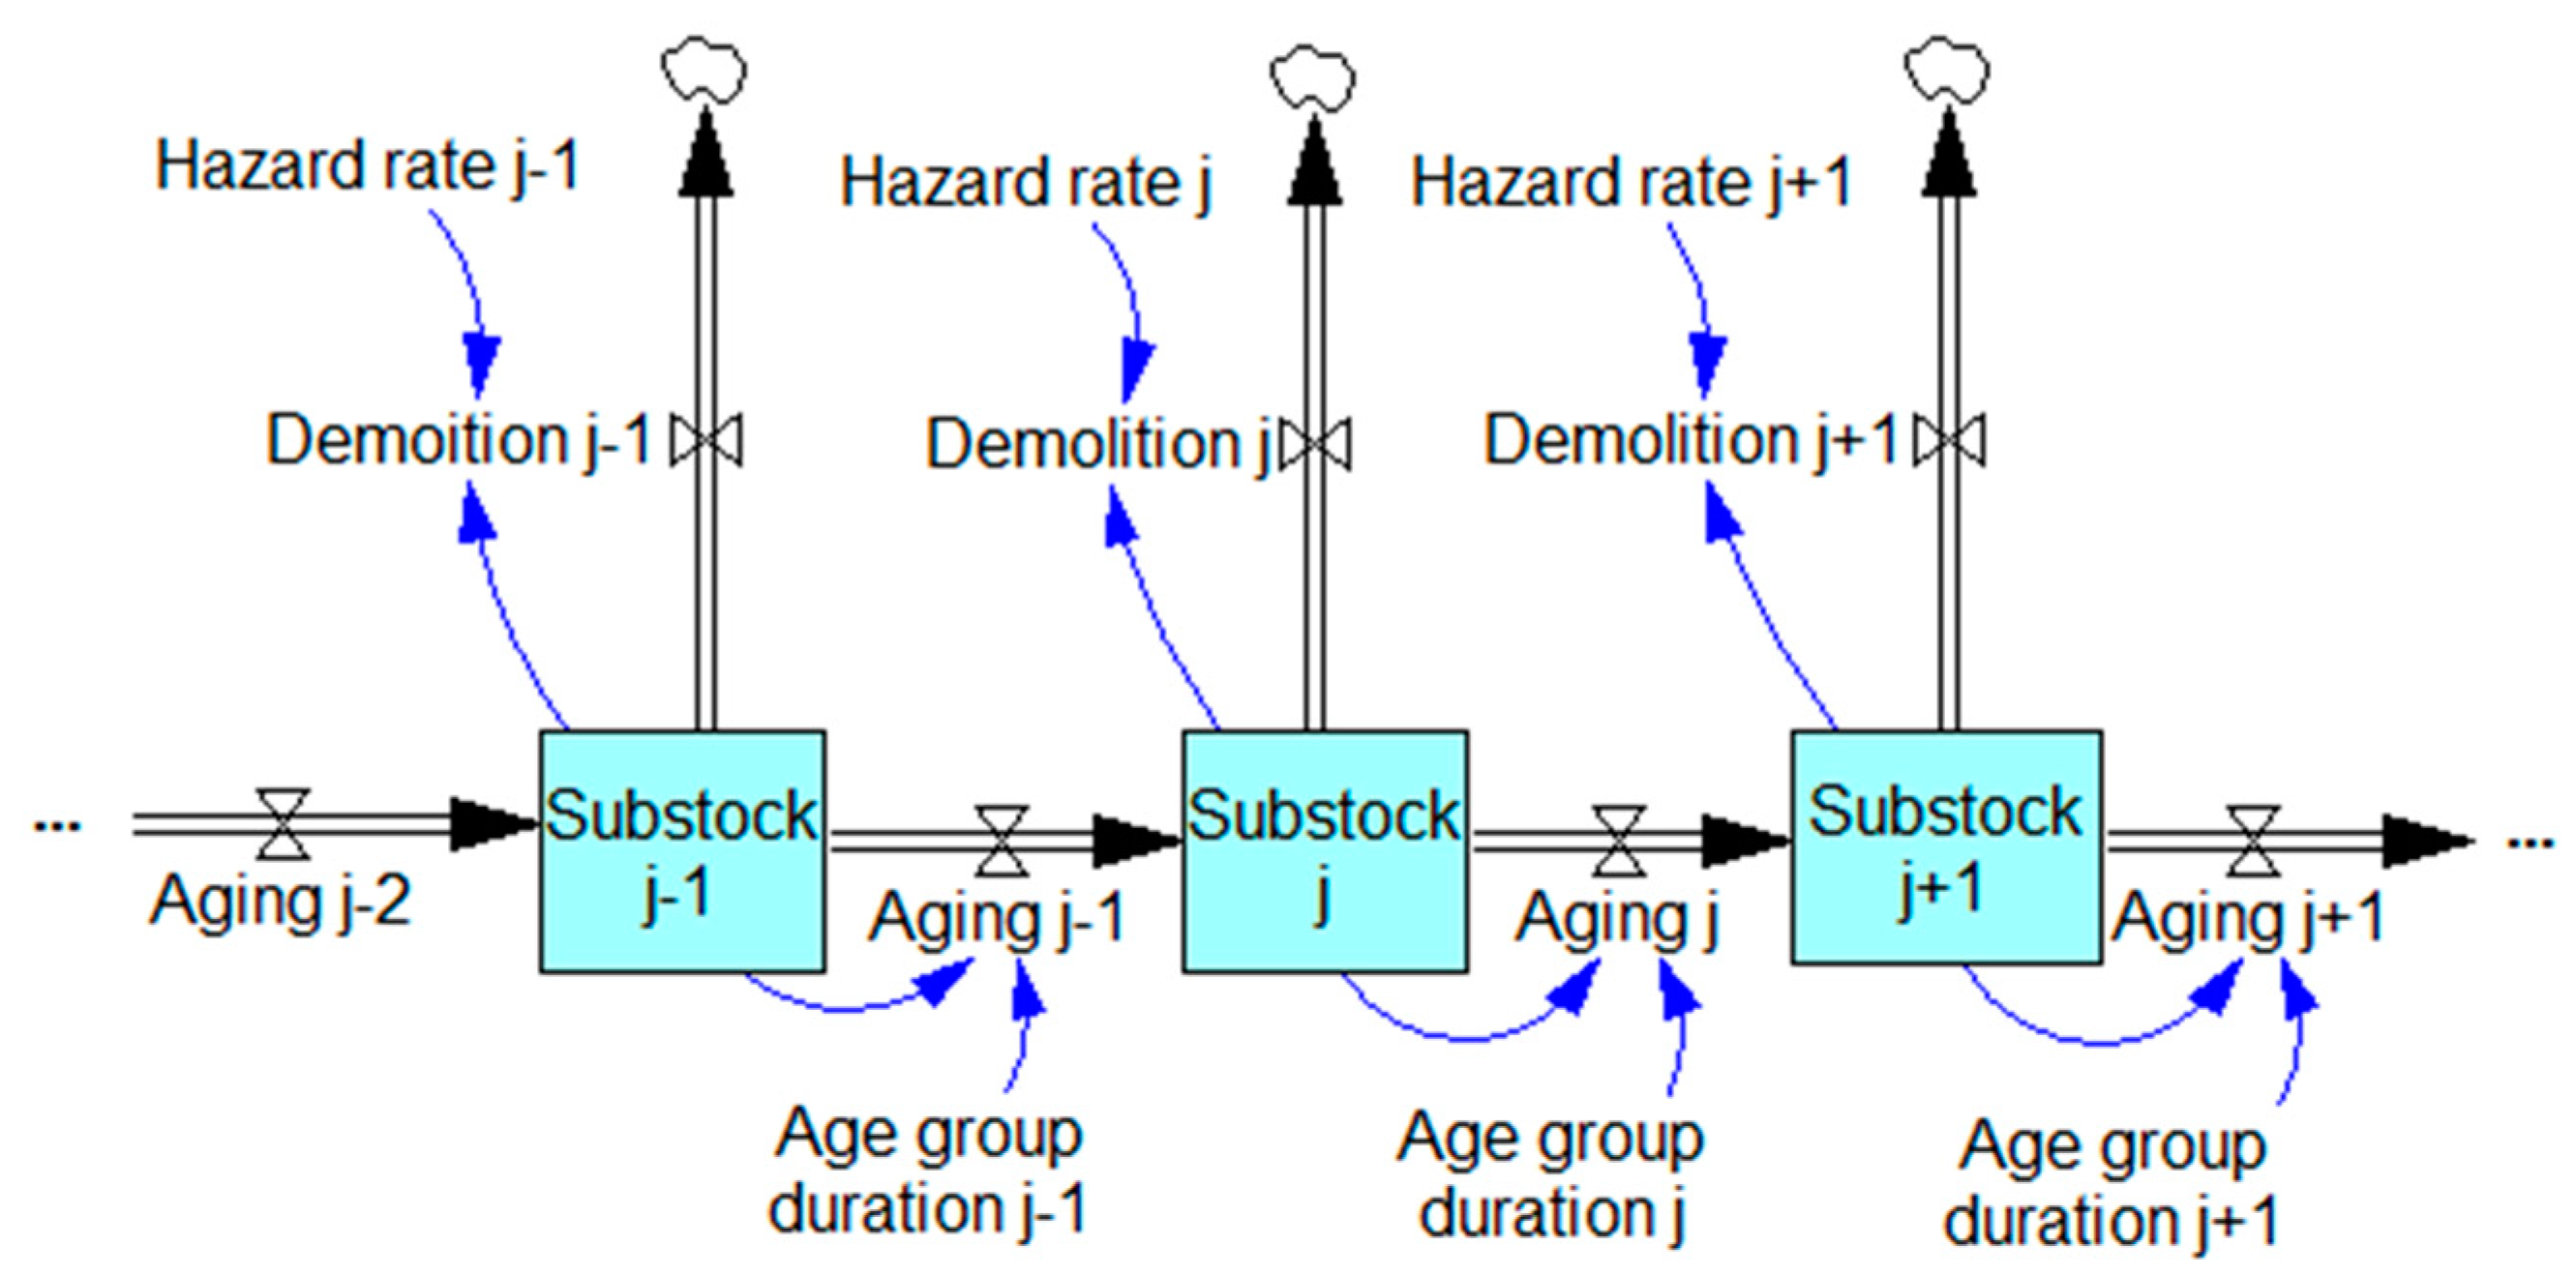
The removal of demolished/disused buildings from each sub-stock is subject to its age-specific hazard rate, which is determined by the shape and scale parameters of a Weibull distribution. The age group duration represents the length of time that buildings in use reside in a sub-stock before shifting to the next sub-stock in the chain (Figure 2). With age group duration set to 1 year, the chronological aging process is discretised (i.e., each sub-stock represents buildings within a one-year age group—for instance, 30-year-old buildings are in a different sub-stock than 31-year-old buildings). This level of granularity offers a detailed representation of sub-stocks characterised by heterogeneity with respect to age (and energy-related properties, provided that additional layers are added to the model). In so doing, the aging process of buildings can be separately tracked and allow experimentation with policy interventions targeting buildings of specific age groups.
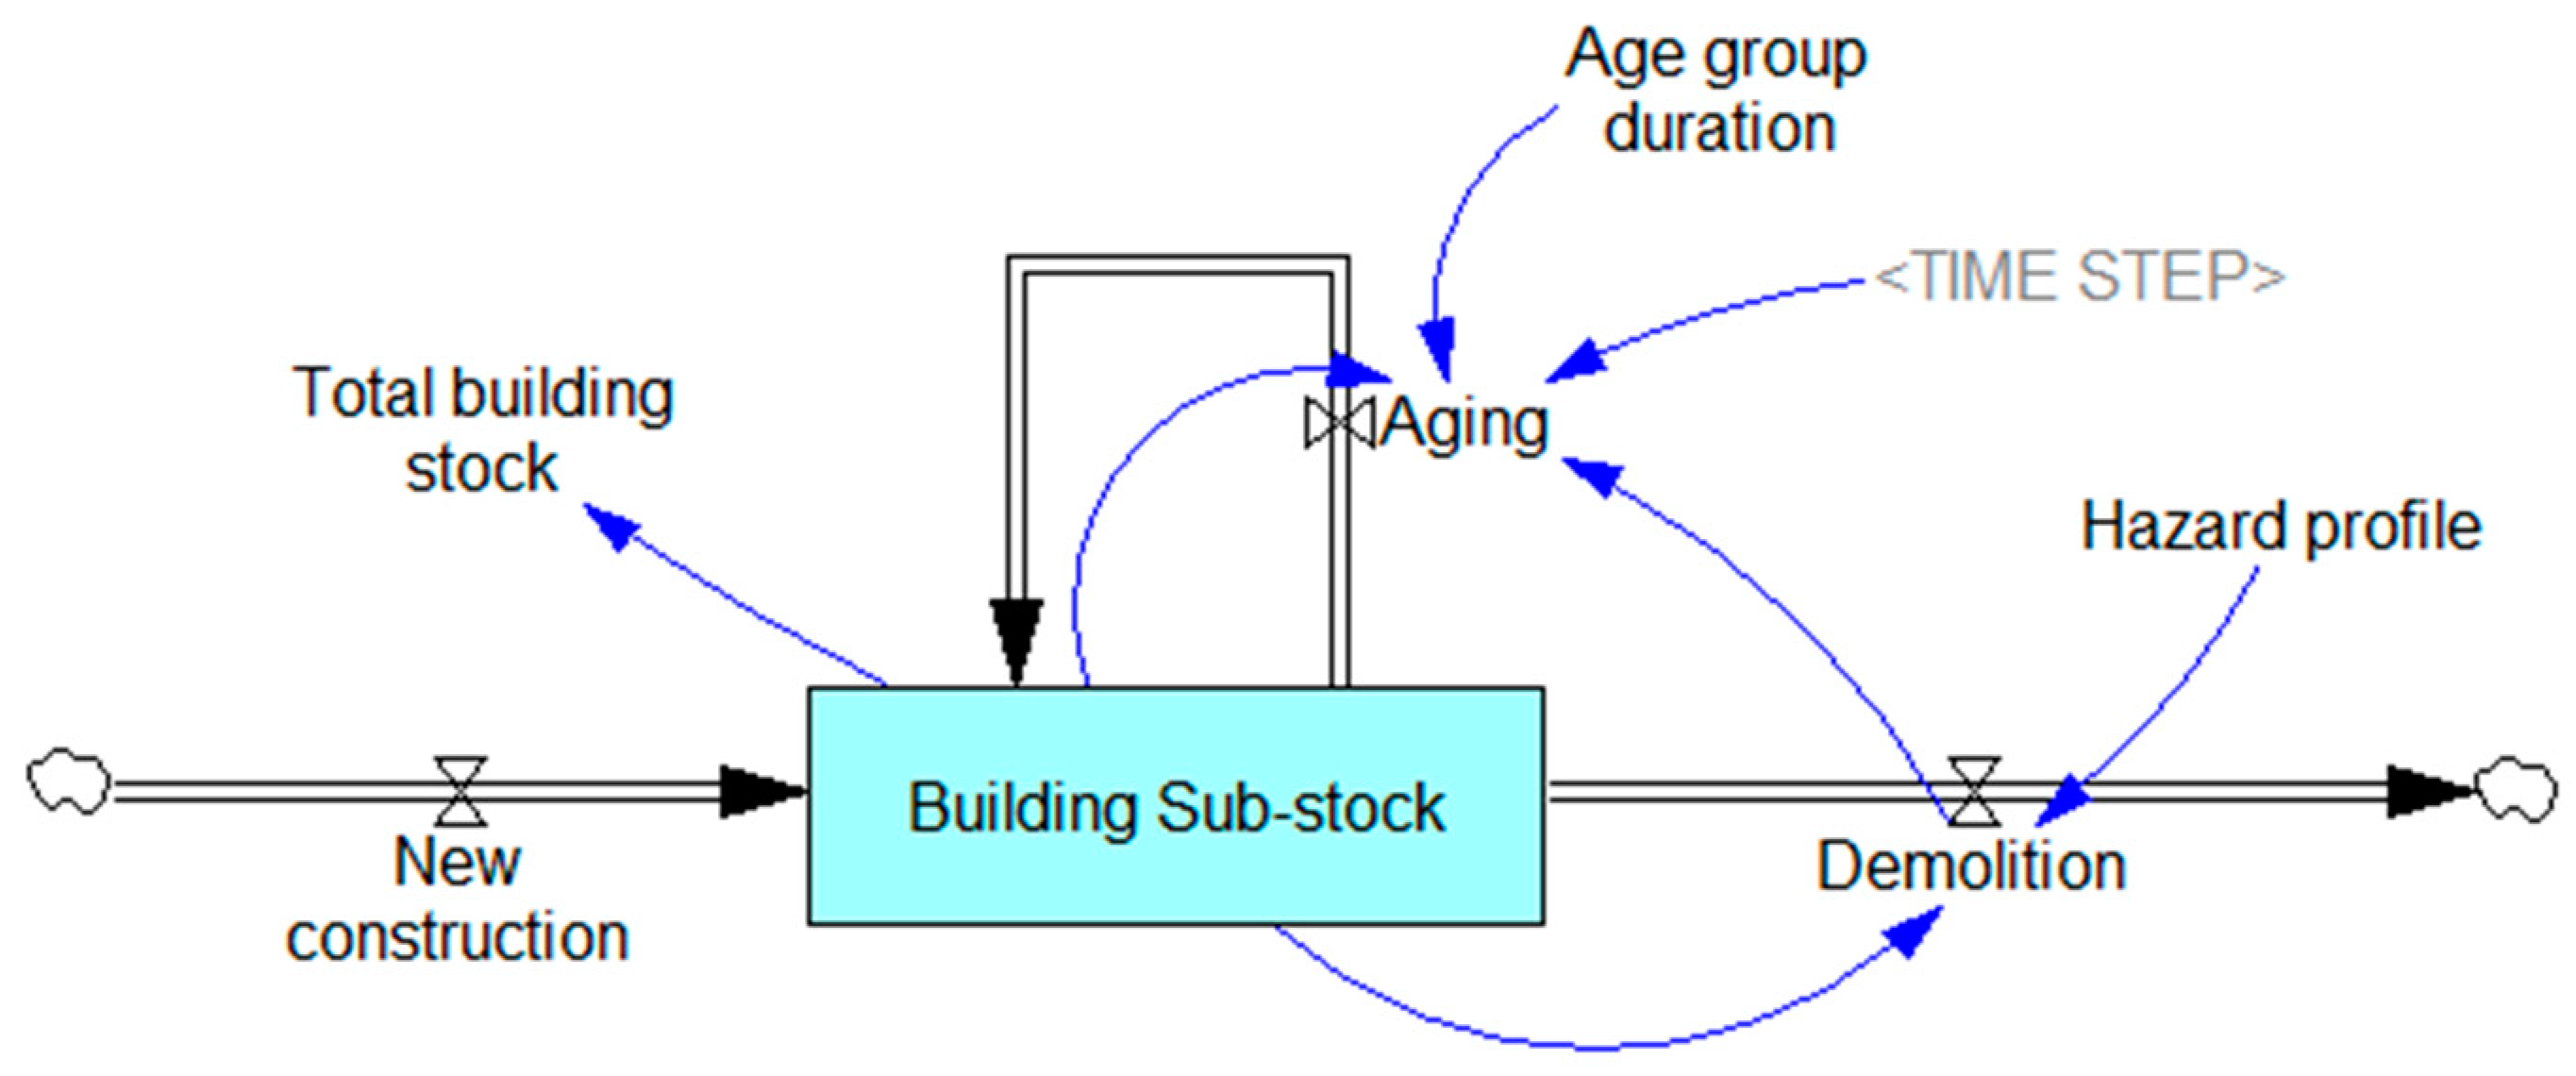
Given that building lifetime in China is generally short, the model uses 101 sub-stocks to respectively represent 0-year-old buildings, 1-year-old buildings, 2-year-old buildings, and so on. The 101st sub-stock represents all buildings that are 100 years old or older, but such buildings account for a negligible percentage of the overall stock of urban buildings in China. Indeed, buildings aged below 40 years accounted for more than 95% in the total stock of urban residential buildings in 2010 [70]. The schematics in Figure 1 and Figure 2 were converted to the working model using subscripting techniques. The model structure was re-formulated to improve representation and analytical convenience. As shown in Figure 3, the building stock can be viewed as a stack of 101 sub-stocks. For any given year, the total stock of buildings in use is the sum of the age-specific building sub-stocks, and the total demolition of buildings is the sum of the age-specific demolitions.
Subscripts are applied to each sub-stock, to the aging and demolition rates, and to the hazard profile. The hazard profile consists of age-specific hazard rates calculated from the hazard function. The numbering of subscripts represents the age of buildings. For example, Building Sub-stock[10] represents the group of 10-year-old buildings, Demolition[10] represents the demolition and removal of buildings from Building Sub-stock[10], whereas Aging[10] represents the shift of existing buildings from Building Sub-stock[10] to Building Sub-stock[11]. Mathematically, the relationships between these variables are expressed as follows:
With the age group duration and time step both set to be equal to 1 year, the aging equation can be re-written as follows.
This simplified equation, together with the previous equations for building sub-stocks, clearly show that the aging process is effectively the discrete shift of a group of buildings from age j to age j + 1, duly taking into account time-varying annual demolition applicable to age j.
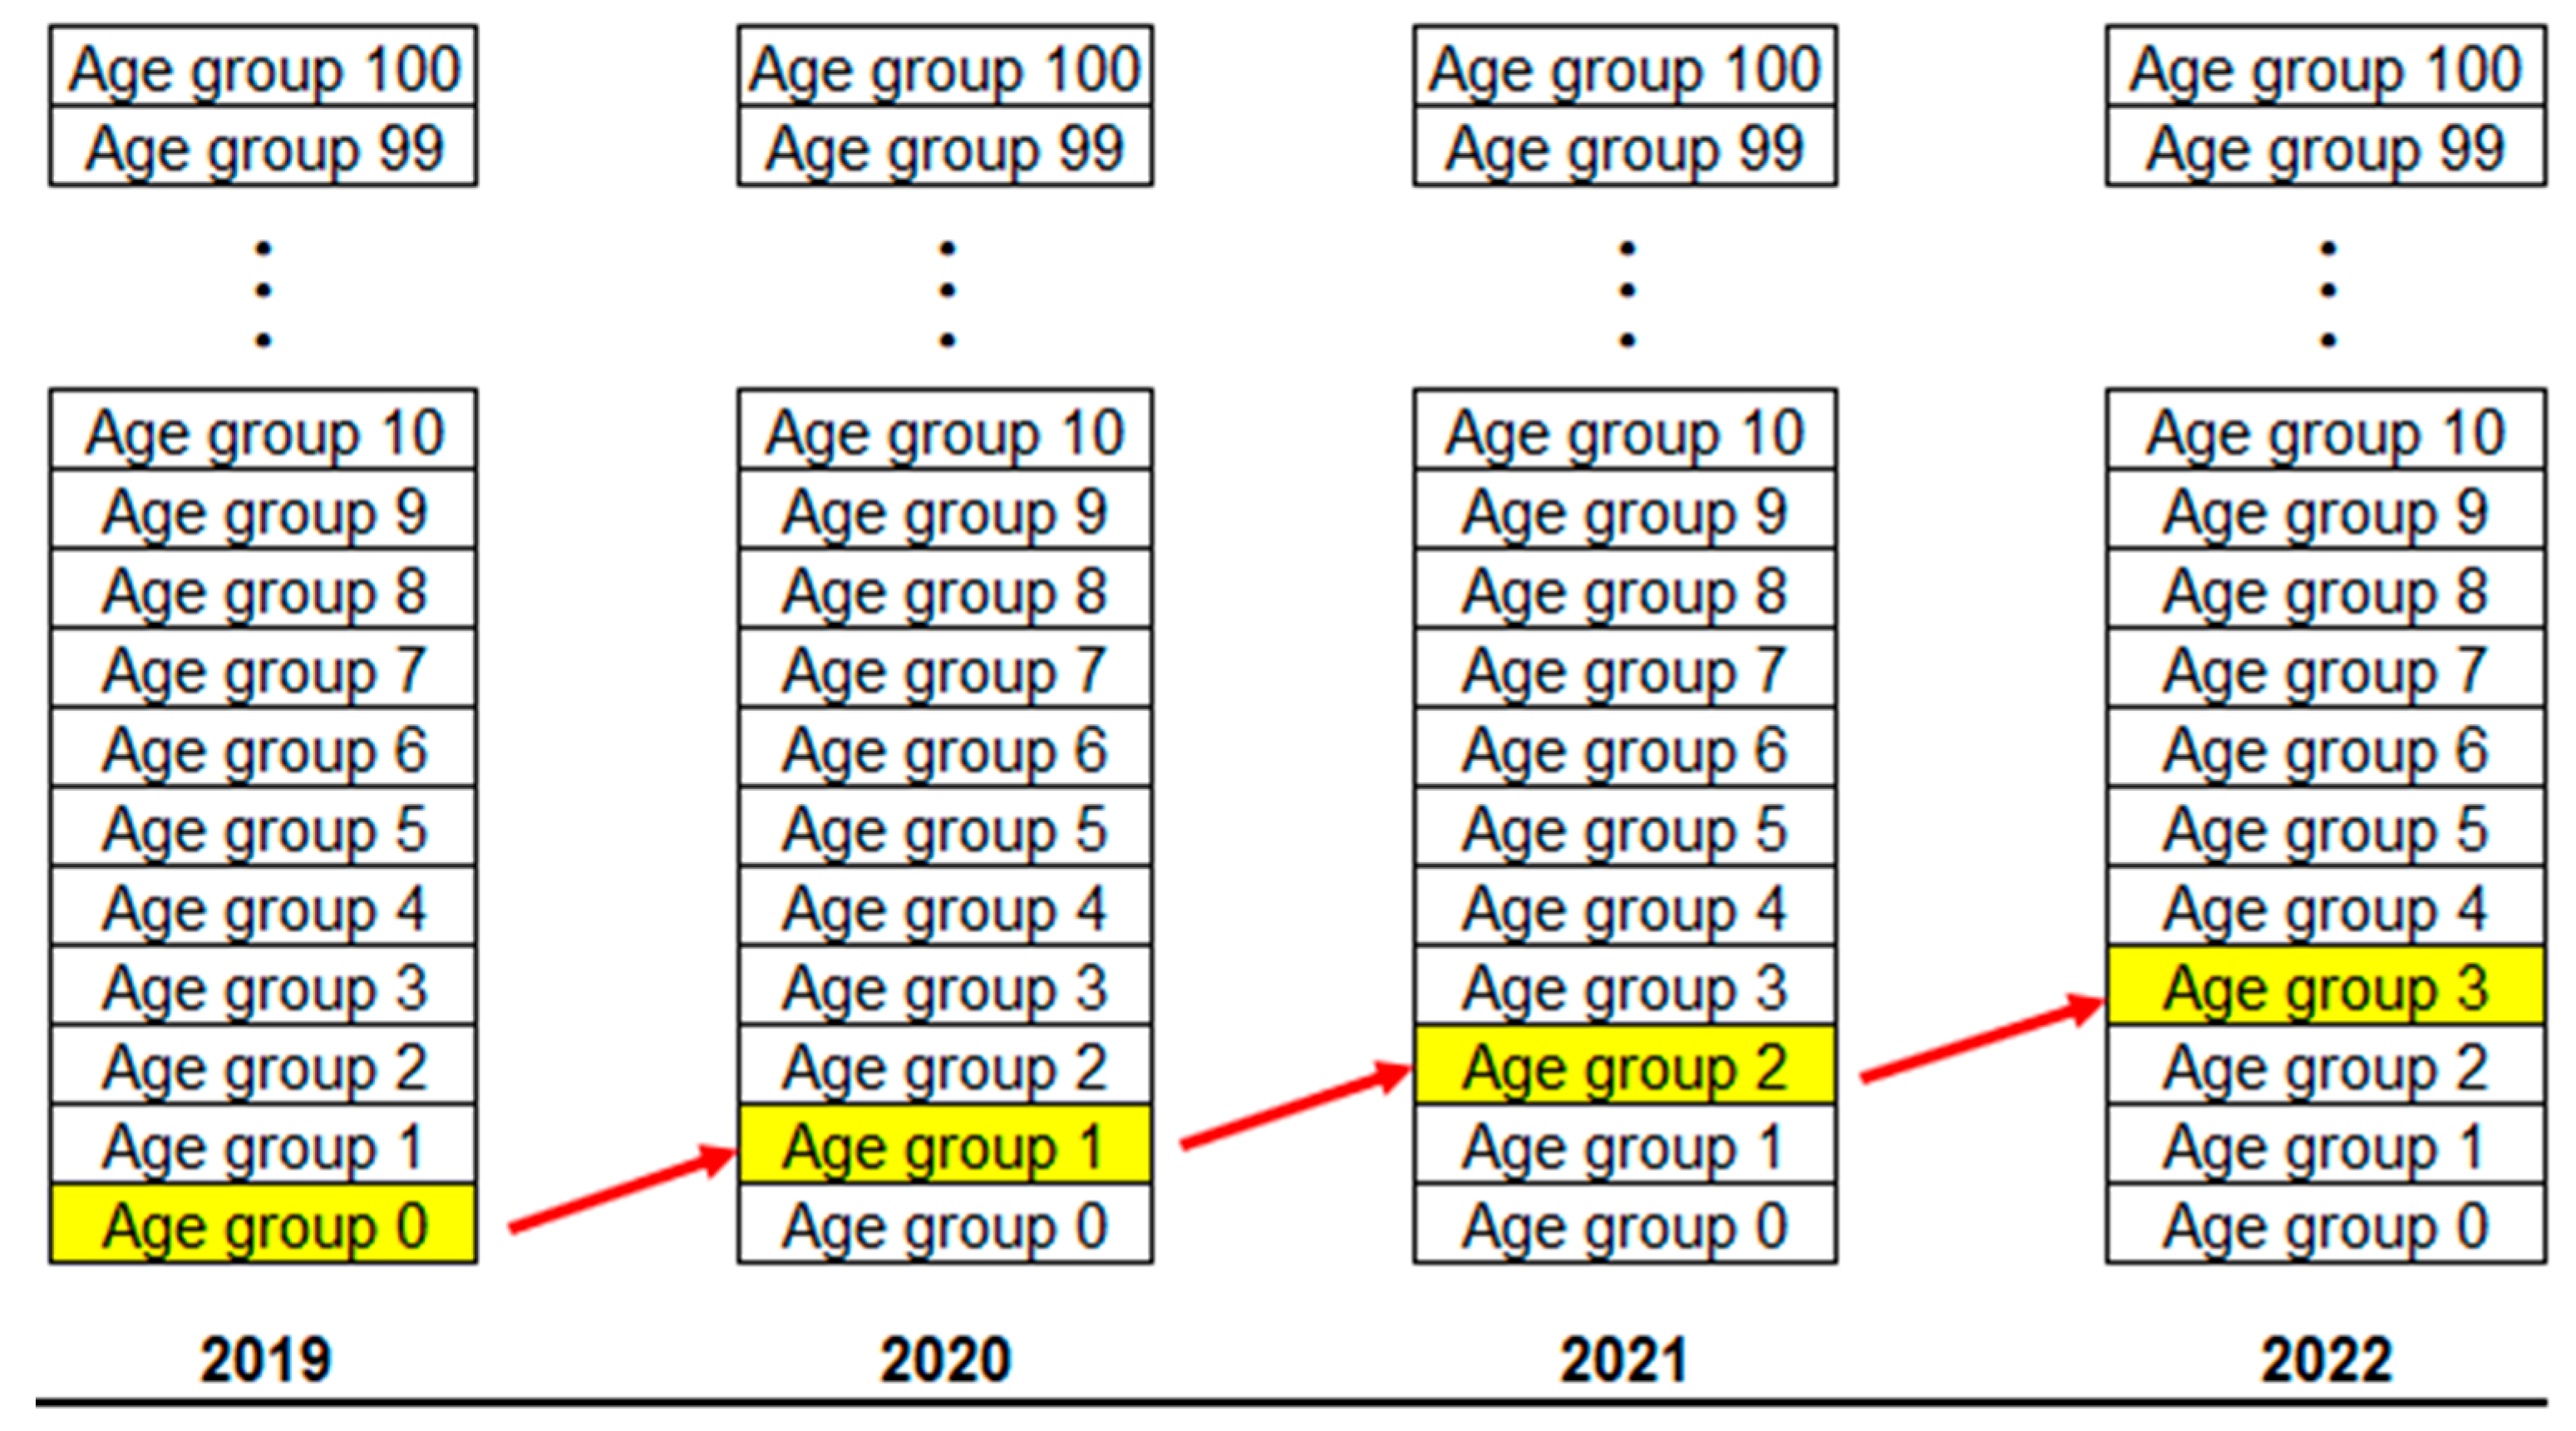
Figure 4 illustrates the dynamics of the building aging process. In any year, the entire stock is composed of 101 building age groups. The flow of buildings through the age groups forms the aging chain. Year by year, a building gets older and thus “relocates” itself between age groups along the chain, on the condition that it remains alive. For example, the highlighted blocks show a particular cohort of buildings constructed in 2019 moving up through the age groups/sub-stocks. Initially, the cohort stays in age group 0 in 2019, and then moves to age group 1 in 2020, age group 2 in 2021, age group 3 in 2022, and so on. Every year, new buildings are constructed, put in use, and therefore become part of the total stock, although the rates vary subject to demand driven by socio-economic development and rates at which old buildings are demolished/disused and consequently removed from the stock. Note that demolition from each of the 101 age groups is not explicitly shown in order to avoid visual clutter.
4.4. Data Sources
Historical data on total floor area of building stock from authoritative sources are limited. The latest official statistics on total floor area of urban residential buildings across China was 11.29 billion m2 for 2006, published in the China Statistical Yearbook 2007. The source of data was MOHURD. From 2007 onwards, these statistics were no longer published. Prior to 2006, data was provided in the annual China Statistical Yearbooks and in the Statistical Communique on Urban Housing released by MOHURD from 2002 to 2005. The earliest year for which data are available is 1978. Data on annual new construction of urban residential buildings was taken from China Statistical Yearbooks.
The calibration of the shape and scale parameters of the Weibull distribution for building lifetime was realised by comparing and minimising the difference between the estimated annual total floor area of urban residential buildings, which is the emergent behaviour of the building stock resulting from the dynamic process of new construction, aging and age-specific demolition, with the official statistical data over the historical period through 2006. This method allows parameters governing building lifetime to be calibrated rather than arbitrarily defined, thereby avoiding relying on the over-estimated per-capita floor area. Accordingly, the stock turnover dynamics and the resultant annual total floor area over the period of 2007 to 2017 were estimated using the officially published annual new construction data over that period and the calibrated Weibull distribution.
5. Results
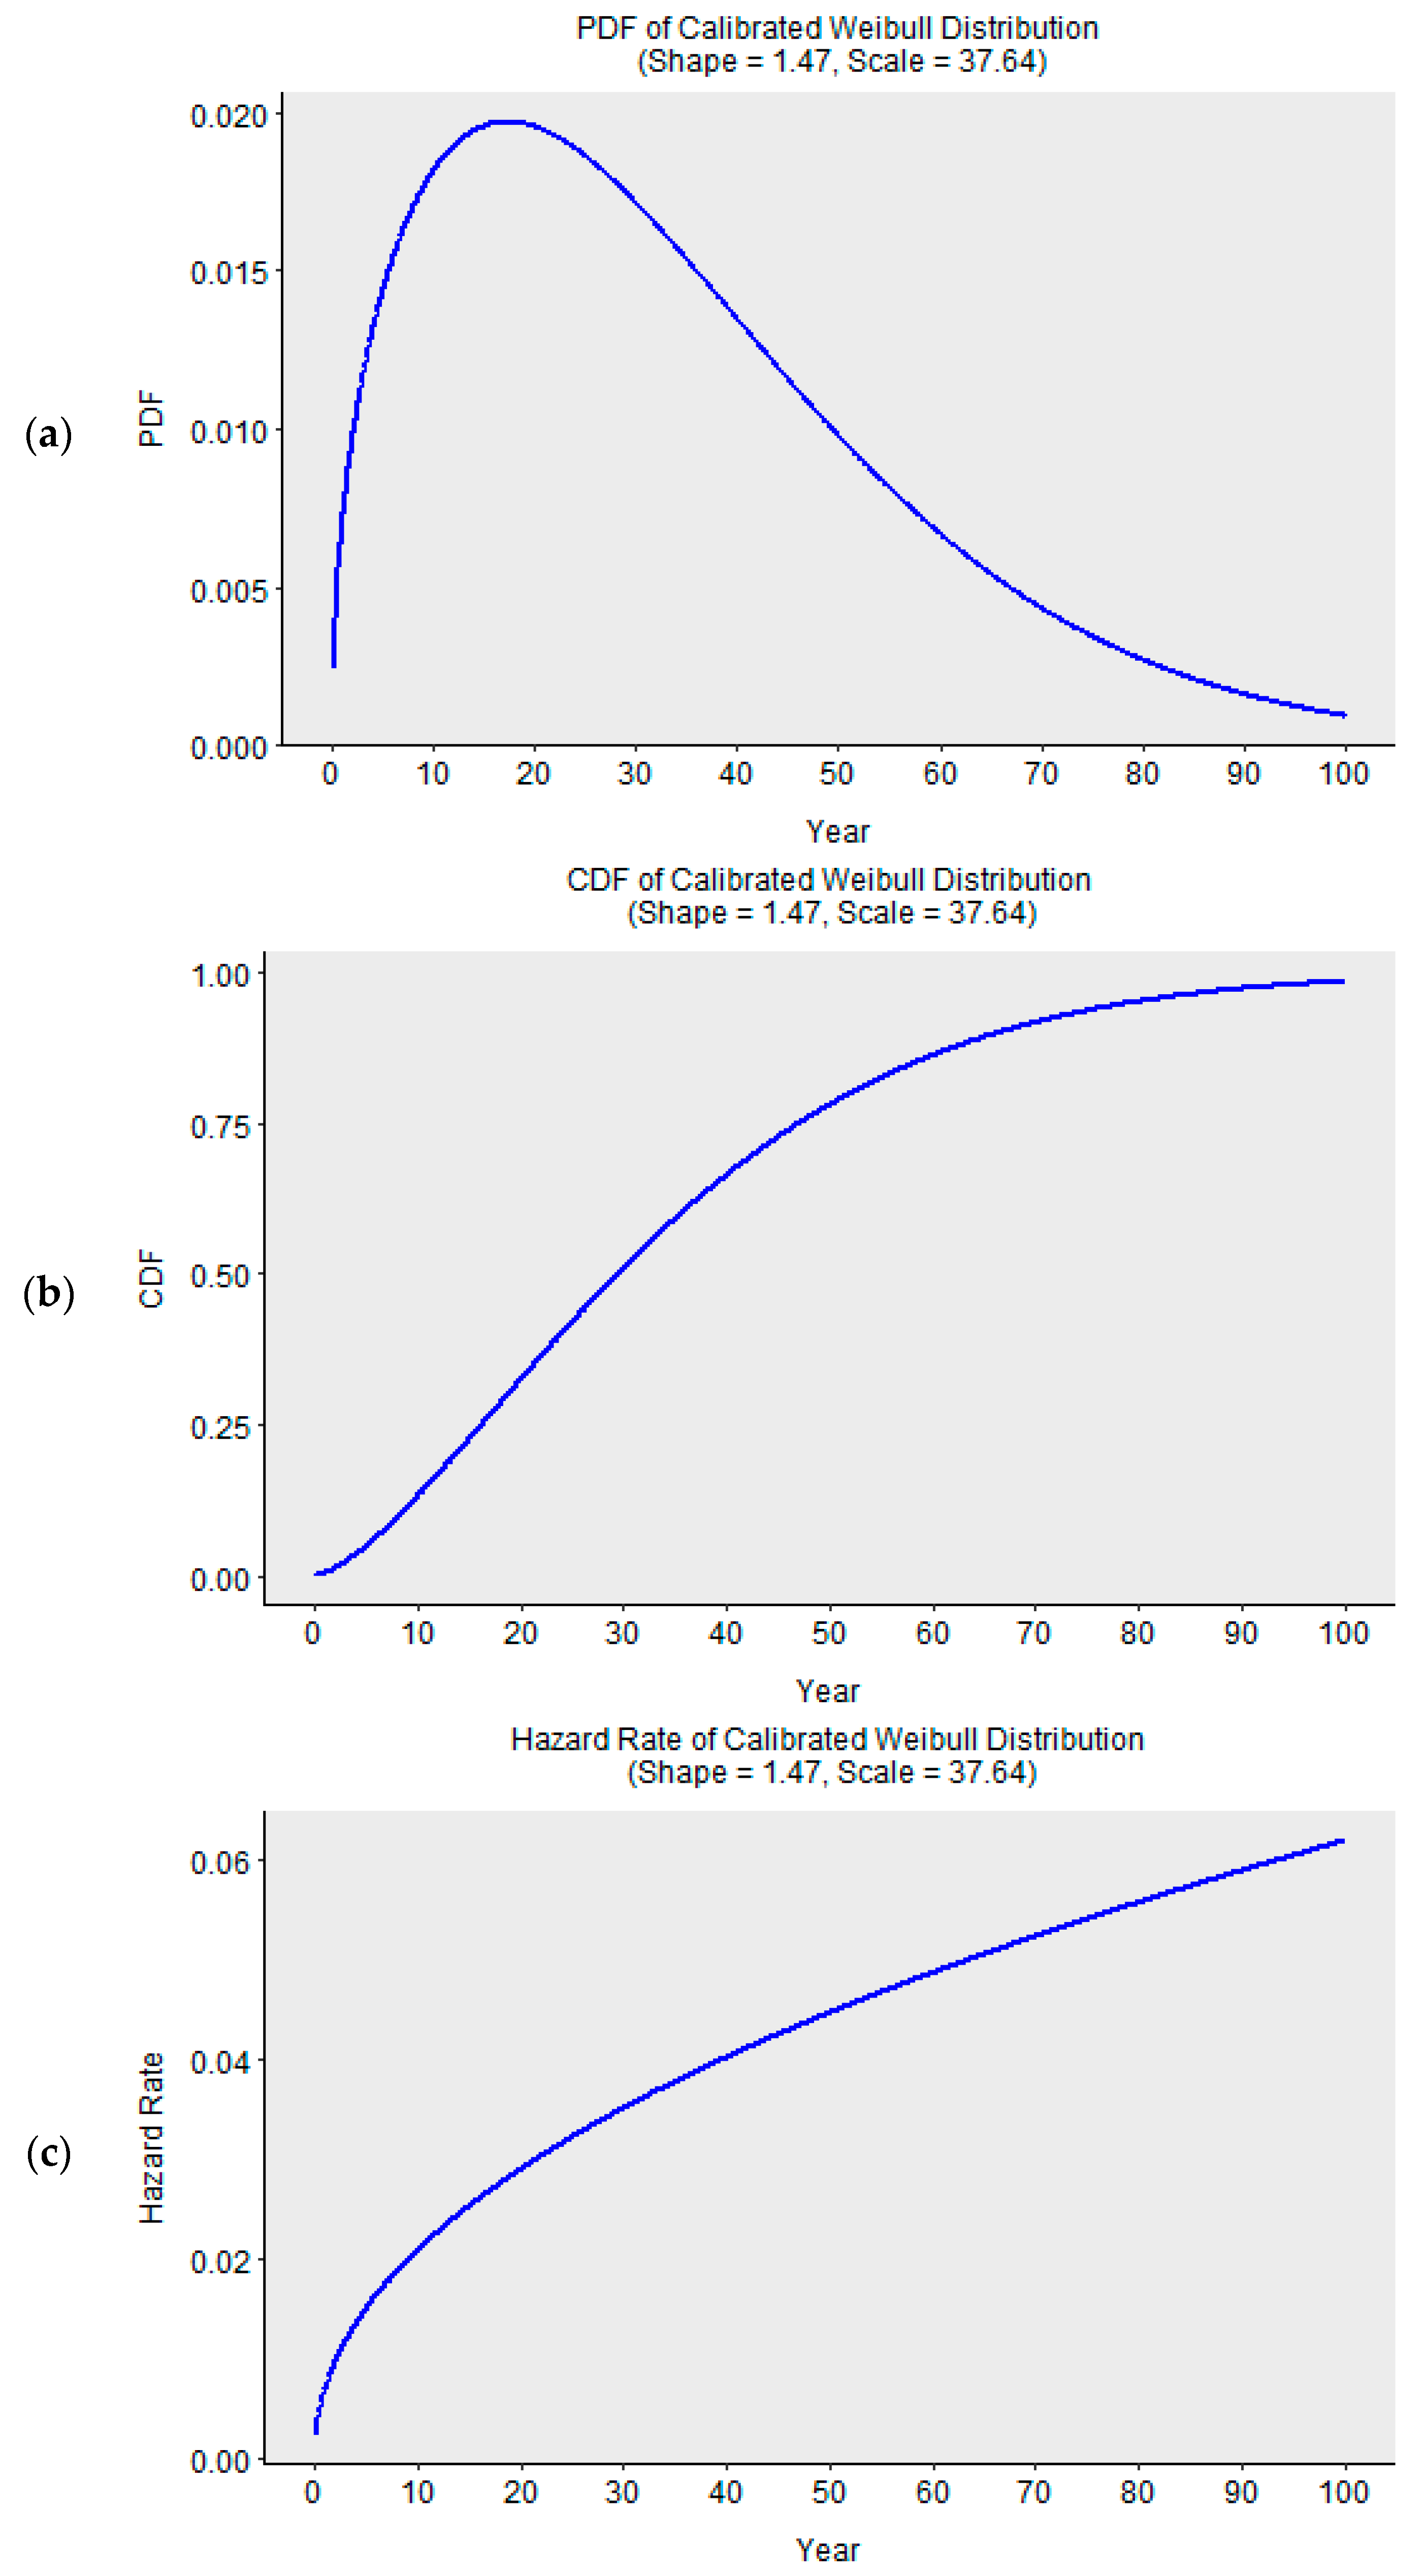
Using the historical data and stock turnover model, the Weibull distribution was calibrated to have a shape parameter of 1.47 and a scale parameter of 37.64. Its PDF, CDF and hazard function are shown in Figure 5. The resultant building lifetime distribution was found to have a mean value of 34.1 years and a standard deviation of 23.5. This confirms the general observation that urban residential buildings in China have an average lifetime much shorter than the design lifetime of 50 years. The average lifetime estimate of 34.1 years is consistent with the assumptions made by previous studies that employed a normal distribution, which commonly set the average lifetime in the range of 30 to 50 years.
Due to the lack of official statistics on the annual demolition of residential buildings, it was not possible to directly cross-validate the modelling result using historical annual demolition data. In an indirect way, however, comparing the demolition estimated in our study with previous studies provides an alternative basis for evaluating the robustness of the modelling approach and the calibrated building lifetime. According to THUBERC [71], the ratio of aggregated demolished buildings to aggregated newly constructed buildings over China’s 11th Five-Year Plan Period (2006 to 2010) was approximately 34%. In our study, using the calibrated Weibull parameters in the stock turnover model, this ratio was found to be 32%—very close to the THUBERC [71] estimate. In absolute terms, annual demolition level we estimate is of the same order of magnitude as previous studies. For example, for 2010, the annual demolition was estimated by this study to be 1.49 billion m2, approximately 1.3 billion m2 by [18] and approximately 1.7 billion m2 by [35]. The difference was due primarily to different settings of lifetime distribution parameters.
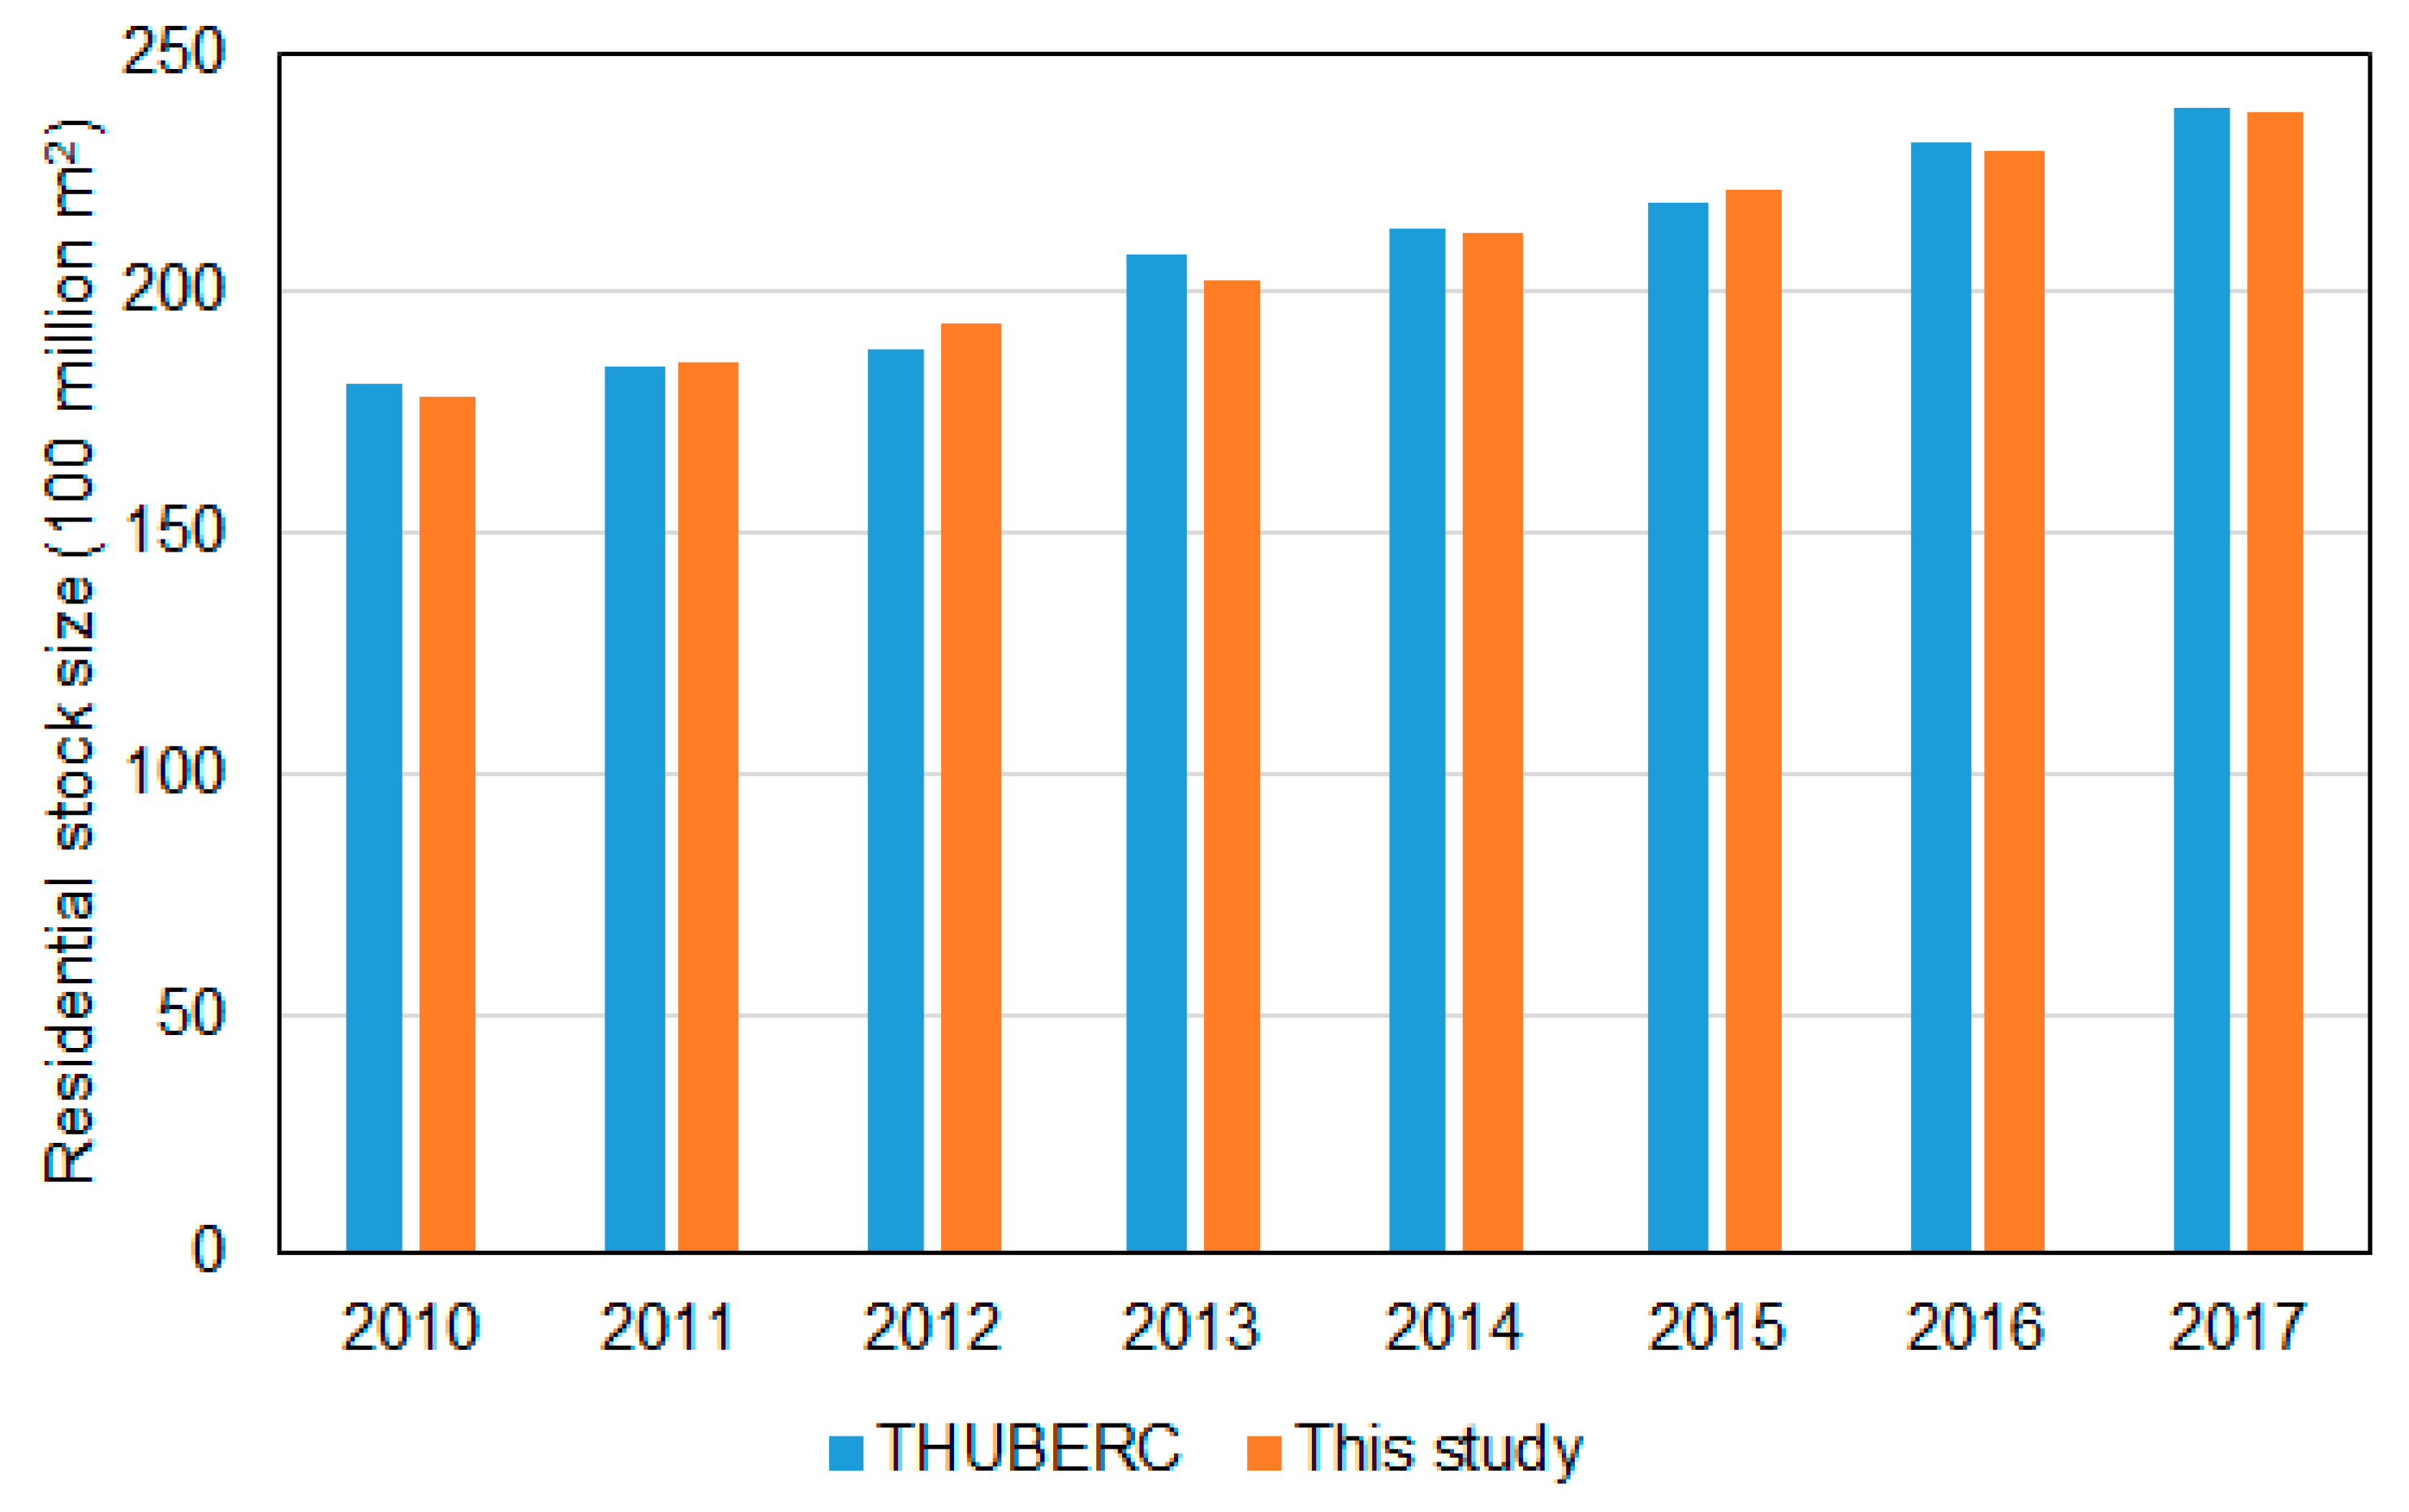
Our modelling results suggest a continuously increasing trend of the overall stock size of urban residential buildings, increasing by 33.1% over 8 years from 17.8 billion m2 in 2010 to 23.7 billion m2 in 2017. Figure 6 compares the stock size of residential buildings in this study and that of the Annual Report on China Building Energy Efficiency [72] for 2010–2017. The Annual Report was developed by the leading research institution, the Tsinghua University Building Energy Research Centre (THUBERC), as part of a larger consultancy project funded by the Chinese Academy of Engineering, and is widely recognised as an authoritative report on building energy in China. As shown in Figure 6, the differences were consistently marginal, supporting the validity of the assumptions that were fed into our model.
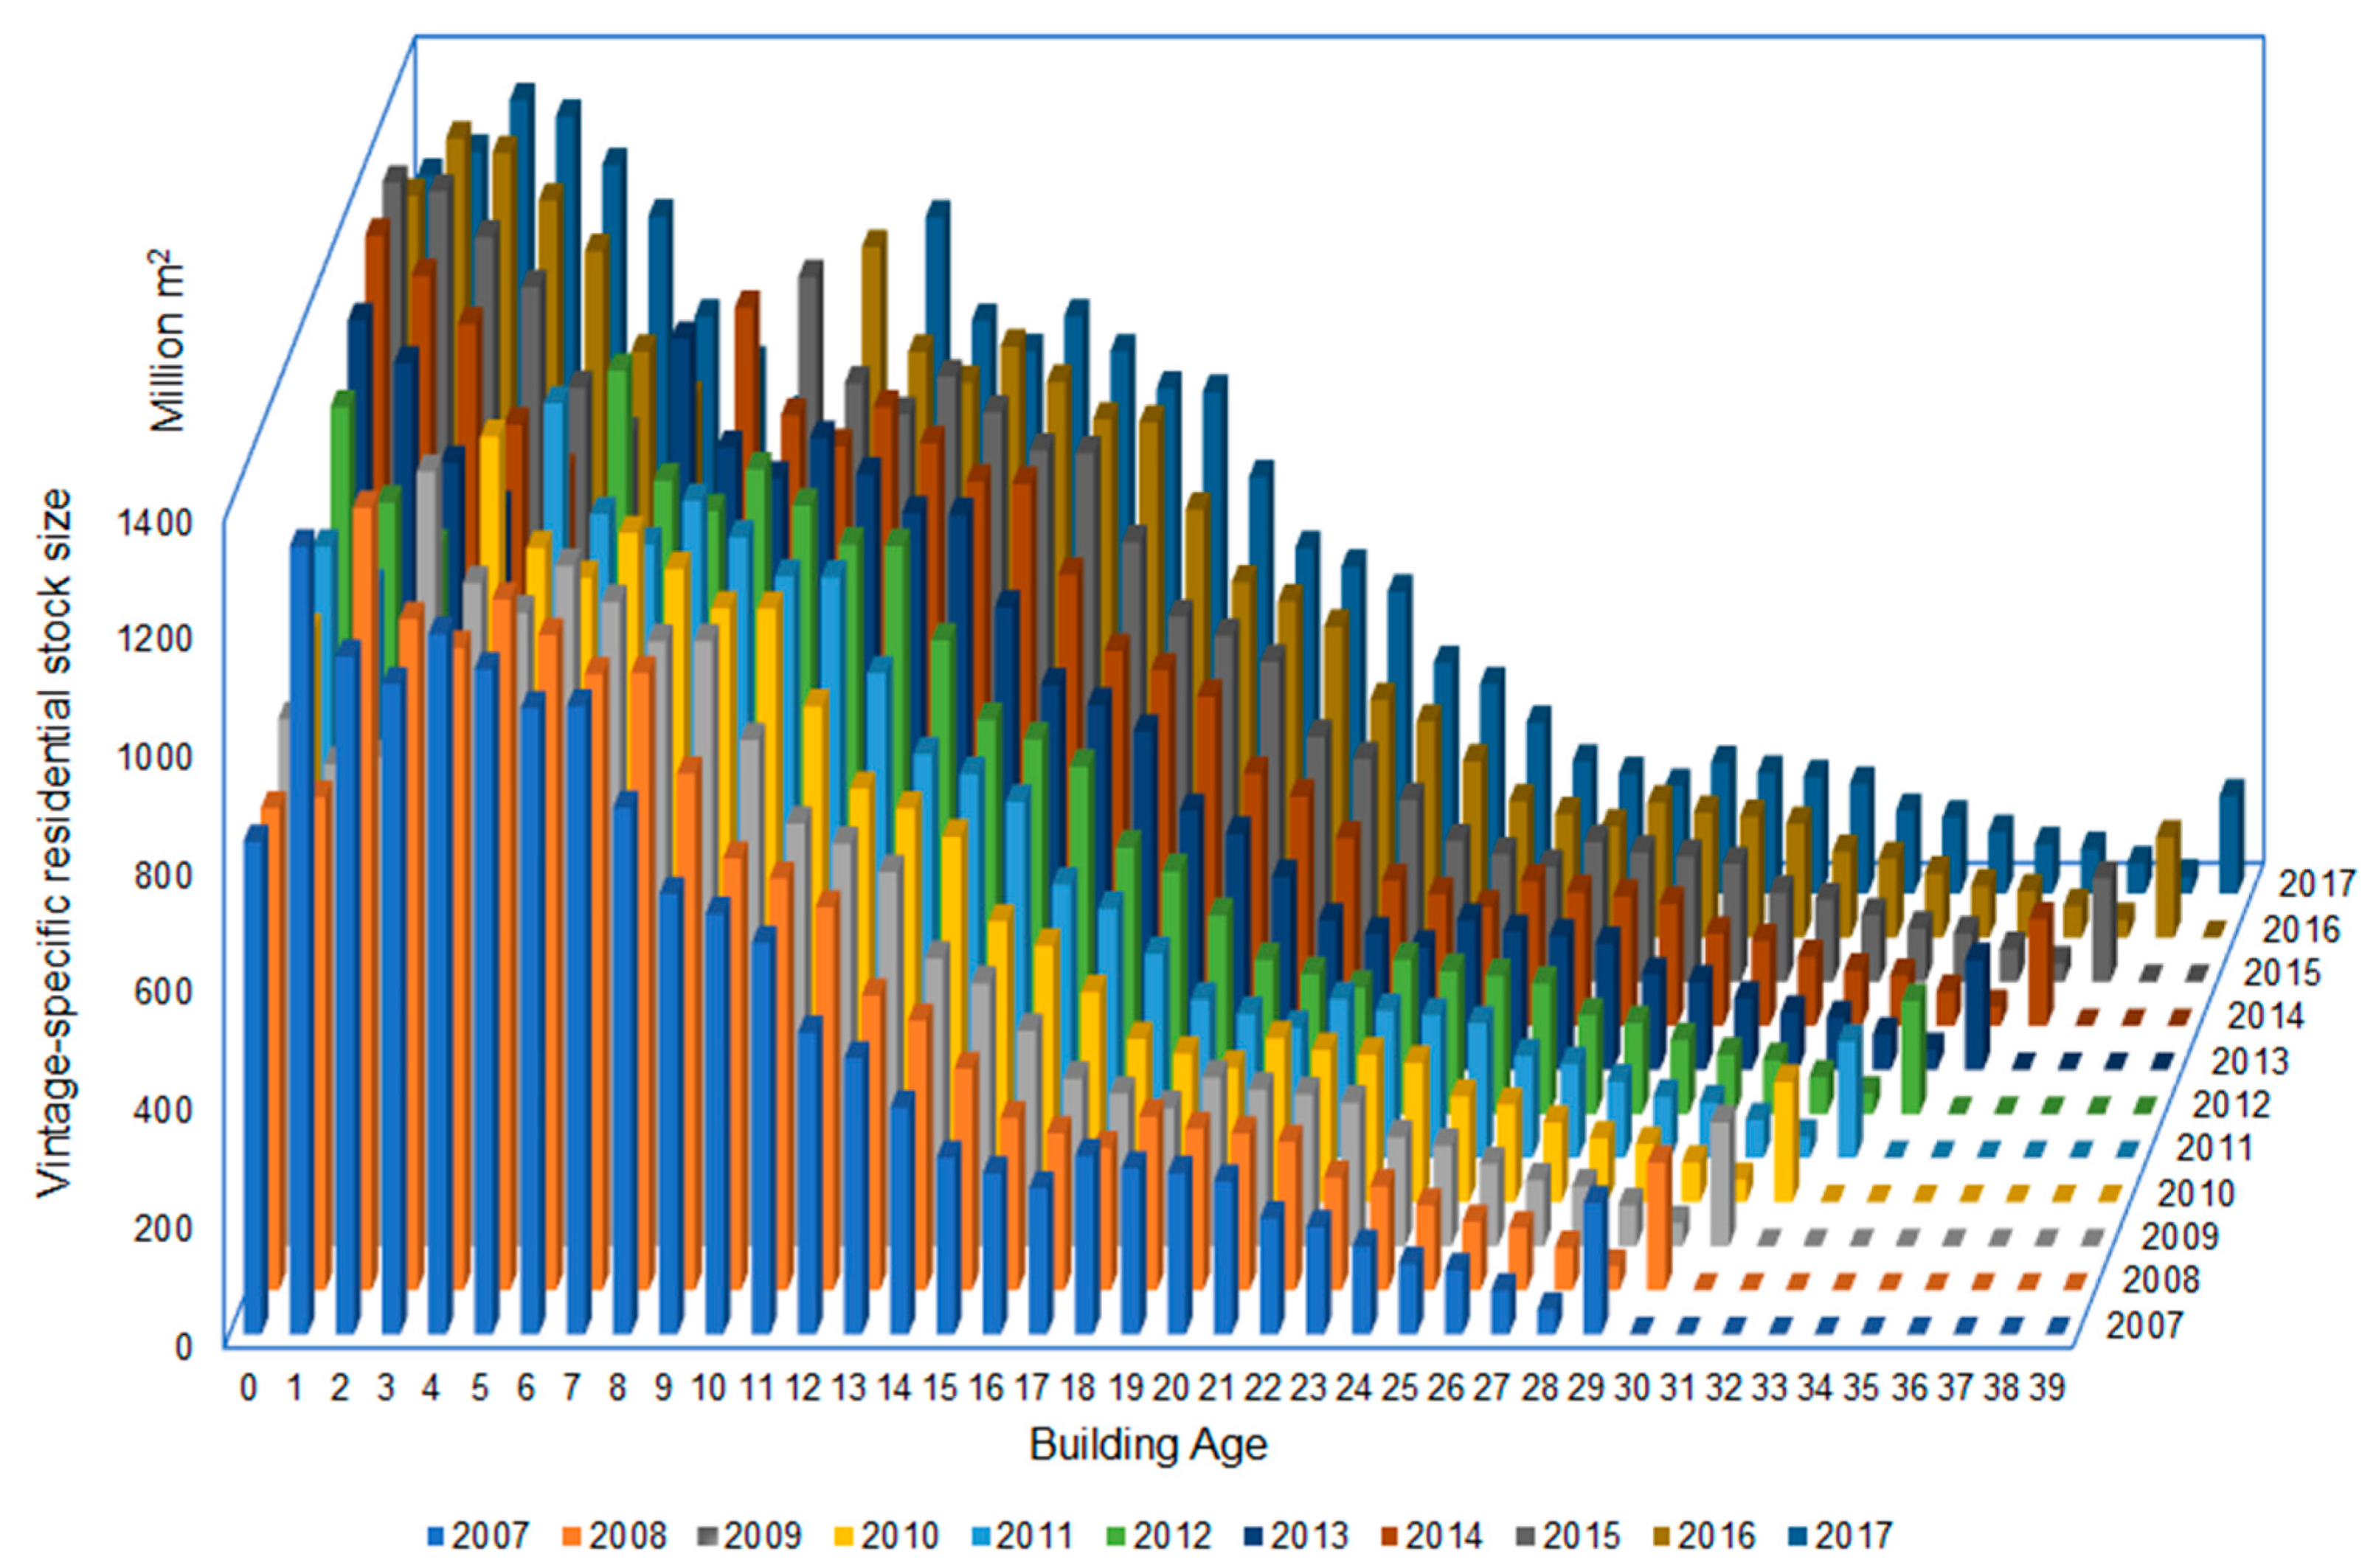
However, compared to the Annual Report, which only gives the total stock size, our model offers additional insights into the residential buildings in the form of the explicitly modelled building aging process. The total stock of residential buildings in each year is disaggregated into age-specific sub-stocks, each of which goes through an aging process subject to age-specific demolition probability estimated by the Weibull lifetime distribution (Figure 7). For each year, new buildings constructed in that year and existing buildings that remain in use in that year are spread across the age range, collectively creating the age profile of all buildings in that year. For subsequent year, the age profile changes due to new construction, aging and demolition. These on-going dynamics, which result in the turnover of the overall residential stock, are fully captured in our model. In addition, whereas the now-outdated Annual Reports provided an overview up to that given year (2006 or earlier), the Weibull lifetime distribution in our model serves as an avenue through which possible future stock turnover trajectories can be modelled. For example, given the total size and age profile of the 2017 stock, the 2018 stock can be estimated using the new construction in 2018 and the removal of existing buildings based on their respective age-specific demolition probabilities. The same logic applies going forward, where the interaction between new construction and demolition and trends in per-capita floor area will drive the growth dynamics of the stock and allow for reasonable forecasts of future growth.
As shown in Figure 7, for the building age profile in each year, the oldest sub-stock of buildings is greater than the immediately preceding younger sub-stocks. For example, for 2007, the column representing the oldest sub-stock (i.e., 29 years old) is much taller than the several preceding ones, which exhibit a generally descending trend due to aging and demolition. This is because the 29-year-old sub-stock in 2007 represents all those buildings already existing in 1978 (the first year of the model) that survived to 2007. That sub-stock includes all existing buildings of various ages in 1978. Likewise, the 30-year-old sub-stock in 2008 also represents older buildings already in use in 1978 and remaining in use in 2008. So, the x-axis in Figure 7 is the building age for all buildings other than for this particular set (i.e., buildings in existence in 1978). It was not possible to differentiate those old buildings by their ages in the initial stock in 1978 because no statistics are available for the age profile before 1978. Therefore, without a known composition of buildings by age, the 1978 stock was treated in the model as a mixed one, in which buildings were assumed to be subject to the same probability of demolition. Mathematically, this means these buildings’ lifetimes were assumed to follow an exponential distribution whose hazard function was a constant equal to the reciprocal of their average lifetime, which was taken into account in the calibration process. We acknowledge that this is a minor methodological limitation due to data availability constraints, but given its small overall size, the impact of the age profile of buildings in the initial stock in 1978 on more recent stock is largely negligible. Over time, this initial stock will only keep shrinking due to demolition, and its impact will further diminish accordingly.
6. Discussion and Conclusions
While it is generally believed that Chinese buildings are short-lived, there is a dearth of official statistics and empirical data on building lifetimes to substantiate this observation. Moreover, official statistics on total floor area of urban residential buildings only exist up to 2006, resulting in an unknown historical growth trajectory of urban residential building stock in China from 2007 onwards. Previous studies estimating recent and future Chinese building stock and energy use make various assumptions about building lifetime and stock turnover as part of their methodological approaches in an effort to overcome the lack of available data. However, as discussed earlier, these models use various questionable assumptions, as evidenced by the wide variation in results of different models. Moreover, the dynamic profile of age-specific sub-stocks and the implications for energy and carbon have not been extensively explored, which suggests a research gap in estimating building lifetime and stock turnover dynamics.
Our study developed a residential stock turnover model using a system dynamics approach. The model applied survival analysis to represent building lifecycle, from being newly constructed to being eventually demolished. Demolition was modelled as a stochastic process based on a hazard function derived from a Weibull distribution representing the uncertainties associated with building lifetime. Using historical data starting with 1978, the first year official building stock statistics are available, the Weibull distribution’s shape and scale parameters were calibrated. The specified Weibull distribution had a mean value of 34.1, which represents the average building lifetime. Our result substantiates the general observation that urban residential buildings in China have an average lifetime much shorter than the design lifetime of 50 years. In the absence of official statistics on building lifetime, our study can assist policy-makers in characterising existing buildings at the national, provincial and municipal levels. Based on the calibrated lifetime distribution, the total stock size of urban residential buildings was estimated to have increased from 17.8 billion m2 in 2010 to 23.7 billion m2 in 2017, based on a dynamically changing age profile.
However, the value of estimating the building lifetime distribution and obtaining an explicit set of age-specific sub-stocks goes beyond understanding the dynamics of the residential building stock itself and offers three sets of insights. Firstly, the estimated lifetime distribution makes it possible to explicitly estimate annual new construction and demolition, which can be directly used to quantify the total initial and demolition embodied energy and carbon incurred every year. The impact of potentially changing the lifetime distribution on this embodied energy and carbon, via planning policy or as a result of economic and environmental factors, can be examined.
Secondly, model granularity at the level of age-specific building sub-stocks offers a detailed representation of the building stocks’ heterogeneity with respect to operational energy performance. Going forward, it is reasonable to expect that new buildings will be built to higher standards of operational energy performance due to increasingly stringent design codes and technological advances. Separately tracking the aging process of different cohorts of buildings enables policy-makers to appreciate the dynamics of the stock composition of buildings with different operational performance and evaluate the trajectories of stock-wide average operational energy intensity per square metre. Explicitly modelling the aging process also provides analytical convenience to enable detailed policy experimentation, such as by targeting the retrofitting of old buildings at different ages for different depths of energy performance improvement, which makes not only technical but also economic sense.
Thirdly, and perhaps most importantly, the ability to model the temporal dynamics of the building stock enables the integration of embodied and operational impacts. A dynamic model allows us to explore their relative importance in the context of further developments in green building materials, strengthening design codes for new buildings and scaling up the energy-related retrofits of existing buildings. In so doing, a fuller understanding of lifecycle energy and carbon of urban residential buildings in China can be reached so as to better inform policies aiming to decarbonise buildings.
The whole-life (embodied plus operational) energy and carbon of the Chinese building stock are major contributors to global climate change. In 2013 and 2014, the operational energy used in existing buildings was similar in size to the embodied energy used in the construction of new buildings, together accounting for around 34% of China’s total primary energy consumption. In order to reach economy-wide peak emissions by 2030, it is critical that policies effectively address both embodied and operational energy of the building stock.
We have demonstrated that the dynamics of building lifetime and building stock turnover are fundamental prerequisites to forecasting whole life energy and carbon impacts and to understanding the interactions between the two. To address the current lack of data, we have developed a calibrated model using a series of 101 heterogeneous building stocks. The model outputs indicate that the average lifetime of urban residential buildings in China is currently 34.1 years, and that the total stock has increased by 33.1%, from 17.8 billion m2 in 2010 to 23.7 billion m2 in 2017.
The next step will be to extend this model by adding additional properties such as embodied energy intensity and operational energy intensity, as well as additional structures and components that drive stock development, such as the expected trajectory of per-capita floor area. We will then develop a fully-fledged building energy and emissions model for modelling and analysing policy scenarios to investigate the trade-offs of embodied-versus-operational energy and carbon facing Chinese residential buildings.
Author Contributions
Conceptualization, W.Z. and A.M.; methodology, W.Z.; software, W.Z.; formal analysis, W.Z.; writing—original draft preparation, W.Z.; writing—review and editing, A.M., D.M.R., and P.G.; supervision, A.M., D.M.R., and P.G.
Funding
This research received no external funding.
Acknowledgments
W.Z. was funded by the Cambridge Trust.
Conflicts of Interest
The authors declare no conflicts of interest.
References
- IEA. World Energy Outlook 2015 Special Report on Energy and Climate Change; OECD/IEA: Paris, France, 2015. [Google Scholar]
- UNDP. Issue Brief: Fuel Cell Vehicle Development in China. 2015. Available online: http://www.cn.undp.org/content/china/en/home/library/environment_energy/issue-brief--fuel-cell-vehicle-development-in-china.html (accessed on 17 July 2018).
- US EPA. Global Greenhouse Gas Emissions Data. 2017. Available online: https://www.epa.gov/ghgemissions/global-greenhouse-gas-emissions-data#Country (accessed on 20 July 2018).
- World Bank. GEF to Support Implementation of China’s Energy Efficiency and Environment Programs. 2017. Available online: http://www.worldbank.org/en/news/press-release/2017/03/16/gef-to-support-implementation-of-chinas-energy-efficiency-and-environment-programs (accessed on 20 July 2018).
- IEA. World Energy Outlook 2013. 2013. Available online: http://www.oecd-ilibrary.org/energy/world-energy-outlook-2013_weo-2013-en (accessed on 20 July 2018).
- IEA. World Energy Outlook 2014. 2014. Available online: http://www.oecd-ilibrary.org/energy/world-energy-outlook-2014_weo-2014-en (accessed on 20 July 2018).
- IEA. World Energy Outlook 2015. 2015. Available online: http://www.oecd-ilibrary.org/energy/world-energy-outlook-2015_weo-2015-en (accessed on 20 July 2018).
- IEA. World Energy Outlook 2016; OECD Publishing: Paris, France, 2016. [Google Scholar]
- IEA. Building Energy Use in China: Transforming Construction and Influencing Consumption to 2050. 2015. Available online: https://www.iea.org/publications/freepublications/publication/PARTNERCOUNTRYSERIESBuildingEnergy_WEB_FINAL.pdf (accessed on 12 September 2018).
- National Bureau of Statistics. China Statistical Yearbook 2017; China Statistics Press: Beijing, China, 2017. Available online: http://www.stats.gov.cn/tjsj/ndsj/2017/indexeh.htm (accessed on 19 January 2019).
- Global Alliance for Buildings and Construction. Global Status Report 2016. 2016. Available online: http://www.globalabc.org/bundles/app/pdf/20161114_GABC-GSR-Report_Updated_Web-version.pdf (accessed on 13 July 2018).
- IEA and IPEEC. Building Energy Performance Metrics: Supporting Energy Efficiency Progress in Major Economies. 2015. Available online: https://www.iea.org/publications/freepublications/publication/BuildingEnergyPerformanceMetrics.pdf (accessed on 25 July 2018).
- IEA. Tracking Clean Energy Progress 2016. 2016. Available online: http://www.iea.org/publications/freepublications/publication/TrackingCleanEnergyProgress2016.pdf (accessed on 22 October 2018).
- THUBERC. 2016 Annual Report on China Building Energy Efficiency; China Architecture & Building Press: Beijing, China, 2016. [Google Scholar]
- NDRC. Enhanced Actions on Climate Change: China’s Intended Nationally Determined Contributions. 2015. Available online: http://www4.unfccc.int/ndcregistry/PublishedDocuments/China First/China%27s First NDC Submission.pdf (accessed on 25 July 2017).
- Guan, D.; Meng, J.; Reiner, D.M.; Zhang, N.; Shan, Y.; Mi, Z.; Shao, S.; Liu, Z.; Zhang, Q.; Davis, S.J. Structural decline in China’s CO2 emissions through transitions in industry and energy systems. Nat. Geosci. 2018, 11, 551–555. [Google Scholar] [CrossRef]
- Huang, W. Speech at the Meeting of “She Hui Zhu Yi Xin Nong Cun Jian She”, “Building New Countryside of the Socialist Society”. 2006. Available online: http://www.mohurd.gov.cn/jsbfld/200612/t20061225_165486.html (accessed on 16 March 2019).
- Hu, M.; Bergsdal, H.; van der Voet, E.; Huppes, G.; Muller, D.B. Dynamics of urban and rural housing stocks in China. Build. Res. Inf. 2010, 38, 301–317. [Google Scholar] [CrossRef]
- China Daily. Short-Lived Buildings Create Huge Waste. 2010. Available online: http://www.chinadaily.com.cn/china/2010-04/06/content_9687545.htm (accessed on 25 May 2018).
- Cai, W.; Wan, L.; Jiang, Y.; Wang, C.; Lin, L. Short-Lived Buildings in China: Impacts on Water, Energy, and Carbon Emissions. Environ. Sci. Technol. 2015, 49, 13921–13928. [Google Scholar] [CrossRef] [PubMed]
- U.S. Department of Energy. 2011 Buildings Energy Data Book. 2012. Available online: https://catalog.data.gov/dataset/buildings-energy-data-book (accessed on 16 June 2018).
- Hermann, A.; Deason, J.; Hobbs, A.; Novikova, A.; Yang, X.; Shengyuan, Z. Buildings Energy Efficiency in China, Germany, and the United States. 2013. Available online: http://climatepolicyinitiative.org/wp-content/uploads/2013/04/Buildings-Energy-Efficiency-in-China-Germany-and-the-United-States.pdf (accessed on 10 November 2017).
- Yang, W.; Kohler, N. Simulation of the evolution of the Chinese building and infrastructure stock. Build. Res. Inf. 2008, 36, 1–19. [Google Scholar] [CrossRef]
- Fawley, B.W.; Wen, Y. The Great Chinese Housing Boom, Econ. Synopses. 2013. Available online: http://research.stlouisfed.org/publications/es/article/9774 (accessed on 24 May 2017).
- IEA. Transition to Sustainable Buildings—Strategies and Opportunities to 2050; OECD Publishing: Paris, France, 2013. [Google Scholar] [CrossRef]
- Chalmers, P. Climate Change: Implications for Buildings. Key Findings from the Intergovernmental Panel on Climate Change Fifth Assessment Report. 2014. Available online: http://www.cisl.cam.ac.uk/business-action/low-carbon-transformation/ipcc-climate-science-business-briefings/pdfs/briefings/IPCC_AR5__Implications_for_Buildings__Briefing__WEB_EN.pdf (accessed on 16 August 2017).
- Thomas, S. Energy Efficiency Policies for Buildings. 2015. Available online: http://www.bigee.net/media/filer_public/2015/02/06/bigee_broschuere_energy_efficiency_policy_in_buildings.pdf (accessed on 16 August 2017).
- IPCC. Buildings. In Climate Change 2014: Mitigation of Climate Change. Contribution of Working Group III to the Fifth Assessment Report of the Intergovernmental Panel on Climate Change; 2014; Available online: https://www.ipcc.ch/pdf/assessment-report/ar5/wg3/ipcc_wg3_ar5_chapter9.pdf (accessed on 13 July 2017).
- Institution of Civil Engineers. Embodied Energy and Carbon. 2015. Available online: https://www.ice.org.uk/knowledge-and-resources/briefing-sheet/embodied-energy-and-carbon (accessed on 20 July 2018).
- Lin, L.; Jiang, Y.; Yan, D.; Chen, P. Analysis on building construction energy consumption and CO2 emission in China. China Energy 2015, 37, 5–10. (In Chinese) [Google Scholar]
- Pomponi, F.; Moncaster, A. Scrutinising embodied carbon in buildings: The next performance gap made manifest. Renew. Sustain. Energy Rev. 2018, 81, 2431–2442. [Google Scholar] [CrossRef] [Green Version]
- Urge-Vorsatz, D.; Petrichenko, K.; Antal, M.; Staniec, M.; Labelle, M.; Ozden, E.; Labzina, E. Best Practice Policies for Low Energy and Carbon Buildings: A Scenario Analysis. 2012. Available online: http://www.gbpn.org/sites/default/files/08.CEU Technical Report copy_0.pdf (accessed on 27 July 2017).
- Hu, M.; Pauliuk, S.; Wang, T.; Huppes, G.; van der Voet, E.; Müller, D.B. Iron and steel in Chinese residential buildings: A dynamic analysis. Resour. Conserv. Recycl. 2010, 54, 591–600. [Google Scholar] [CrossRef]
- Hu, M.; van der Voet, E.; Huppes, G. Dynamic Material Flow Analysis for Strategic Construction and Demolition Waste Management in Beijing. J. Ind. Ecol. 2010, 14, 440–456. [Google Scholar] [CrossRef]
- Huang, T.; Shi, F.; Tanikawa, H.; Fei, J.; Han, J. Materials demand and environmental impact of buildings construction and demolition in China based on dynamic material flow analysis. Resour. Conserv. Recycl. 2013, 72, 91–101. [Google Scholar] [CrossRef]
- Hong, L.; Zhou, N.; Feng, W.; Khanna, N.; Fridley, D.; Zhao, Y.; Sandholt, K. Building stock dynamics and its impacts on materials and energy demand in China. Energy Policy 2016, 94, 47–55. [Google Scholar] [CrossRef]
- Shi, J.; Chen, W.; Yin, X. Modelling building’s decarbonization with application of China TIMES model. Appl. Energy 2016, 162, 1303–1312. [Google Scholar] [CrossRef]
- Zhou, N.; Fridley, D.; McNeil, M.; Zheng, N.; Ke, J.; Levine, M. China’s Energy and Carbon Emissions Outlook to 2050. 2011. Available online: https://china.lbl.gov/sites/all/files/lbl-4472e-energy-2050april-2011.pdf (accessed on 7 August 2018).
- Fridley, D.; Zheng, N.; Zhou, N.; Ke, J.; Hasanbeigi, A.; Price, L. China Energy and Emissions Paths to 2030, 2nd ed.; 2012. Available online: http://eta-publications.lbl.gov/sites/default/files/lbl-4866e-rite-modelaugust2012.pdf (accessed on 11 November 2018).
- Zhou, N.; Fridley, D.; Khanna, N.Z.; Ke, J.; McNeil, M.; Levine, M. China’s energy and emissions outlook to 2050: Perspectives from bottom-up energy end-use model. Energy Policy 2013, 53, 51–62. [Google Scholar] [CrossRef]
- McNeil, M.A.; Feng, W.; Can, S.d.d.; Khanna, N.Z.; Ke, J.; Zhou, N. Energy efficiency outlook in China’s urban buildings sector through 2030. Energy Policy 2016, 97, 532–539. [Google Scholar] [CrossRef]
- Yu, S.; Eom, J.; Evans, M.; Clarke, L. A long-term, integrated impact assessment of alternative building energy code scenarios in China. Energy Policy 2014, 67, 626–639. [Google Scholar] [CrossRef]
- Eom, J.; Clarke, L.; Kim, S.H.; Kyle, P.; Patel, P. China’s building energy demand: Long-term implications from a detailed assessment. Energy 2012, 46, 405–419. [Google Scholar] [CrossRef]
- Delmastro, C.; Lavagno, E.; Mutani, G. Chinese residential energy demand: Scenarios to 2030 and policies implication. Energy Build. 2015, 89, 49–60. [Google Scholar] [CrossRef]
- Yang, T.; Pan, Y.; Yang, Y.; Lin, M.; Qin, B.; Xu, P.; Huang, Z. CO2 emissions in China’s building sector through 2050: A scenario analysis based on a bottom-up model. Energy 2017, 128, 208–223. [Google Scholar] [CrossRef]
- Shen, X. Has the per Capita Urban Residential Floor Area in China Exceeded 32 m2? The Biggest Lie of Chinese Livelihood, Tencent Housing. 2013. Available online: https://house.qq.com/bside/31.htm (accessed on 22 May 2019).
- Liang, W. Is the Per Capita Urban Residential Floor Area in China 33 m2 or 18 m2? 2014. Available online: http://www.cssn.cn/preview/zt/19364/19369/201403/t20140313_1027648.shtml (accessed on 22 May 2019).
- Ren, Z.; Xiong, C.; Bai, X. Urban Housing in China: Surplus or shortage? 2019. Available online: http://m.zqrb.cn/house/hangyedongtai/2019-02-18/A1550447505753.html (accessed on 22 May 2019).
- Li, X.; Xu, D. Clarification of misled statistic data: Overestimated per-capita housing area. China Econ. J. 2013, 6, 134–151. [Google Scholar] [CrossRef]
- THUBERC. 2017 Annual Report on China Building Energy Efficiency; China Architecture & Building Press: Beijing, China, 2017. [Google Scholar]
- Sterman, J.D. Business Dynamics: Systems Thinking and Modelling for a Complex World; Irwin McGraw-Hill: Boston, MA, USA, 2000. [Google Scholar]
- Richardson, G.P. System Dynamics. In Encyclopedia of Operations Research and Management Science; Springer Science & Business Media B.V.: New York, NY, USA, 2001; pp. 807–810. [Google Scholar]
- Shepherd, S.; Emberger, G. Introduction to the special issue: System dynamics and transportation. Syst. Dyn. Rev. 2010, 26, 193–194. [Google Scholar] [CrossRef]
- Ventana Systems Inc. Vensim Software. 2019. Available online: https://vensim.com/vensim-software/ (accessed on 19 January 2019).
- R Core Team. R: A Language and Environment for Statistical Computing; R Core Team: Vienna, Austria, 2019. [Google Scholar]
- Allison, P. Survival Analysis Using SAS: A Practical Guide; SAS Institute: Cary, NC, USA, 2010. [Google Scholar]
- Liu, X. Survival Analysis: Models and Applications; Wiley: Hoboken, NJ, USA, 2012. [Google Scholar] [CrossRef]
- Miatto, A.; Schandl, H.; Tanikawa, H. How important are realistic building lifespan assumptions for material stock and demolition waste accounts? Resour. Conserv. Recycl. 2017, 122, 143–154. [Google Scholar] [CrossRef]
- OECD. Measuring Capital: OECD Manual: Measurement of Capital Stocks, Consumption of Fixed Capital and Capital Services. 2001. Available online: https://www.oecd.org/std/na/1876369.pdf (accessed on 11 May 2017).
- OECD. Measuring Capital: OECD Manual 2009. 2009. Available online: https://www.oecd.org/std/productivity-stats/43734711.pdf (accessed on 11 May 2017).
- Johnstone, I.M. Energy and Mass Flows of Housing: Estimating Mortality. Build. Environ. 2001, 36, 43–51. [Google Scholar] [CrossRef]
- Bohne, R.A.; Brattebø, H.; Bergsdal, H.; Hovde, P.J. Estimation of the Service Life of Residential Buildings, and Building Components, in Norway. In Proceedings of the City Surface of Tomorrow Conference, Vienna, Austria, 8–9 June 2006; pp. 29–33. Available online: https://www.academia.edu/27632589/Estimation_of_the_Service_Life_of_Residential_Buildings_and_Building_Components_in_Norway (accessed on 12 October 2018).
- Müller, D.B. Stock dynamics for forecasting material flows—Case study for housing in The Netherlands. Ecol. Econ. 2006, 59, 142–156. [Google Scholar] [CrossRef]
- Aksözen, M.; Hassler, U.; Rivallain, M.; Kohler, N. Mortality analysis of an urban building stock. Build. Res. Inf. 2016, 45, 1–19. [Google Scholar] [CrossRef]
- Forbes, C.; Evans, M.; Hastings, N.; Peacock, B. Statistical Distributions, 4th ed.; John Wiley & Sons, Inc.: Hoboken, NJ, USA, 2011. [Google Scholar]
- McLaren, C.; Stapenhurst, C. ONS Methodology Working Paper Series No 3: A Note on Distributions Used When Calculating Estimates of Consumption of Fixed Capital. 2015. Available online: http://webarchive.nationalarchives.gov.uk/20160111030849/http://www.ons.gov.uk/ons/guide-method/method-quality/specific/gss-methodology-series/ons-working-paper-series/index.html (accessed on 31 March 2018).
- Rinne, H. The Weibull Distribution: A Handbook; Chapman and Hall/CRC: Boca Raton, FL, USA, 2008. [Google Scholar] [CrossRef]
- Palisade. Risk Analysis and Simulation Add-In for Microsoft® Excel. 2016. Available online: https://www.palisade.com/downloads/documentation/75/EN/RISK7_EN.pdf (accessed on 31 March 2018).
- Zaiontz, C. Weibull Distribution. 2018. Available online: http://www.real-statistics.com/other-key-distributions/weibull-distribution/ (accessed on 31 March 2018).
- Liu, H.; Yang, F.; Xu, Y. Analysis on urban housing in China based on 2010 population census. J. Tsinghua Univ. Philos. Soc. Sci. 2013, 6, 138–147. (In Chinese) [Google Scholar]
- THUBERC. 2012 Annual Report on China Building Energy Efficiency; China Architecture & Building Press: Beijing, China, 2012. [Google Scholar]
- THUBERC. 2019 Annual Report on China Building Energy Efficiency; China Architecture & Building Press: Beijing, China, 2019. [Google Scholar]
Figure 1.
Basic mechanism of a simple aging chain.

Figure 2.
Aging chain with explicit modelling of sub-stock specific demolition.

Figure 3.
Aging chain structure in the model.

Figure 4.
Dynamics of the building aging process.

Figure 5.
Weibull distributions calibrated using historical data: (a) PDF; (b) CDF; (c) Hazard Rate.
Figure 5.
Weibull distributions calibrated using historical data: (a) PDF; (b) CDF; (c) Hazard Rate.

Figure 6.
Comparison of residential stock size between this study and Tsinghua University Building Energy Research Centre (THUBERC) [72].
Figure 6.
Comparison of residential stock size between this study and Tsinghua University Building Energy Research Centre (THUBERC) [72].

Figure 7.
Aging process of age-specific residential building sub-stocks.


Table 1.
Weibull distribution. CDF: cumulative distribution function; PDF: probability density function.
Table 1.
Weibull distribution. CDF: cumulative distribution function; PDF: probability density function.
| CDF | |
| Survival function | |
| Hazard function |
© 2019 by the authors. Licensee MDPI, Basel, Switzerland. This article is an open access article distributed under the terms and conditions of the Creative Commons Attribution (CC BY) license (http://creativecommons.org/licenses/by/4.0/).
Share and Cite
MDPI and ACS Style
Zhou, W.; Moncaster, A.; Reiner, D.M.; Guthrie, P. Estimating Lifetimes and Stock Turnover Dynamics of Urban Residential Buildings in China. Sustainability 2019, 11, 3720. https://doi.org/10.3390/su11133720
AMA Style
Zhou W, Moncaster A, Reiner DM, Guthrie P. Estimating Lifetimes and Stock Turnover Dynamics of Urban Residential Buildings in China. Sustainability. 2019; 11(13):3720. https://doi.org/10.3390/su11133720
Chicago/Turabian StyleZhou, Wei, Alice Moncaster, David M Reiner, and Peter Guthrie. 2019. "Estimating Lifetimes and Stock Turnover Dynamics of Urban Residential Buildings in China" Sustainability 11, no. 13: 3720. https://doi.org/10.3390/su11133720
Note that from the first issue of 2016, this journal uses article numbers instead of page numbers. See further details here.