Abstract
In relation to organizational performance measurement, there is a growing concern about the creation of value for people, society and the environment. The traditional corporate reporting does not adequately satisfy the information needs of stakeholders for assessing an organization’s past and future potential performance. Practitioners and scholars have developed new non-financial reporting frameworks from a social and environmental perspective, giving birth to the field of Integrated Reporting (IR). The Economy for the Common Good (ECG) model and its tools to facilitate sustainability management and reporting can provide a framework to do it. The present study depicts the theoretical foundations from the business administration field research on which the ECG model relies. Moreover, this paper is the first one that empirically validates such measurement scales by applying of Exploratory Factor Analysis on a sample of 206 European firms. Results show that two out of five dimensions are appropriately defined, along with some guidelines to refine the model. Consequently, it allows knowledge to advance as it assesses the measurement scales’ statistical validity and reliability. However, as this is the first quantitative-driven research on the ECG model, the authors’ future research will confirm the present results by means of Confirmatory Factor Analysis (CFA).
1. Introduction
The Brundtland Commission defined sustainable development as the one that meets the needs of the present without compromising the ability of future generations to meet their own needs [1].
With corporate sustainability (CS) as the business approach that deals with sustainable development, in the last 20 years, a number of scholars have provided different definitions of the subject. All of these definitions of CS point to the need to integrate economic, social and environmental aspects in ordinary firms’ management [2,3,4]. Therefore, business practice should operationalize social and environmental sustainability. To do so, organizations have to implement management instruments, concepts and systems, i.e., sustainability management tools [5].
On the other hand, in terms of an organizational performance measurement, one can realize how there is a growing concern on the creation of value for people, society and the environment. Thus, challenging the traditional financial business reporting model. According to Flower [6], traditional corporate reporting does not adequately satisfy the information needs of stakeholders for assessing an organization’s past and future potential performance. As a consequence, practitioners and scholars have developed new non-financial reporting frameworks from a social and environmental perspective. This way, giving birth to the field of Integrated Reporting (IR), Dumay et al. [7] provide a structured literature review of the field of IR from its starting point up to date.
In accordance with the above mentioned, for authors, it could be useful for the organizations to integrate sustainability management and reporting in one tool to facilitate the implementation and control of sustainability management. The Economy for the Common Good (ECG) model and its tools facilitate sustainability management and reporting; The Common Good matrix (CGM) and the Common Good Balance Sheet (CGBS) can provide a framework [8,9].
Following the triple bottom line approach [10], Felber [11,12] proposes an alternative model: the ECG model, of which the purpose is to achieve full respect for human rights-related fundamental values within companies worldwide and, thus, a more employee-centered viewpoint of firms based on cooperation and the prosecution of general interest; hence, shedding light on the need to balance economic, social and environmental outcomes. The ECG model has as main goals the business contribution to the common good and cooperation instead of profit spirit and competition. From this point of view, economic growth and money are not goals by themselves; instead, they are considered means to achieve human welfare and quality of life for people [13]. The ECG model values are, essentially, the universal and basic principles of human rights: human dignity, solidarity and social justice, ecological sustainability and democratic participation and transparency.
The ECG model employs the CGM as the tool to guide and measure the contribution of the business to the common good [13]. In short, the CGM is the framework that the ECG model proposes to make compatible the creation of economic, social and environmental value and to measure the ability of the businesses to integrate the different types of value in their business model. This way, we argue that the CGM can be considered as a tool to lever business models based on corporate sustainability.
Furthermore, the CGM is the base to assess businesses in terms of their contribution to the common good, as it serves as the base to work out the CGBS. The CGBS is the tool that the ECG model proposes to measure business success in terms of economic, social and environmental impacts by means of scores, taking as a reference the stakeholders’ approach [14].
In the present work, the authors will perform a statistical validation of the metrics employed in the CGBS and the CGM to measure the organizations’ contribution to the common good in terms of their ability to create different types of value: 1. Human dignity; 2. Solidarity and social justice; 3. Environmental sustainability; and 4. Transparency and Co-determination.
To do so, the authors employed a quantitative approach. Thus, authors tested the CGBS and the CGM measurement instruments by means of exploratory factor analysis (EFA) based on principal component analysis (PCA).
From an overall population of 400 European firms that implemented the ECG model by applying the CGM and producing the CGBS (being all these CGBS audited), the authors got a sample of 206 European firms from Germany, Austria, Switzerland, Italy and Spain. The data-gathering took place through an online survey during the first quarter of 2018.
This way, the authors validated the measurement instruments employed in the CGBS and the CGM. Therefore, they concluded that the CGBS resulted in an adequate tool to capture non-financial value creation.
The ECG model provides an alternative framework to implement CS management and reporting in an integrated way. Hence, it can contribute to overcoming critics on IR limitations [14].
The current study is the first one that has empirically validated by means of quantitative methods (EFA) the metrics employed in the CGBS and the CGM; consequently, it allows knowledge to advance as it checks their statistical validity and reliability. This way, this paper contributes by shedding light on the different theoretical foundations tied to the business administration field research that have served to ground the ECG model and, at the same time, by means of the statistical validation of the measurement scales of the model it provides an assessment that can serve as a basis to refine a model that is currently in operation in a number of firms worldwide (mainly in Europe). Consequently, the results we got are relevant to scholars and practitioners.
Hence, the objectives of the present paper are: (1) review the different approaches that constitute the theoretical ground of the ECG model and its implementation-control tools, (2) assess whether the measurement scales proposed in the CGBS are adequate metrics to capture non-financials by integrating measures of social and environmental value creation for the key stakeholders, that is following a holistic value concept, and (3) provide guidelines to refine the measurement scales.
2. Theoretical Framework
The ECG model [13] provides an organizational behavior model that can be translated into a set of interrelated management-control tools. Such model can be adopted by whatever type of organization: from the public or private sector, for profit or not for profit organizations. Thus, in the eyes of the ECG model, maximizing profit is not the last purpose of a firm; instead, profit becomes a means through which firms can create different types of value to contribute to the common good.
The fact of considering profit as a means to achieve the common good may involve the classification of the ECG as both a social and entrepreneurial innovation process. This way, the ECG allows to solve social needs and, at the same time, to create new social relations and reinforce economic value creation [15].
On the other hand, scholarship has deeply analyzed the factors that drive businesses to succeed or fail. To do so, academia has produced several theoretical and empirical works that set up a number of theories and approaches in the field of business administration. However, up to date, there are no studies focused on the firms that operate under the ECG model. Despite this, some approaches and theories developed in the business administration field to explain how firms can achieve superior economic and financial performance to their rivals can be redefined to analyze the ECG firms’ behavior [9,16,17].
One of the first changes that one can appreciate when analyzing the ECG model is the one in the goals hierarchy, a consequence of the prevalence of common good over profitability. According to Aristotle, this order of things is the expression of a true “oikonomia”, whereas the prevalence of profit over the common good as its opposite: “chrematistiké” [18]. Defining the common good as the (old and) new bottom line of economic activities requires a new approach to measure a business way to success. The CGM and the CGBS are the tools that allow to manage, measure and monitor the firm’s behavior in terms of social and environmental concerns in an integrative way. Thus, they involve feedforward, concurrent and feedback control. Consequently, the CGM and the CGBS complement the information provided by the financial Balance-sheet and the income statement of a firm and help to implement sustainable business models. This way they make possible to manage and monitor the firm’s behavior in terms of sustainability based on the intersection of the three dimensions: economic, social and environmental. Therefore, we can conclude that by putting the ECG model into practice allows the co-creation of economic, social and environmental value and, thus, it is aligned with the CSR approach. In the following sub-sections, we show the different approaches from which the ECG model derives and point the main contributions that ECG provides over those approaches. The reader must keep in mind that the ECG model tries to integrate and improve previous approaches by advancing on pre-existing knowledge.
2.1. Stakeholders Theory and ECG Model
The Stakeholders theory [14,19,20,21,22] holds that those who can influence or be influenced by the actions of an enterprise (groups or individuals) must be considered as an essential part of business strategy. Such theory has been taken as a base to develop other topics as for example CSR [23,24] or in the framework of corporate politics, that is, the attempts to influence political institutions and/or political actors in favor of the business interests [25]. Hence, this theory places stakeholders in the core of business attention but does not refer to how to manage them [26,27].
The extant literature advocates for IR to take into consideration stakeholders’ opinion and allow their participation in the process. The implication of stakeholders in the process of producing an IR is key to ensure the implementation of sustainability management, because this way the organizations can identify the key social and environmental concerns on which they can work to enhance their positive impacts and minimize the negative ones [28,29].
Thus, Bellantuono et al. [28] point to the current non-existence of specifications on how to get the active participation of stakeholders. According to them, the research body on quantitative-based techniques to lever stakeholders’ participation and management is still scarce. In this sense, the ECG model can provide a framework to facilitate sustainable-driven stakeholders’ management. To do so, it takes qualitative variables related to business sustainability and stakeholders as a reference and turns them into scores.
In the ECG model, organizations employ the CGM to work out the CGBS. Through this matrix the ECG model measures the degree of relation between the business activities that the organization holds with its different stakeholders (suppliers, owners, equity and financial service providers, employees, customers and business partners and social environment) in terms of the human and ethical values measured in the model (human dignity, solidarity, and social justice, environmental sustainability and transparency and co-determination). Therefore, we can affirm that the CGM and the CGBS are tools that allow to manage and measure the business relationships with its stakeholders taking as a basis the human and ethical values. Furthermore, the ECG model also incorporates a multi-stakeholders approach [30] which considers that the business creation of value should be spread among the different stakeholders (internal and external to the organization).
However, we hold that the ECG model goes beyond the stakeholders’ management as the business last purpose is its contribution to the common good [31]. Being this contribution measured as its contribution to human dignity, solidarity, social justice, environmental sustainability and transparency and co-determination in relation to the business stakeholders. By specifically considering the business stakeholders (grouping them into five categories), the CGM allows to identify weaknesses in regards of every one of the stakeholders’ management and, thus, pointing out the areas that can be improved.
2.2. Shared Value Approach and ECG Model
Porter and Kramer [32] (p. 6), defined shared value (SHV) as “… policies and operating practices that enhance the competitiveness of a company while simultaneously advancing the economic and social conditions in the communities in which it operates. Shared value creation focuses on identifying and expanding the connections between societal and economic progress …”
Hence, the underlying idea is that firms can simultaneously create economic, social and environmental value (i.e., customer’s welfare, natural resources over-exploitation, key suppliers’ sustainability and/or disadvantage situation of local communities in which the company operates) [33]. By all what has been pointed before, Porter and Kramer [34] pointed to SHV to be a concept that goes beyond Corporate Social Responsibility (CSR). According to them, CSR conceives social value creation as somewhat peripheral and, always subordinate to economic value creation, in the firm’s strategy. In this sense, for them, CSR policies are the consequence of the firm’s search for social legitimacy, thus, maximizing short-term profits [32].
Therefore, by means of SHV, they redefine capitalism borders as the focus on a different aspect to lever the businesses’ competitive capacity [35]: i.e., reconceiving products and markets, redefining productivity in the value chain and developing local clusters. According to them, reconceiving products and markets consists of identifying the new needs of societies in fields of healthcare, housing, environment, etc., generating innovating products to fulfill those needs co-creating value for the environment, society and businesses. On the other hand, by means of redefining productivity in the value chain, i.e., reconfiguring the activities of the value chain from the perspective of the SHV, businesses enhance the use of resources, logistics, energy and employees’ productivity, thus minimizing resource waste. In addition, local clusters development allows the implementations of improvements in different business areas by means of cooperation with local businesses (suppliers, customers, competitors) and also with different types of local institutions (business associations, local bodies, etc.).
However, a strategy based on SHV is a bet for the long term as their outcomes can involve longer time period and higher initial investment “… higher return and broader strategic benefits to all the participants …” [32] (p. 4).
As in the case of the ECG model, such approach confers an important role to market transparency, as well as to cooperation as an essential condition to create SHV (i.e., cooperation between the firm and its supply chain) [36,37]. However, unlike the ECG model, SHV model does not advocate for replacing competition with cooperation.
Another key difference between both models is the role they give to business’ profits. In the case of SHV, the underlying idea consists of the simultaneous co-creation of social (in a broad sense which includes environmental) and economic value. Therefore, SHV considers social and economic value creation as goals at the same level. In this sense, the SHV model provides full legitimacy to business growth as a strategic goal. Conversely, the ECG model considers business’ profits and economic value creation merely as a means that allows businesses to contribute to the common good. That is, as a mean to generate social and environmental value.
Despite these differences, the underlying logic proposed by Porter and Kramer [32] about how to create SHV can lever the future development of the ECG model [38,39]. Some of the actions that drive to SHV creation are also a way to integrate the ECG values into business behavior: human dignity, solidarity, social justice, environmental sustainability, transparency and co-determination.
However, we must take into consideration that SHV approach does not include business’ ethical values; instead, such issues are relegated to a second term [40]. For that reason, according to the SHV approach, businesses can co-create social and economic value, but such approach will not guarantee business’ legitimacy because it does not guarantee that businesses assume full responsibility for their actions [41,42].
2.3. Triple Bottom Line and ECG Model
The Triple Bottom Line (TBL) has its origins in Carroll’s pyramid [43,44,45]. Thus, Carroll’s pyramid points to the existence of four types of CSR: economic responsibilities (be profitable), located at the base, on a second level, there are the legal responsibilities (obey the law as society’s classification of what is right or wrong), on a third level, we find ethical responsibilities (be ethical, obligation to do what is right, just and fair and avoid harm), finally, on the top of the pyramid, we find philanthropic responsibilities (be a good corporate citizen, contribute resources to the community, improve quality of life). The ECG framework tries to operationalize the concerns related to ethical and philanthropic responsibilities of the firms, i.e., those voluntary adopted by the firms [46,47].
Following Elkington [10] (p.3), “the sustainable development is compromised with economic prosperity, environmental quality, and social justice”. Thus, it takes into consideration three different lines: society, economy and environment. Society depends on the economy and this, in turns, depends on the global eco-system whose health is represented as the third line of the TBL. Society should be viewed in terms of its relations with economy and eco-system, giving birth to a set of relationships among the three lines [48,49].
The TBL model employs a matrix to measure in a quantitative way the impact generated by the organization from an economic, social and environmental point of view [50]. Such three dimensions are neither static nor stable; on the contrary, they are viewed from a dynamic perspective due to the consideration of the organizational environment in the model. Thus, every one of the lines acts as a continental platform which can move independently from the others. So that it can be placed above, below or beside the others; this involves the possible existence of frictions among them [51,52].
Notwithstanding the above mentioned, the matrix relates the three basic dimensions (economy, society and environment) with the organization’s stakeholders (shareholders, franchisees and/or subsidiaries, employees, customers, competitors, local communities, humanity, future generations and the natural world or eco-system).
The model has succeeded in the last years as it has served to design and implement CSR policies. It is possible to explain its growth by two reasons: (1) the three dimensions of the model are easy to understand and integrate within the organization goals due to its simple formulation; (2) is the approach employed by the Global Reporting Initiative (GRI) to write the guides that serve as a basis to produce sustainability reports, being the GRI guides the most known and employed at global level.
The TBL has been applied to both the public and private sector, i.e., for profit and not for profit organizations [53]. However, as pointed by Elkington [54], the TBL is not exempt from critics. Recently, he stated that “the Triple Bottom Line has clearly failed to bury the single bottom line paradigm” [55]. Gary and Milne [56], point to the fact that in case of exchange among the three different types of final outcomes, it is the financial outcome the one that becomes more important over social and environmental outcomes. Thus, in practice, social and environmental outcomes are subordinate to businesses’ profitability. Likewise, McDonough and Braungart [57] criticize TBL for being a measure of “bottom line”. Therefore, TBL would be providing strategies to firms addressed to minimizing negative outcomes instead of levering the design of sustainable products and processes as a starting point for businesses, thus, preventing negative outcomes.
The TBL and the ECG model share the triple dimension as a basis to build up their sustainability. For us, the ECG model goes beyond the TBL in the sense that it takes into consideration not only the outcomes for the different stakeholders but also the path followed to get those outcomes. That is, it is not only what you got it is also how you got it what matters.
2.4. Corporate Sustainability, Integrated Reporting, and ECG Model
The concept of CS has its origins in the relationship between CSR and sustainability [58]. The Brundtland Commission [1] employed the concept for the first time in its report of 1987.
Despite the different points of view arisen around sustainability [59], all of them share the following traits: economic viability, full respect for the environment and be socially equitable [2,60].
Since 1987, the United Nations has held a number of summits and conferences from which several agreements on sustainability goals have been made. The last one has been the Summit of 2015 which set the seventeen sustainable development goals to be achieved in 2030: (1) no poverty, (2) zero hunger, (3) good health and well-being, (4) quality education, (5) gender equality, (6) clean water and sanitation, (7) affordable and clean energy, (8) decent work and economic growth, (9) industry, innovation and infrastructure, (10) reduced inequalities, (11) sustainable cities and communities, (12) responsible production and consumption, (13) climate action, (14) life below water, (15) life on land, (16) peace, justice and strong institutions and (17) partnerships for the goals.
From its part, the Dow Jones Sustainability Index (DJSI) defines CS as a business approach that pursues the long run creation of value for shareholders by means of taking advantage of opportunities and, at the same time, performing effective management of the inherent risks to economic, environmental and social development. Such definition goes beyond the mere concept of environmental sustainability, providing a strategic focus based on value creation [61] which differentiates it from CSR [62]. Despite it, DJSI does not take into consideration the creation of value for the rest of the stakeholders (only shareholders). This trait differentiates it from the ECG model.
Furthermore, the CS approach, as SHV approach, does not consider business’ ethical behavior or let this issue in a second term, which impedes the firm to take full responsibility for its actions and give a response to the legitimate stakeholders’ expectations [42]. Unlike the CS approach, the ECG model puts ethical behavior in the core of business management, placing it on the first level, which turns such an approach into somewhat global and integrative.
In the same way that economic performance can and must be measured, the same consideration is applicable to sustainability [63,64]. This goal can be achieved through a system of non-financial indicators to measure organizational performance and impact in terms of social and environmental concerns [65,66].
Until recently, firms did not have any legal duty of providing non-financial information. In this sense, in 2014 the European Directive 2014/95/UE included the duty of performing a non-financial statement (NFS) for large firms. Those with an overall Balance Sheet above 20 millions of € or a net revenue above 40 millions of €, of public interest, with their headquarters located at any country of the EU or listed on any of the EU stock market and with more than 500 employees by the end of the fiscal year. Such an NFS must include information related to (1) business model description (activities performed and essential information about how these activities are performed); (2) an explanation on policies and procedures (including environmental and social concerns, staff, human rights and corruption prevention); (3) the main risks related to the issues included in point 2 and how they can be associated with the firm’s core businesses; (4) key non-financial indicators (KPI), relevant to the firm’s core business. In case these indicators were not provided, indicate the reason/s why they were not applied.
In the present, the most extended non-financial reporting come from ‘Global Reporting Initiative’ (GRI), since 1999 [67]. GRI is a not-for-profit independent international organization based on network structure. In its activities participate thousands of professionals and organizations from a number of industries, communities and world regions (www.globalreporting.org). Up to July 2018, the version in force is G4 designed in 2013 and launched in 2014. From July 2018, a new version based on four interrelated modules (Universal, Economic, Environmental and Social) has substituted G4.
An important milestone in terms of corporate sustainability reporting happened in 2010 when the International Integrated Reporting Council (IIRC) developed a global integrated report (IR) for the first time. The purpose was to build up a set of corporate reporting rules internationally accepted and to overcome the existing problems of over-information, lack of clarity and reliability [68,69].
According to IIRC (www.integratedreporting.org), “an IR is a concise communication about how an organization’s strategy, governance, performance, and prospects, in the context of its external environment, lead to the creation of value in the short, medium and long-term”. In other words, IR contains the essentials about financial, social, environmental and corporate governance information by summarizing it in one report. Thus, such report becomes the firm’s main picture facing third parties [70]. Hence, IR goes beyond sustainability reporting being the natural next step [71,72]. In the present, we can observe an exponential growth in the number of reports included in the GRI database as “integrated” reports. They must include: (1) an overall vision on the organization and its environment (the organization’s scope, the legal, political, social and environmental issues that can affect the organization and its value creation); (2) governance (how the organization’s governance structure is and how it can lever the organization’s value creation in the short, medium and long-term); (3) business model (the organization’s recipe to create value); (4) risks and opportunities (specify the main risks and opportunities affecting the organization and how they can support the organization’s ability to create value); (5) strategy and resource allocation (what is the organization’s last purpose and how it will do it); (6) performance and strategic goals within the time frame; (7) perspectives (specify the organization’s main challenges and uncertainties to implement its strategy); (8) essential assumptions (determination of the relevant aspects to be reported and how they are quantified and evaluated).
It is important to note that GRI guides recommend, despite it is not mandatory, the verification of the IR (which includes non-financial information). Such verification should be in charge of an independent expert who has to produce his/her own conclusions on the reliability and adequacy of the information (compared with standard values). To perform this verification process, IIRC has developed a set of international rules and standards. Therefore, ensuring comparability and credibility to the stakeholders to whom the information is addressed. These standards are commonly known as “International Standards on Assurance Engagement” (ISAE). Among them, we point out: AA1000 APS and ISAE 3000. Sometimes both are combined as they show complementary traits.
Moreover, there are independent agencies capable of assessing any type of organization worldwide in terms of CS and IR. These agencies pick up the relevant information from different sources (public reports, the corporate website and others), later on, they contrast it by sending questionnaires to third parties (NGOs, consumers associations, environmental associations, unions). Once the information has been obtained and contrasted, the results are expressed in terms of measurable variables for every one of the analyzed dimensions. These results allow classifying the organizations involved in the assessment and their countries of origin. During the last years a number of sustainability agencies have proliferated at a global level (i.e., EIRIS, Sustainalytics, Oekom Research AG, MSCI ESG Research and RobecoSam Sustainability Investing). All these agencies work with the methodology known as Socially Responsible Investment (SRI), a process that takes into consideration social, environmental and corporate governance criteria to support the investment making decision process. Such a process consists of two phases: the first one is normalization (setting up and disseminating the principles of SRI) and the second one is screening or social rating (checking and certifying the firm accomplishment of SRI principles). By its part, MSCI ESG rates more than 3000 corporations in the USA according to three criteria: environmental (climate change and clean technologies, pollution, toxic wastes and recycling), social (investment in the community, diversity and equal opportunities at workplace, human rights and labor relations) and corporate governance. This rating also includes another component related to products and processes related to the exclusion of investment in products like the alcoholic ones, tobacco, betting houses, arms industry and nuclear industry. In this process, the above-mentioned criteria are classified as strengths or weaknesses and scored with 1 or 0 points [73]. In Europe, Vigeo-Eiris is the leader rating agency. It employs the Equitics® model, based on internationally recognized standards to assess to what point the firms take into consideration their goals in terms of CSR in their strategy definition and implementation. This model distributes scores in six dimensions: human rights, environment, corporate behavior, corporate governance and community participation [73].
From its part, the ECG model [13] takes many of the indicators employed by IR, adds other indicators and offers a global and integrative insight on businesses, but it tries to promote changes not only inside the businesses but also at the social level. In this sense, businesses are considered as a change lever, a force for good. However, the ECG model only considers social and environmental concerns and tries to improve the measurement of stakeholders’ management in terms of social and environmental concerns. This is because the ECG assumes that economic and financial reporting are currently well developed and grounded; thus, the gap exists in the fields of social and environmental outcomes measurement.
The ECG model employs the Common Good (CG) matrix as the tool to manage and measure the contribution of the business to the common good [13,16,17]. In short, the CGM is the framework that the ECG model proposes to make compatible the creation of economic, social and environmental value and to measure the ability of the businesses to integrate the different types of value in their business model. This way, we argue that the CGM can be considered as a tool to lever business models based on corporate sustainability.
Such a matrix relates the firm’s behavior in terms of the general principles and values of human rights, grouped into four categories (“human dignity”, “solidarity and social justice”, “environmental sustainability” and “transparency and co-determination”), to the stakeholders grouped into five categories (“suppliers”, “owners, equity and financial services providers”, “employees”, “customers and business partners” and “social environment”). Hence, the CGM employs as one of its bases the Stakeholders approach [14] to measure the business contribution to the common good.
Hereafter, we proceed to analyze such aspects for every one of the stakeholders considered in the CGM [74].
According to the ECG model, the relationship between the business and its suppliers should be based on the promotion of human dignity in the supply chain. In this sense, businesses have to be conscious of their responsibility for the value network in which they participate. Thus, the criteria to select suppliers are proper work conditions (wages and labor rights), environmental aspects (raw materials and sources of power employed), social effects on other groups and regional alternatives. The model proposes the prioritization of regional, green, social suppliers to avoid carbon print, the control of risks (i.e., pollution) related to products/services and the payment of fair prices in origin. From an entrepreneurial point of view, we conclude that the ECG model helps to lever local entrepreneurship due to the proximity criterion to select suppliers; this way, it contributes to the local economic development. Furthermore, given the prioritization of social criteria, it also creates opportunities for local social enterprises.
The ECG Business behavior in regards to its funding is based on ethical financial management. To do so, businesses prioritize operation with ethical banking and invest their surplus in ethical and environmentally sustainable projects. The matrix also advocates for strengthening self-funding and fostering the funding coming from commercial exchanges between businesses. Hence, we can conclude that The ECG model drives to the implementation of a private financial system based on ethical and social values.
On the other hand, the relationship between The ECG businesses and their employees is also based on ethical human resources management (HRM). HRM is one of the most valuated set of practices by the firms, as it drives to appropriate management of human capital, can create a good working environment and connects people and firms. This way, HRM must drive to ensure human dignity at the workplace through the creation of healthier working conditions based on freedom in the workplace and cooperation. The proposed criteria are workplace quality, equality, fair distribution of work loading, social, ethical and environmentally friendly behavior promotion among employees, fair distribution of the income generated and keeping internal democracy and transparency in the decision making process.
In relation to the business relationship with its customers and competitors, The ECG model advocates for fair sales management. The goal is to treat customers as business partners by putting into practice long-term relationships based on conscious consumerism and ethical buying practices. The CGM proposes as criteria: the use of social marketing practices, employee’s training in relation to fair commercial practices, employees’ compensation systems in relation to sales targets and customers’ participation in the business decisions related to the offer of ethical and green products/services. This way, The ECG model promotes conscious consumerism and business sustainability not only in the business that applies the model but also in its customers’ behavior. Heidbrink et al. [75], who have done qualitative research on the ECG model, pointed out that it has the potential to promote a post-growth economy as consumers are asked if they really need the product or service of a company.
Finally, the ECG model also proposes an ethically driven environmental management. In this sense, The ECG businesses define themselves as citizen organizations socially responsible with a strong commitment to the social environment in which they operate. To do so, the CGM proposes the following criteria: human needs satisfaction assessment, return a part of the profits to the local community, reduction of the effects on the environment at the minimum possible level, minimize dividends distribution and set up transparency and participation systems to ensure social co-determination and transparency.
Previously, there have been four versions of the CGM that have evolved into the 5.0 version in force since May 2017 after seven years of experience since the ECG model was launched. The 5.0 CGM can be consulted at www.ecogood.org/en/common-good-balance-sheet/common-good-matrix/.
From the application of the CGM dimensions and indicators, it is possible to produce the CGBS which is an integrated report that includes social and environmental information. Such report also includes improvement measures and can be verified as in the case of IR.
The verification process in the ECG model can be performed by means of a peer to peer procedure (similar to benchmarking) or by an external audit (approved auditors). There exists a support agency for the common good, which is in charge of auditors training, auditors approving, advisors training and advisors approving. Furthermore, this agency has set up a system to recognize businesses achievements when they perform the whole process. The term employed to perform the ranking of the firms is “seed”. Then, they qualify with one seed the businesses that have produced their CGBS, two seeds if the businesses also followed an audit peer to peer, and three seeds if the businesses produced their CGBS and also followed an external audit. Such agencies take the form of associations that operate at country and/or regional level. Currently, there are Associations for the promotion of the Economy for the Common Good in nine different European countries: Austria, Germany, Switzerland, Italy, Spain, France, Sweden, United Kingdom and The Netherlands. There exists another association in Chile.
Figure 1 below, summarizes the relationships of the ECG model and its implementation-control tools (the CGM and the CGBS) with the pre-existing models (TBL = Triple Bottom Line, CS & IR = Corporate Sustainability and Integrated Reporting, SHV = Shared Value and, Stakeholders’ Theory) to capture non-financials based on sustainability approach.
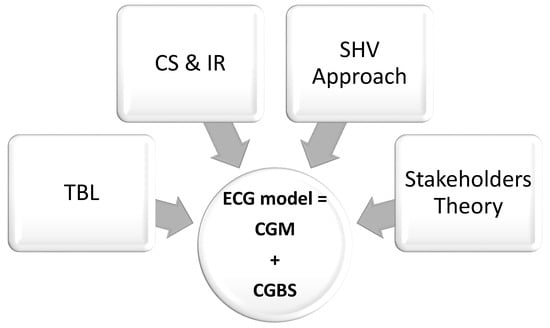
Figure 1.
The Economy for the Common Good (ECG) model’s origins.
3. Methodology
3.1. Data-Gathering and Sample Profile
To validate the metrics employed in the CGM and the CGBS, we designed a questionnaire to be distributed among the firms that have implemented the ECG model from 2011 to 2017 in Europe. Such questionnaire asked the firms about the scores they have obtained in the different items included in the CGM and reported in the CGBS. It also picked up information on the industry, age, country of origin, number of employees and turnover, with these variables treated as control variables for statistical purposes.
We distributed the questionnaire through an e-mail addressed to the firms’ managers during the first quarter of 2018. The e-mail contained a link that allowed the firms to fulfill the questionnaire on the online platform “Survey Monkey”; they could also upload their CGBS to the platform or send it by e-mail. This facilitated the data-gathering, as it enabled the researchers to download the data matrix directly from the online platform; then, they only had to type the scores of the firms that had opted for uploading their CGBS or sending them by e-mail.
The population comprised an overall of 400 European firms that had implemented the ECG model by producing and auditing a CGBS up to 31 December 2017. We identified the population through the database of the European Association for the promotion of the Economy for the Common Good that can be accessed at https://www.ecogood.org/en/community/.
We sent the questionnaire to the overall population and got an overall of 206 full and valid responses, that is, the sample comprised 51.50% of the population. Thus, 83.98% of the firms included in the sample operated in the tertiary sector, 11.17% in the secondary one and 2.43% in the primary sector. By size, 55.83% were micro-enterprises, 38.35% SME and 5.83% large enterprises. Five European countries concentrate most the sample of the ECG firms: Germany (39.8%), Austria (30.1%), Spain (19.4%), Italy (7.8%) and Switzerland (2.4%). The rest of the European countries accounted for 0.49% of the sample.
The firms can obtain a maximum score of 1000 points by applying the metrics included in the CGM and reported in the CGBS. The average score obtained by the firms was 497, the median was 498; which means that, according to the rating employed by the CGBS, most of them fall into the “experienced” level (between 301 and 600 points). Specifically, 67.96% of firms in the sample fall into the “experienced” level, 24.27% of the fall into the “exemplary” level (between 601 and 1000 points). None of them fall into the “beginner” level (between 1 and 100 points) and 7.77% of them fall into the “advanced” level (between 101 and 300 points).
3.2. Measures
As the last purpose of the current study is to statistically test and validate the measurement scales employed in the CGM and the CGBS, we took into consideration the dimensions and items included in the 5.0 version of the ECGM and the CGBS (the version currently in force).
Furthermore, given that the present study includes the European firms that have implemented the ECG model producing their CGM and CGBS from 2011 to 2017, we had to deal with five different versions of the CGM and the CGBS. Consequently, the first task to do was to homogenize the measures and transform them into the 5.0 version. To do so, we employed the conversion table elaborated by the ECG advisors that have been in charge of the development of the five versions of the model.
Table 1, below, depicts the dimensions and measures (items) that the CGM and the CGBS employ to measure the relationship of the firms with their stakeholders in terms of social and environmental concerns.

Table 1.
Dimensions and measurement scales of the CGM and CGBS.
3.3. Analysis Technique
To validate the metrics employed in the CGM and CGBS, we first assessed whether an underlying structure existed among the measurement instruments by means of exploratory factor analysis (EFA). Following Hair et al. [76], we found EFA to be an appropriate technique because it provides the tools for analyzing the structure of the interrelationships among a large number of variables by defining sets of variables (factors) that are highly correlated. Being factors assumed to represent dimensions within the data.
Moreover, as the general purpose of EFA is to find a way to summarize the information contained in a number of original variables (items) into a smaller set of new, composite dimensions (factors) with a minimum loss of information, that is, to search for and define the fundamental constructs or dimensions assumed to underlie the original variables [77,78]; therefore, EFA is suitable to check whether the structure revealed by the data set fits the structure proposed in the CGM and the CGBS.
Finally, we proceed to validate the results of EFA to assess their degree of generalizability. This issue is critical for the interdependence methods as EFA. Specifically, in our research, the generalizability of the results would involve the empirical demonstration that the CGM and the CGBS are adequate (valid) tools to capture non-financials concerns.
4. Findings
The starting point to apply any multivariate technique (this includes EFA) on a data set is to check whether the data set follows a normal distribution [79]. In our case, as pointed out in Section 3.1, the average score the firms got by applying the CGBS was 497 whilst the median of such score was 498. Thus, suggesting a normal distribution of the data. Furthermore, following Hair et al. [76], we also checked the statistic value (z) for the skewness and Kurtosis of the metrics (items) employed in the CGM and the CGBS, along with Shapiro-Wilks test of normality. Table 2 below depicts the items descriptive statistics.
Table 2.
Descriptive Statistics and Normality tests.
As we can observe in Table 2, the Z skewness and Z kurtosis values are closer to or under the conventional value of ± 2.00 [62]. Moreover, the Shapiro-Wilks test confirmed the normality of the data distribution. Therefore, EFA as a multivariate analysis technique will produce reliable results.
Thereafter, we ensured that the correlation matrix fulfills the assumptions to apply factor analysis. That is, that the data matrix had sufficient significant correlations to justify the application of factor analysis (the commonly accepted threshold is 0.30). Table 3 below shows the correlation matrix with the significant correlations at 0.01 level in bold and followed by a * sign. As we can see, most of the correlations among items were greater than 0.30 and significant at 0.01 level.
Table 3.
Partial correlations and Measures of Sample Adequacy.
In the bottom of Table 3, we can also find an overall measure of sample adequacy (Kaiser-Meyer-Olin, KMO) and the Barlett test of Sphericity. With regards to KMO, it ranges from 0 to 1. According to Kaiser [80,81], when KMO takes a value greater than 0.8, we are facing a meritorious level of sampling adequacy. KMO reached 0.846 in our case. Barlett test of Sphericity is also displayed at the bottom of Table 3; in our case, we can conclude that the correlation matrix had significant correlations among, at least, some of the items at 0.01 level. Therefore, we concluded that the data were suitable to apply factor analysis.
Then, we proceeded to apply component analysis. We did so because data reduction was our primary concern as our goal was to determine whether there are any latent variables among the CGBS items and because this is the first attempt to validate the metrics of the CGBS, we thought that the most appropriate choice was to consider the total variance as starting point. However, although considerable debate remains over which factor model is the most appropriate, empirical research demonstrated similar results in many instances. Both factor models arrive at similar results when the communalities exceed 0.60 for most items [82,83,84,85,86], as in our case.
Table 4 shows the results for the extraction of component factors for the full set of metrics employed in the CGBS. We decided to employ the VARIMAX method because it seems to give a clearer separation of the factors [76].
Table 4.
Results for the Extraction of Component Factor: Full set of items.
To determine the number of factors to extract, we combined the eigenvalues and the percentage of variance criteria. Thus, only factors having eigenvalues greater than 1 and accounting for at least 60% of the total variance extracted were retained. As we can observe in Table 4, according to the results, we got a five-factor solution which is consistent with the number of dimensions considered in the CGBS.
Thereafter, we examined the rotated component matrix to achieve simpler and theoretically more meaningful solutions.
Table 5, below, depicts the VARIMAX-rotated component analysis containing the full set of 20 items that are the metrics employed in the CGBS. For a clearer discussion of results, we have moved the tables depicting the intermediate steps solutions to the Appendix A section and only the final solution is included in the findings section.
Table 5.
VARIMAX-Rotated Component Analysis Factor Matrix: Reduced Sets of 17 items.
As we can observe, in the table (Table A1) factor loadings below 0.40 have not been displayed as those loadings were found no significant at 0.05 level given the sample size of 206 observations and a power level of 80% (computations made with GPower 3.1). Table 5 also shows a well-defined structure of factors 1 and 2 with loadings over 0.70 for the items A1, A2, A3 and A4 in relation to factor 1 and for the items B1, B2, B3 and B4 in relation to factor 2. The rest of the structure was not clear.
Moreover, in factor analysis, items must be unidimensional. That is, they must represent a single concept. Consequently, each factor should consist of a set of items loading highly on a single factor, meaning that each dimension should be reflected by a separate factor [87,88,89,90]. According to the results displayed in the table (Table A1), the items C3 and E3 were not unidimensional; thus, these items are candidates to be removed to ensure the items’ unidimensionality. Then, to assess the consistency to the entire scale, we proceeded to check the reliability statistics for the full set of 20 items which are depicted in Table A2.
As we can see in Table A2, the Cronbach’s Alpha of the full model reached 0.801 above the recommended threshold of 0.70 [76]. The Cronbach’s Alpha of the model if the items C3 and D3 were deleted stayed above such threshold. Therefore, we decided to remove both items (C3 and D3) and ran the factor analysis again with 18 items.
Table A3 depicts the VARIMAX-rotated component analysis matrix for the reduced set of 18 items. As we can observe, it also produced a five-factor solution capturing 77.280% of the Variance extracted by the factors. Factors 1 and 2 showed a well-defined structure coincident with the dimensions A (Suppliers Management) and B (Owners, Equity and Financial Service Providers Management) of the CGM and the CGBS.
However, in this case, we found D3 to show multi-dimensionality problems, as it cross-loaded on factors 1 and 5, and D4 not loading on any factor. Furthermore, some items showed communalities under the recommended threshold of 0.50. So, we decided to remove D3 and re-estimate the factor model with a reduced set of 17 items to test for comparability.
Table 5 shows the results of the VARIMAX-rotated component analysis matrix for the reduced set of 17 items. In this case, factor analysis revealed a structure of five factors even though the fifth-factor eigenvalue was slightly below 1. We decided to keep the five factors structure because the fifth one contributed to increasing the total variance extracted by 5.669. Thus, the five factors captured 78.701% of the variance of the overall 17 items.
Thereafter, we proceeded to analyze the factor structure revealed by means of analyzing the results of the factor analysis. Factor 1 is built upon the items A1, A2, A3 and A4, all of them with loadings over 0.90. Thus, revealing a well-defined structure in coincidence with the dimension A (Suppliers Management) of the CGM and the CGBS. So we labeled factor 1 as Suppliers Management (SPM). From its part, factor 2 is built upon the items B1, B2, B3 and B4, all of them with loadings over 0.90. Thus, revealing a well-defined structure in coincidence with the dimension B (Owners, Equity and Financial providers Management) of the CGM and the CGBS. Thus, we labeled factor 2 as Owners, Equity and Financial providers Management (OEFPM). On their part, factors 3, 4 and 5 show overlaps between the dimensions C (Employees), D (Customers and Business Partners) and E (Social Environment). Another important issue revealed by factor analysis with regards to stakeholders’ management in terms of environmental sustainability is that items C3, D3, and E3 had to be deleted to ensure the unidimensionality of the items. This finding involves that only SPM and OEFPM dimensions include measures of environmental sustainability in the final model.
In terms of communalities, in the final solution, all the items showed communalities above the threshold of 0.50, demonstrating their appropriateness.
To assess the degree of consistency of the entire scale (CGBS) we check the Chronbach’s Alpha of the 17 items model, which reached 0.767, thus confirming the overall model reliability.
Finally, we checked if the 17 items were statistically different from one another by means of ANOVA test. It tests for differences in means between the groups, as the significance level was lower than 0.05 we concluded that the means of the 17 items were significantly different. To complete the comparison of the mean, we performed a pairwise comparison of the means of the 17 items by means of a posthoc test. Table A4 shows the F statistics and the significance level corresponding to the comparison of the means of every pair of items. As we can see, the means of the 17 items are significantly different one from another and, consequently, they were measuring different concepts and we did not face any redundancy among items.
5. Discussion and Conclusions
The present paper aimed to depict the business administration approaches on which the ECG model relies. Through the previous sections, we proceeded to perform an analysis by comparison between every one of the approaches considered and the ECG model; this allowed us to frame it into the business administration field research and to point out the contribution that the ECG model has made.
Namely, we first related the ECG model to the stakeholders’ theory with which the model shares the need to put stakeholders at the core of the business management. However, the ECG model goes beyond stakeholders’ theory as, by means of the CGM, it provides guidance to align the stakeholders’ management with the full respect of human rights.
Thereafter, we also compared the ECG model to the shared value approach. Although the SHV approach advocated for the co-creation of economic, social and environmental value, the ECG considers social and environmental value creation (i.e., the contribution to the common good) as the last business purpose, thus giving priority to social and environmental concerns over profitability.
With the triple bottom line (TBL) approach, the ECG model shares the idea of measuring the three different types of value that businesses can create and the use of a matrix as a tool to manage and measure them. However, in contrast, the ECG puts social and environmental value over economic value, while the TBL works with three platforms that are interchangeable.
Finally, the ECG model is also related to corporate sustainability (CS) approach and integrating reporting (IR). The ECG model, when compared to the CS approach, also advocates for the balance among society, environment and economy, but unlike CS, it puts ethical behavior in the core of business management. In contrast, the ECG model employs a multi-stakeholders approach instead of shareholder approach. These traits make the ECG become a more complete model to manage sustainability at the business level.
Moreover, following the CS approach, IR has been developed and spread among numerous firms around the globe to measure organizational performance in terms of social and environmental impacts. In this sense, the ECG model by means of the CGBS provides the framework to measure social and environmental impacts using scores. In both cases, IR and CGBS can be verified. However, inasmuch as the CGBS also provides an improvement plan to the businesses, one can conclude that the ECG model contributes to the continuous improvement of corporate sustainability management. In short, the ECG model can become the next step in corporate sustainability since it completes the pre-existing models and this way it levers the development of sustainable business models.
The quantitative part of the study aimed to check whether the measures employed by the CGM and the CGBS were valid and reliable metrics. To do so, we applied EFA on a sample of 206 (out of 400) European firms that had produced and audited a CGBS since 2011.
The results of EFA revealed a five factors solution. Hence, we concluded that the dataset showed an underlining structure similar to the one depicted in the CGBS. However, in regards to the dimensions, only two of the five factors revealed by EFA coincided with the ones included in the CGBS (SPM coincided with A and OEFPM coincided with B).
On the other hand, the other three factors were built upon the overlap of different dimensions according to the design of the CGBS. For that reason, we would recommend merging some of the dimensions. Specifically, factor 3 included 4 items related to the management of employees and social environment in terms of solidarity and social justice and transparency and co-determination; factor 4 included 2 items measuring the management of employees and customers and business partners in terms of human dignity and, finally, factor 5 included 2 items related to the management of customers and business partners in terms of solidarity and social justice and transparency and co-determination in addition to one item related to the management of social environment in terms of human dignity. This indicated that the boundaries between the different stakeholder’s dimensions considered in the model are blurred, while the distinction between solidarity and transparency and co-determination are not clear. Thus, these dimensions could be considered as suitable to merge in a broader dimension.
According to the results of EFA, 3 out of 5 items aimed at the measurement of the dimensions C, D and E in terms of environmental sustainability had to be removed from the model. As a consequence, it would be suitable to develop new measures of the management of some stakeholders (C, D and E) in terms of environmental sustainability to be included in a new version of the CGBS. Therefore, the dimensions C, D and E must be re-defined and re-structured taking into account the results provided by means of EFA.
By the considerations made by the authors in regards to the measurement scales corresponding to the dimensions C, D and E of the model, we have provided some important guidelines on what dimensions and how should be redefined. This way, the present research can have some practical implications if our recommendations are taken into consideration to refine the model.
Finally, this study is based on EFA as it is the first one that tries to validate the CGBS as an adequate tool to capture non-financials. Future research should confirm these results by means of confirmatory factor analysis (CFA). Another interesting line for future research will be assessing whether significant differences in the scores exist by firms’ size, age, economic sector or home country.
Author Contributions
Conceptualization, C.F., V.C. and J.R.S.; methodology, V.C.; software, V.C.; validation, V.C., C.F. and J.R.S.; formal analysis, V.C.; investigation, J.R.S.; resources, J.R.S.; data curation, V.C.; writing—original draft preparation, V.C.; writing—review and editing, V.C.; visualization, J.R.S.; supervision, J.R.S.; project administration, V.C.; funding acquisition, J.R.S.
Funding
This research was funded by the Humanistic Management Practices gGmbH.
Conflicts of Interest
The authors declare no conflict of interest.
Appendix A
Table A1.
VARIMAX-Rotated Component Analysis Matrix: Full set of 20 items.
Table A1.
VARIMAX-Rotated Component Analysis Matrix: Full set of 20 items.
| Factor | ||||||
|---|---|---|---|---|---|---|
| 1 | 2 | 3 | 4 | 5 | Communality | |
| A1 | 0.923 | 0.965 | ||||
| A2 | 0.925 | 0.965 | ||||
| A3 | 0.916 | 0.945 | ||||
| A4 | 0.929 | 0.953 | ||||
| B1 | 0.916 | 0.921 | ||||
| B2 | 0.937 | 0.952 | ||||
| B3 | 0.889 | 0.854 | ||||
| B4 | 0.934 | 0.932 | ||||
| C1 | 0.668 | 0.498 | ||||
| C2 | 0.817 | 0.773 | ||||
| C3 | 0.463 | 0.461 | 0.484 | |||
| C4 | 0.774 | 0.627 | ||||
| D1 | 0.724 | 0.615 | ||||
| D2 | 0.732 | 0.682 | ||||
| D3 | 0.787 | 0.789 | ||||
| D4 | 0.430 | 0.353 | ||||
| E1 | 0.843 | 0.785 | ||||
| E2 | 0.839 | 0.712 | ||||
| E3 | 0.441 | 0.609 | 0.613 | |||
| E4 | 0.481 | 0.396 | ||||
Factor loadings less than 0.40 have not been printed.
Table A2.
Reliability Statistics. Full set of items (20).
Table A2.
Reliability Statistics. Full set of items (20).
| Squared Multiple Correlation | Cronbach’s Alpha if Item Deleted | |
|---|---|---|
| A1 | 0.989 | 0.788 |
| A2 | 0.989 | 0.791 |
| A3 | 0.959 | 0.799 |
| A4 | 0.963 | 0.799 |
| B1 | 0.919 | 0.800 |
| B2 | 0.955 | 0.799 |
| B3 | 0.851 | 0.801 |
| B4 | 0.940 | 0.800 |
| C1 | 0.330 | 0.792 |
| C2 | 0.588 | 0.782 |
| C3 | 0.519 | 0.796 |
| C4 | 0.463 | 0.789 |
| D1 | 0.381 | 0.792 |
| D2 | 0.486 | 0.782 |
| D3 | 0.591 | 0.784 |
| D4 | 0.367 | 0.791 |
| E1 | 0.474 | 0.789 |
| E2 | 0.489 | 0.795 |
| E3 | 0.512 | 0.788 |
| E4 | 0.379 | 0.790 |
| Chronbach’s Alpha (full set of items): 0.801 ANOVA test (full set of items): 473.787 (df.: 19; Significance: 0.000) | ||
Table A3.
VARIMAX-Rotated Component Analysis Matrix: Reduced Set of 18 items.
Table A3.
VARIMAX-Rotated Component Analysis Matrix: Reduced Set of 18 items.
| Factor | ||||||
|---|---|---|---|---|---|---|
| 1 | 2 | 3 | 4 | 5 | Communality | |
| A1 | 0.945 | 0.984 | ||||
| A2 | 0.948 | 0.982 | ||||
| A3 | 0.937 | 0.964 | ||||
| A4 | 0.947 | 0.971 | ||||
| B1 | 0.914 | 0.915 | ||||
| B2 | 0.938 | 0.953 | ||||
| B3 | 0.900 | 0.872 | ||||
| B4 | 0.942 | 0.949 | ||||
| C1 | 0.761 | 0.638 | ||||
| C2 | 0.831 | 0.776 | ||||
| C4 | 0.765 | 0.614 | ||||
| D1 | 0.745 | 0.644 | ||||
| D2 | 0.657 | 0.654 | ||||
| D3 | 0.417 | 0.770 | 0.790 | |||
| D4 | 0.270 | |||||
| E1 | 0.879 | 0.838 | ||||
| E2 | 0.841 | 0.716 | ||||
| E4 | 0.489 | 0.383 | ||||
| Total | ||||||
| Eigenvalue | 6.830 | 2.435 | 2.269 | 1.308 | 1.050 | 13.892 |
| % of Variance | 37.946 | 13.629 | 12.608 | 7.266 | 5.831 | 77.280 |
Factor loadings less than 0.40 have not been printed.
Table A4.
Means pairwise comparison, Anova Post-hoc test.
Table A4.
Means pairwise comparison, Anova Post-hoc test.
| A1 | A2 | A3 | A4 | B1 | B2 | B3 | B4 | C1 | C2 | C4 | D1 | D2 | D4 | E1 | E2 | |
|---|---|---|---|---|---|---|---|---|---|---|---|---|---|---|---|---|
| A2 | 915.97 (0.000) | |||||||||||||||
| A3 | 305.52 (0.000) | 347.46 (0.000) | ||||||||||||||
| A4 | 417.26 (0.000) | 463.39 (0.000) | 361.35 (0.000) | |||||||||||||
| B1 | 4.531 (0.000) | 3.961 (0.000) | 5.052 (0.000) | 5.045 (0.000) | ||||||||||||
| B2 | 4.945 (0.000) | 4.619 (0.000) | 4.593 (0.000) | 4.863 (0.000) | 239.09 (0.000) | |||||||||||
| B3 | 8.808 (0.000) | 7.766 (0.000) | 7.159 (0.000) | 7.774 (0.000) | 73.763 (0.000) | 101.15 (0.000) | ||||||||||
| B4 | 5.559 (0.000) | 5.015 (0.000) | 5.228 (0.000) | 5.464 (0.000) | 94.132 (0.000) | 243.10 (0.000) | 180.60 (0.000) | |||||||||
| C1 | 1.590 (0.011) | 1.502 (0.017) | 1.791 (0.004) | 1.878 (0.002) | 2.302 (0.000) | 2.429 (0.000) | 1.832 (0.002) | 1.726 (0.003) | ||||||||
| C2 | 1.657 (0.006) | 1.521 (0.016) | 1.544 (0.011) | 1.654 (0.006) | 1.724 (0.003) | 1.870 (0.001) | 1.643 (0.007) | 1.704 (0.004) | 1.888 (0.001) | |||||||
| C4 | 1.710 (0.004) | 1.609 (0.007) | 1.948 (0.001) | 2.046 (0.001) | 3.555 (0.000) | 3.293 (0.000) | 2.626 (0.000) | 2.562 (0.000) | 2.119 (0.000) | 5.965 (0.000) | ||||||
| D1 | 1.595 (0.011) | 1.503 (0.017) | 1.898 (0.005) | 2.089 (0.001) | 3.059 (0.000) | 2.349 (0.000) | 1.669 (0.006) | 2.169 (0.001) | 2.188 (0.001) | 5.885 (0.000) | 2.956 (0.000) | |||||
| D2 | 1.431 (0.040) | 1.457 (0.041) | 1.561 (0.015) | 1.568 (0.015) | 1.606 (0.007) | 1.691 (0.006) | 1.710 (0.004) | 1.761 (0.004) | 1.803 (0.002) | 2.325 (0.000) | 4.503 (0.000) | 1.981 (0.001) | ||||
| D4 | 2.653 (0.000) | 2.425 (0.000) | 2.788 (0.000) | 3.024 (0.000) | 2.742 (0.000) | 2.446 (0.000) | 1.743 (0.003) | 2.371 (0.000) | 2.522 (0.000) | 3.701 (0.000) | 2.947 (0.000) | 3.016 (0.000) | 3.173 (0.000) | |||
| E1 | 2.241 (0.000) | 2.037 (0.001) | 2.237 (0.000) | 2.608 (0.000) | 2.032 (0.001) | 2.079 (0.000) | 1.910 (0.001) | 2.058 (0.000) | 8.099 (0.000) | 3.200 (0.000) | 2.191 (0.001) | 1.914 (0.002) | 3.778 (0.000) | 4.009 (0.000) | ||
| E2 | 1.528 (0.016) | 1.612 (0.007) | 1.633 (0.005) | 1.442 (0.044) | 1.532 (0.011) | 1.734 (0.003) | 1.741 (0.003) | 1.546 (0.017) | 1.806 (0.002) | 4.022 (0.000) | 2.646 (0.000) | 1.502 (0.017) | 1.950 (0.001) | 2.906 (0.000) | 1.523 (0.021) | |
| E4 | 1.603 (0.007) | 1.726 (0.005) | 1.734 (0.005) | 1.804 (0.003) | 3.316 (0.000) | 2.457 (0.000) | 1.895 (0.002) | 1.852 (0.002) | 5.159 (0.000) | 2.251 (0.001) | 4.953 (0.000) | 2.319 (0.000) | 2.529 (0.000) | 2.787 (0.000) | 1.842 (0.002) | 1.647 (0.006) |
Note: p < 0.05.
References
- Brundtland, G.; Khalid, M.; Agnelli, S.; Al-Athel, S.; Chidzero, B.; Fadika, L.; Singh, M. Our Common Future; Brundtland report; United Nations World Commission on Environment and Development: New York, NY, USA, 1987. [Google Scholar]
- Dyllick, T.; Hockerts, K. Beyond the business case for corporate sustainability. Bus. Strateg. Environ. 2002, 11, 130–141. [Google Scholar] [CrossRef]
- Schaltegger, S.; Burritt, R.L. Corporate sustainability accounting: A nightmare or a dream coming true? Bus. Strateg. Environ. 2006, 15, 293–295. [Google Scholar] [CrossRef]
- Johnson, M.P.; Schaltegger, S. Two decades of sustainability & management tools for SMEs: How far have we come? J. Small Bus. Manag. 2016, 54, 481–505. [Google Scholar]
- La Torre, M.; Trotta, A.; Chiappini, H.; Rizzello, A. Business models for sustainable finance: The case study of social impact bonds. Sustainability 2019, 11, 1887. [Google Scholar] [CrossRef]
- Flower, J. The international integrated reporting council: A story of failure. Crit. Perspec. Acc. 2015, 27, 1–17. [Google Scholar] [CrossRef]
- Dumay, J.; Bernardi, C.; Guthrie, J.; Demartini, P. Integrated reporting: A structured literature review. Acc. Forum 2016, 40, 166–185. [Google Scholar] [CrossRef]
- Klaus, F.; Kroczak, A.; Facchinetti, G.; Egloff, S. Economy for the Common Good. DAS in Sustainable Business; Business School Lausanne: Lausanne, Switzerland, 2013; Available online: https://balance.ecogood.org/ecg-reports/bsl-economy-of-the-common-good.pdf (accessed on 15 April 2019).
- Frémeaux, S.; Michelson, G. The common good of the firm and humanistic management: Conscious capitalism and economy of communion. J. Bus. Ethics 2017, 145, 701–709. [Google Scholar] [CrossRef]
- Elkington, J. Cannibals with Forks: The Triple Bottom Line of the 21st-Century Business; Capstone Publishing: Oxford, UK, 1997. [Google Scholar]
- Felber, C. Neue Werte für die Wirtschaft—eine Alternative zu Kapitalismus und Kommunismus; Deuticke: Vienna, Àustria, 2008. [Google Scholar]
- Felber, C. Gemeinwohl-Ökonomie; Piper: Munich, Germany, 2018. [Google Scholar]
- Felber, C. Change Everything: Creating an Economy for the Common Good; Zed Books: London, UK, 2015. [Google Scholar]
- Freeman, R.E. Strategic Management: A Stakeholder Approach; Pitman Publishing: Boston, MA, USA, 1984. [Google Scholar]
- European Economic and Social Committee. The Economy for the Common Good: A Sustainable Economic Model Geared Towards Social Cohesion, EUR-Lex. 2016. Available online: lex.europa.eu/legal-content/EN/TXT/ (accessed on 15 April 2019).
- Foti, V.T.; Scuderi, A.; Timpanaro, G. The economy of the common good: The expression of a new sustainable economic model. Qual. Acc. Suc. 2017, 18, 16. [Google Scholar]
- Gómez-Calvo, V.; Gómez-Alvarez, R. The economy for the common good and the social and solidarity economies, are they complementary? CIRIEC J. Pub. Soc. Coop. Econ. 2017, 87, 257–294. [Google Scholar]
- Dierksmeier, C.; Pirson, M. Oikonomia versus chrematistiké, learning from aristotle about the future orientation of business management. J. Bus. Ethics 2009, 88, 417–430. [Google Scholar] [CrossRef]
- Freeman, R.E.; Reed, D.L. Stockholders and stakeholders: A new perspective on corporate governance. Calif. Manag. Rev. 1983, 25, 88–106. [Google Scholar] [CrossRef]
- Donaldson, T.; Preston, L.E. The stakeholder theory of the corporation: Concepts, evidence, and implications. Acad. Manag. Rev. 1995, 20, 65–91. [Google Scholar] [CrossRef]
- Mitchell, R.K.; Agle, B.R.; Wood, D.J. Toward a theory of stakeholder identification and salience: Defining the principle of who and what really counts. Acad. Manag. Rev. 1997, 22, 853–886. [Google Scholar] [CrossRef]
- Friedman, A.L.; Miles, S. Stakeholders: Theory and Practice; Oxford University Press: Oxford, UK, 2006. [Google Scholar]
- Adeneye, Y.B.; Ahmed, M. Corporate social responsibility and company performance. J. Bus. Stud. Quart. 2015, 7, 151–166. [Google Scholar]
- Jiang, C.; Fu, Q. A Win-win outcome between corporate environmental performance and corporate value: From the perspective of stakeholders. Sustainability 2019, 11, 921–939. [Google Scholar] [CrossRef]
- Lux, S.; Crook, R.; Woehr, D.J. Mixing business with politics: A meta-analysis of the antecedents and outcomes of corporate political activity. J. Manag. 2011, 37, 223–247. [Google Scholar] [CrossRef]
- Carroll, A.B.; Buchholtz, A. Business and Society: Ethics and Stakeholder Management, 6th ed.; Thompson Learning: Mason, OH, USA, 2006. [Google Scholar]
- Ackermann, F.; Eden, C. Strategic management of stakeholders: Theory and practice. Long Range Plan. 2011, 44, 179–196. [Google Scholar] [CrossRef]
- Bellantuono, N.; Pontrandolfo, P.; Scozzi, B. Capturing the stakeholders’ view in sustainability reporting: A novel approach. Sustainability 2016, 8, 379. [Google Scholar] [CrossRef]
- Miles, S. Stakeholder theory classification: A theoretical and empirical evaluation of definitions. J. Bus. Ethics 2017, 142, 437–459. [Google Scholar] [CrossRef]
- Smith, H.J. The Shareholders vs. Stakeholders debate. MIT Sloan Manag. Rev. 2003, 44, 85–91. [Google Scholar]
- Argandoña, A. The stakeholder theory and the common good. J. Bus. Ethics 1998, 17, 1093–1102. [Google Scholar] [CrossRef]
- Porter, M.; Kramer, M. Creating shared value. Harvard Bus. Rev. 2011, 89, 1–17. [Google Scholar]
- Barisan, L.; Lucchetta, M.; Bolzonella, C.; Boatto, V. How does carbon footprint create shared values in the wine industry? Empirical evidence from prosecco superiore PDO’s wine district. Sustainability 2019, 11, 3037. [Google Scholar] [CrossRef]
- Porter, M.; Kramer, M. Strategy and society: The link between competitive advantage and corporate social responsibility. Harvard Bus. Rev. 2006, 84, 1–13. [Google Scholar]
- Wójcik, P. How creating shared value differs from corporate social responsibility. J. Manag. Bus. Admin. 2016, 24, 32–55. [Google Scholar] [CrossRef]
- Florin, J.; Schmidt, E. Creating shared value in the hybrid venture arena: A business model innovation perspective. J. Soc. Entrepren. 2011, 2, 165–197. [Google Scholar] [CrossRef]
- Beschorner, T. Creating shared value: The one-trick pony approach. Bus. Ethics J. Rev. 2014, 1, 106–112. [Google Scholar] [CrossRef]
- Michelini, L.; Fiorentino, D. New business models for creating shared value. Soc. Responsib. J. 2012, 8, 561–577. [Google Scholar] [CrossRef]
- Pfitzer, M.; Bockstette, V.; Stamp, M. Innovating for shared value. Harvard Bus. Rev. 2013, 91, 100–107. [Google Scholar]
- De los Reyes, G., Jr.; Scholz, M.; Smith, N.C. Beyond the “Win-Win” creating shared value requires ethical frameworks. Calif. Manag. Rev. 2017, 59, 142–167. [Google Scholar] [CrossRef]
- Hartman, L.P.; Werhane, P.H. Proposition: Shared value as an incomplete mental model. Bus. Ethics J. Rev. 2013, 1, 36–43. [Google Scholar] [CrossRef]
- Crane, A.; Palazzo, G.; Spence, L.J.; Matten, D. Contesting the value of creating shared value. Calif. Manag. Rev. 2014, 56, 130–153. [Google Scholar] [CrossRef]
- Carroll, A.B. A three-dimensional conceptual model of corporate performance. Acad. Manag. Rev. 1979, 4, 497–505. [Google Scholar] [CrossRef]
- Carroll, A.B. The pyramid of corporate social responsibility: Toward the moral management of organizational stakeholders. Bus. Horizons 1991, 34, 39–48. [Google Scholar] [CrossRef]
- Carroll, A.B. Corporate social responsibility. Bus. Soc. 1999, 38, 268–295. [Google Scholar] [CrossRef]
- Ansaram, K.; Pariag-Maraye, N. Modelling the impact of responsibility levels on corporate financial performance: The. case of top 100 firms in mauritius Bus. Econ. Res. 2018, 8, 118–138. [Google Scholar]
- Jose, S.; Venkitachalam, K. A matrix model towards CSR—Moving from one size fit approach. J. Strat. Manag. 2019, 12, 243–255. [Google Scholar] [CrossRef]
- Savitz, A. The Triple Bottom Line: How Today’s Best-Run Companies are Achieving Economic, Social and Environmental Success-And How you can too; John Wiley & Sons: Hoboken, NJ, USA, 2013. [Google Scholar]
- Fauzi, H.; Svensson, G.; Rahman, A.A. “Triple bottom line” as “Sustainable corporate performance”: A proposition for the future. Sustainability 2010, 2, 1345–1360. [Google Scholar] [CrossRef]
- Gimenez, C.; Sierra, V.; Rodon, J. Sustainable operations: Their impact on the triple bottom line. Int. J. Prod. Econ. 2012, 140, 149–159. [Google Scholar] [CrossRef]
- Norman, W.; MacDonald, C. Getting to the bottom of the triple bottom line. Bus. Ethics Quart. 2004, 14, 243–262. [Google Scholar] [CrossRef]
- Hristov, I.; Chirico, A.; Appolloni, A. Sustainability value creation, survival, and growth of the company: A critical perspective in the Sustainability Balanced Scorecard (SBSC). Sustainability 2019, 11, 2119–2138. [Google Scholar] [CrossRef]
- Hubbard, G. Measuring organizational performance: Beyond the triple bottom line. Bus. Strat. Environ. 2009, 18, 177–191. [Google Scholar] [CrossRef]
- Elkington, J. The Holy Grail of Integrated Reporting. 2009. Available online: http://www.sustainability.com/blog/the-holy-grail-of-integrated-reporting (accessed on 8 April 2019).
- Elkington, J. 25 years ago i coined the phrase “Triple Bottom Line.” Here’s why it’s time to rethink it. Harvard Bus. Rev. 2018. Available online: https://hbr.org/2018/06/25-years-ago-i-coined-the-phrase-triple-bottom-line-heres-why-im-giving-up-on-it (accessed on 8 April 2019).
- Gray, R.; Milne, M. Sustainability reporting: Who’s kidding whom? Chart. Account. J. New Zeal. 2002, 81, 66–70. [Google Scholar]
- McDonough, W.; Braungart, M. Design for the triple top line: New tools for sustainable commerce. Corp. Environ. Strat. 2002, 9, 251–258. [Google Scholar] [CrossRef]
- Henderson, J.C. Corporate social responsibility and tourism: Hotel companies in Phuket, Thailand, after the Indian Ocean tsunami. Int. J. Hosp. Manag. 2007, 26, 228–239. [Google Scholar] [CrossRef]
- Salzmann, O.; Ionescu-Somers, A.; Steger, U. The business case for corporate sustainability: Literature review and research options. Eur. Manag. J. 2005, 23, 27–36. [Google Scholar] [CrossRef]
- Fechete, F.; Nedelcu, A. Performance management assessment model for sustainable development. Sustainability 2019, 11, 2779. [Google Scholar] [CrossRef]
- Van Marrewijk, M. Concepts and definitions of CSR and corporate sustainability: Between agency and communion. J. Bus. Ethics 2003, 44, 95–105. [Google Scholar] [CrossRef]
- Montiel, I. Corporate social responsibility and corporate sustainability: Separate pasts, common futures. Organ. Environ. 2008, 21, 245–269. [Google Scholar] [CrossRef]
- Atkinson, G. Measuring corporate sustainability. J. Environ. Plan. Manag. 2000, 43, 235–252. [Google Scholar] [CrossRef]
- Perrini, F.; Tencati, A. Sustainability and stakeholder management: The need for new corporate performance evaluation and reporting systems. Bus. Strat. Environ. 2006, 15, 296–308. [Google Scholar] [CrossRef]
- Schaltegger, S.; Lüdeke-Freund, F.; Hansen, E.G. Business cases for sustainability: The role of business model innovation for corporate sustainability. Int. J. Innov. Sustain. Dev. 2012, 6, 95–119. [Google Scholar] [CrossRef]
- Raluca, C.; Costin, V. Performance evaluation of the implementation of the 2013/34/EU directive in Romania on the basis of corporate social responsibility reports. Sustainability 2019, 11, 2531–2547. [Google Scholar]
- Aras, G.; Crowther, D. Corporate sustainability reporting: A study in disingenuity? J. Bus. Ethics 2009, 87, 279. [Google Scholar] [CrossRef]
- Willis, A. The role of the global reporting initiative’s sustainability reporting guidelines in the social screening of investments. J. Bus. Ethics 2003, 43, 233–237. [Google Scholar] [CrossRef]
- Visser, W.; Tolhurst, N. The World Guide to CSR: A Country-by-Country Analysis of Corporate Sustainability and Responsibility; Routledge: London, UK, 2017. [Google Scholar]
- Levy, D.L.; Szejnwald Brown, H.; De Jong, M. The contested politics of corporate governance: The case of the global reporting initiative. Bus. Soc. 2010, 49, 88–115. [Google Scholar] [CrossRef]
- Ballou, B.; Heitger, D.L.; Landes, C.E.; Adams, M. The future of corporate sustainability reporting. J. Account. 2006, 202, 65–74. [Google Scholar]
- Milne, M.J.; Gray, R. W(h)ither ecology? The triple bottom line, the global reporting initiative, and corporate sustainability reporting. J. Bus. Ethics 2013, 118, 13–29. [Google Scholar] [CrossRef]
- González, J.A.; Núñez, J. Socially responsible investment: A view from the social rating agencies of Vigeo-Eiris and MSCI ESG Stats. Financ. Mark. Valuat. 2018, 4, 39–55. [Google Scholar]
- Association for the promotion of the Economy for the Common Good. Common Good Matrix. 2015. Available online: https://www.ecogood.org/en/common-good-balance-sheet/common-good-matrix/ (accessed on 8 April 2019).
- Heidbrink, L.; Kny, J.; Köhne, R.; Sommer, B.; Stumpf, K.; Welzer, H.; Wiefek, J. Schlussbericht für das Verbundprojekt Gemeinwohl-Ökonomie im Vergleich Unternehmerischer Nachhaltigkeitsstrategien (GIVUN). Flensburg & Kiel, 2018. Available online: https://www.ecogood.org/media/filer_public/2a/b5/2ab5defc-c5a0-4164-9b05-6efbc3019ad4/givun-schlussbericht.pdf (accessed on 8 April 2019).
- Hair, J.F.; Black, W.C.; Babin, B.J.; Anderson, R.E. Multivariate Data Analysis, 6th ed.; Pearson New International Edition: Harlow, UK, 2010. [Google Scholar]
- Rummel, R.J. Applied Factor Analysis; Northwestern University Press: Evanston, IL, USA, 1970. [Google Scholar]
- Gorsuch, R.L. Factor Analysis; Hillsdale, Lawrence Erlbaum Associates: Hoboken, NJ, USA, 1983. [Google Scholar]
- Muthen, B.; Kapplan, D. A comparison of some methodologies for the factor analysis of non-normal like variables. Br. J. Math. Stat. Psychol. 1985, 38, 171–189. [Google Scholar] [CrossRef]
- Kaiser, H.F. A second-generation little jiffi. Psychometrica 1970, 35, 401–415. [Google Scholar] [CrossRef]
- Kaiser, H.F. Little Jiffi, Mark IV. Educ. Psychol. Meas. 1974, 34, 111–117. [Google Scholar] [CrossRef]
- Borgatta, E.F.; Kercher, K.; Stull, D.E. A cautionary note on the use of principal component analysis. Sociol. Meth. Res. 1986, 15, 160–168. [Google Scholar] [CrossRef]
- Snook, S.C.; Gorsuch, R.L. Principal component analysis versus common factor analysis: A monte carlo study. Psychol. Bull. 1989, 106, 148–154. [Google Scholar] [CrossRef]
- Gorsuch, R.L. Common factor analysis versus component analysis: Some well and little-known facts. Multiv. Behav. Res. 1990, 25, 33–39. [Google Scholar] [CrossRef]
- Mulaik, S.A. Bluring the distinction between component analysis and common factor analysis. Multiv. Behav. Res. 1990, 25, 53–59. [Google Scholar] [CrossRef]
- Velicer, W.F.; Jackson, D.N. Component analysis versus common factor analysis: Some issues in selecting an appropriate procedure. Multiv. Behav. Res. 1990, 25, 1–28. [Google Scholar] [CrossRef]
- Anderson, J.C.; Gerbing, D.W.; Hunter, J.E. On the assessment of unidimensional measurement: Internal and external consistency and overall consistency criteria. J. Mark. Res. 1987, 24, 432–437. [Google Scholar] [CrossRef]
- Hattie, J. Methodology review: Assessing unidimensionality of test and items. Appl. Psychol. Measur. 1985, 9, 139–164. [Google Scholar] [CrossRef]
- McDonald, R.P. The dimensionality of tests and items. Br. J. Math. Soc. Psychol. 1981, 34, 100–117. [Google Scholar] [CrossRef]
- Nunnally, J.L. Psychometric Theory, 2nd ed.; McGraw-Hill: New York, NY, USA, 1979. [Google Scholar]
© 2019 by the authors. Licensee MDPI, Basel, Switzerland. This article is an open access article distributed under the terms and conditions of the Creative Commons Attribution (CC BY) license (http://creativecommons.org/licenses/by/4.0/).