A Study on the Limitations of South Korea’s National Roadmap for Greenhouse Gas Reduction by 2030 and Suggestions for Improvement


1
Department of Architectural Engineering, Hanyang University, 55 Hanyangdaehak-ro, Sangnok-gu, Ansan 15588, Korea
2
Department of Architecture & Architectural Engineering, Hanyang University, 55 Hanyangdaehak-ro, Sangnok-gu, Ansan 15588, Korea
3
Sustainable Building Research Center, Hanyang University, 55 Hanyangdaehak-ro, Sangnok-gu, Ansan 15588, Korea
*
Authors to whom correspondence should be addressed.
Sustainability 2019, 11(14), 3969; https://doi.org/10.3390/su11143969
Submission received: 21 May 2019
/
Revised: 21 June 2019
/
Accepted: 15 July 2019
/
Published: 22 July 2019
(This article belongs to the Special Issue Sustainability in the Built Environment and Climate Change)
Abstract
:South Korea must submit its targets for greenhouse gas reduction by 2030 to comply with the Paris Agreement. While South Korea’s government has announced a roadmap for achieving greenhouse gas reduction targets by 2030, issues are present regarding the methodology used to set reduction targets, select the reduction method, and estimate the potential emissions reduction in the building sector. Accordingly, the present study identified the limitations based on an analysis of the roadmap and suggested an improvement plan for each limitation. To improve the roadmap, the methodology used to set emissions targets was changed from business-as-usual (BAU) to the absolute emissions method, the Intergovernmental Panel on Climate Change (IPCC) guidelines were applied to estimate greenhouse gas emissions, and methodology for determining emissions targets by year was proposed. The reduction method has been proposed abstractly, and five methods have been suggested: Energy consumption by building age and establishment of gross floor area for cooling/heating, supply status for each type of lighting, estimation of reduction amount through supply of LED lighting, reduction amount estimation by analyzing current supply status data for home appliances and office equipment, proposal of methodology for improvement of duplicate estimation for building energy maintenance systems (BEMS), and estimation of reduction potential by applying efficiency improvement in power generating equipment.
1. Introduction
Due to the recently observed phenomenon of abnormal temperatures around the world caused by climate change, global interest in climate change has continued to grow. The international scientific community has identified greenhouse gases (GHGs) as the main culprit responsible for climate change and has invested considerable effort to reduce GHG levels.
In 2015, as an active response to climate change, the 21st Conference of the Parties (COP) to the United Nations Framework Convention on Climate Change (UNFCCC) entered into the Paris Agreement for the purpose of reducing GHG emission levels [1]. The Paris Agreement represents an agreement among 196 major advanced and developing countries to voluntarily reduce GHG emissions through nationally determined contribution (NDC) [2,3]. The existing Kyoto Protocol called for reduction of GHG emissions by an average of 5.2% below 1990 levels among 37 major advanced countries but did not apply to developing countries; therefore, South Korea was not part of the Kyoto Protocol [4]. However, the Paris Agreement includes both advanced and developing countries.
In accordance with the Paris Agreement, the following parties announced their GHG reduction targets to the international community as follows—U.S.: 28% relative to 2005 levels, E.U.: 40% relative to 1990 levels, Japan: 26% relative to 2013 levels, Canada: 30% relative to 2005 levels, and China: 60–65% relative to GDP per person in 2005 [5,6]. South Korea proposed its target emission level by 2030 as 37% reduction relative to business as usual (BAU) levels, which included domestic reduction of 25.7% and foreign reduction of 11.3% through international market mechanisms [7].
Accordingly, the South Korean government announced a “2030 Greenhouse Gas Reduction Roadmap”, hereafter referred to as “the roadmap”, for achieving its GHG reduction of 37% by 2030 and proposed reduction targets for six sectors: Industry, building, transport, agriculture and livestock, waste, and commerce–public. With respect to reduction targets by sector, the targets for industry, transport, agriculture and livestock, waste, and commerce–public sectors were 20.5%, 29.3%, 8.2%, 28.9%, and 25.3%, respectively [8]. Meanwhile, the reduction target for the building sector was 32.7%, which was the highest among all of the sectors, indicating a need for further investigation [9,10]. Based on the analysis of the roadmap for the building sector, the following limitations were observed: 1) Limitation in setting the target emission levels, 2) absence of clearly defined methods for reduction, and 3) need for improvement in the methodology used to estimate the potential reduction by reduction method.
In order to improve the limitations in the roadmap for the building sector, the present study analyzed the roadmap and aimed to use the findings to improve the estimation of GHG emission targets, determine how to accurately develop the reduction method, and improve the methodology used to estimate the reduction potential by reduction method.
2. Methods
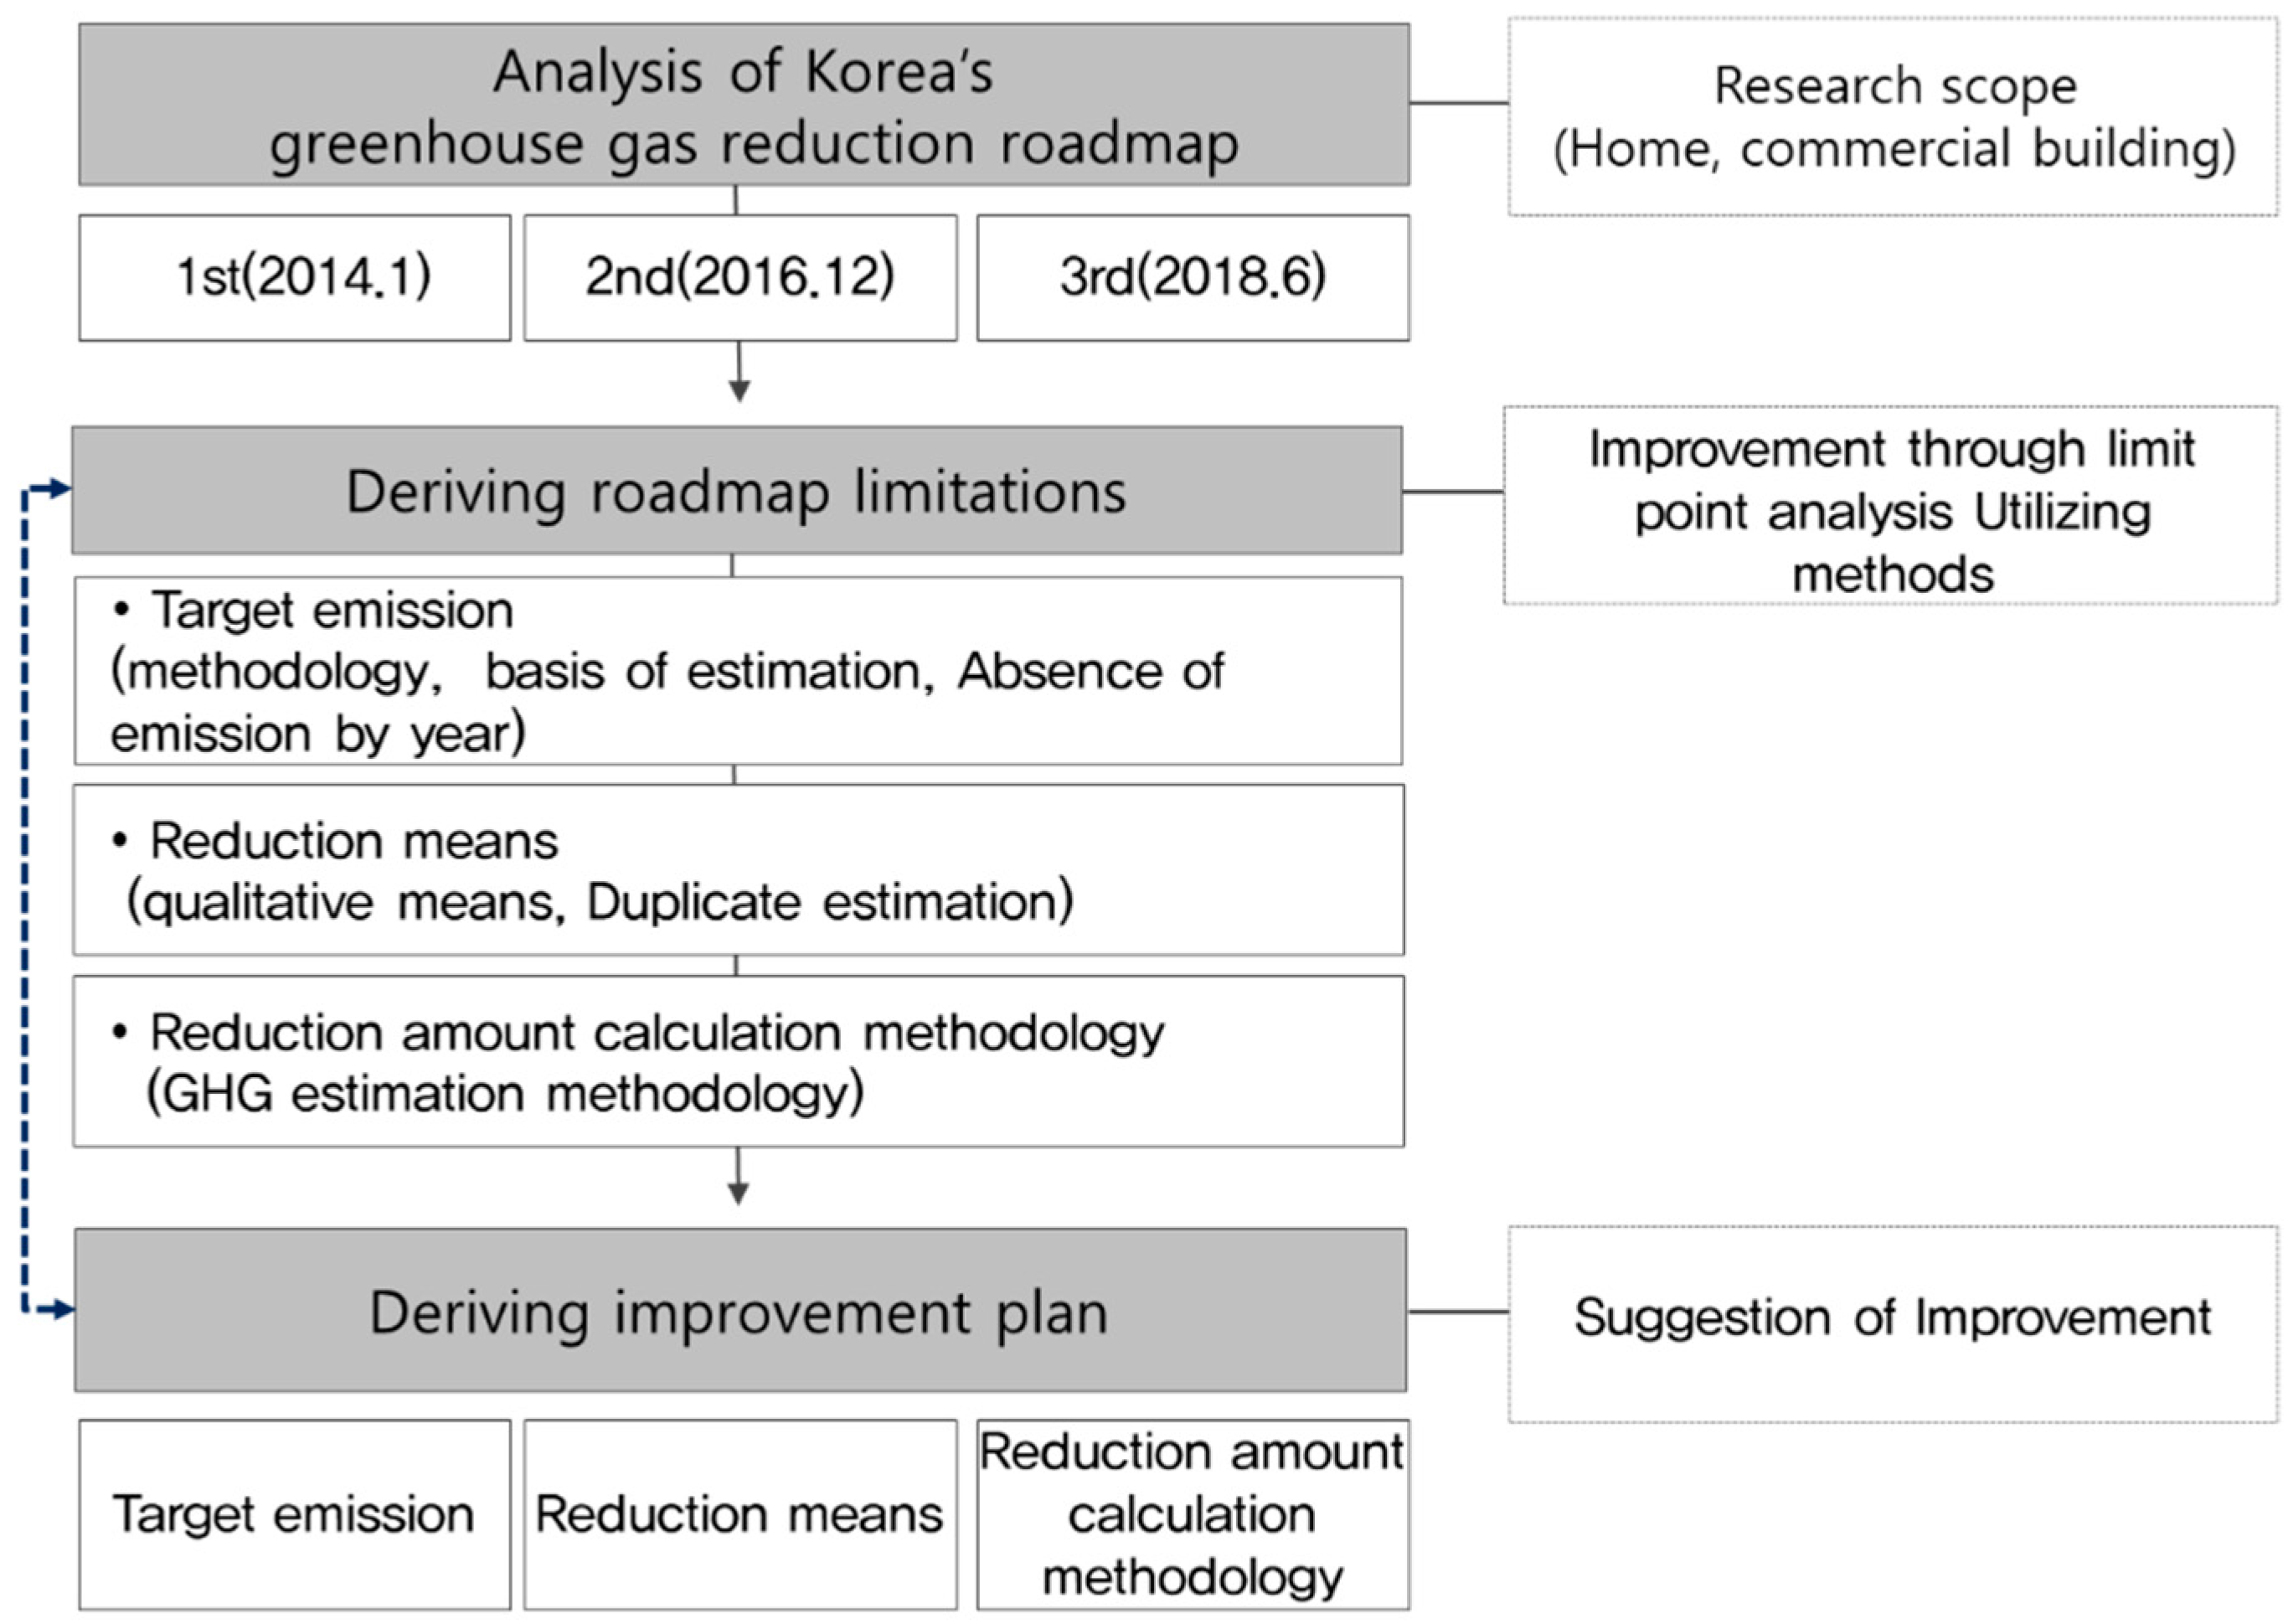
First, the roadmap was analyzed to identify the limitations and develop improvement plans for the building sector. The scope of the analysis was limited to the building sector and the study analyzed the target emission levels, the reduction method, and the estimation of potential reduction by the method.
To analyze the roadmap, the study examined the details of three announcements made by the South Korean government in January 2014, December 2016, and June 2018 [8,9,10]. Moreover, since the roadmap for the building sector comprises both residential and commercial sectors, analysis of the target emission levels, the reduction method, and the potential emissions reduction for each of these subsectors was required. The first roadmap in 2014 announced a GHG reduction plan targeting 2020, but with the adoption of the Paris Agreement, the reduction target was nullified automatically. For this reason, the 2014 roadmap was analyzed only for the reduction target. Meanwhile, the roadmaps announced in 2016 and 2018 have the same target emission level for 2030, but the reduction target and reduction method were changed. Accordingly, the analysis focused on these aspects.
Next, the findings were used to determine the limitations of the current roadmap and to develop improvement plans to address the limitations. When deriving the limitations, the study analyzed content needed to realize the reduction target that South Korea presented to the international community [11].
The analysis identified the limitations associated with target emission levels as: Flawed methodology for setting the reduction target, the absence of methodology for estimating the target emission level, and the absence of target emissions by year [12]. The limitations associated with the reduction method were identified as 1) presenting an abstract reduction method instead of clearly defined means and 2) duplication in the estimates of reduction potential. With respect to the methodology for reduction by the reduction method, methodology for quantitative estimation of reduction potential was absent. To improve these limitations, the study was conducted according to the steps below.
First, to improve the method used to set reduction targets, a methodological study was conducted to establish an absolute emissions method similar to the one used outside of South Korea. This study also proposed improved methodology associated with the establishment of GHG emission factors and energy consumption to better estimate target emission levels. To address the absence of data related to target emission levels by year, a study was conducted on methodology for presenting target amounts through estimation of energy consumption [13].
Second, because the methods of GHG reduction that South Korea announced are unclear, methodology for deriving a reduction method according to the purpose of energy use was proposed for selection of a reduction method [14,15].
Lastly, to estimate the required reduction amount by the reduction method, methodology for deriving the energy consumption with consideration of the characteristics of each means was presented. The study on improvements to the roadmap for the building sector in South Korea was conducted by the process illustrated in Figure 1.
3. Analysis of Greenhouse Gas Reduction Roadmap for Building Sector in South Korea
3.1. Analysis of Greenhouse Gas Reduction Target
Since 2014, the South Korean government has made three separate announcements on 2030 GHG reduction targets, divided into six sectors: Industry, buildings, transport, agriculture and livestock, waste, and commerce–public.
The first roadmap was announced in January 2014 and contained the GHG reduction targets for 2020. The total national target emissions for 2020 was announced as 776.1 million tons of CO2eq, with a reduction target of 30%. To systematically reduce GHG, implementation plans for each sector were announced to the international community. The target emission level for the building sector was set at 167 million tons of CO2eq with a reduction target of 26.9% by 2020. However, with the adoption of the Paris Agreement in 2016, each country agreed to submit GHG reduction targets for 2030, making South Korea’s first roadmap obsolete.
In 2016, South Korea set its 2030 GHG reduction target to 37% and submitted the target to the UNFCC. Accordingly, South Korea established a roadmap for achieving its GHG reduction target and announced its target emissions amount for 2030 as 851 million tons, a total reduction of 37%, including domestic reduction of 25.7% and foreign reduction of 11.3%. Within the total amount, the target emission levels for the building sector was 197 million tons of CO2eq with a reduction target of 18.1%. However, problems in the roadmap for the building sector occurred due to absence of clearly defined target emissions amounts and duplication of reduction method, and, as a result, the South Korean government took steps to improve the roadmap.
Consequently, in June 2018, South Korea announced a new version titled “Revised Roadmap for Achieving Greenhouse Gas Reduction Targets by 2030.” Analysis results showed that the total national target emissions amount for 2030 was 851 million tons of CO2eq, which was the same as the amount given in the roadmap announced in December 2016. Moreover, the target emissions amount for the building sector was 197 million tons of CO2eq, which did not change from the 2016 report, but the reduction target was increased significantly from 18.1% to 32.7%, as shown in Figure 2. Overall, the reduction target was increased, but the GHG reduction target for the building sector was set higher than all other sectors.
3.2. Analysis of Limitations in the Roadmap
The study analyzed the limitations in the final version of the roadmap for GHG reduction in South Korea. The analysis was performed on the target emission level, the reduction method, and the methodology for estimating the potential reduction by method for the building sector.
3.2.1. Limitations in Target Emissions Levels
The limitations in target emission levels were analyzed based on three aspects: 1) Flawed methodology used to set target emission levels, 2) lack of methodology for estimating the target emission levels by method, and 3) absence of target emission levels by year.
First, the methodology used to set target emission levels was analyzed and found to be a limitation. South Korea applied the BAU method for setting target emission levels, but the BAU method gives target emission levels based on current trends, assuming no additional actions are taken for GHG reduction. Consequently, with the BAU method, target emission levels change when actions for reduction are scaled down according to economic conditions [16]. Change in target emission levels according to economic conditions can cause decline in international credibility, which would require a corresponding change in the methodology used to set target emission levels. The reason for this is as follows. If Korea’s economic growth rate increases in the future, its emissions will increase. In other words, South Korea presented 851 million tons of CO2eq in 2030 with a target emissions amount, and proposed a target emissions reduction of 37% compared to the target emissions amount. The reason for this is as follows. If Korea’s economic growth rate increases in the future, its emissions will increase. In other words, South Korea presented 851 million ton CO2eq in 2030 with a target emission amount, and proposed a target emission reduction of 37% compared to the target emission amount. If Korea’s economy improves in the future, emissions of more than 851 million tons of CO2eq are likely to increase the global GHG emissions. If the reduction target relative to the baseline is set as in most countries, the total global GHG emissions do not increase. Most countries have set targets for reduction compared to 1990, and the final emission of greenhouse gases is not changed according to future economic conditions.
On the other hand, the absolute emissions method may have the disadvantage of having difficulties in responding flexibly to changes in economic conditions, but it offers the greater advantage of enabling objective assessment for achieving reduction targets [17]. Table 1 summarizes the BAU and absolute emissions methodology. Table 1 explains and compares the BUA and absolute emissions methodology.
Second, the absence of methodology for estimating target emission levels was identified as a limitation. This is a problem due to the omission of a basis for GHG emission factors and energy consumption in the buildings sector. Methods for estimating GHG emission levels generally include multiplying the GHG emission factor by the energy consumption by unit ton of oil equivalent (TOE) and also including the methods given in the Intergovernmental Panel on Climate Change (IPCC) guidelines [18]. The methods of estimation given in IPCC guidelines estimate CO2, CH4, and N2O levels separately. The estimation methodologies given in IPCC guidelines use oxidation rate and conversion factors, as shown in Equations (1) and (2), meaning they are more thorough estimation methodologies than typical methodologies that simply multiply the amount of emissions by the energy consumption [19]. Due to such methodological differences, estimated results of GHG emission levels vary, which indicates the need for presenting a clear methodology for estimation of GHG emission levels. Moreover, results of GHG emission levels may change due to the influence of a GHG emission factor, and, thus, more data is needed, since information about emission factors is an important element [20].
where is CO2 emissions (thousand tons of CO2),TA is total fuel consumption (thousand TOE), NA is non-fuel use (thousand TOE), FCS is carbon commitment rate, 41.868 is Joule–TOE conversion factor (TJ/thousand TOE), CF is conversion factor (net calorific value/total calorific value), EF is emission factor (t C/TJ), OF is oxidation rate, 44/12 is conversion of carbon-based emissions to carbon dioxide standards (kg CO2/kg C), I is fuel type, j is sector.
where E is Emissions (thousand tons CH4, thousand tons N2), TA is total fuel consumption (thousand TOE), 41.868: Joule–TOE conversion factor (TJ/thousand TOE), CF is conversion factor (net calorific value/total calorific value), EF is emission factor (kg CH4/TJ, kg N2O/TJ), I is fuel type, j is facility type, k is sector.
Third, another limitation identified was the absence of target emission levels by year. Since only the final target for 2030 is presented in the roadmap, there is no basis for estimation of target emission levels by year, which causes difficulties in establishing policies for GHG reduction and executing the reduction method. Moreover, by not disclosing the information about target emission levels by year in the roadmap, it makes it very difficult for the building sector to establish reduction measures and set reduction targets by year.
Target emissions levels by year must be set clearly to enable policies and actions for reduction [21]. Because of the absence of target levels by year, the government and the building sectors are unable to establish clear plans for GHG reduction. If target emission levels were estimated using a top-down methodology, then confirmation of detailed emissions levels by the reduction method would be difficult, but it would be possible to confirm information about target emission levels by year. It is suspected that the reason why it is impossible to confirm target emission levels by year, despite its necessity, is due to the absence of relevant data when the roadmap was announced.
3.2.2. Limitations in Reduction Method
The reduction methods were presented in an abstract manner in the roadmap and this was identified as a limitation. The final version of the roadmap for the building sector announced the reduction methods of strengthening new building permit standards, remodeling of existing buildings, discovery of business models linked to urban regeneration, and expansion of renewable energy supply. However, these reduction methods were qualitative methods to reduce GHG emissions; therefore, the roadmap lacked information about specific implementation measures and the associated potential for emissions reduction. For example, information about quantitative values for the insulating performance of buildings, energy savings in buildings through remodeling, and remodeling ratio was omitted [22].
As Table 2 shows, the revised roadmap announced in 2018 lacked information about reduction methods and reduction levels, more so than the roadmap from 2016. Moreover, reduction target levels actually increased despite omitting any details about reduction methods, which pointed out a problem with the reduction methods.
In buildings, savings in energy consumption is linked to GHG reduction, and, thus, reduction methods are needed separately for each purpose of energy use in buildings, such as cooling/heating, hot water supply, lighting, cooking, home appliances and office equipment, and power generation [23].
3.2.3. Limitations in the Methodology for Estimation of Reduction Amount
The absence of methodology for quantitative estimation of potential reduction by method was identified as a limitation, due to omission of basis for estimation of reduction amount by method in the roadmap announced by the South Korean government.
To achieve the GHG reduction target of 32.7% that South Korea announced to the international community, methods for quantitatively estimating the reduction amount are needed, which would also require the establishment of information about the amount of energy reduced by method, methodology for estimation, and the GHG emission factor. In particular, the measures for saved energy constructs by each method are required for estimation of energy consumption by reduction method [24]. Accordingly, details of this topic are discussed in Section 4 of this study.
4. Study on Improvement Plans for Greenhouse Gas Reduction Roadmap for Building Sector
4.1. Improvement Plans for Target Emission Levels
This study found limitations in the methodology used to set reduction targets, observed a lack of basis for estimating the reduction targets, and observed an absence of emission reduction targets by year. Accordingly, improvement plans for these aspects were studied.
First, the methodology used to set reduction targets must be changed from BAU to the absolute emissions method in order to be effective. Currently, South Korea uses the BAU method for reduction target setting, whereas most other countries use the absolute emissions method (Table 3). The international community also recommends that South Korea switches to the absolute emissions method [10].
Using the BAU method to set a reduction target makes it easy to respond flexibly to changes in economic conditions [25]. On the other hand, uncertainty increases as the forecasted values of the target change, which could lead to a lack of international credibility. For this reason, South Korea needs to change the method used to set the reduction target to the absolute emissions method to enhance international credibility and to conduct objective assessment on the achievement of climate goals and implementation status. Using the absolute emissions method requires statistics on GHG emissions in South Korea for use as reference values. Each year, South Korea publishes national statistics based on IPCC guidelines (Figure 3), and, thus, using such statistics would allow the switch to the absolute emissions method for target emission levels to give South Korea more international credibility.
Second, it is necessary to establish a clear methodology for reduction targets by year and a basis for estimation to ensure objectivity of reduction targets. Methodology for the estimation of GHG emissions should consider IPCC guidelines and these guidelines should inform South Korea’s GHG target management. The IPCC guidelines are used internationally for GHG estimation, as well as for estimation of inventory reporting in South Korea. The guideline for GHG target management represents methodology used for GHG management policies in South Korea. However, this guideline does not accurately capture heating values and emission factors when they are updated. Therefore, it is necessary to use the same methodology used universally by the international community (IPCC guidelines), rather than the methodology currently used to estimate target emission levels.
Third, it is necessary to present GHG target emission levels every year until 2030. In order to achieve this improvement, it is necessary to establish basic data for emission factors and energy consumption. For energy consumption data, a forecast on the energy consumption in South Korea in 2030 is needed. With respect to a forecast on energy use, the Korea Energy Economics Institute (KEEI) is conducting long-term energy demand forecasts in South Korea until 2040. Moreover, the South Korean government has established energy policies and is publishing basic energy plans every five years, while also forecasting the amount of energy South Korea will use in 2030. From the perspective of policy coherence in South Korea, it is necessary to use the basic energy plan published by the government, rather than KEEI data.
For emission factors, it is necessary to apply the country-specific emission factor. However, a country-specific emission factor for a non-CO2 emission factor is absent for South Korea, requiring the IPCC factor to be applied, and, unlike CO2, it is necessary to apply emission factors separately for residential and commercial applications. Among energy sources, the emission factor for heat energy is converted to CO2eq value, and, thus, non-CO2 values are not available. Korea’s reduction target needs to be improved as shown in Figure 4. Figure 4 shows an example after improvement.
4.2. Improvement of Reduction Method
The current roadmap presents the reduction method in an abstract manner, and, accordingly, part of this study was conducted to derive a methodology for estimating the reduction method.
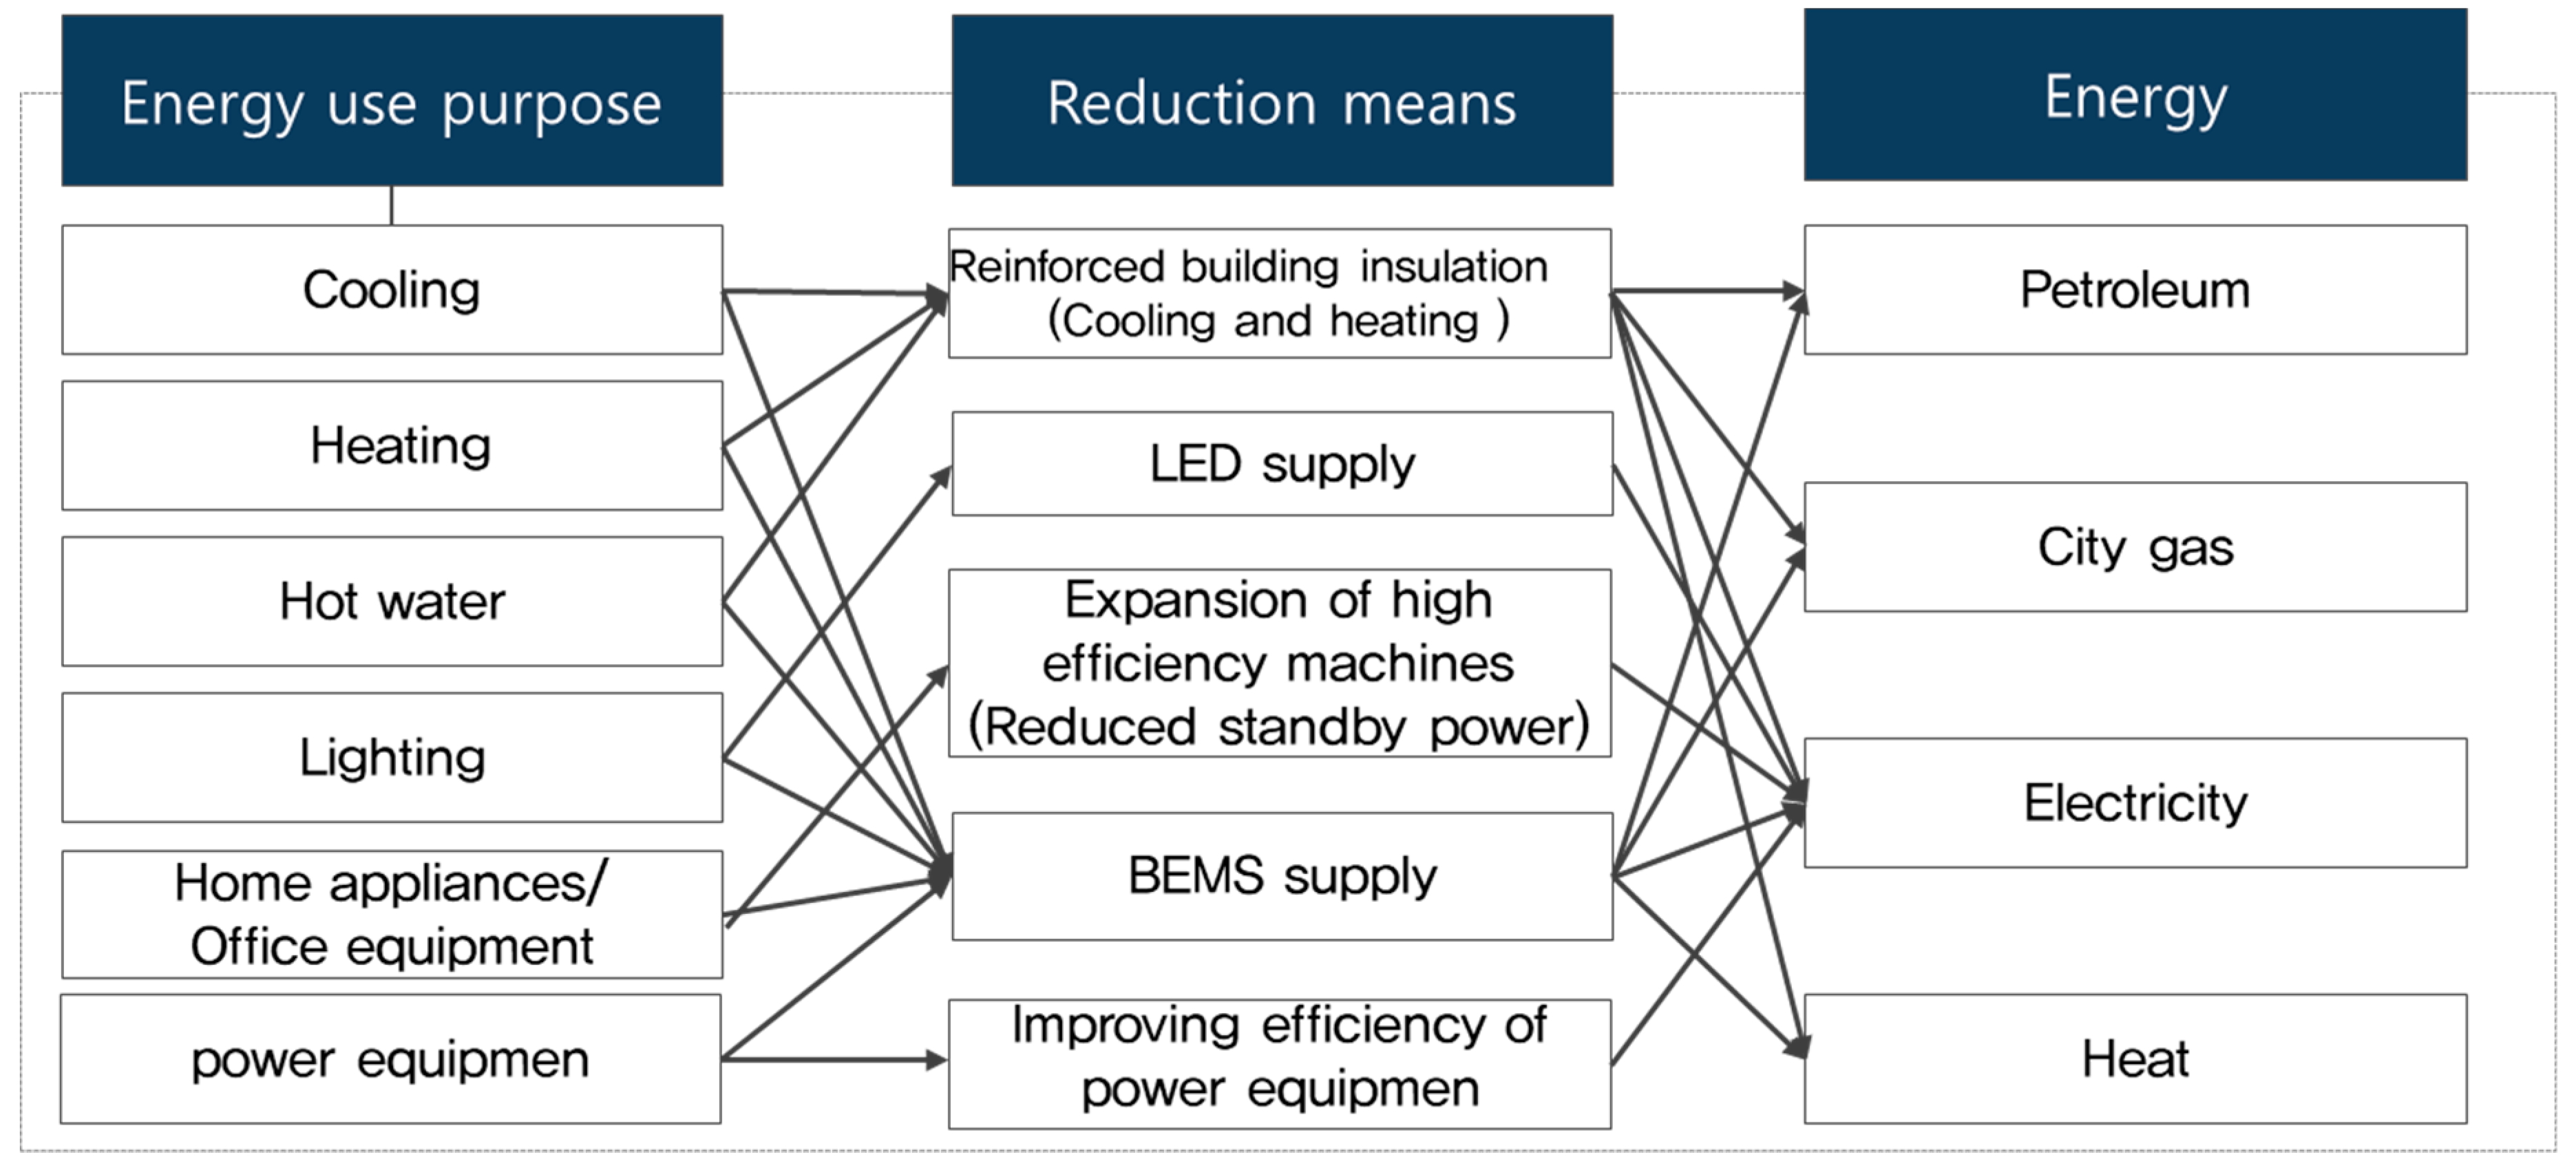
Above all else, reduction in energy use is needed for overall GHG reduction. Secondly, reducing GHG emission factors of energy is needed. However, reducing GHG emission factors is very difficult due to the specific heating value of energy. Since GHG emission reduction is possible through energy saving measures, the present study derived a GHG reduction method for the building sector by analyzing energy use in buildings by purpose of usage [26,27]. The results of the analysis are shown in Figure 5. For energy use in buildings, a reduction method needs to be presented according to purpose of usage, such as cooling/heating, hot water supply, lighting, home appliances and office equipment, and power generation [28,29]. Moreover, analysis showed that energy could be reduced by reduction method that may then be used to estimate the total reduction amount [30,31].
First, reduction methods for cooling/heating energy are needed, and through such means, petroleum, city gas, electricity, and heat energy could be reduced [32,33]. South Korea is pursuing policies to introduce zero-energy buildings for reduction of cooling/heating energy with plans to introduce zero-energy use as a mandatory requirement for new public buildings starting in 2025. With respect to cases outside of South Korea, the EU plans to make zero-energy buildings mandatory by 2050, while England plans to reduce cooling/heating energy by strengthening policies on use of boilers and insulation.
Second, lighting accounts for approximately 22% of all energy use, and, thus, it is necessary to apply energy reduction methods to save electric energy. South Korea is pursuing energy saving policies to make it mandatory for public facilities to install LED lights, while Japan is pursuing policies for 100% LED lighting supply [34].
Third, electric energy savings are necessary through introduction of reduction methods for household appliances and office equipment. South Korea is pursuing policies for reducing standby power from 0.5 W to 0.1 W and for introducing high-efficiency equipment.
Fourth, reduction in operating energy use through introduction of building energy maintenance systems (BEMS) is necessary and South Korea is pursuing policies that make it a mandatory requirement for new public facilities. Based on the pilot program launched in 2014, South Korea has seen energy savings of 8–14% from installing BEMS [35].
Lastly, introduction of reduction methods for power generating equipment is necessary. Power generation represents energy being used in various places within a building, including various types of equipment and elevators, while reduction through improvement in motor efficiency of motorized equipment is also necessary.
4.3. Deriving Improvement Plan for Methodology Used to Estimate Reduction Levels
Due to the absence of methodology for quantitative estimation of reduction potential by reduction method, the present study was conducted for the objective of proposing such methodology. Estimates of the reduction potential targeted reduction methods for cooling/heating energy, lighting energy, introduction of BEMS, introduction of high-efficiency household appliances and office equipment, and improvement in efficiency of power-generating equipment.
For estimation of reduction potential, energy consumption and GHG emission factors are needed. The emission factors shown in Table 4 (GHG emission factor by energy) could be applied as the factors, and, in this section, research was conducted on the methodology for deriving the energy consumption by reduction method.
First, information about the energy consumption in the building and the area (size) of the building are needed to estimate potential energy reduction through cooling/heating. The cooling/heating energy efficiency of a building varies according to the insulation performance of the building, and insulation performance varies significantly depending on when the building was built, due to different legal standards that were in existence at the time of construction. Because of such reasons, it is necessary to determine the area and energy consumption by building age for cooling/heating energy. In other words, buildings that were built long ago have different energy consumption levels than those built more recently, because of the insulation performance. Therefore, differentiation by building age is necessary. Moreover, because residential and commercial buildings have different patterns of energy use, it is necessary to establish data separately for residential and commercial sectors. In the residential sector, cooling shows higher usage than heating, while in the commercial sector, the heating to cooling rate is higher.
Legal amendments to insulation performance in South Korea can be differentiated by year, starting in 1979 with new standards established in 1980, 1984, 1987, 2001, 2008, 2013, 2015, and 2017. Building age could be differentiated by the amendment period. Currently, passive building insulation performance is required, but zero-energy buildings will be introduced in the future, and, thus, differentiation by age is possible. In South Korea, the building sector is divided into two residential sub-sectors and five commercial sub-sectors, and by using study results on expected energy use from the past and the future, it would be possible to establish basic data needed to estimate potential reduction amounts for cooling/heating energy.
With respect to floor area, differentiation by age is possible by using statistical data from the Ministry of Land, Transport, and Maritime Affairs. Because such statistics are based on buildings in South Korea, they represent statistics with high accuracy. Accordingly, estimation of GHG emissions is possible based on basic data that differentiate energy use and floor area by building age. It is also necessary to determine a reference year to use when estimating the potential reduction.
Floor area statistics in Korea are statistics based on the building master. Area statistics can be collected through Korea National Statistical Office Online. Floor area statistics do not provide yearly data for building dates. However, since the amendment of insulation performance is not an annual change, there is no difficulty in estimating GHG emissions. The use of vintage energy consumption data by building use can be done by studying ’building a standard model Data Base for analyzing the GHG reduction potential model for buildings’. In this study, the buildings were separated into home and commercial, and the energy consumption of the vintage cooling, heating, and hot water supply of the building was derived. It includes information on standard energy use of cooling, heating, and hot water in Korea. The methodology for estimating cooling and heating energy reductions can be estimated using the methodology shown in Figure 6.
Second, estimating the potential emissions reduction for lighting is possible by establishing data related to the supply status for each type of lighting, its rated capacity (W), and the rate of conversion to LED lighting.
There are various types of lighting, including incandescent, fluorescent, LED, HID, and halogen lights, and because the rated capacity is different for different types of lighting, the amount of energy consumed for lighting could be estimated by identifying the supply status of each type of lighting and multiplying the rated capacity. The supply status data by type of lighting in South Korea can be determined by using data contained in the “Survey on the Utilization of Lighting Apparatus and Supply Standards.” To determine the supply status by type of lighting, 2000 samples were surveyed by systematic sampling.
Estimation of potential reduction is possible by estimating the amount of energy saved by switching from conventional lighting to LED lighting. In other words, estimating the potential emission reduction would be possible based on 50% reduction in energy consumed when switching from fluorescent lamp (32 W) to LED lighting (16 W). Meanwhile, because fluorescent lamps use different amounts of energy depending their shape (straight tube, round, etc.), it is necessary to establish data that differentiate these different types when estimating the potential emissions reduction.
In order to quantitatively calculate in the lighting sector, it is necessary to construct import information and production status data for each type of lighting. It is difficult to investigate the types of lighting used in buildings throughout the country. To this end, it is necessary to construct production information data for each lighting company.
Information on imports of lighting is provided by Korea National Statistical Office (KNSO). However, it is necessary to construct information on the number of lights by type of lighting in the future. The method of calculating energy reduction amount of lighting energy can be calculated by the methodology shown in Figure 7.
Third, to estimate the potential emissions reduction for household appliances and office equipment, it is necessary to establish data on the rated consumption and domestic supply status of each kind of equipment. This is because it is possible to estimate the reduction potential through improvement in the efficiency of current equipment.
It is possible to derive highly accurate estimates of energy usage of household appliances and office equipment by calculating the number of units by the rated consumption and by the usage time in residential and commercial buildings. However, such a calculation is not possible at this time due to the absence of statistics on the current status of household appliances and office equipment used in South Korea. Consequently, estimating the reduction potential is possible only after estimating the potential reduction in electricity use due to improvement in the efficiency of the equipment. In other words, it is not expected that customer behavior related to usage time and the number of units in residential and commercial buildings will change.
In addition, it is also necessary to consider reduction in energy consumption according to reduction in standby power. Currently, South Korea has established a plan to implement a standby power reduction policy that will reduce standby power from its current level of 0.5 W to 0.1 W in the future, and, thus, estimating the potential energy reduction for standby power is also necessary.
For more accurate estimates of potential energy reduction in South Korea, it is necessary to establish data on energy consumption and supply status of equipment based on information about products that are produced in South Korea for domestic use and also for imported equipment.
In the case of domestic-use products produced in Korea, it is possible to construct data on the basis of the logarithm of the shipments from the factory. In addition, Korea’s electronic products have been certified for energy efficiency, and all products produced are being verified. It is necessary to construct information on the number of items shipped by product type in future. The method of calculating energy reduction amount of Home Appliances and Office Equipment energy can be calculated by the methodology shown in Figure 8.
Fourth, caution is needed to prevent duplication when estimating GHG reduction potential by BEMS supply. For example, if energy saving effects are estimated according to installation of BEMS after strengthening insulation and switching to LED lighting, then it would be impossible to determine whether the observed reduction is due to the installation of BEMS or from strengthening insulation and switching to LED lighting. Therefore, the reduction potential must be estimated after excluding reduction due to improved insulation, installation of LED lights, improving the efficiency of household appliances and office equipment, and power generation. BEMS is applicable for commercial buildings, and, thus, estimates must be made for the commercial sector only (by excluding the residential sector).
To estimate reduction potential due to the installation of BEMS, it is necessary to establish data on supply rate and energy savings. In South Korea, data from BEMS installation case analyses began in 2014, and, according to case reports, energy savings from installation of BEMS was a minimum of 7.0% to maximum of 12.2%, with an average of 12%. For supply targets, it is necessary for the government to establish relevant policies to encourage BEMS development in order to set the targets.
In order to estimate the quantitative reduction by BEMS supply, data on BEMS penetration rate is needed. Since data on domestic penetration rate is not available at present, it is necessary to construct relevant data. In order to construct the data, the existing installed buildings need to analyze the installation status of BEMS installation companies. In addition, it is necessary to establish the status of supply of new buildings by mandating the notification according to BEMS installation. The method of calculating energy reduction amount of BEMS energy can be calculated by the methodology shown in Figure 9.
Lastly, to estimate the reduction potential for power generation, it is necessary to have technical data on efficiency improvements in power generating equipment. Due to the absence of data on the current status of power generation equipment in South Korea, it is not possible to estimate the reduction potential of power-generating equipment with improved energy efficiency.
Data on efficiency improvement of power equipment is needed. It is difficult to investigate the energy consumption information of existing buildings. A statistically significant sample survey is required through the construction of standard power equipment for each building size.
Table 5 shows the data and construction methodology required for quantitative reduction by each reduction method.
5. Discussion
In this study, we analyzed the limitation of Korea’s 2030 Greenhouse Gas Reduction Roadmap and conducted a study on improvement measures. It is not for the purpose of criticizing the roadmap of Korea. Through the research, it is expected that the roadmap will be the basis for further development. The Korean government does not disclose detailed information on the roadmap, so the scope of this study is limited.
In addition, quantitative figures for achieving the reduction targets were not presented, but further studies are needed. In the case of the UK, the UK government’s policy is assessed annually to assess whether it achieves its GHG reduction targets. In addition, high-level policies and low-level policies are used to evaluate various scenarios according to the level of the policy and to perform quantitative calculations. Additional research is needed on the basis of these limitations. The results of this study are difficult to apply internationally. More research is needed for international applications. For international application, development is necessary through further research. To this end, it is necessary to analyze the roadmap for reducing GHG emissions by country and to study ways to improve it. There is no international standard for how to set greenhouse gas reduction targets. There is no guidance on how to set reduction targets in the Paris Climate Change Agreement.
However, this study proposed a methodology that can be used generally in countries other than Korea, as shown in Figure 10. Country-specific target emissions and target reductions are different. However, it is possible to review the appropriateness of the target of reducing GHG emissions by country in the method of Figure 10. The review of appropriateness can be done in three stages: Reviewing the appropriateness of the target emissions, estimating the amount of emission reduction targets, and achieving the reduction targets.
In the future, it will be necessary to investigate the problem of the target amount of GHG reduction by country and to find the improvement plan. We believe that this study is the basis for future research and, based on the methodology proposed in this study, it is necessary to improve Korea’s greenhouse gas reduction roadmap.
6. Conclusions
The present study analyzed the roadmaps announced by the South Korean government to identify limitations and provide improvement plans for the building sector portion of the 2018 roadmap. The findings were used to examine the techniques used to estimate GHG target emission levels, to derive reduction methods, and to improve methodology used to estimate reduction amount. The following conclusions were reached:
(1) South Korea announced to the international community that its 2030 national target emission level is 197 million tons of CO2eq and its reduction target is 32.7%. However, analysis of the roadmap identified errors in how target emission levels were set and identified the absence of methodology for estimating potential reduction amounts and reduction method.
(2) The analysis results indicated that to improve upon the limitations associated with target emission levels, it is necessary to change the methodology from the BAU method to the absolute emissions method. Moreover, to quantitatively estimate emissions, it is necessary to apply methodology based on IPCC guidelines and establish emission factors, so this study identified measures for establishing and applying emission factors for 11 emission sources, including diesel, kerosene, electric power, and city gas.
(3) Because the reduction methods in existing roadmaps were presented in an abstract manner, the present study proposed quantitative reduction methods for cooling/heating, LED lighting supply, high-efficiency household appliances and office equipment, BEMS supply, and improvement in efficiency of power generating equipment through analysis of energy consumption by purpose of energy use in buildings.
(4) Estimates of reduction potential for cooling/heating energy showed different efficiency levels according to insulation performance, and, thus, the present study proposed methodology for estimating efficiency by determining area and building age to determine energy consumption. The study also proposed measures for estimating the reduction potential through analysis of supply status by types of light and LED light supply status for lighting, application of efficiency improvement ratio through supply status data analysis for household appliances and office equipment, proposal of methodology for improvement of duplicate estimation for BEMS, and application of technical data for efficiency improvement for power generating equipment.
To build upon the present study, it is necessary to conduct additional studies on reduction scenarios for GHG reduction roadmaps for the building sector. To achieve the targets for the building sector in South Korea, it is necessary to conduct simulations on the achievement of reduction targets using the reduction method proposed in the present study. For this, quantitative estimation of the reduction amount for each reduction method is needed, and if any reduction target is not achieved, it would be necessary to explore alternative measures to achieve such reduction.
To ensure relevance of the GHG reduction roadmap to the building sector, additional studies are needed on the development of reduction methods and the establishment of methodologies and baseline data for estimation of reduction potential by reduction method. Quantitative estimates of reduction potential also require relevant studies on the establishment of technical data for future technologies.
Moreover, realizing the roadmap goals also requires efforts to achieve the targets according to various reduction routes through revision and updating of reduction methods and actual monitoring each year.
Author Contributions
All authors contributed substantially to all aspects of this article.
Funding
This work was supported by the National Research Foundation of Korea (NRF) grant funded by the Korea government (MSIT) (No. 2015R1A5A1037548).
Conflicts of Interest
The authors declare no conflict of interest.
References
- Wang, H.; Chen, W. Gaps between pre-2020 climate policies with NDC goals and long-term mitigation targets: Analyses on major regions. Energy Procedia 2019, 158, 3364–3369. [Google Scholar] [CrossRef]
- Akihisa, K.; Kentaro, T.; Takeshi, K. Can Japan enhance its 2030 greenhouse gas emission reduction targets? Assessment of economic and energy-related assumptions in Japan’s NDC. Energy Policy 2019, 158, 328–340. [Google Scholar]
- Kejun, J.; Chenmin, H.; Chenfei, Q. Are China’s Nationally Determined Contributions (NDCs) so bad? Sci. Bull. 2019, 64, 364–366. [Google Scholar]
- Kusumadewi, T.V.; Winyuchakrit, P.; Misila, P.; Limmeechokchai, B. GHG mitigation in power sector: Analyzes of renewable energy potential for Thailand’s NDC roadmap in 2030. Energy Procedia 2017, 138, 69–74. [Google Scholar] [CrossRef]
- Tao, Y.; Yiqun, P.; Yikun, Y.; Meishun, L.; Bingyue, Q. CO2 emissions in China’s building sector through 2050: A scenario analysis based on a bottom-up model. Energy 2017, 128, 208–223. [Google Scholar]
- Kwangbok, J.; Taehoon, H.; Jimin, K. Development of a CO2 emission benchmark for achieving the national CO2 emission reduction target by 2030. Energy Build 2018, 158, 86–94. [Google Scholar]
- Park, S.W. Post-2020 Climate Regime and Paris Agreement. Environ. Law Policy 2016, 16, 285–322. [Google Scholar]
- Ministry of Environment. The Korean Government, Roadmap for Achieving the National Greenhouse Gas Reduction Target (Plan); Ministry of Environment: Sejong, Korea, 2014.
- Ministry of Environment. The Korean Government, Roadmap for Achieving the National Greenhouse Gas Reduction Target (Plan); Ministry of Environment: Sejong, Korea, 2016.
- Ministry of Environment. The Korean Government, Roadmap for Achieving the National Greenhouse Gas Reduction Target (Plan); Ministry of Environment: Sejong, Korea, 2018.
- IEA. Transition to Sustainable Buildings: Strategies and Opportunities to 2050; OECD: Paris, France, 2013. [Google Scholar]
- An, B.U.; Lee, J.H.; Seo, Y.K. An analysis of university’s energy usage pattern and occupancy satisfaction survey according to management of target for GHGs & energy. J. Archit. Inst. 2015, 31, 155–162. [Google Scholar]
- Jia, X.; Jiri, J.K. Analyzing the energy consumption, GHG emission, and cost of seawater desalination in China. Energies 2019, 12, 463. [Google Scholar] [CrossRef]
- Constantino, G.; Freitas, M. Adoption of photovoltaic systems along a sure path: A Life-Cycle Assessment (LCA) study applied to the analysis of GHG emission impacts. Energies 2018, 11, 2806. [Google Scholar] [CrossRef]
- Ha, S.K.; Park, P.J. A study on the development of building life cycle CO₂ assessment system. J. Archit. Inst. Korea Struct Construct. 2014, 30, 55–62. [Google Scholar] [CrossRef]
- Juntae, S.; Seongju, C. Interrelations between Greenhouse Gas (GHG) emission and total floor area of buildings (with the case study of public facilities in Ontario, Canada). Archit. Inst. Korea 2017, 19, 95–99. [Google Scholar]
- Sungkyun, H.; Sungho, T.; Rakhyun, K. Energy Demand Forecast Models for Commercial Building in South Korea. Energies 2019, 12, 2213. [Google Scholar] [CrossRef]
- IPCC. Climate Change, 2014: Synthesis Report; IPCC: Geneva, Switzerland, 2015. [Google Scholar]
- Kissinger, M.; Reznik, A. Detailed urban analysis of commute-related GHG emissions to guide urban mitigation measures. Environ. Impact Assess. Rev. 2019, 76, 26–35. [Google Scholar] [CrossRef]
- Perez-Lombard, L.; Ortiz, J.; Pout, C. A review on buildings energy consumption information. Energy Build. 2008, 40, 394–398. [Google Scholar] [CrossRef]
- Im, G.H. Development of survey techniques for residential energy consumption by life behavior. J. Korean Off. Stat. 2016, 21, 54–75. [Google Scholar]
- Nakano, R.; Zusman, E.; Nugroho, S. Determinants of energy savings in Indonesia: The case of LED lighting in Bogor. Sustain. Cities Soc. 2018, 42, 184–193. [Google Scholar] [CrossRef]
- Management of Target for GHGs & Energy of University Building. Renew. Sustain. Energy Rev. 2014, 69, 207–217.
- Lee, C.Y.; Huh, S.Y. Forecasting new and renewable energy supply through a bottom-up approach: The case of South Korea. Renew. Sustain. Energy Rev. 2017, 69, 207–217. [Google Scholar] [CrossRef]
- Ortiz, L.E.; Gonzalez, J.E.; Gutierres, E.; Arend, M. Forecasting building energy demands with a coupled weather-building energy model in a dense urban environment. J. Solar Energy Eng. 2016, 139. [Google Scholar] [CrossRef]
- Ko, D.H. A Study on BIM-based Sustainable Design Process using Building Performances and Energy Efficiency Evaluation. Archit. Inst. Korea 2016, 26, 237–247. [Google Scholar]
- Parshall, L.; Gurney, K.; Hammer, S.A. Modeling energy consumption and CO2 emissions at the urban scale: Methodological challenges and insights from the United States. Energy Policy 2010, 38, 4765–4782. [Google Scholar] [CrossRef]
- Panagiotis, C.; Theodoros, T.; Karolos, J.K.; Dimitrios, B. Normalising and assessing carbon emissions in the building sector: A review on the embodied CO2 emissions of residential buildings. Energy Build 2018, 130, 212–226. [Google Scholar]
- Seungjun, R.; Sungho, T. An integrated assessment system for managing life cycle CO2 emissions of a building. Renew. Sustain. Energy Rev. 2017, 73, 265–275. [Google Scholar]
- Tan, X.; Lai, H.; Gu, B.; Zeng, Y.; Li, H. Carbon emission and abatement potential outlook in China’s building sector through 2050. Energy Policy 2018, 118, 429–439. [Google Scholar] [CrossRef]
- Forrest, M.; Hansjürg, L.; Sheila, K. Reduce CO2 from buildings with technology to zero emissions. Sustain. Cities Soc. 2012, 2, 29–36. [Google Scholar]
- Jeong, Y.S.; Lee, S.E.; Huh, J.H. Estimation of CO2 emission of apartment buildings due to major construction materials in the Republic of Korea. Energy Build 2012, 49, 437–442. [Google Scholar] [CrossRef]
- Sirje, V.; Tarja, H.; Jaakko, K.; Jari, S. Impact of renewable energy technologies on the embodied and operational GHG emissions of a nearly zero energy building. J. Build. Eng. 2019, 22, 439–450. [Google Scholar]
- Singh, D.; Basu, C.; Meinhardt-Wollweber, M.; Roth, B. LEDs for energy efficient greenhouse lighting. Renew. Sustain. Energy Rev. 2015, 49, 139–147. [Google Scholar] [CrossRef] [Green Version]
- Yuan, J.; Farnham, C.; Emura, K. Development and application of a simple BEMS to measure energy consumption of buildings. Energy Build 2015, 109, 1–11. [Google Scholar] [CrossRef]
Figure 1.
Research flowchart.

Figure 2.
Korea’s 2016 greenhouse gas reduction target in 2018 comparison.

Figure 3.
Korea’s greenhouse gas (GHG) emissions statistics.

Figure 4.
Example of improvement after reduction target.

Figure 5.
Method of selection of reduction measures.

Figure 6.
Method for estimating energy consumption

Figure 7.
Method of calculating energy reduction amount.

Figure 8.
Method of calculating the reduction amount of household appliances and office equipment.

Figure 9.
Building energy maintenance systems (BEMS) reduction method.

Figure 10.
Reduction target appropriateness assessment process.


Table 1.
Comparison of business-as-usual (BAU) and absolute emissions method.
| Classification | BAU Methodology | Absolute Emission Method (Standard Year Method) |
|---|---|---|
| Methodology |
|
|
| Pros |
|
|
| Cons |
|
|
Table 2.
The 2016 and 2018 roadmap reduction measures comparison analysis.
| Roadmap | 2016 Roadmap | 2018 Roadmap (Final Version) |
|---|---|---|
| Expansion of High Efficiency Buildings |
|
|
| Strengthen Facility Efficiency |
| - |
| High-Efficiency Lighting |
| - |
| BEMS Supply |
| - |
| Promotion of Renewable Energy |
|
|
Table 3.
Methods and reduction targets by country.
| National | Goal Method | Reduction Target |
|---|---|---|
| Korea | BAU contrast | 2030 year 37% |
| EU 28 | Absolute amount (compared with 1990 year) | 2020 year 20%, 2030 year 40% |
| Germany | Absolute amount (compared with 1990 year) | 2020 year 40%, 2030 year 55% |
| France | Absolute amount (compared with 1990 year) | 2030 year 40%, 2050 year 75% |
| England | Absolute amount (compared with 1990 year) | 2023–2027 year 51%, 2028–2032 year 57%, |
| Japan | Absolute amount (compared with 2013 year) | 2020 3.8%, 2030 year 26% |
Table 4.
GHG emission factor by energy.
| Energy | kg CO2/TOE (Residential/Commercial) | (kg CH4/TOE) | (kgN2O/TOE) | ||
|---|---|---|---|---|---|
| Residential | Commercial | Residential | Commercial | ||
| Gasoline | 2.994 × 10³ | 4.187 × 10⁻¹ | 4.187 × 10⁻⁴ | 2.512 × 10⁻² | 2.512 × 10⁻⁵ |
| Kerosene | 2.964 × 10³ | 4.187 × 10⁻¹ | 4.187 × 10⁻⁴ | 2.512 × 10⁻² | 2.512 × 10⁻⁵ |
| Diesel | 3.040 × 10³ | 4.187 × 10⁻¹ | 4.187 × 10⁻⁴ | 2.512 × 10⁻² | 2.512 × 10⁻⁵ |
| B-A | 3.070 × 10³ | 4.187 × 10⁻¹ | 4.187 × 10⁻⁴ | 2.512 × 10⁻² | 2.512 × 10⁻⁵ |
| B-B | 3.131 × 10³ | 4.187 × 10⁻¹ | 4.187 × 10⁻⁴ | 2.512 × 10⁻² | 2.512 × 10⁻⁵ |
| B-C | 3.161 × 10³ | 4.187 × 10⁻¹ | 4.187 × 10⁻⁴ | 2.512 × 10⁻² | 2.512 × 10⁻⁵ |
| Propane | 2.364 × 10³ | 2.093 × 10⁻¹ | 2.093 × 10⁻⁴ | 4.187 × 10⁻³ | 4.187 × 10⁻⁶ |
| Butane | 2.702 × 10³ | 2.093 × 10⁻¹ | 2.093 × 10⁻⁴ | 4.187 × 10⁻³ | 4.187 × 10⁻⁶ |
| City gas | 2.364 × 10³ | 2.093 × 10⁻¹ | 2.093 × 10⁻⁴ | 2.512 × 10⁻² | 2.512 × 10⁻⁵ |
| Electricity | 5.411 × 10³ | 6.280 × 101 | 6.280 × 101 | 3.140 × 101 | 3.140 × 101 |
| Heat (CO2eq) | 2.115 × 10³ | - | - | - | - |
Table 5.
Necessary data and methodology for estimating reductions.
| Reduction Means | Required Data | Data Construction Methodology |
|---|---|---|
| Heating Cooling | Floor area by building type Energy consumption by use of buildings and buildings | Floor area statistics of the National Statistical Office Establishment of existing literature and Korean standard model |
| Lighting Equipment | Number of production (sales) by type of lighting | Statistics need to be set up for production plants |
| Home/Office Equipment | Production (sales) algebra and energy efficiency by device | Statistics need to be set up for production plants |
| BEMS | BEMS installation number and reduction efficiency information | Analysis of installation status of existing buildings for BESM installers Establishment of reduction efficiency data before and after installation of BEMS through sample survey |
| Power Equipment | Energy efficiency of power equipment | Establish statistics on energy use of power equipment through sample survey |
© 2019 by the authors. Licensee MDPI, Basel, Switzerland. This article is an open access article distributed under the terms and conditions of the Creative Commons Attribution (CC BY) license (http://creativecommons.org/licenses/by/4.0/).
Share and Cite
MDPI and ACS Style
Ha, S.; Tae, S.; Kim, R. A Study on the Limitations of South Korea’s National Roadmap for Greenhouse Gas Reduction by 2030 and Suggestions for Improvement. Sustainability 2019, 11, 3969. https://doi.org/10.3390/su11143969
AMA Style
Ha S, Tae S, Kim R. A Study on the Limitations of South Korea’s National Roadmap for Greenhouse Gas Reduction by 2030 and Suggestions for Improvement. Sustainability. 2019; 11(14):3969. https://doi.org/10.3390/su11143969
Chicago/Turabian StyleHa, Sungkyun, Sungho Tae, and Rakhyun Kim. 2019. "A Study on the Limitations of South Korea’s National Roadmap for Greenhouse Gas Reduction by 2030 and Suggestions for Improvement" Sustainability 11, no. 14: 3969. https://doi.org/10.3390/su11143969
Note that from the first issue of 2016, this journal uses article numbers instead of page numbers. See further details here.