IoT Power Monitoring System for Smart Environments


1
ISTAR-IUL, Instituto Universitário de Lisboa (ISCTE-IUL), 1649-026 Lisboa, Portugal
2
INOV INESC Inovação—Instituto de Novas Tecnologias, 1000-029 Lisboa, Portugal
*
Author to whom correspondence should be addressed.
Sustainability 2019, 11(19), 5355; https://doi.org/10.3390/su11195355
Submission received: 4 September 2019
/
Revised: 18 September 2019
/
Accepted: 20 September 2019
/
Published: 27 September 2019
(This article belongs to the Special Issue Sustainability in the Built Environment and Climate Change)
Abstract
:In this research work, we describe the development and subsequent validation of EnerMon a flexible, efficient, edge-computing based Internet of Things (IoT) LoRa (LongRange) System to monitor power consumption. This system provides real-time information and a descriptive analytics process to provide a ‘big picture’ about energy consumption over time and identify energetic waste. The solution is based on Arduinos, current transformer sensors, Raspberry Pi as an application server and LoRa communication alongside a description and information on what is to be expected of it, describing the development process from the design phase to the validation phase with all steps in between. Due to LoRa low debit communication, an edge computing approach was implemented to create a real-time monitoring process based on this technology. This solution, with the help of descriptive analysis, allows the creation of an energetic local footprint, using a low-cost developed solution for less than 80€ per three-phases monitoring device. This solution also allows for easy installation without communication range and obstacles limitations making it easy use in different situations from big complex building to smaller consumers, such as electric boilers, or simply to measure the energetic footprint of tourists in a small local tourist apartment.
1. Introduction
The world population has been increasing for years now, and with it comes an increase in resource wasting. This waste of resources comes from several factors including, but not only, the lack of proper rules and standards, the incorrect usage of the existing standards and in some cases the complete disregard for those standards, in some households and also in enterprise environments. Standards can come in the form of regulation for old devices (some that are still used to this day), standby equipment policies on power usage or even power consumption directives. One method used to fight these issues was the creation, or manipulation, of sensors and with it, both the communication between them and the analytics that comes with this new information thus creating the Internet of Things (IoT).
Nowadays almost every business has already some form of IoT investment, from retail to healthcare, and the International Data Corporation (IDC) has already concluded that data load, in 2025, will increase to 163 zettabytes, 10 times the data generated in 2016 [1]. This is partially due to IoT devices, as by that year, Peter Newman predicts that there will be more than 55 billion IoT devices connected to any form of network. In addition, between 2017 and 2025, there is a forecast of nearly $15 trillion in aggregate investments related to IoT [2].
The increase in demand for the use of more clean energy leads to an increase in demand for suitable IoT projects and infrastructures to create more efficient energy management inside buildings.
Of course, in some cases, energy consumption monitoring can have its difficulties. The work presented in [3] is an example of the increasing demand for energy consumption and efficiency-measuring platforms for heating, ventilation and air conditioning (HVAC), but is also one example of how the lack of proper infrastructure caused by unreliable networks where, the interference from nearby RF equipment, leads to increased packet loss, that, in turn, causes the lack of real-time synchronization between nodes, leading to improper results in power consumption. Another obstacle that researchers face is the lack of a standard in data created by energy monitoring solutions and, as such, Brick [4] is one of the proposed uniform schemas defining a concrete ontology for sensors, subsystems, and relationships among them, which would enable portable applications.
Edge computing, described in [5] as a networking paradigm focused on bringing computing processes as close to the source of data as possible, which in some cases could mean the sensor itself, is yet another solution to problems caused by finite resources, such as bandwidth, server resources and the costs caused by cloud processing, all while reducing latency and adding functionality thus creating a more aware system that can create alerts in a timely manner.
In [6], the authors presented the design and evaluation of the system PTEC (predictive thermal and energy control system), a thermal and energy control prediction system in a data center. The focus of the study was to verify if the PTEC could efficiently perform monitoring of the data center with a low cost in the use of power. The system collects data from both the server fans and the air conditioner and checks whether the information on both temperature and power consumption are within a margin of safety for the data center. The evaluation of the system is carried out using simulation to verify the efficiency and lability of the PTEC. The PTEC evaluation has shown that it can reduce cooling and circulation energy consumption by up to 34% and 30%. Temperature and humidity sensors alongside cloud management of air conditioners can also improve supportive infrastructure by controlling the, sometimes, wasteful cooling procedures, thus allowing a margin to increase the load by IT (Information Technologies) servers, increasing performance while maintaining proper temperatures and also reducing energy consumption [7].
Research done in [8] presented a low-cost solution for implementing energy consumption and environmental monitoring using an open-source IoT infrastructure, whose aim was similar to one of this work’s case studies, the monitoring in educational buildings. With the use of XBee devices, moreover, it provides insights derived from initial results which concerns a deployment inside a university building. Meanwhile, in [9] a different approach to energy savings is presented by using occupancy sensors in large commercial buildings to determine the occupancy patterns in certain areas and thus creating a more efficient HVAC schedule pattern that can create reductions of up to 38% in energy consumption while maintaining thermal comfort.
When it comes to energy monitoring using commercial devices, we can present three of the most common ones available in the market:
- Smart Energy by Develco Products [10] focuses on overall building energy monitoring, and provides not only tools to measure energy consumption, through intrusive means, but also energy generation, such as monitoring of photovoltaics, with the use of several communication standards, such as Zigbee, Z-Wave, WLAN, Wireless M-Bus, and Bluetooth Low Energy.
- Sense: Home Energy [11] works in a different way from other, more intrusive, sensors. The main particularity of this sensor is that it uses amperage clamps or current transformers, such as this work, to measure power consumption.
- Engage: Efergy [12] is yet another home energy consumption monitoring solution that uses current transformers to measure energy with the possibility to mix with “coming soon” smart electrical sockets, thus allowing for both intrusive and non-intrusive experience.
In this document, we describe a similar solution that uses current transformers and an Arduino MKR 1300 to send power consumption data to an open-sourced server, which in turn allows for visualization and descriptive data analytics on Microsoft’s PowerBI.
Table 1 systematize related work:
Table 2 below shows the main differences between each communication protocol normally used in IoT works. Each communication protocol can be used for different types of situation there is no better protocol overall however there will always be some protocols that can be best applied to certain situations.
2. IoT System (EnerMon)
Since the goal is the development of an IoT System, we follow the typical IoT waterfall methodology:
- Identification of requirements.
- Design of the System.
- System development.
- System Testing.
- Implementation and Results
2.1. Identification of Requirements
Our system proposal can be applied from small houses to big buildings, so in this phase, a set of interviews were performed to several service employees, such as a university’s sustainability and maintenance responsibilities and individual houses owners. From this initial work, a set of requirements were identified for EnerMon:
- Problem: Pattern identification is important to check power consumers that might be giving problems, such as power consumption deviation from the normality that could indicate that the hardware might be malfunctioning.
- ○
- Requirement: Real-time monitoring of power consumption/ low interval on sending data makes it easier to test for problematic devices
- Problem: It is also important that each month or week, a general vision of how each power consumer is working.
- ○
- Requirement: Aggregate monitoring of power consumption with filters based on different attributes
- Problem: Different environments can have several consumers in different electrical phases so not only the devices must be cheap so many can be made, but they also need to be easy to install in case there is the need to change their location.
- ○
- Requirement: Ease of installation for changeability within different environments.
- ○
- Requirement: Low-cost with an accuracy of 97%.
- Problem: Power consumption monitoring generates summative values, and as such, it is important to reduce failures to a minimum while always keeping the interval between reads within the same time frame.
- ○
- Requirement: Robustness to failures and errors, to keep a near 100% uptime.
- ○
- Requirement: Real-time device synchronization.
- Problem: With different environments comes different networks infrastructures; in most usual cases, the available infrastructure would be Wi-Fi, which can have multiple issues, such as low-range or the signal strength loss when crossing walls.
- ○
- Requirement: Wide area network with low frequency.
2.2. Design of the System
The design is based on regular IoT system’s architecture and has four main components shown below and in Figure 1:
- Device Layer—LoRa (LongRange) End Device: The end devices use edge computing approaches to collect data and then sends it to the LoRa gateway without any need for a nearby, small-range communication network (e.g., Wi-Fi).
- Communication Layer—LoRa Gateway: Receives uplinks from end devices and redirects that data to one or more application servers, while, also, sending downlinks to end devices, in case there is a need to send a command.
- Data Layer—Application Server and Databases: Receives data from the gateways, processes that data and stores it in a database while communicating with the end-device through the LoRa gateway.
- Information Layer—Dashboard and Analysis: The data collected is used to create a dashboard that presents information in the form of detailed graphics alongside proper filters, with the analysis done using PowerBi’s dashboard alongside Python to better understand the data.
3. System Development
End Devices: Edge Computing based Power Consumption Sensors. Several of the power consumption sensors were placed in different environments formed either by 3-phased power distribution or single-phase power distribution. These prototypes use an Arduino MKR 1300 connected to current transformers’ sensor with accuracies that vary depending on the power consumption passing through the main cable at the time:
- With values close to the expected rating of the current transformer, we can expect a 3% error, [23].
- When measuring values that are very close to zero, we can see errors up to 10%, [23].
- However, if we go above the expected maximum rating of the transformer by a large factor, we risk obtaining a multitude of accuracy error results up to 70% deviation due to saturation, [23].
Each sensor is able to connect to three-phases simultaneously, read each phase individually, and sum the values (kWh per reading interval) received from the phases. The sensor sums the value with each read and resets that sum every time it sends the data (as long as the data was received by the server), while also waiting to receive any message from the server. One LoRa limitation comes from the fact that it can only receive messages right after sending data to the server due to the board’s LoRa class A. The type of message this sensor can receive can come in two forms:
- A feedback acknowledgment from the LoRa server, indicating that the LoRa server received a message, sent automatically for each data uplink received by the LoRa server.
- A corrective message, sent automatically by the application server when it detects the end-devices clock has gone out of sync, which will force the board’s clock to re-sync.
The LoRa gateway connected to a router and a LoRa Server allows us to communicate between the sensors and the server using two different protocols:
- The LoRaWAN protocol is used to establish a connection between the end-devices and the LoRa gateway.
- HTTPS connects the router to the WebServer/Application Server.
Actility and TTN (The Things Network), are worldwide projects with a multitude of interconnected gateways, focused on creating a secure IoT network based on LoRa technology and LoRaWAN protocol. Each sensor is added to the network using the Actility or TTN console that provides a user-friendly interface to make device management as easy as possible. It also allows the integration of a variety of services, such as HTTP, MQTT, and cloud services, such as Azure or AWS. The application server bidirectionally communicates with a management server using HTTPS.
The application server is responsible for receiving the data from the LoRa server and processing it. For this purpose, a Raspberry Pi, with Raspbian operating system, was configured to run a full-time Web server using the Flask Web framework written in Python programming language. The reason for Flask is due to its simplicity and optimized framework that does not consume a lot of resources to run since it does not require a complex structure or external libraries/bloat to create the server. Flask This server has the function of processing the incoming HTTPS messages with the UPLINK data packets from the end-devices and creating the corresponding objects according to the sensor’s type and then sending them to a database located on the same Raspberry Pi. This server also has the means to detect when any defined end-device has its real-time out of sync and send correction messages to the end-device to correct its clock. The data collected by the sensors is structured into individual tables in a SQL database for further analysis, consultation, and export. The power consumption sensors provide kilowatt-hour per interval of time alongside generated information from the server, such as date values (week, month, semester, working days, etc.), time, location, classroom occupancy (from external APIs (Application Programming Interface)), etc.
Dashboard and Python Analysis. PowerBI is a business analytics software from and for Windows. It provides not only interactive visualization but also a simple way to create flexible filters based on how prepared the database is for business intelligence with its data warehouse capabilities. While it is mostly used for non-real-time business indicators, it provides means to connect to several different APIs and web services. It also allows the programming of scripts in several languages, such as R or python. PowerBI connects to a local MySQL database where all the data is stored. Temperature, power consumption and other variables for each classroom are acquired and stored locally and allow data extraction alongside the displaying of gathered information from the data we get from the end-devices using gauges, bar, line, and circular charts. Meanwhile, Python, using numpy and Pandas were used to, not only clean the data but also to prepare predictive analytics solutions that can be used when higher data volume overtime is available while also aggregating other data types to present it in a form PowerBI did not have available.
3.1. Device: LoRa End Device
3.1.1. Current Transformer Sensor
The end-devices were created using two principal components, the CT (current transformer) sensor, and the Arduino (Figure 2). The sensor will read the current from the wire and then feed that information into the Arduino. The Arduino applies edge computing approaches by processing that information and saving it in memory and then, on a set interval, sending the data to the LoRa server, while also both making sure the data is never lost in case of network failure and correcting the end-devices own timer based on information that comes from the application server.
Current transformer sensors measure alternating current (AC). This type of sensor is based on current clamps, which in turn use current transformers. Like a current clamp, the sensor has a ring of ferrite, with a wire coil around it forming a secondary winding. In turn, a primary current wire is then placed between the ferrite ring which carries the current we want to measure, the primary conductor.
When an alternating current passes through the primary conductor, the secondary wiring will generate an alternating current, whose values are much smaller but also proportional to the current that we want to measure, [24].
CT sensors, also, have different secondary ratings. Ratings are the values of current or voltage the sensor will provide when a certain primary current is being passed.
Example:
- A sensor whose rating is 100A:50mA, means that when 100 A is passing through the primary conductor, the current value that this sensor will output is 50 mA without any control to the voltage.
- A sensor whose rating is 100A:1V, means that when 100 A is passing through the primary conductor, the voltage value that this sensor will output is 1 V without any control to the current.
The Arduino will then read the resulting voltage that this CT sensor outputs. In cases such as 100A:50mA, where the output signal is a current without a normalized voltage, there is the need to add a burden resistor outside of the CT sensor (i.e., in a breadboard), so that the electric flow meets the requirements of the Arduino analog input, 0 V to the ADC (analog to digital) reference voltage which will depend on the input voltage from the Arduino or the maximum value that Arduino can handle. In this case, the burden resistor needs to be calculated based on the maximum current the CT sensor can measure, and the Arduino power source input voltage.
On the other hand, some CT sensors will output a normalized voltage and will present us with ratings such as 100A:1V, this means that inside the CT sensor exists a burden resistor, so there is no need for one outside of it.
The particular reason for the choice of the current transformer YHDC’s SCT-013-XXX (Beijing Yaohuadechang Electronic Co., Ltd. From Chine) was due to costs, the cable length, and the output/input (audio jack).
The size of the current transformer was also one of the main parameters when choosing this transformer because in most cases the electrical boards are not properly prepared to receive sensors and the spacing between wires can create complications in the installation. Finally, it is also important to refer the fact that it is split-coil, which means it can be opened and installed around the wire which is a must for this type of work since we want to make installation as easy as possible.
The Table 3 below shows a few more possible split-coil transformers that could have been used with similar accuracies all across the board:
3.1.2. Arduino MKR 1300 WAN
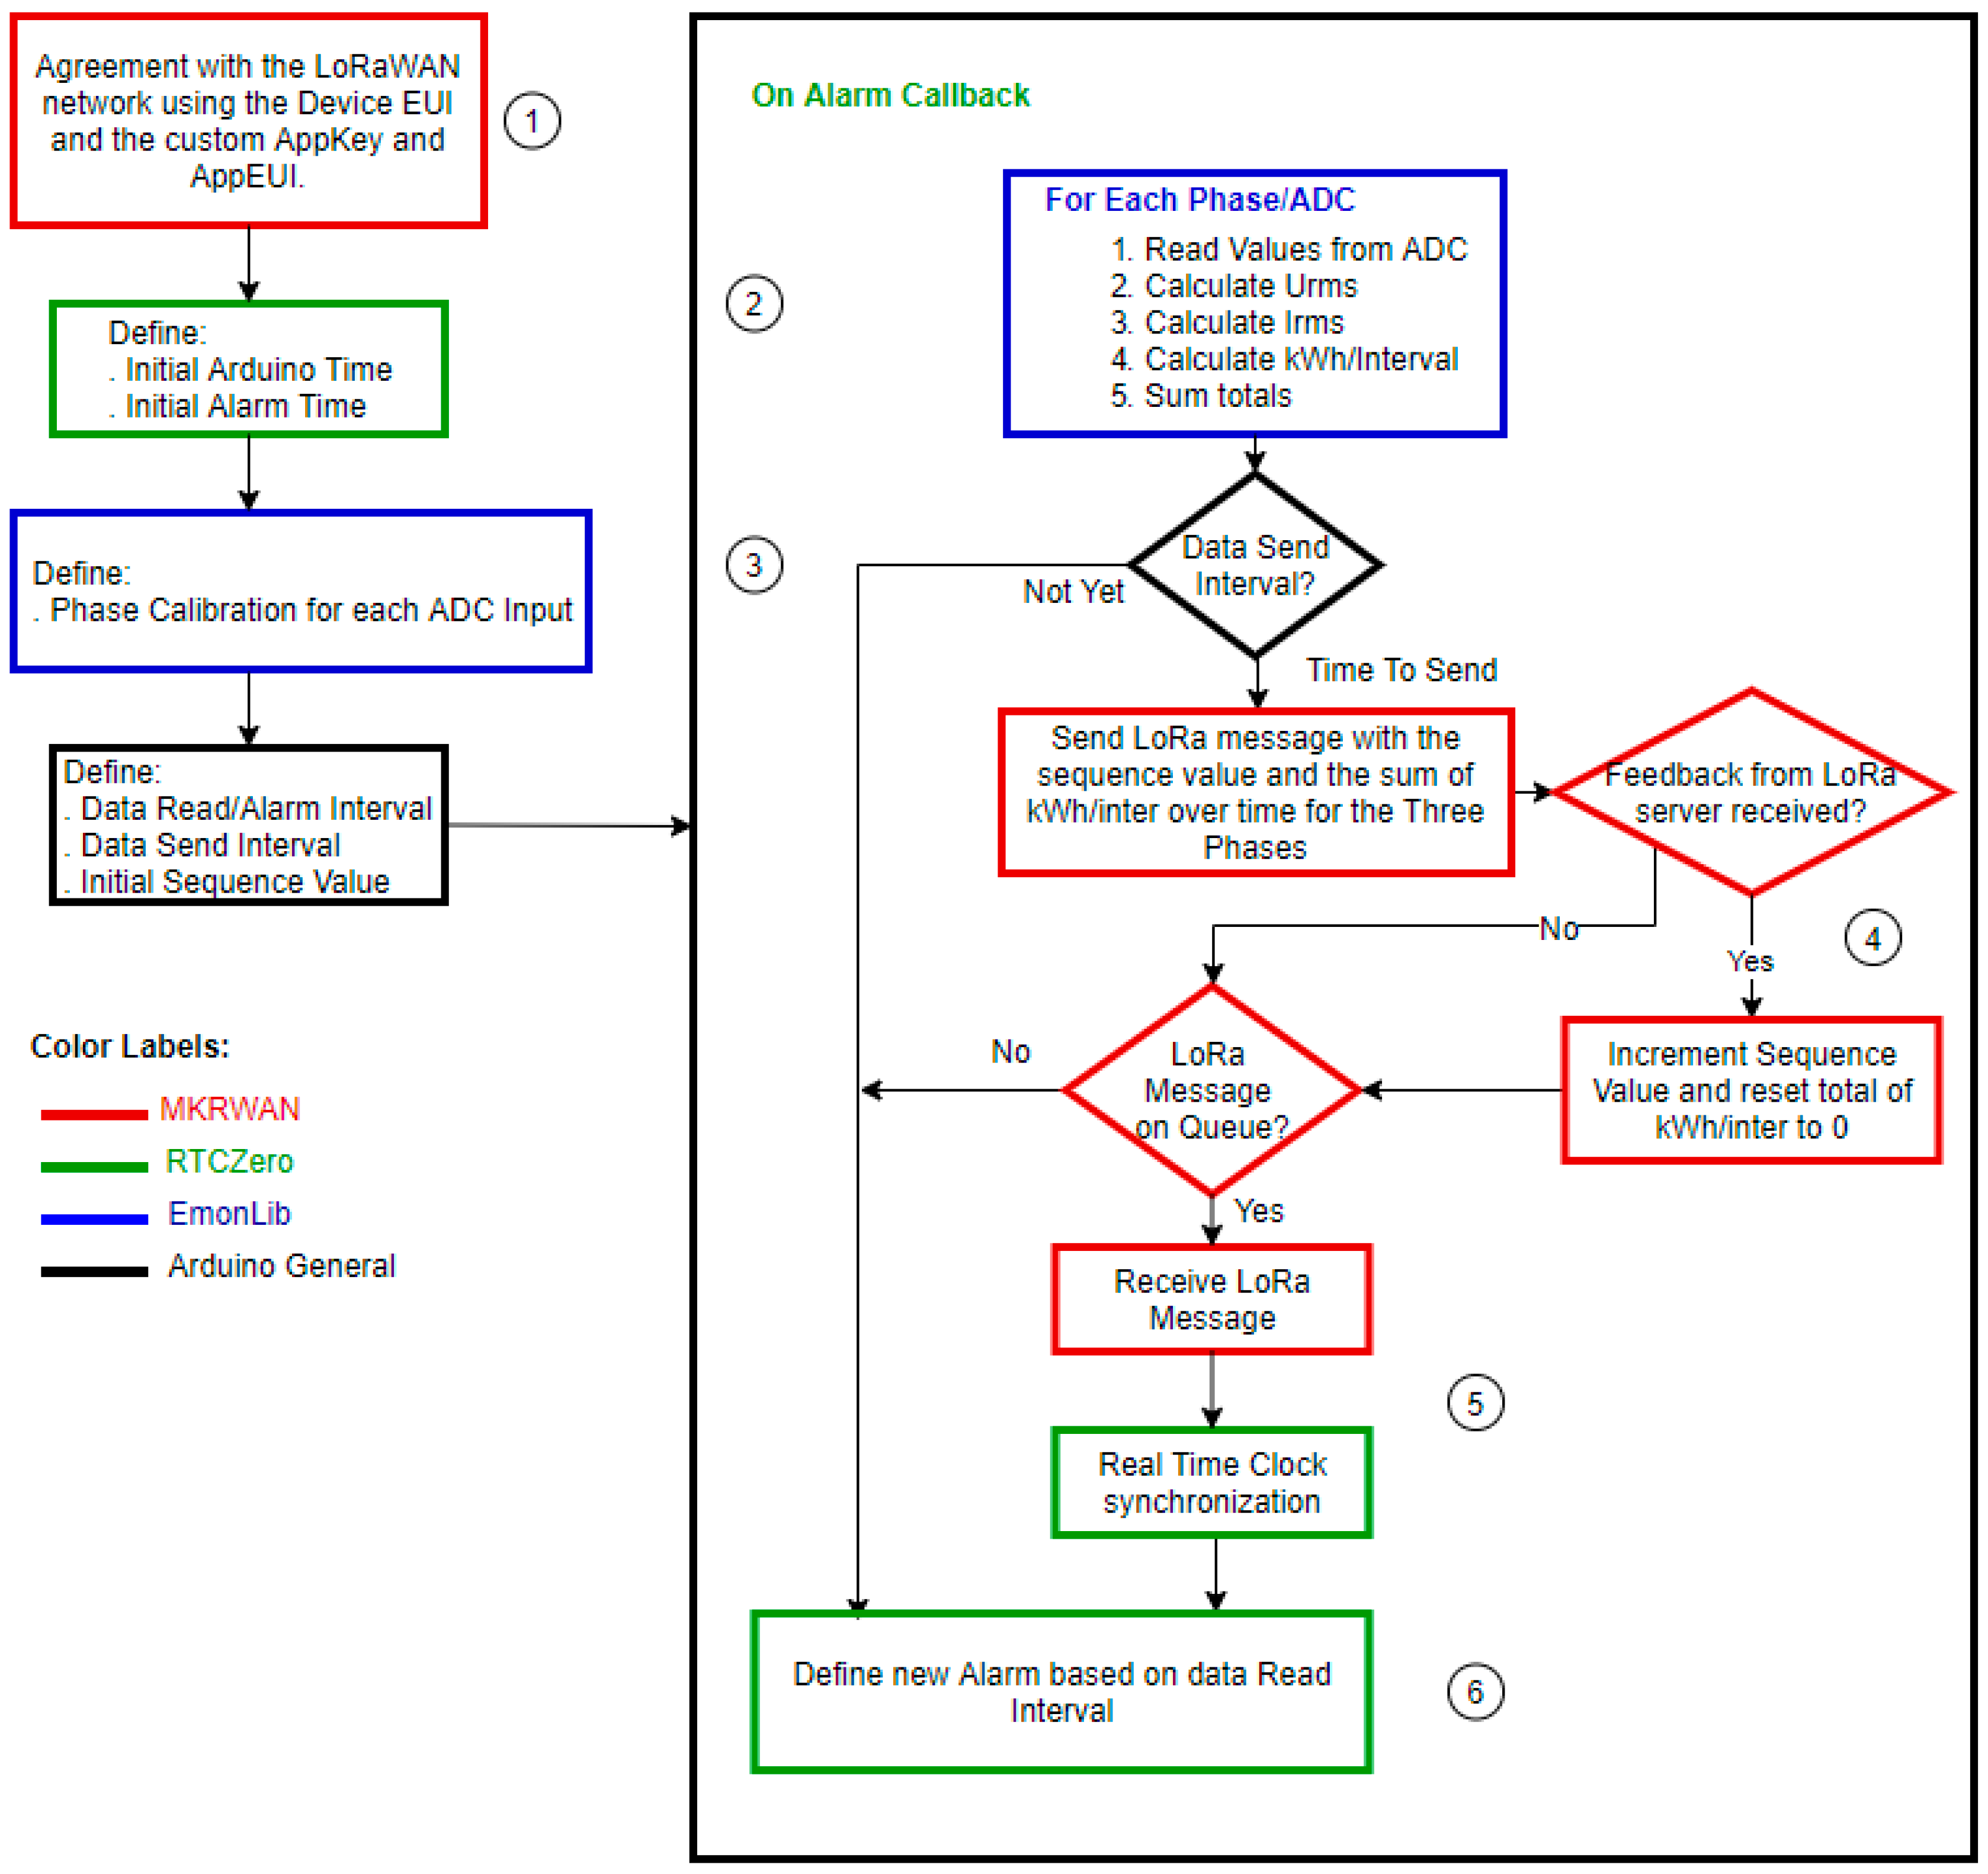
The Arduino is the main communicator with the servers. It receives data fed by the current transformers, making it into kilowatt-hour per data read interval, summing it to total value and then, at a data send interval, send that value through a LoRa network to a LoRa gateway. It is also able to receive messages from the application server when needed.
Three fundamental libraries are necessary:
- MKRWAN
- ○
- This library provides an API that uses the built-in LoRa chipset to receive and send messages through LoRaWAN.
- ○
- With this library, there is the possibility to define keys and get the device EUI from our device to then create an agreement with the nearest gateway.
- ○
- After an agreement is created, data can be sent to the LoRaWAN network, and each time a message is sent, two types of messages can be received from the LoRa server.
- ▪
- The first message is the feedback acknowledgment from the LoRa server, indicating that the LoRa server received a message, sent automatically for each data uplink received by the LoRa server.
- ▪
- The second message that can be received from the server are messages that will serve as commands that permit the board’s RTC (Real-Time Clock) to calibrate itself in case there is an issue with the timings. These downlink messages are sent by the application server and are put on the queue at the LoRa server waiting for a new data uplink
- RTCZero
- ○
- This library provides an API to use the built-in RTC in the SAMD boards.
- ○
- Real-time clocks provide a means of creating alarms and defining the board’s time in the necessary instant.
- ○
- RTC works in a parallel frequency to the normal clock frequency of the Arduino, so it keeps running even when the Arduino is in sleep mode.
- ○
- RTC requires re-synchronization from time to time so that it does not become unsynchronized with the actual real-time.
- EmonLib (Arduino energy monitoring library)
- ○
- This library provides an easy way to transform the input voltage from the ADC into a current readable value that can be calibrated.
- ○
- For each reading, we can define the number of samples for the library to calculate; the bigger the number of samples, the longer the method will take to calculate the Current.
- ○
- The library uses the root mean square to calculate the current:
- ▪
- Supposing N equals the number of samples, and u(n) being the voltage sample that we get from the ADC:
- ▪
- This (1) Urms value is then multiplied by the calibration coefficients, based on the value we define at the beginning for each ADC input.
- ▪
- Then using results in the current value, we call this Irms that will be used to calculate the apparent power by being multiplied with a voltage constant
- ○
- Each phase calculates its own apparent power in kWh/Interval (kilowatt-hour per data read interval), which is then summed into a total kWh/interval value that is kept in the Arduino’s memory until it is sent as a message. The message is only considered “sent” when feedback from the LoRa server is received, and only then the sequence number is advanced, and the total kilowatt-hour value resets to zero.
- ○
- Calibration:
- ▪
- Calibration of the sensors is done for each ADC input.
- ▪
- Calibration has theoretical value based on the CT sensor rating and the burden resistor used:
- ▪
- Theoretical values, however, do not account for hardware error variations so the calculated value should be used as a baseline and then adapted using real values comparisons.
- Errors can come from several factors, such as:
- ○
- CT materials.
- ○
- Burden resistor ± 1%.
- ○
- Arduino analog reference.
- ○
- Power source.
- To provide real values, an amperometric clamp Uni-T UT202 (Uni-t in Opava – Czech Republic) was used for comparison in real-time calibration.
Arduino MKR 1300 WAN: Workflow
Finally, in Figure 3, we can see the general workflow for the algorithm used in this board, and the overall workflow used to measure power consumption with Arduinos.
3.2. Communications Layer: LoRaWAN
LoRa is a spread spectrum modulation technique derived from chirp spread spectrum (CSS) technology with a long-range, low power, wireless chipset whose aim was to resolve challenges, such as energy management, natural resource reduction, pollution control, infrastructure efficiency, and disaster prevention. Operates on the LoRaWAN standard are maintained by LoRa Alliance whose ecosystem consists of over 500 members and includes over 100 public network operators with service in 51 countries [25]. LoRa boasts seven key principles: security, low-power, long-range, low-cost, mobile, high capacity, and standardized [25].
According to the TTN, LoRa has 60 gateways in Portugal, the biggest contributors being both Coimbra and Lisbon [26]. However, TTN, a public community network, is not the only contributor to the LoRa network. According to the LoRa Alliance, several European ISPs have already some form of LoRaWAN deployment [27].
The reason we choose LoRa for this project was the need for a network that could work in several environments without the need for a nearby gateway and was partially unfazed by most obstacles. We choose LoRa for the following reasons:
- A Wi-Fi network is a low range, and it loses a lot of strength between walls so in areas with only one Wi-Fi Router it would be complicated since the Routers and the electrical boards are not usually right next to each other.
- In the university experiments, we noticed the Wi-Fi network was protected with authentication that required both a user email and a password. Most IoT Wi-Fi boards do not work properly since they are only prepared for WPA authentication, so we needed a way to circumvent this.
- In the near future (not on the scope of this work) the solution is going to be upgraded from being powered through the plug to being powered by batteries and LoRa is perfect for that.
LoRa Limitations—LoRa spreads its communications between different end devices between different channels and frequencies. This happens because end-devices can have different communication qualities, such as range, message size that affects duration, materials between the device and the gateway, etc. So for each end-device, they are assigned an SF (spreading factor) based on the quality of the communication. Each spreading factor has different rates has seen in Table 4, [28].
For clarification, a symbol represents one or more bits of data, each symbol can hold up to 2^SF chips. An example of this is SF12, which means that each symbol can carry 12 raw bits of information, and there are 4096 unique chip values ranging from 0 to 4095. The bandwidth is the number of wave cycles per second, and the chip rate is always equal to the bandwidth (chips per second). The bit rate will be calculated using
Coding rate (CR) is redundancy, or forward error correction (FEC), and it is adjusted depending on the channel quality.
The most important conclusion we can take from this table is that the lesser the SF, the faster the data will reach its destination (time per symbol) and the bit rate will be higher.
Bandwidth, SF, and CR are adjustable manually, but they are normally done automatically by agreements between the devices and the servers using ADR (adaptative data rate)
When it comes to reliability, LoRaWAN uses acknowledgments of frames in the downlink on the receiving windows, and devices should actually try and minimize the request for acknowledgments to avoid reaching a capacity limit. Acknowledgments also cause significant battery drain since they are using the communication windows [13].
LoRa, as a network is not the best candidate for critical real-time solutions due to its latency limitations even at lower spreading factors (SF = 7) and sending data of 10 Bytes, may even lead to delays of 400 ms. This limited nature of the network also means that the bigger the packet and the lengthier the range, the more time this packet will stay on the air [13].
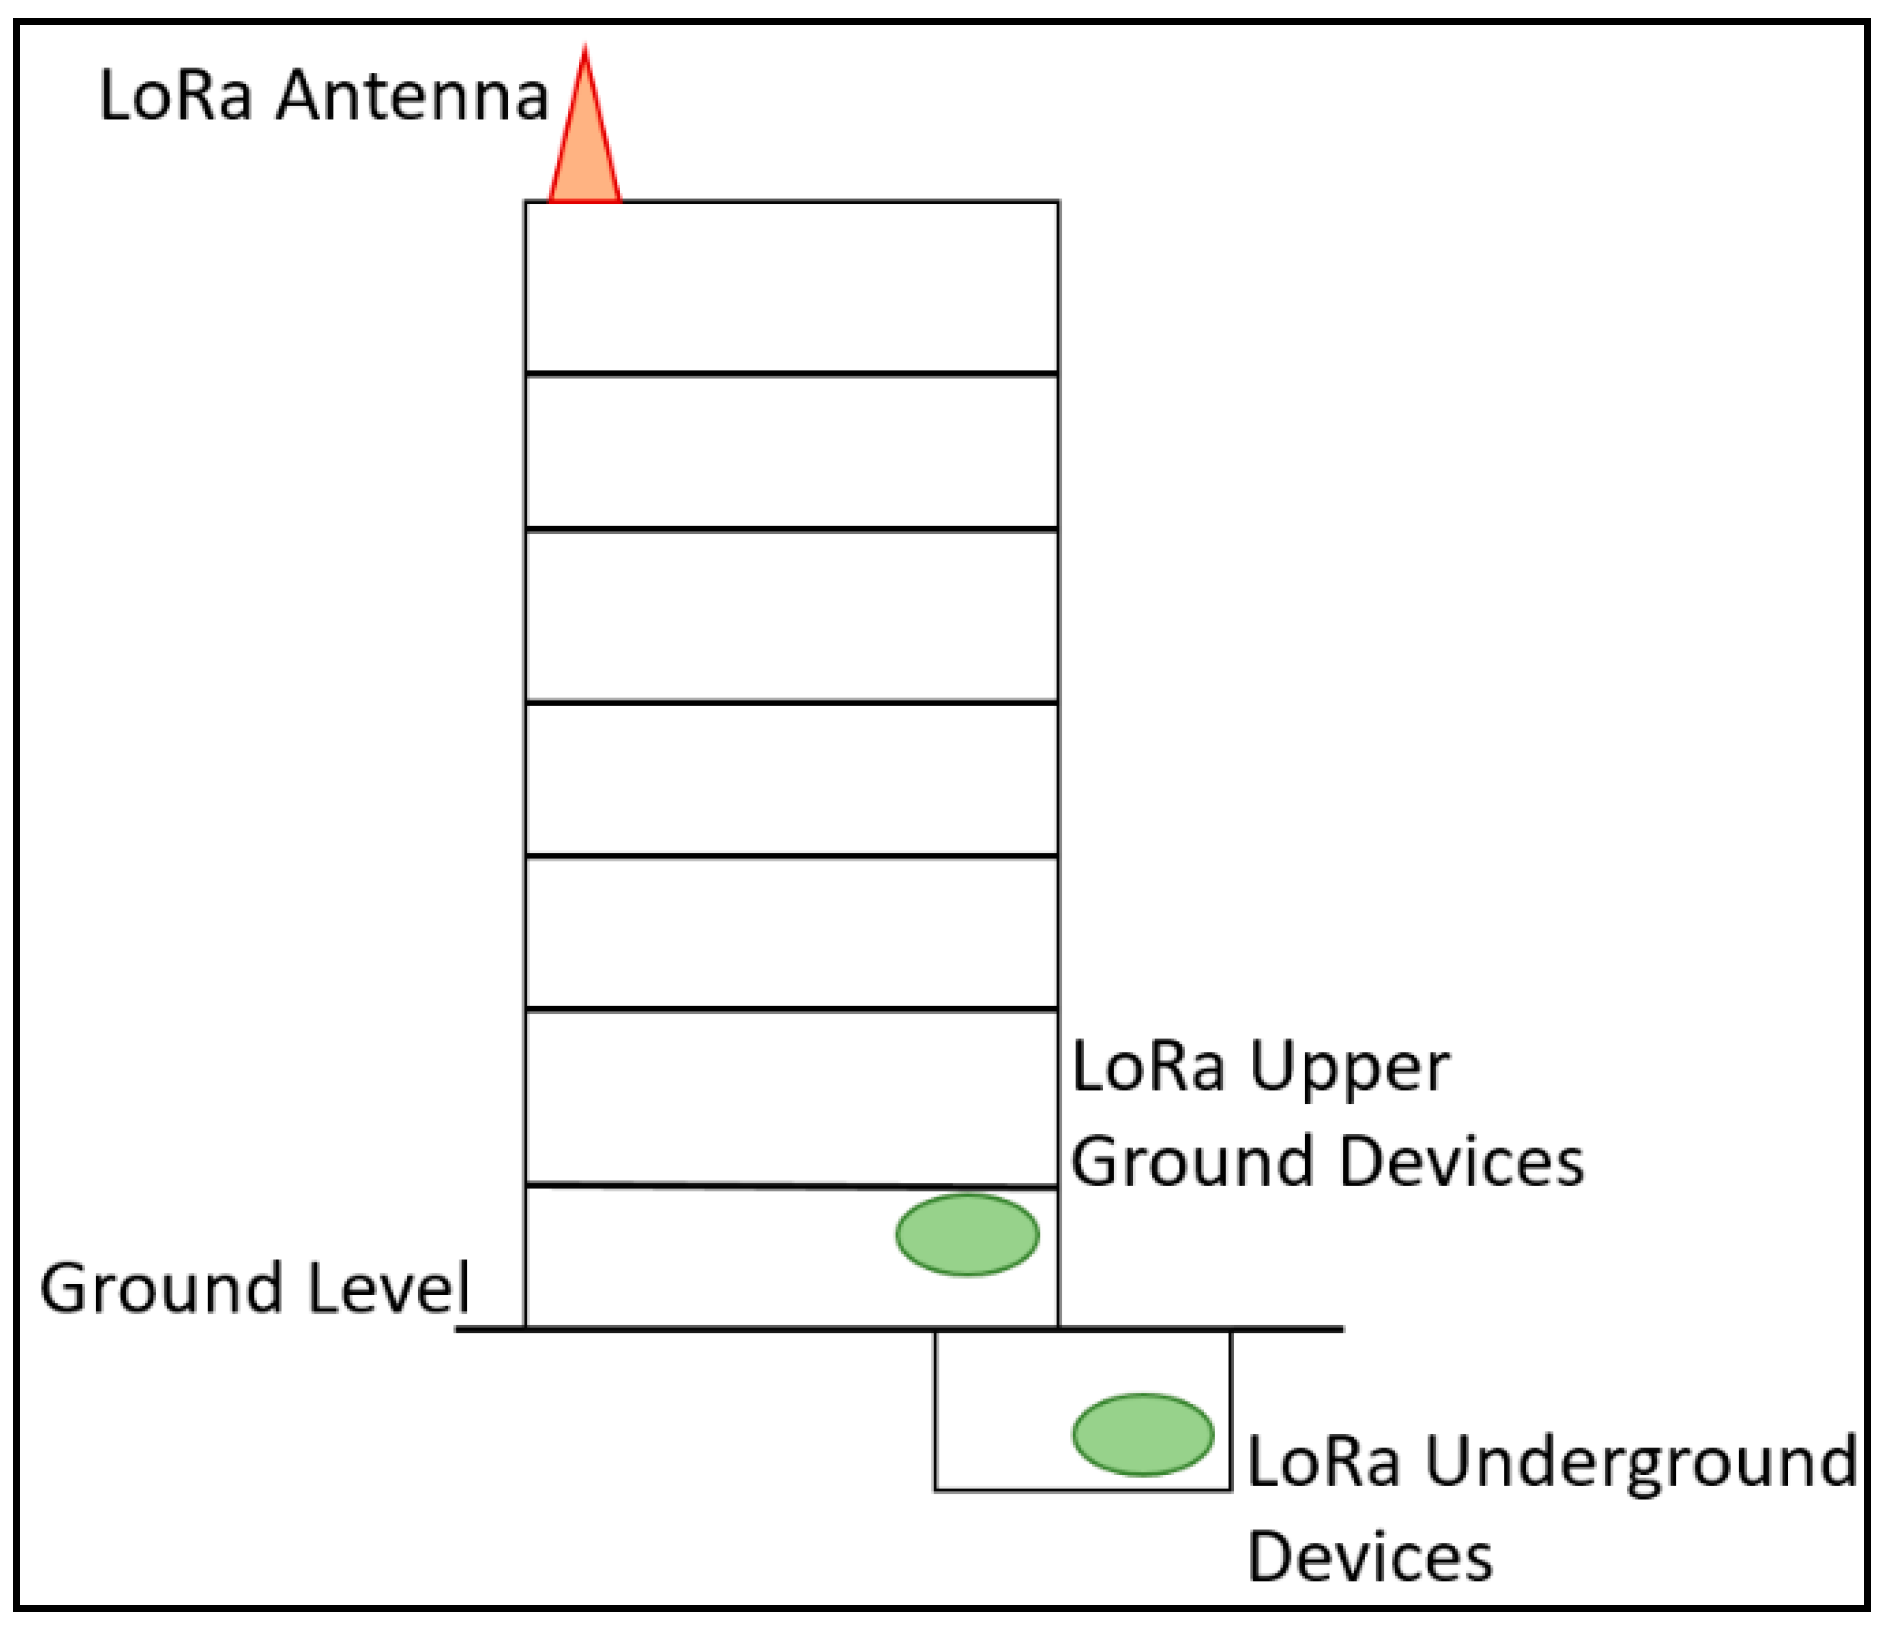
University LoRa Experiment Reliability Results—Sensors in one of the experiments (University experiment) were placed both in an underground auditorium and in an auditorium that could be described as being ground level, shown in Figure 4. The difference in both these devices was noticeable, not only in the receiving of acknowledgments but also in several delayed packets. In Table 5, we can see the main difference between both groups of devices. The reason for this small experiment was so we could see how much the location of the devices would affect the end result of the data, based on the data loss and delays. We wanted to see if the underground devices were reachable even on a location where concrete covered the whole room. The results were positive, while the underground devices did get a worse communication with the gateway, the final results, shown in Section 5, were not affected badly.
Missing acknowledgments were detected on the application server using an algorithm (explained in Section 3.4) that tracks these issues based on the sequence value received from the end-device, on delays there was no need for an algorithm since every device is set to send every 10 min and the sensor’s time is synchronized with real-time with the help of the application server. Sampling for all the data presented were 65,877 packets for the missing acknowledgments and 53,026 packets for the delays.
As we see here, we noticed that a significant number of ack downlinks are lost in the air, due to the small receive windows of Class A devices and a connection that is not completely optimal. No lost data uplinks were detected during the experiments.
On all the other experiments (shown at the results table below) done in this research, a LoRa gateway was created and placed in a nearby area with an internet connection. Therefore, all connections were performed in SF7 with no network issues.
3.3. Data Layer: Web/Application Server and Database
The application server, running on a Raspberry Pi, has four main functions:
- Receive reading data, treat and analyze that data, and store it in MariaDB.
- Calibration of each end-device’s real-time clock.
- Correction of issues caused by missing uplinks and downlinks.
- Replication and union of databases into one live database.
- Raspberry Pi was chosen as the hardware for this server for the following reasons:
- Low power consumption.
- Unix based OS (Debian/Raspbian), which means it is open-source and, as such, free and, to some degree, safe.
- ○
- Acceptable hardware specifications compared to some free cloud options in the market.
- The easy portability of the hardware and, in some cases, the software too.
- Ease of use.
- Low-cost and durable.
The HTTPS application server was created using Flask, a microframework based on Werkzeug and Jinja 2. The reason this framework was picked can be seen as the same reasons his creators called it “micro” framework:
- Ease of use but also easily extensible. The non-structure means that the handling of HTTPS requests are only limited by the knowledge of the user when it comes to python request programming, it also means that in most cases, there will be no structural bloat as in other frameworks, such as Django.
- Databases in use are up to the application developer. Frameworks tend to be able to work only with a limited set of databases. Variations to those databases tend to require a bit of work on the developer part. With Flask, the developer can choose which database it feels more comfortable with and just use the APIs.
- Default options are easy to change, and the framework can easily handle multiple libraries. No structural bloat also means that there will be less external libraries working behind the scenes, so there are more resources for the developer’s own libraries.
The application server also uses an OpenWeatherMaps API to obtain outdoors temperature that will then be used for further analysis, an example being on Section 5.2. OWM API is completely free and does not have monthly limitations on its base model, unlike some competitors.
The server connects to a MariaDB database. This database server is completely free and open-source with a great variety of features while also maintaining backward compatibility with MySQL.
However, a lot of IoT solutions nowadays already tend to shift to NoSQL, especially when the data generated reaches levels of Big Data dataset size, making the traditional relational database struggle with resources. NoSQL presents different techniques that can be chosen based on the needs of the developers. They normally present a flexible schema that does not require the developers to create a fixed schema beforehand, they are also highly scalable by managing to store large amounts of data and process it by creating nodes, replication is also facilitated due to the nature of the data storage [29]. For these reasons, we could have chosen NoSQL, however, querying in NoSQL often requires more complex queries or more advanced knowledge that we did not possess at the time. Data volume was also not an issue even with several devices connected, and while simplicity is vouched by document-oriented or key-value databases, in our case the simplicity came from our relation between tables with different attributes in a star-schema-like format.
The database schema (Figure 5) used for this work contains five main tables:
- Reading: the main table and connector to all other tables
- Date and Time: both these tables present information based on temporal marks that simplify the analysis of the Reading entries
- Device: contains information about the sensors, the locations they are placed, and what they are measuring. It is used both to feed sensor information to the server and to help the consumption analysis.
- ○
- Active attribute tells the server if it should expect data uplinks from a certain sensor.
- ○
- Correction attribute tells the server what the proper time it should expect from the sensor is, and it also serves as an indicator as to whether that sensor requires correction or not.
- ○
- DevType, indicates the type of sensor, Arduino (made in this work) or third-party.
- ○
- Margin acts as a lower limit to values, to remove outliers caused by small reading errors
- Alert: This table, not connected to any other table, is used to present alerts when it comes to the communication layer’s error, such as delays or missing acknowledgments. When an error is found a new entry is added to the database, where the description tells us the type of error and the value tells us the degree of that error.
- Other Tables based on the implementation (optional): tables that can be added to the database based on where the solution is being used (example: class, for university implementation, shown in Figure 5)
As we can see from Figure 5, this database is based on a star schema model used in data marts, although, most of the rules for the creation of star schemas were not used. The decision for this type of model came from two main factors:
- Simplicity
- ○
- If each “dimension” table (the tables around reading) have pre-defined values, those values can easily be called when inserting a reading entry and then easily queried when the analysis is required.
- ○
- Simple queries create performance gains.
- Storage efficiency (less space occupied overall) and therefore, increased performance when using queries.
With over 300,000 lines added in the reading table over the course of this work, the size of the database reached a rough estimate of 42.6 MB. Overall the size of the database and the resources required will normally depend on how many devices connect to one database and what interval they are sending data.
Application server: Data Treatment—Before adding data from the readings into the database, we need to treat that data and generate information based on the attributes we have at work. The server does this work, it generates data based on the readings it gets from the sensors. There are two main approaches to obtain data using this server:
- Directly from the sensors and into the database
- Derived from sensor’s reading data
- Data that uses readings from sensors to generate new data.
- Derived data is important because sometimes, due to the way electrical boards were made, there is either no space between wires to add a current transformer or the phases are all mixed up.
- It is based on a simple json file that the user can append new information for the server to work with
Example:
- ▪
- Let us say that it is a current measurement from a sensor.
- ▪
- it is another current measurement.
- ▪
- it is yet another reading.
- ▪
- From these three measurements that come from the sensor, we can derive the following data:
- it is derived data that will, also, be added to the database.
3.4. Information Layer: Dashboard and Analysis
The dashboard done in PowerBI provides means to visualize the data in a timely manner when the users want, the main objective is to provide day to day information using descriptive analytics that can help in managing the energy consumption of the facilities that are being measured, both in a real-time environment but also in the long term. This type of analytics (descriptive) allows us to understand what is wrong and what is right and the expected outcome of this part of our system is to learn from past behaviors that can be used to influence the outcome of future events.
The predictive analysis was also considered, and a set of models were tried, however, the focus of this work was not to try and create forecasts on the future. Furthermore, one principal issue encountered when trying to do predictive analytics was the lack of data volume for the timeframe used, which would compromise the results and the outcomes.
Once again, the database we used was MariaDB/MySQL, which then copies its data in a local PowerBI that contains a database of its own. As for the python scripts, the data were obtained with the help of both the PyMySQL library and the Pandas library, which offers built-in MySQL features.
4. System Implementation
4.1. System Testing
To make sure the system was working properly before being implemented into real-life situations, this is a non-exhaustive list of some of the test performed:
Testing: End Device
For the first calibration (and following calibrations too) an amperometric clamp was used to find the real value and calibrate the sensor based on those values. Different burden resistors were also used to test the accuracy of the sensor on different environments and see if there were any improvements to be made. Still, on the topic of calibrations, tests were also made using different wires and variable currents being passed through those wires to find any issues that could arise. Subsequent calibrations in real solutions were done using both the theoretical values and the amperometric clamp and were required for each new device.
To test the network, several sensors were left running for some weeks, this led to the discovery that the Arduino’s integrated RTC gets desynchronized with real-time by one second every few hours (hours depend on the board), this meant there was the need to correct the device but since we were using LoRa that posed a challenge because of the Class A limitations. After the solution was implemented, several more days of testing were required.
Several tests were also run to see if the Arduino board could handle power outages and still keep running when the energy went back on (In Wi-Fi-based Arduinos this is an issue, with LoRa it was not).
LoRa network failures were also simulated to see if the device could connect and reconnect without any problems, even in higher spreading factors environments.
Testing: Application Server
As a server, several stress tests were required to run to see if the server could handle receiving, processing, and finally, inserting into the database large volumes of data at the same time, and as such, 200 different packets were sent to the server every minute for over an hour to verify these issues. The 200 packets were different to see if the “derived data” and the correction of missing packets were working properly.
There was also the need to check for memory leaks and exceptions, so a test consisting of continuous sending of different types of malformed packets was conducted.
It was also important to know how many messages the server could send to the LoRa Server at a given time, so over 200 messages in a minute were sent during a few minutes, to see if the LoRa server itself could handle them.
To test the backup procedures and replication to the database, a few tests were also performed, for example, by turning off the network interface while a replication job was ongoing to see if the data did not get repeated on the databases and if all data was sent over the next backup job.
4.2. System Implementation
Finally, we needed to implement our solution. One of the greatest difficulties we had when it comes to power consumers using electrical boards was the lack of space on those electrical boards and the fact that in most cases phases not only belong to several consumers, but they may also have small mixing issues. Figure 6 showcases one of the several solutions created. We applied our solution to different environments to validate it, being each case below a different application of our work.
5. System Validation and Results
5.1. Case Auditoriums Results
We implemented our solution to two auditoriums, Silva Leal, and C103 with the focused objective of identifying waste in the month of May. The month of May was chosen because out of the months measured, it was the only month with no big holidays. In the auditorium Silva Leal, a value of 642 kWh per month was being spent on lighting only, making up 85.03% of the total energetic consumption of that auditorium belonging 9.47% to the HVAC and 5.5% to the electric plugs. Below in Figure 7, we can see the comparison between two auditoriums, the first one being the auditorium Silva Leal and the second being a usual auditorium with no lighting problems whatsoever. The reason for this wasting is quite simple, light switches are not inside the auditorium and only accessible through the electrical board. Therefore, the only people allowed to turn that switch on or off are the security guards for the building who, most of the times, will not turn it off between classes, and sometimes they turn them on before classes start and then leave it on until the university closes the building for the day. In the auditorium, Silva Leal, out of that 642 kWh used for lighting, over 248 kWh was wasted, which is about 38% of the total lighting consumption and 32% of the overall power consumption for the month of May only.
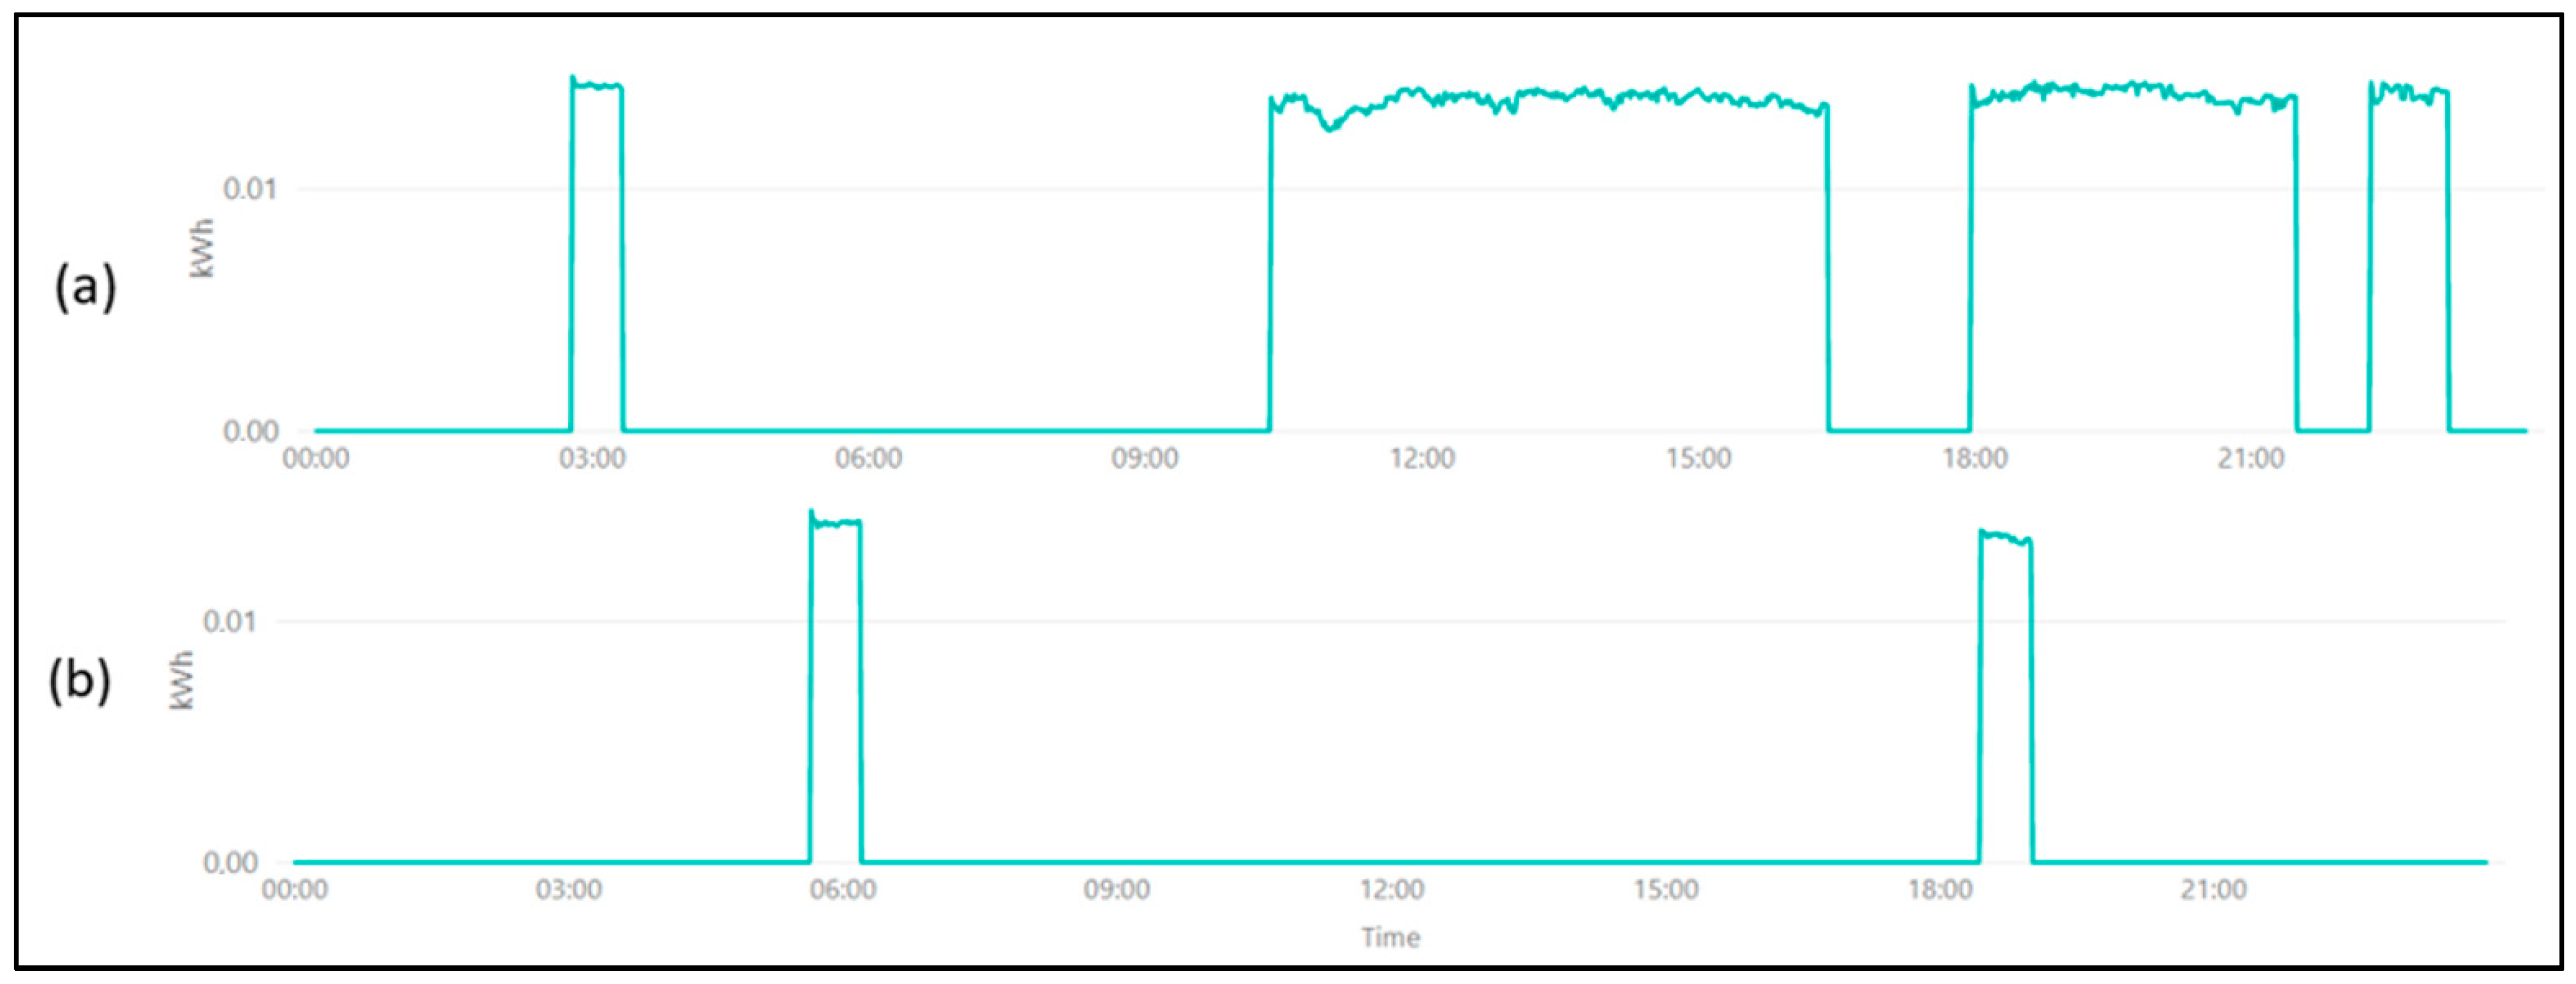
Auditorium C103 on the other, as seen in Figure 7, had no actual lighting issues due to the accessible light switch. However, it still had wasted energy, and this waste comes in the form of 142 kWh per month on power plug consumption. This value comes from the fact that the auditorium’s computer used in classes is never turned off. Therefore, it wastes power during weekends (Figure 8a), off-hours (23:00 h–08:00 h) (Figure 8b) and between classes.
As we see on Sundays (Figure 8b), we know that when no one uses the computer it wastes 2.75 kWh per day. Therefore, if we multiply 2.75 × 365 kWh we obtain a max of 100,375 kWh/year that could be wasted, and since this is an issue which occurs in several more auditoriums this value could increase tenfold.
5.2. Case Private House with Heated Pool
In this case, besides identifying waste, we wanted to test our system’s ability to draw patterns for us to recognize them. We used a top-down approach by first measuring the house’s entire consumption. Then for each new pattern, we created a supposition to what it could be. Finally, we measured phases based on that supposition to validate it. In this case, we found out that the biggest consumers were both the pool heater and water pump. This implementation ran between the 5th of July and the 2nd of August, summer in Portugal.
The total power consumption (example of a day in Figure 9) was kept running at all times to help in validating our findings. This total power consumption was also used to find waste and evaluate the Pool Heater plus the Pool’s Pump.
As for the biggest consumers, we know two important things:
- The pool heater is one of the biggest consumers.
- ○
- The pool heater will always turn on at 09:00 h.
- ○
- It will keep running until it reaches a water temperature of 28 °C
- ○
- It will restart running when that temperature reaches a lower threshold (unknown).
- ○
- It is turned off completely at 23:00 h.
- The pool pump that will transfer the heated water is almost always running. Supposedly it is turned on at 09:00 h and off at 23:00 h. Based on the data we have, an approximate value of 20. kWh was spent every day just on the pump.
Figure 10 shows one example of the issues with the pool’s heater which from time to time turns on and never turns off until 23:00 h, this is not something that happens every day, but it is recurrent.
This, however, did not feel like the correct functioning of the pool’s heater. The normal workings of the heater (days where the heater was not kept on for 14 h) normally point to a maximum of 7 h, so 14 h seems to be an error (too much of a difference between 7 h and 14 h with no values in between). So to see if there was a correlation between this anomaly and the outside temperature a scatter chart was created that correlated the daily time on (hours) of the heater and the maximum temperature reached on that day. Maximum because the heater was only on during the day and the average temperature would also count the night time’s temperature, which could also get pretty low, thus skewing results since the pump was not working at that time, so water flow was stopped. Figure 11 shows the result, and as expected the time the heater was on varies with the maximum temperature, the higher the temperature, the lower the time seemed to be. However, we can also notice that sometimes the heater was kept on all day without any apparent reason. Therefore, this is an anomaly.
5.3. Case Agriculture Pump in a Farm
We were given the opportunity to work with this pump from 13 July to 20 July, and since one of our objectives was to relate power consumption with different factors from different environments, we decided to take it to see if we could actually correlate the power consumption with the water consumption used for agriculture.
This pump works the following ways:
- The pump has a “balloon” that holds water.
- When that “balloon” loses water, the pump will replenish it once that loss reaches a threshold.
- Depending on how much water it needs to be replenished, the pump will increase or decrease power consumption.
Setting aside, the normal functioning of the pump during plant watering periods (approx. 16–20 kWh for 5 h depending on the chosen setting) we discovered that, while idling, the pump would consume power, however, as mentioned, the pump only works when the balloons need to fill with water after the threshold, which means that the most likely scenario is water leaks somewhere along the tubes. Figure 12 shows the kind of consumption on a day where no plant watering was done.
5.4. Case Apartment’s Electric Boiler
For our last case, we decided to evaluate the normal functioning of an electric boiler for one month. First of all, we need to describe the environment in the apartment:
- Four people live in the apartment.
- Two people always start their day in the morning.
- One of them goes to school.
- The boiler has a capacity of 100 L and works by heating and storing hot water when it is not full.
Over the month, 164 kWh were consumed, 5.2 kWh/day on average. The patterns showed us that the hottest water consumption appeared at between 08:00–09:00 and 20:00–21:00, as expected since those are the time’s people normally take baths or wash dishes in Portugal.
To more deeply evaluate the boiler, we decided to go deeper on the daily consumption:
- Figure 13a shows us a day where all the hot water was used during the morning. And so, we know that at about 0.8 to 0.9 kWh the boiler is going to take approximately 6 h to fill up completely. This means that to fill the entire boiler, approximately 4.8 kWh will be used, which translates into 0.048 kWh or 48 Wh/L at 0.8 kWh. However, the boiler is rated to be able to fill the 100 L completely in 4 h, so there might be some issues related to the efficiency of this particular boiler
- Figure 13b shows a day when no hot water was used, which, in turn, shows us the re-heating timer or the boiler (when no one uses hot water). However, this value can vary depending both on the exterior temperature and the container’s temperature. In Figure 13a, we can also see the re-heating periods between 03:00 and 03:30.
Finally, we wanted to know what was the average time between each boiler heatings/re-heatings. The value obtained from a simple python script was 5 h and 19 min which surprisingly, most of the times re-heating would end up being at around 03:00, although in a situation where no one is using hot water the time between re-heats, during the day, could reach almost 12 h, such as in Figure 13b. Power consumption for re-heating was approximately 0.4 kWh in 30 min, which is not a big consumer.
6. Conclusions
In this work, we set out to create EnerMon, a flexible, sustainable, and efficient power monitoring IoT system, capable of measuring any sort of electrical phase in different environments and use cases while applying edge computing capabilities to find anomalies, patterns, and overall waste. This work improves previous works on energy building management [19,20] and energy monitor process in building park space for electric vehicle charging process [21].
This work was applied in auditoriums, farm, pools, and apartments and as such, proved itself to be flexible enough to call it a success while also finding several anomalies in each case that proved that the system is working as intended. Six installation processes were performed, using the developed system, where the device’s hardware, the data layer, and the information layer did not require any modification at all for the different cases:
In the auditoriums, the lack of a proper lighting management system led to a massive waste of power every month. This research also helped when it came to HVAC disaster management and reporting, i.e., usage of power but no noticeable temperature reduction overall, or simply preparing the auditoriums to improve the comfort of the students with technologies, such as AC automation. In the house with a pool, the lack of maintenance and control of the pool’s heaters led to extremely large wastes every month. The monitoring of the power consumption in a pump used for Agriculture led to the belief that leaks are a recurrent problem while the pump itself was not a big spender. In the apartment’s boiler, there was a doubt that the boiler was working as it should since it took more time to completely fill its entirety than the rated time of the boiler.
LoRa as the chosen communications technology did not prove to be an issue since the data were kept safeguarded by the end-devices memory when the LoRa packets were not received by the server, however, if we are going for pattern recognition it might be better to try and keep the sending interval as low as available with LoRa, which might be hard to find the perfect “sweet spot” since LoRa can have issues when it comes to sending data at low intervals.
Overall, this work managed to achieve its objective of creating a low-cost, flexible, and sustainable IoT system that allows for an easy installation process that can be applied to different environments to identify energetic footprints and waste, based on different variables/factors, while also managing to find patterns that can, over time, help in identifying appliances but also in creating a baseline for how an appliance should be working and thus being one more factor in helping to identify the normal and abnormal functioning of appliances.
Finally, we want to highlight that this work was in no way something aimed to reduce consumption and create improvements by itself. It is a work focused on monitoring and presenting the data to influence the users into implementing those changes themselves, changes that may come in many forms such as
- (1)
- Decision making when buying certain equipment;
- (2)
- Decision making when using the equipment and when they are able to turn it off (especially the automatic ones);
- (3)
- Replacement of older appliances that could improve energy efficiency;
- (4)
- Substitution of certain lifestyles. Example: using an electrical fan instead of the HVAC during not-so-hot summer days.
For all these points there is, of course, the need to be aware, to know what is being consumed and what are the biggest offenders and that is the reason this research into power monitoring sensors was conducted.
Author Contributions
D.S. is a Master student that performed all development work. J.C.F. is a thesis supervisor and organized all work in the computer science subject.
Funding
This work has been partially supported by Portuguese National funds through FITEC programa Interface, with reference CIT “INOV—INESC Inovação—Financiamento Base”.
Conflicts of Interest
The authors declare no conflict of interest.
References
- Reinsel, D.; Gantz, J.; Rydning, J. Data Age 2025: The Evolution of Data to Life-Critical. 2017. Available online: https://www.seagate.com/www-content/our-story/trends/files/Seagate-WP-DataAge2025-March-2017.pdf (accessed on 23 November 2018).
- Newman, P. IoT Report: How Internet of Things Technology Is Now Reaching Mainstream Companies and Consumers. 2018. Available online: https://www.businessinsider.com/internet-of-things-report (accessed on 30 October 2018).
- Brunelli, D.; Minakov, I.; Passerone, R.; Rossi, M. Smart monitoring for sustainable and energy-efficient buildings: A case study. In Proceedings of the IEEE Workshop on Environmental, Energy, and Structural Monitoring Systems (EESMS) Proceedings, Trento, Italy, 9–10 July 2015; pp. 186–191. [Google Scholar]
- Balaji, B.; Bhattacharya, A.; Fierro, G. Brick: Towards a Unified Metadata Schema For Buildings. In Proceedings of the 3rd ACM International Conference on Systems for Energy-Efficient Built Environments, Palo Alto, CA, USA, 16–17 November 2016; pp. 41–50. [Google Scholar]
- Hamilton, E. What Is Edge Computing? 2018. Available online: https://www.cloudwards.net/what-is-edge-computing// (accessed on 17 May 2019).
- Chen, J.; Tan, R.; Xing, G.; Wang, X. PTEC: A System for Predictive Thermal and Energy Control in Data Centers. In Proceedings of the IEEE Real-Time Systems Symposium, Rome, Italy, 2–5 December 2014; pp. 218–227. [Google Scholar]
- Liu, Q.; Ma, Y.; Alhussein, M.; Zhang, Y.; Peng, L. Green data center with IoT sensing and cloud-assisted smart temperature control system. Comput. Netw. 2016, 101, 104–112. [Google Scholar] [CrossRef]
- Pocero, L.; Amaxilatis, D.; Mylonas, G.; Chatzigiannakis, I. Open source IoT meter devices for smart and energy-efficient school buildings. HardwareX 2017, 1, 54–67. [Google Scholar] [CrossRef]
- Ardakanian, O.; Bhattacharya, A.; Culler, D. Non-Intrusive Techniques for Establishing Occupancy Related Energy Savings in Commercial Buildings. In Proceedings of the 3rd ACM International Conference on Systems for Energy-Efficient Built Environments, Palo Alto, CA, USA, 16–17 November 2016; pp. 21–30. [Google Scholar]
- Develco. Develco Products Smart Energy. Available online: https://www.develcoproducts.com/business-areas/smart-energy/ (accessed on 25 April 2019).
- Sense. Sense: Home Monitor. Available online: https://sense.com/product (accessed on 25 April 2018).
- Engage. Engage: Efergy. Available online: https://engage.efergy.com/ (accessed on 17 May 2019).
- Adelantado, F.; Vilajosana, X.; Tuset-Peiro, P.; Martinez, B.; Melia-Segui, J.; Watteyne, T. Understanding the Limits of LoRaWAN. IEEE Commun. Mag. 2017, 55, 34–40. [Google Scholar] [CrossRef] [Green Version]
- Gloria, A.; Cercas, F.; Souto, N. Comparison of communication protocols for low cost Internet of Things devices. In Proceedings of the South Eastern European Design Automation, Computer Engineering, Computer Networks and Social Media Conference, Kastoria, Greece, 23–25 September 2017; pp. 1–6. [Google Scholar]
- Mekki, K.; Bajic, E.; Chaxel, F.; Meyer, F. Overview of Cellular LPWAN Technologies for IoT Deployment: Sigfox, LoRaWAN, and NB-IoT. In Proceedings of the IEEE International Conference on Pervasive Computing and Communications Workshops (PerCom Workshops), Athens, Greece, 19–23 March 2018; pp. 197–202. [Google Scholar]
- Kassner, M. Cheat Sheet: What You Need to Know About 802.11ac. 2013. Available online: https://www.techrepublic.com/blog/data-center/cheat-sheet-what-you-need-to-know-about-80211ac/ (accessed on 27 May 2019).
- Kasar, A.R.; Tiwari, S. Zigbee on Wireless Sensor Network. Int. J. Sci. Res. Eng. Trends 2018, 4, 1327–1332. [Google Scholar]
- Rapiński, J. The application of ZigBee phase shift measurement in ranging. Acta Geodyn. Et Geomater. 2015, 12, 291780. [Google Scholar] [CrossRef]
- Zigbee Alliance. ZigBee 3.0. Available online: https://www.zigbee.org/zigbee-for-developers/zigbee-3-0/ (accessed on 27 May 2019).
- Collotta, M.; Pau, G.; Talty, T.; Tonguz, O.K. Bluetooth 5: A Concrete Step Forward toward the IoT. Ieee Commun. Mag. 2018, 56, 125–131. [Google Scholar] [CrossRef]
- Z-Wave Alliance. About Z-Wave Technology. Available online: https://z-wavealliance.org/about_z-wave_technology/ (accessed on 15 July 2019).
- Wong, W.G. Q&A: S2’s Impact on Z-Wave and IoT Security. Available online: https://www.electronicdesign.com/communications/qa-s2-s-impact-z-wave-and-iot-security (accessed on 15 July 2019).
- Wall, R. YHDC SCT-013-000 Current Transformer Report. Available online: https://learn.openenergymonitor.org/electricity-monitoring/ct-sensors/yhdc-sct-013-000-ct-sensor-report (accessed on 1 February 2019).
- Eletronics Tutorials. The Current Transformer. Available online: https://www.electronics-tutorials.ws/transformer/current-transformer.html (accessed on 1 December 2018).
- Semtech. What Is LoRa®? Available online: https://www.semtech.com/lora/what-is-lora (accessed on 16 July 2019).
- TTN. The Things Network Portugal. Available online: https://www.thethingsnetwork.org/country/portugal/ (accessed on 14 September 2019).
- LoRa Alliance. LoRa Coverage. 2019. Available online: https://lora-alliance.org/lorawan-coverage (accessed on 14 September 2019).
- Lin, E.R.; Tourancheau, B.; Alphand, O. LoRa Protocol. Evaluations, Limitations and Practical Test; Universitat Politècnica de Catalunya: Barcelona, Spain, 2016. [Google Scholar]
- Corbellini, A.; Mateos, C.; Zunino, A.; Godoy, D.; Schiaffino, S. Persisting big-data: The NoSQL landscape. Inf. Syst. 2017, 63, 1–23. [Google Scholar] [CrossRef]
Figure 1.
EnerMon system design.

Figure 2.
Three-phase LoRa (Long Range) current sensor and current transformer (CT) sensor.
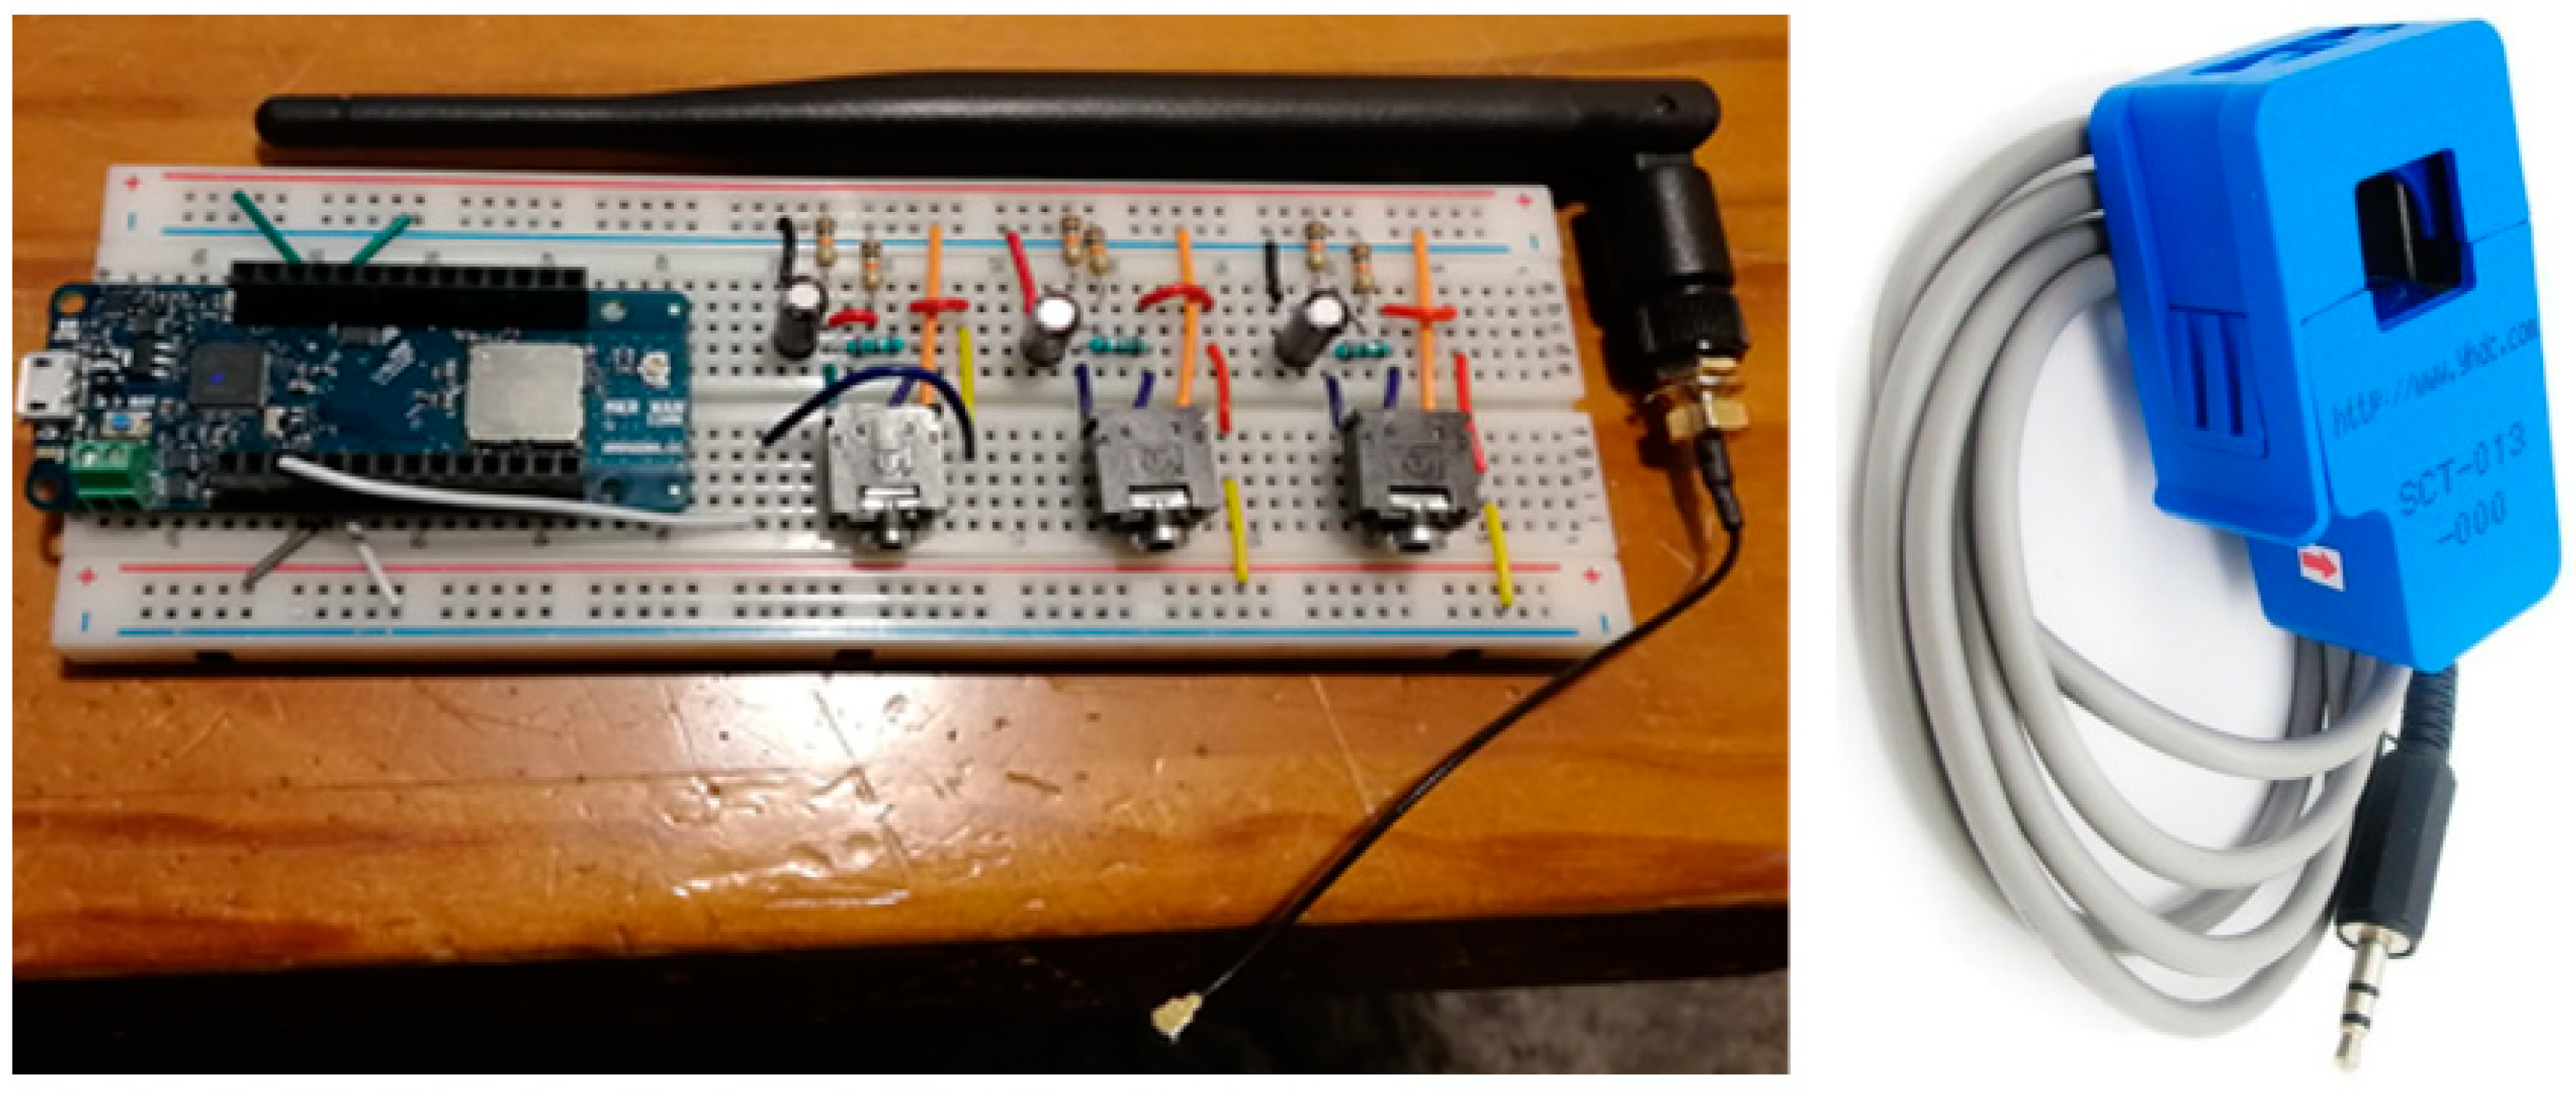
Figure 3.
Arduino workflow.

Figure 4.
LoRa (LongRange) devices in auditoriums.

Figure 5.
Database entity–relationship model.

Figure 6.
Final solution ready for Implementation.

Figure 7.
Daily difference in the sum of wasted power between the Silva Leal (upper) and the C103 (lower).
Figure 7.
Daily difference in the sum of wasted power between the Silva Leal (upper) and the C103 (lower).

Figure 8.
Wasted power consumption on the turned on computers during off-hours (23:00 h–08:00 h) (a) and Sundays (b).
Figure 8.
Wasted power consumption on the turned on computers during off-hours (23:00 h–08:00 h) (a) and Sundays (b).

Figure 9.
Total power consumption on the day of 16 July 2019.

Figure 10.
Global consumption shows unusual pool’s heater functioning on 17 February 2019.

Figure 11.
Relation between the maximum daily temperature and the time the heater is kept functioning.
Figure 11.
Relation between the maximum daily temperature and the time the heater is kept functioning.

Figure 12.
Regular idle pump routine.

Figure 13.
Boiler differences between diverse days, week-day (a) and holiday (b).


Table 1.
Related Works Table.
| System | Source | Sensor Type | Communication | Main Use | Commercial |
|---|---|---|---|---|---|
| EnerMon (This document) | Open* | Non-Intrusive: Current Transformer | LoRa | Any Power Source | No |
| PTEC [6] | Closed | Intrusive: Power Meter Non- Intrusive: Temperature Sensor | IEEE 802.15.4 Ethernet | Data Center Cooling | No |
| Open-source IoT meter devices for smart and energy-efficient school buildings [8] | Open | Non- Intrusive: Current Transformer | IEEE 802.15.4 | Educational Buildings / Any Power Source | No |
| Non-Intrusive Techniques for Establishing Occupancy Related Energy Savings in Commercial Buildings [9] | Closed | Non- Intrusive: Occupancy Sensor | Not specified | HVAC | No |
| Smart Energy by Develco Products [10] | Closed | Intrusive: Plugs, Meter Interface | Zigbee, Z-Wave, WLAN, Wireless M-Bus, BLE | Any Power Source | Yes |
| Sense: Home Energy [11] | Closed | Non- Intrusive: Current Transformer | Wi-Fi | Any Power Source | Yes |
| Engage: Efergy [12] | Closed | Non- Intrusive: Current Transformer Intrusive: Power Plug (Future) | Not specified | Any Power Source | Yes |
WLAN: Wireless Lan, BLE: Bluetooth low energy, HVAC: Heating, ventilation and air conditioning, * Github link: https://github.com/BryceSoker/EnerMonSys.
Table 2.
Overview of Common Internet of Things (IoT) Communication Standards.
| Wireless Technology | Data Rate | Max Payload Length | Communication Range | Security | Strengths | Ref |
|---|---|---|---|---|---|---|
| LoRaWAN (This thesis) | 50 kb/s | 243 Bytes | ~5km Urban ~15 km–20 km Rural | 128 bit AES | (1) Low Power Consumption (2) Long Communication Range (3) Low Cost (4) Secure (5) Availability | [13,14,15] |
| Sigfox | 100 b/s | 12 Bytes | ~10 km Urban ~40 km Rural | No Encryption or Adaptable for each case | (1) Long Communication Range (2) Low Power Consumption | [15] |
| NB-IoT | 200 kb/s | 1600 Bytes | ~1 km Urban ~10 km Rural | LTE encryption | (1) Large Maximum payload length (4G coverage) (2) Secure | [15] |
| Wi-Fi | Top 1Gb/s - IEEE 802.11ac | 2034 bytes | 1–100 m | WPA/WPA2 | (1) High Speed (2) Advanced/Mature Standard | [14,16] |
| ZigBee | 250kb/[email protected] Ghz 40kb/s@915MHz 20kb/s@868MHz | 255 Bytes | 10–300 m Direct Line Sight 75–100 m Indoor | 128 bit AES | (1) Low Cost (2) Low Power Consumption (3) Large number of nodes (up to 65000 nodes) (4) Secure | [17,18,19] |
| Bluetooth 5 | 2 Mb/s 500 kb/s (Long Range S = 2) 125 kb/s (Long Range S = 7 | 255 Bytes | Up to 200 m +200 m (BLE) | L1–No security L2–AES 128 L3–AES and Pairing L4–ECDHE | (1) Ease of access and setup (2) Simple Hardware (3) Secure (4) Low power consumption (BLE) | [20] |
| Z-Wave | 100 kb/s | 64 Bytes | ~100 m (May vary depending on the number of nodes) (Up to 4 hops) | Security 2 (S2) (Include AES-128, ECDHE, secure TLS tunnel) | (1) Low power consumption (2) Simple installation (3) Secure (4)Interoperability between devices of different manufacturers (Standardization) | [21,22] |
AES: Advanced encryption standard, WPA: Wi-Fi protected access, BLE: Bluetooth low energy, ECDHE: Elliptic-curve Diffie–Hellman exchange, LTE: Long term evolution.
Table 3.
List of split coil transformers in the market.
| Model | Ma× Input (Range of Possibilities) | Price | Size | Opening Size | Observations |
|---|---|---|---|---|---|
| SCT-013-××× | 30–150 A | 3.50 €/ea. | 5.7 × 3.2 × 2.2 cm | 13 × 13 mm | Most widely used for IoT works. |
| KCT38 | 50–600 A | 5.30 €/ea. | 8.6 × 9.7 × 2.6 cm | 38 × 38 mm | Can only be closed with screws |
| BH-066-××× | 10–400 A | 2.54 €/ea. | 8.0 × 6.0 × 3.7 cm | 20 × 20 mm (minimum) | No wire, no known projects |
| PZCT-02 | 100 A | 4.63 €/ea. | 3.1 × 2.9 × 4.7 cm | Unknown | - |
| BZCT30AL | 50,100 A | 7.20 €/ea. | 7.8 × 6.2 × 2.4 cm | 30 × 30 mm | - |
Table 4.
Spreading factor attributes [28].
Table 4.
Spreading factor attributes [28].
| Spreading Factor | Bandwidth [kHz] | Spreading Factor [chips/symbol] | Bit Rate of the Signal [bits/sec] | Chip Rate [chips/sec] | Time per Symbol [sec/symbol] |
|---|---|---|---|---|---|
| SF7 | 125 | 128 | 5469 | 125000 | 0.001024 |
| SF8 | 125 | 256 | 3125 | 125000 | 0.002048 |
| SF9 | 125 | 512 | 1758 | 125000 | 0.004096 |
| SF10 | 125 | 1024 | 977 | 125000 | 0.008192 |
| SF11 | 125 | 2048 | 537 | 125000 | 0.016384 |
| SF12 | 125 | 4096 | 293 | 125000 | 0.032768 |
Table 5.
Comparison of reliability between devices above ground and devices underground.
| Device | Ground Level Devices | Underground Devices |
|---|---|---|
| Spreading Factor | SF7 | SF8/SF9 |
| Channel Rotation | Channel 1–3 | Channel 1–8 |
| RSSI (average) | –73 | −117 |
| Delays (+1 min) | 1.1% | 2.6% |
| Average Delay (minutes) | 1.03 | 1.26 |
| Missing Acknowledgements | 4% | 7.1% |
© 2019 by the authors. Licensee MDPI, Basel, Switzerland. This article is an open access article distributed under the terms and conditions of the Creative Commons Attribution (CC BY) license (http://creativecommons.org/licenses/by/4.0/).
Share and Cite
MDPI and ACS Style
Santos, D.; Ferreira, J.C. IoT Power Monitoring System for Smart Environments. Sustainability 2019, 11, 5355. https://doi.org/10.3390/su11195355
AMA Style
Santos D, Ferreira JC. IoT Power Monitoring System for Smart Environments. Sustainability. 2019; 11(19):5355. https://doi.org/10.3390/su11195355
Chicago/Turabian StyleSantos, Diogo, and João C. Ferreira. 2019. "IoT Power Monitoring System for Smart Environments" Sustainability 11, no. 19: 5355. https://doi.org/10.3390/su11195355
Note that from the first issue of 2016, this journal uses article numbers instead of page numbers. See further details here.