Prediction of Consumption Choices of Low-Income Groups in a Mixed-Income Community Using a Support Vector Machine Method


School of Management, Harbin Institute of Technology, Harbin 150080, China
*
Authors to whom correspondence should be addressed.
Sustainability 2019, 11(14), 3981; https://doi.org/10.3390/su11143981
Submission received: 7 June 2019
/
Revised: 19 July 2019
/
Accepted: 20 July 2019
/
Published: 23 July 2019
(This article belongs to the Section Sustainable Urban and Rural Development)
Abstract
:To examine how cross-strata neighboring behavior in a mixed-income community can influence the consumption choices of individuals in low-income groups, and to improve the prediction accuracy of the consumption choice model of low-income groups for small sample sizes, we developed a support vector machine (SVM) algorithm based on the influence of neighboring behavior. We substituted the predicted latent variables into the SVM classifier and constructed an SVM prediction model with latent variables based on reference group theory. We established the model parameters using cross-validation and used low-income residents from a mixed-income community in Shanghai as study objects to empirically test the model’s performance. The results show that the SVM selection model with latent variables has good prediction accuracy. The proposed model’s accuracy was improved by 1.29% on the basis of the particle swarm optimization (PSO)-SVM model without latent variables, and by 19.35% on the basis of the SVM model with latent variables. The proposed model can be employed to predict the consumption choices of individuals in low-income groups. This paper offers a theoretical reference for investigating neighboring behavior in a mixed-income community and the consumption choices of individuals in low-income groups and is practically important for urban community planning systems.
1. Introduction
Industrial and urban development have expanded the size of low-income groups. Increasing urbanization has enabled cities to gather more resources and has provided cities with more opportunities to turn resources into driving forces and solutions to promote sustainable development [1,2,3]. Statistical data suggest that low-income groups have become a large and special social group that cannot be ignored. Individual consumption in a low-income group can be divided into three types: Survival consumption, which prioritizes gratification and is the cornerstone of basic human rights and social stability; enjoyment consumption, which is more moderate and helps to improve life and spiritual quality; and investment-oriented development consumption, which is fundamental to the sustainable development of a low-income group in a new social environment. China is undergoing a transformation and experiencing rapid urbanization, and the emergence and development of a new cultural-developmental consumption space profoundly embody “cultural changes interacting with social structures in complex forms” [4].
Early studies in developed countries on consumption and social integration focused on consumption-based class division and indicated that consumption behaviors can be adopted as a criterion to define social classes. Such studies can be traced back to Weber, who suggested that special life styles and behavioral routines can be used to mark status groups [5]. Weber’s theory about the relationship between consumption patterns and the identification of a group’s status is directly implied in social stratification theory about economy, society, and power. Weber’s theory about the leisure class and conspicuous consumption also emphasize consumption as an important means by which a group constructs its identity. Consumption behaviors and lifestyles have begun to function as indicators of class division as soon as they become habitus.
According to reference group theory, consumers refer to others when making consumption choices. They do this not only when they lack experience and need to adjust their purchasing behaviors by acquiring information about a commodity [6,7], but also because they want to be identified as a group member and meet group expectations with such behavioral changes [8,9]. Sheth proposed the consumer-centric sustainability (CCS) approach to consumption that considers the overall environment and uses a consumer’s personal and economic well-being as standards to evaluate the consumption output to achieve optimal individual sustainability [10]. Briefly, consumers change their consumption choices to better integrate themselves into a new class and group.
The current body of research on low-income groups in mixed-income communities has some shortcomings. A number of studies investigated consumption choices; however, most of these are case studies. Quantitative studies on the relationship between neighboring behavior and the consumption choices of members of different strata within a mixed-income community remain rare [11]. These studies often treated consumption as a whole and failed to effectively distinguish the different types of consumption. With regard to low-income groups, due to the prevailing limits on income, subtle differences in choices may express the desires and expectations of individuals for future lifestyles. The degree to which a plan for a mixed-income community promotes the rationalization of social relations and social behaviors, the healthy and sustainable development of social relationships and social interaction, and a better environment for healthy and sustainable individual development determines the effectiveness of urbanization.
The existing surveys on resident consumption generally have a low sampling rate (2%–5%). Due to many uncontrollable factors, differences exist in the sampling rates of surveys conducted in different regions. Due to the particularities of the survey sample data, a large amount of sample data are required to establish a traditional statistical model. However, in reality, the amount of available data is insufficient, which leads to imprecise model results. Although a large amount of empirical evidence indicates that group effects are important in individual economic situations, identifying the paths that influence individual consumption decisions and determining how to use a small dataset to identify consumption characteristics that are representative of general laws are essential.
In this study, we aimed to complement previous research. We conducted an in-depth investigation that tracked the consumption status of low-income group members in a mixed-income community in China. We identified the relationships between neighboring behavior and consumption choices across strata and adopted reference group theory as a framework to study the consumption choices of individuals in a low-income group. We used support vector machine (SVM) to establish a multi-indicator and multi-factor model of consumption choices. SVM is an intellectualized sorting algorithm that can overcome the difficulties caused by small sample sizes. Then, empirical data were used to validate the fitting precision of the SVM selection model without latent variables. The results of the investigation show that the cross-strata neighboring behavior in a mixed-income community influences the consumption choices of individuals in low-income groups. This study expands the scope of reference group theory to cross-strata interactions in residential areas and lays a foundation for future cross-strata studies in mixed-income communities.
2. Methods
2.1. Participants and Procedure
The data used in this study were collected as part of an interview and a questionnaire survey that was completed by low-income residents living in Shanghai, China, in 2016. The interview and questionnaire focused on the residents’ interactions with their non-low-income neighbors and consumption choices. In the process of collecting the data, the testers explained the purpose of, and methods used in the study, and also questioned the residents and traced their answers back to our questionnaires. The questionnaire survey was used to collect data on the consumption choices of low-income individuals over the previous 2 years (2014 and 2015) and was administered at the same point in time both years. Participants who returned a valid questionnaire received compensation.
The samples that were used in this study were selected from a list released in 2016 by government departments of residents living in mixed-income communities in the sample cities. We used a computer to generate 548 random samples of low-income individuals. We eliminated 43 incomplete samples with obvious contradictions, and collected 505 questionnaires, for a valid questionnaire recovery rate of 92.15% (Table 1). According to Stevens [12], one variable needs to be supported by approximately 2 samples. In this study, each multiple indicators and multiple causes model for the mixed-income community had 12 variables; therefore, the sample size was uniformly required to be greater than 180 to meet the modeling requirements. Our samples were obtained from those employed in a variety of industries in mainland China, such as manufacturing, financial services, and electronics, which ensured the representativeness of the samples. In this sample, 41.4% of the respondents were men, 19.1% of the respondents had a junior high school education or below, and 20.3% of the respondents had a bachelor’s degree or above.
2.2. Measures
Neighboring behavior was measured using 10 items that were taken from the scale developed by Perkins [13] and adapted for our study. Neighboring behavior consisted of 2 main dimensions: The given neighboring behavior dimension (measured by the first 5 questions) and the received neighboring behavior dimension (measured by the final 5 questions). An example item is: Discuss a problem on the block with a neighbor. The items were translated into Chinese using a double-translation procedure (Brislin) to verify the translation’s accuracy [14]. All items were adapted to measure the values of the variables using a 5-point Likert scale that ranged from 1 = low frequency to 5 = high frequency. The Cronbach’s α was 0.79.
Depending on the purpose, consumption can be classified into survival consumption, development consumption, and enjoyment consumption. Survival consumption refers to primary consumption that consumers require for necessary labor expenditure, i.e., the basic consumption that is required to sustain survival. It has the smallest consumer demand elasticity and covers food consumption, resident expenditure, and similar variables. Usually, consumers can realize and improve upon development consumption and enjoyment consumption only when their survival demands have been met. The consumption choice item had 11 questions. Survival consumption included 3 questions, i.e., food consumption, resident expenditure, and consumer durable expenditure. Development consumption involved 4 questions, i.e., health care expenditure, education and training expenditure, interpersonal relationship expenditure, and transport and communication expenditure. Enjoyment consumption included 4 questions about leisure and entertainment expenditure, clothing expenditure, household facilities and articles expenditure, and other goods and service expenditure. Each question used 7 expenditure ranges that were used to measure the expenditures of low-income individuals with respect to the corresponding consumption types during the yearly quarter. In this study, the consumption choices were coded. After weighted averaging, the consumption types with the maximum weight were adopted as the main consumption choices of low-income individuals.
3. Pattern Selection Model Based on the MIMC-SVM for a Mixed-Income Community
3.1. SVM Model
The support vector machine theory was developed from the currently separable optimal classification hyperplane and constitutes the most practical part of the statistical theory. For a given training sample set where is an N-dimensional vector, if is linearly separable, several separated planes can be constructed in the feature space. This hyperplane is defined as:
It can completely separate both types (4, −8) without errors, i.e.:
The optimal hyperplane was selected from the set of all classification planes that met the above conditions. This optimal hyperplane maximizes the classification distance dist between both types. Consequently, the sum of the distances between the closest sample and the hyperplane for various types was maximized. This distance can be expressed as dist = 2/. Thus, solving the optimal hyperplane problem is equivalent to determining the maximum value of the distance under the constraint in Equation (4). In this case, the problem that establishes the linear SVM can be converted into the quadratic programming problem in Equation (5) [17]:
This problem can be converted into a dual problem via Lagrange’s method of multipliers:
This is a quadratic programming problem under an inequality constraint for which a unique solution exists. In terms of the learning process, support vectors are critical factors in the training set that are closest to the decision boundary. If training is conducted again after the removal of all other training points, the obtained classification hyperplane will be identical. The final and optimal classification function is:
However, most practical problems are linearly inseparable. According to Cover’s theorem, by mapping linearly inseparable samples onto a feature space of a sufficiently high dimension number via nonlinear conversion , a linearly inseparable problem in low-dimensional space can be converted into a linearly separable problem in high-dimensional space [18]. Respecting the nonlinear SVM, the slack variable and the penalty parameter C are introduced to revise both the optimization objective and the constraint term:
The obtained optimal classification function is:
The kernel function adopts the polynomial kernel function and the radial basis kernel function .
3.2. Particle Swarm Optimiztion-SVM
The particle swarm optimization (PSO) algorithm is a heuristic algorithm that was first proposed by Kennedy and Eberhart in 1995 [16]. It seeks the optimal solution to an optimization problem via iterations by initializing the positions and velocities of a group of random particles. PSO has been applied in function optimization, neural network optimization, combinatorial optimization, and many other fields. Assume that there are m particles that constitute a particle swarm in a D-dimensional search space, where the spatial position of the ith particle is . By substituting this into the optimization objective function, the corresponding fitness value can be calculated and used to measure the merits of . The best position experienced by the ith particle is referred to as the best position in the history of the individual and is denoted . Each particle also has a flight velocity ; the best position among the positions experienced by all particles is referred to as the global best position in history and is denoted . By evaluating the fitness of each particle, the current individual-best and global-best of each particle in the qth generation can be determined. An iteration is performed according to the following equation [19]:
where represents the number of iterations; represents the ith individual; represents the number of problem dimensions; w represents the inertia weight; c1 and c2 represent acceleration coefficients; and r1 and r2 represent two random numbers that change within the range of [0, 1]. In the PSO algorithm, a higher w produces a stronger global searching ability, whereas a smaller w produces a stronger local searching ability. Thus, as the number of iterations increases, the inertia weight w continuously decreases.
3.3. Types of Consumption Choices Based on MIMC
In this study, the structural equation that describes the latent variable relationship is defined as:
where represents the -dimensional latent variable of neighboring behavior. In this study, = 2, i.e., the given neighboring behavior and the received neighboring behavior. represents the -dimensional control variable vector, (sex, age, marital, education, job, and job experience (years)); represents the -dimensional unknown parameter matrix; and represents the measurement error. The measurement equation is expressed as:
where represents the observable index vector of the -dimensional latent variable , represents the -dimensional unknown parameter matrix, and represents the error term. The error terms and must satisfy .
Considering the 3 types of consumption choices, the output types can be converted into 3 binary classification problems. The decision function that corresponds to each type is:
If belongs to type i; if does not belong to type i. Thus, the total discriminant function of the multi-class problem is:
where arg represents the index for the selection function. This means that for sample point x, select the type that corresponds to index i when the decision function has the maximum value and adopt it as the type to which the sample point should belong. Among the consumption choices available to low-income individuals in mixed-income communities, 11 common forms of consumption can be assigned a mark. For instance, survival consumption choices can be marked as 1; development consumption choices can be marked as 2; and enjoyment consumption choices can be marked as 3. As such, three binary classifiers were created, and the total discriminant function was used to identify the consumption choices of low-income individuals in a mixed-income community. For instance, means that the choice does not belong to this consumption pattern and means that the choice belongs to the enjoyment consumption pattern.
4. Results
4.1. Selection of the Kernel Function
We first used cross-validation to determine the optimal parameters of the SVM model. Then, we adopted the optimal parameter training model to predict the consumption choices of low-income individuals in a mixed-income community. We used classification precision to evaluate the proposed model for predicting the consumption choices of low-income groups. Classification precision is defined as the proportion of the total number of classified samples that were correctly allocated to a type in the model classification results. A model’s classification precision is the number of samples that were correctly allocated divided by the total number of classified samples multiplied by 100%.
Both the control variables and the latent variables in the multiple indicators and multiple causes model for a mixed-income community were substituted into the model as sample points. Of the 505 total samples, the first 350 samples were used as training samples and the remaining 155 samples were used as testing samples. After the modeling was completed, five-fold cross-validation was used to evaluate the model’s precision. Cross-validation is a statistical analysis method that is typically used to test a classifier’s performance [20]. We equally divided the original dataset into five subsets and performed cross-validation once on the data from one subset and five-fold cross-validation on the data from the other four subsets as a training set to produce five models. The average classification accuracy of the validation sets of the five models was then used as an index to evaluate the classifier’s performance. Five-fold cross-validation can help avoid overfitting and underfitting, and the classification accuracy is relatively high with regard to modeling data and testing data. In this study, five-fold cross-validation and a grid search were adopted for the optimization of the parameters (C, r). Figure 1 shows the results.
4.2. Parameter Optimization Results
Figure 1 shows the change in the fitness value of the optimal particle. With regard to parameter optimization, both the grid method and the PSO algorithm were adopted within the training set, as illustrated in Figure 1.
As shown in Figure 1b, in the initial stage, as the number of evolutionary generations increased, the fitness value of the optimal particle (the SVM’s classification accuracy in the sense of cross-validation) continuously increased. When the number of evolutionary generations of a population exceeded 50, a steady value was maintained. The best fitness value of the optimal particle was approximately 84%. Under this best fitness value, the SVM’s optimal penalty coefficient C in the sense of cross-validation was 202.176. The optimal kernel function parameter g was 14.59. This parameter was used to retrain the model to determine the classification precisions of both the modeling samples and the testing samples. As shown in Figure 1a, the grid method produced a penalty coefficient C of 0.25 and a kernel function parameter g of 0.125, with a classification precision of 63.23%. Thus, we adopted the parameter optimization results that were obtained using the PSO algorithm.
Artificial neural networks (ANNs) are extensively used to predict an individual’s selection decisions. We also used a backpropagation (BP) neural network to predict the consumption choices of low-income individuals in a mixed-income community. To compare the classification results from the SVM and BP neural network models for predicting the consumption choices of low-income individuals in a mixed-income community, we adopted a three-layer BP network structure and a bipolar tansig function as the transfer function in the hidden layer, used a linear purelin function as the transfer function in the output layer, and achieved a model classification precision of 60.58%. To test its reliability and practicability, our SVM selection model with latent variables was compared with the SVM selection model without latent variables and the BP model. Table 2 shows the prediction results for the testing samples.
The classification results shown in Table 2 indicate that the SVM method achieved a satisfactory fitting effect for the consumption choices of low-income individuals in the mixed-income community, and its classification precision was consistently higher than that of the BP neural network model. The correct prediction rate of the PSO-SVM model with latent variables was the highest (as shown by the comparison of the precision results of the test set in Figure 2), whereas the SVM model without latent variables had the lowest correct prediction rate. The precision of the proposed model was improved by 1.29% on the basis of the PSO-SVM model without latent variables, and by 19.35% on the basis of the SVM model with latent variables. These results indicate that the SVM prediction model with latent variables offers more advantages for predicting the consumption choices of low-income individuals in mixed-income communities. The proposed selection model was able to predict the consumption choice tendencies of low-income individuals in the mixed-income community with relatively high accuracy. Thus, the proposed selection model may be of vital practical significance for guiding mixed-income community planning in the future.
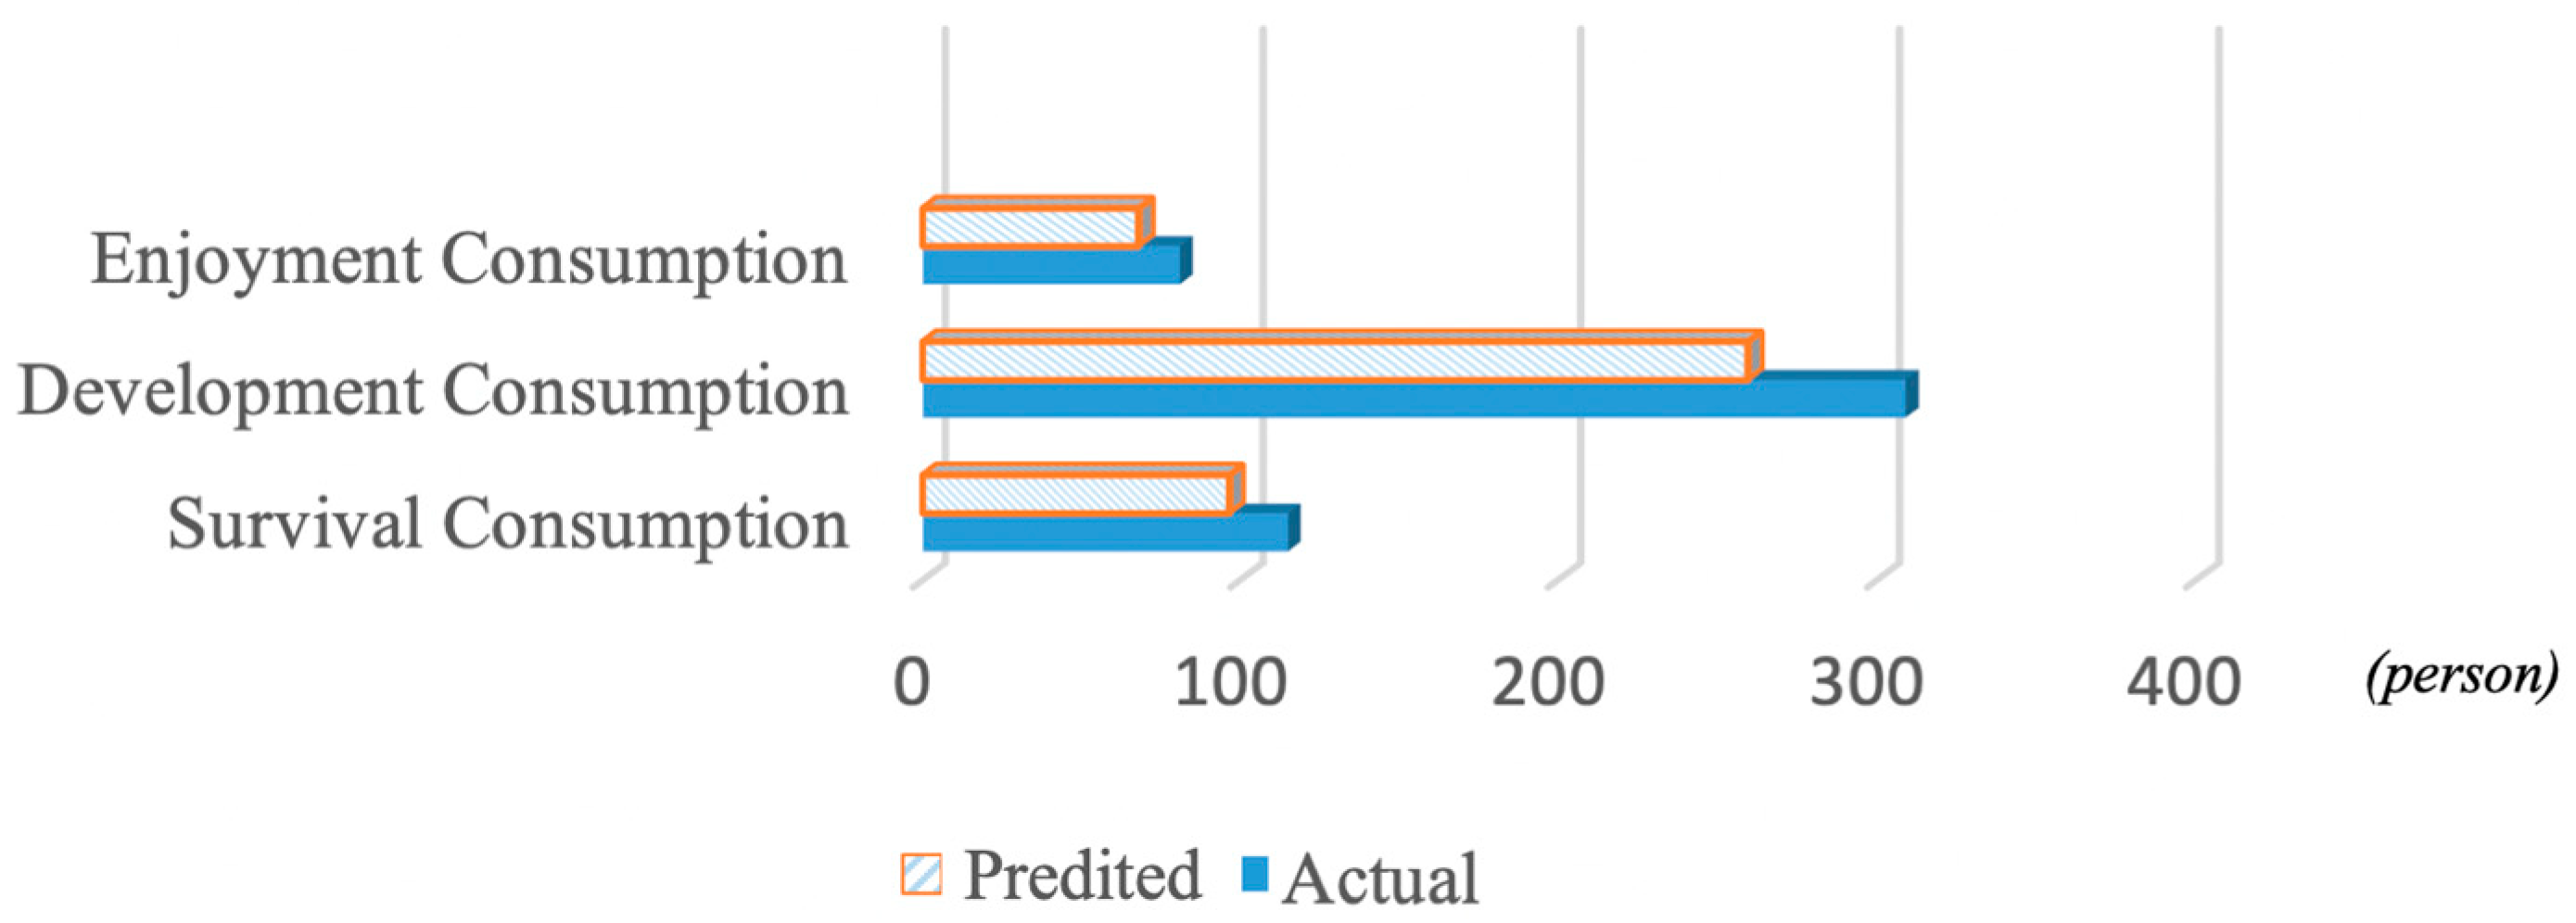
The aim of survival consumption is to satisfy people’s physiological demands, which are intrinsic consumption demands. In this sense, a decline in the share of survival consumption in total consumption can be used as a sign of an improvement in living standards. In contrast, a larger share of survival consumption within total consumption implies lower living standards. Figure 3 shows the frequency of neighboring behavior’s influence on different consumption types. Among the three types of consumption of low-income groups, development consumption was positively influenced by neighboring behavior. This suggests that neighboring behavior exerted a greater influence on the development consumption of low-income groups in the mixed-income community. It also indicates that effective neighborhood interactions helped low-income groups to adopt consumption behavior that would benefit their future development and growth. The cumulative effects led to long-term development consumption by low-income individuals in the mixed-income community. Neighboring behavior exerted a less significant influence on survival consumption and enjoyment consumption. A hedonic attitude is often accompanied by impulsive consumption and economic and social risks [21,22]. Therefore, the low proportion of enjoyment consumption proves that the hedonic atmosphere in the mixed-income community did not completely induce the low-income group to engage in short-lived hedonic consumption. From the perspective of protecting individuals’ basic consumption needs, the development of low-income groups at the integration stage may be more effectively promoted.
5. Discussion
As many factors influence the consumption choices of low-income individuals in a mixed-income community, it is difficult to accurately predict these choices using traditional linear models. In this study, we examined the factors that influence the consumption choices of a low-income group in a mixed-income community based on reference group theory. Then, the predicted latent variables were substituted into an SVM classifier to construct a prediction model with latent variables. Low-income residents from a mixed-income community in Shanghai were used as study objects to empirically test the model’s performance. According to the results, the SVM prediction model with latent variables achieved a good prediction effect, and both models with latent variables performed better than the BP model and the corresponding prediction model without latent variables. The results suggest that the consumption choices of low-income individuals in mixed-income communities are not only influenced by individual attributes such as sex and occupation, but also by social attributes and other factors. Supplementing the variable of neighboring behavior with other relevant variables was found to further improve the ability of the model to predict the consumption choices of low-income groups in this particular mixed-income community. The proposed model can be used to predict the consumption choices of a low-income group in a mixed-income community, and thus provides a theoretical reference for further studies on neighboring behavior in mixed-income communities and the consumption choices of low-income groups.
As a kind of reproduction activity, development consumption often can generate more lasting effects than the consumption of durable goods. It is a kind of investment that can stimulate increases in income in the future [23,24]. Policy implementers expect that the cross-strata neighboring behavior in a mixed-income community can change the consumption choices of individuals in a low-income group and shift their propensity for consumption, which will likely increase development consumption and contribute to the spiritual enrichment of low-income group members, and help them to accumulate skills and capabilities to better integrate them into new strata and groups. Our results confirm that neighboring behavior in a mixed-income community can encourage development consumption among low-income group members, indicating that neighboring behavior has a positive influence on low-income individuals in a mixed-income community. This finding is similar to the results of a previous study that showed that the higher the degree of urbanization, the more open consumers’ mindsets, and the more emphasis placed on the social value of products and services and their long-term functional value [25]. The results also indicate that there was no significant pursuit of enjoyment consumption among low-income group members in the mixed-income community, which may be related to the social transition in developing countries. In the macro-environment of simply pursuing economic growth and neglecting science-based policy support, low-income individuals often find themselves at the margins of mainstream social groups. The rising prices of housing, education, medical care, and old-age care in China have placed a heavy economic burden on individuals in low-income groups, and China’s social security system is still immature, thus individuals in China’s low-income group spend their incomes on survival consumption and development consumption instead of enjoyment consumption. Their jobs are classified in China as “secondary” in society, meaning these occupations are temporary, unfixed, and marginal. This conclusion is a powerful complement to the concept of the new poor class who do not have enough money to buy goods as they like.
For individuals in our contemporary society, consumption not only satisfies basic subsistence needs but also satisfies the desire for symbols of identity. These two kinds of lifestyles and social statuses are formed from different values. The Chinese government has implemented the mixed-income community plan with the hope that the cross-strata environment can exert a positive influence on low-income group members not only in terms of consumption but also in other aspects to promote their sustainable development and improve their adaptability in the new social environment. To encourage low-income group members to make positive consumption choices involves facilitating a new consumption ethic and offering new moral standards to low-income group members. To facilitate development consumption by individuals in low-income groups, it is necessary to not only make good use of the reasonable part of China’s traditional consumption culture and adapt it to contemporary society but also to learn from the experiences of developed countries in their attempts to influence the consumption patterns of low-income groups. These experiences include promoting income distribution and social security system reform to improve low-income consumers’ expectations and marginal propensity for consumption; increasing investment in public education, which can stimulate development consumption, increase the accumulation of human capital, and facilitate investment; and advocate moderate and reasonable consumption through the media to help low-income groups balance material and spiritual consumption and establish a healthy sense of consumption. In short, creating a sustainable living environment for low-income groups, upgrading the consumption structure, establishing a sustainable consumption pattern, and maximizing the capacity of mixed-income communities to perform their anticipated function will not only have short-term benefits for society but also create long-term and realistic value in promoting sustainable social development.
This study has some limitations. First, the data that were used in this study were provided unilaterally by low-income group members; consequently, the data could be affected by differences among members of this group. Future studies should perform pairing research within the same physical boundary to explore cross-strata interactions. Secondly, this study is a preliminary study in the neighboring behavior research series. Future studies should collect longitudinal data and perform a deeper exploration of the possible seasonal or periodical changes. The heterogeneity ratios in a community could also be included in the model as a variable to determine whether a mixed-income community can encourage low-income group members to make positive consumption choices under any circumstances. Finally, although different countries have different housing policies for low-income groups, future studies should attempt to compare cross-strata interactions in a given context to enrich the body of research on neighboring behavior in mixed-income communities and be able to provide effective advice on the consumption patterns and the policies for housing planning that are relevant to the sustainable development of low-income group members.
Author Contributions
Conceptualization, X.Z. and Z.Z.; Methodology, X.Z. and Y.W.; Validation, X.Z., Z.Z. and Y.W.; Formal Analysis, X.Z.; Investigation, L.Y.; Data Curation, L.Y.; Writing-Original Draft Preparation, X.Z.; Writing-Review & Editing, X.Z.; Visualization, L.Y.; Supervision, Y.W.; Funding Acquisition, Z.Z. and X.Y.
Funding
This research was funded by Academic Innovation Program of University of Chinese Academy of Social Science [UCASS20190007] and The National Natural Science Foundation of China [71473061].
Conflicts of Interest
We would like to submit the enclosed manuscript entitled “Prediction of Consumption Choices of Low-Income Groups in a Mixed-Income Community Using a Support Vector Machine Method”, which we wish to be considered for publication in “Sustainability”. No conflict of interest exits in the submission of this manuscript, and manuscript is approved by all authors for publication. I would like to declare on behalf of my co-authors that the work described was original research that has not been published previously, and not under consideration for publication elsewhere, in whole or in part. All the authors listed have approved the manuscript that is enclosed. Funding sponsors funded the design of the study and data collection.
References
- Roy, M. Planning for sustainable urbanisation in fast growing cities: Mitigation and adaptation issues addressed in Dhaka, Bangladesh. Habitat Int. 2009, 33, 276–286. [Google Scholar] [CrossRef]
- Krause, R.M. Policy Innovation, Intergovernmental Relations, and the Adoption of Climate Protection Initiatives by U.S. Cities. J. Urban Aff. 2011, 33, 45–60. [Google Scholar] [CrossRef]
- Hawkins, C.V.; Krause, R.M.; Feiock, R.C.; Curley, C. Making meaningful commitments: Accounting for variation in cities’ investments of staff and fiscal resources to sustainability. Urban Stud. 2015, 53, 1902–1924. [Google Scholar] [CrossRef]
- Bell, D. The Cultural Contradictions of Capitalism; Basic Books: New York, NY, USA, 1976; p. 33. [Google Scholar]
- Weber, M.; Runciman, W.G.; Matthews, E. Max Weber: Postscript: The Concepts of Status Groups and Classes; Cambridge University Press: Cambridge, UK, 2011. [Google Scholar]
- Burnkrant, R.E.; Cousineau, A. Informational and Normative Social Influence in Buyer Behavior. J. Consum. Res. 1975, 2, 206–215. [Google Scholar] [CrossRef]
- Aarts, H.; Dijksterhuis, A. How often did I do it? Experienced ease of retrieval and frequency estimates of past behavior. Acta Psychol. 1999, 103, 77–89. [Google Scholar] [CrossRef]
- Wilkie, W.L. Consumer Behavior; John Wiley and Sons Incorporation: New York, NY, USA, 1994. [Google Scholar]
- Macinnis, H. Consumer Behavior; Houghton Mifflin Company: New York, NY, USA, 1997. [Google Scholar]
- Sheth, J.N.; Sethia, N.K.; Srinivas, S. Mindful consumption: A customer-centric approach to sustainability. J. Acad. Mark. Sci. 2011, 39, 21–39. [Google Scholar] [CrossRef]
- Durlauf, S. Groups, Social Influences and Inequality. A Memberships Theory Perspective on Poverty Traps; Working paper; Santa Fe Institute: Santa Fe, NM, USA, 2003; pp. 1–35. [Google Scholar]
- Pituch, K.A.; Stevens, J.P. Applied Multivariate Statistics for the Social Sciences. Appl. Multivar. Stat. Soc. Sci. 2015, 57, 68–69. [Google Scholar]
- Perkins, D.D.; Florin, P.; Rich, R.C.; Wandersman, A.; Chavis, D.M. Participation and the social and physical environment of residential blocks: Crime and community context. Am. J. Community Psychol. 1990, 18, 83–115. [Google Scholar] [CrossRef] [Green Version]
- Brislin, R.W. Back-Translation for Cross-Cultural Research. J. Cross-Cultural Psychol. 1970, 1, 185–216. [Google Scholar] [CrossRef]
- Mehmood, Q.; Hamstra, M.R.W.; Nawab, S.; Vriend, T. Authentic leadership and followers’ in-role and extra-role performance: The mediating role of followers’ learning goal orientation. J. Occup. Organ. Psychol. 2016, 89, 877–883. [Google Scholar] [CrossRef]
- Lepine, M.A.; Zhang, Y.; Rich, B.; Crawford, E. Turning their Pain to Gain: Charismatic Leader Influence on Follower Stress Appraisal and Job Performance. Acad. Manag. J. 2016, 59, 1036–1059. [Google Scholar] [CrossRef] [Green Version]
- Tsyurmasto, P.; Zabarankin, M.; Uryasev, S. Value-at-risk support vector machine: Stability to outliers. J. Comb. Optim. 2014, 28, 218–232. [Google Scholar]
- Kim, K.I.; Jung, K.; Park, S.H.; Kim, H.J. Support vector machines for texture classification. IEEE Trans. Pattern Anal. Mach. Intell. 2002, 24, 1542–1550. [Google Scholar] [Green Version]
- Kennedy, J.; Eberhart, R.C. Particle swarm optimization. In Proceedings of the IEEE Internet Conference on Neural Networks, New York, NY, USA, 27 November–1 December 1995; Volume 4, pp. 1942–1948. [Google Scholar]
- Wang, K.; Hou, Z.; Wang, C. Intrusion Detection Based on Cross-Validation SVM. J. Test Meas. Technol. 2010, 24, 349–356. [Google Scholar]
- Clément, M.; Fabel, S.; Schmidt-Stölting, C. Diffusion of Hedonic Goods: A Literature Review. Int. J. Media Manag. 2006, 8, 155–163. [Google Scholar] [CrossRef]
- Miller, C.M.; Mcintyre, S.H.; Mantrala, M.K. Toward Formalizing Fashion Theory. J. Mark. Res. 1993, 30, 142–157. [Google Scholar] [CrossRef]
- Djomo, J.M.; Sikod, F. The Effects of Human Capital on Agricultural Productivity and Farmer’s Income in Cameroon. Int. Bus. Res. 2012, 5, 134. [Google Scholar] [CrossRef]
- Behrman, J.R. The Action of Human Resources and Poverty on One Another: What We have yet to Learn; Living Standards Measurement Study (LSMS), No. LSM 74; The World Bank: Washington, DC, USA, 1990; pp. 1–171. [Google Scholar]
- Sun, C.; Su, S.; Huang, J. Cultural value, perceived value, and consumer decision-making style in China. Nankai Bus. Rev. Int. 2013, 4, 248–262. [Google Scholar] [CrossRef]
Figure 1.
Results of parameter optimization: (a) Grid method and (b) particle swarm optimization (PSO) algorithm. c optimal penalty coefficient; g optimal kernel function parameter.
Figure 1.
Results of parameter optimization: (a) Grid method and (b) particle swarm optimization (PSO) algorithm. c optimal penalty coefficient; g optimal kernel function parameter.

Figure 2.
The precision results for the test set.

Figure 3.
Frequency of neighboring behavior’s influence on different consumption types.

Table 1.
Demographic information on the survey respondents.
| Variable | Category | No. | % |
|---|---|---|---|
| Age (years) | 30 or below | 34 | 61.8% |
| 30–40 | 153 | 29.1% | |
| 40–50 | 201 | 39.8% | |
| 50 and above | 117 | 23.2% | |
| Sex | Male | 209 | 41.4% |
| Female | 296 | 58.6% | |
| Marital status | Married | 414 | 82.0% |
| Single | 91 | 18.0% | |
| Education level | Junior high school or below | 135 | 26.7% |
| Senior high school or vocational technical school | 253 | 50.0% | |
| Junior college | 112 | 22.2% | |
| Undergraduate or above | 5 | 1.0% | |
| Occupation | Lodging and catering | 22 | 4.4% |
| Housekeeping and environmental sanitation | 64 | 12.7% | |
| Wholesale and retail | 80 | 15.8% | |
| Manufacturing | 99 | 19.6% | |
| Construction | 96 | 19.0% | |
| Electronics | 59 | 11.7% | |
| Transportation | 65 | 12.9% | |
| Others | 20 | 4.0% | |
| Job experience (years) | 20 or less | 175 | 34.7% |
| 20–30 | 181 | 35.8% | |
| 30 or more | 149 | 29.5% |
Table 2.
Classification results of different models.
| Model | Latent Variables (%) | Non-Latent Variables (%) |
|---|---|---|
| PSO-SVM | 82.58 | 81.29 |
| SVM | 63.23 | 61.93 |
© 2019 by the authors. Licensee MDPI, Basel, Switzerland. This article is an open access article distributed under the terms and conditions of the Creative Commons Attribution (CC BY) license (http://creativecommons.org/licenses/by/4.0/).
Share and Cite
MDPI and ACS Style
Zu, X.; Wu, Y.; Zhang, Z.; Yu, L. Prediction of Consumption Choices of Low-Income Groups in a Mixed-Income Community Using a Support Vector Machine Method. Sustainability 2019, 11, 3981. https://doi.org/10.3390/su11143981
AMA Style
Zu X, Wu Y, Zhang Z, Yu L. Prediction of Consumption Choices of Low-Income Groups in a Mixed-Income Community Using a Support Vector Machine Method. Sustainability. 2019; 11(14):3981. https://doi.org/10.3390/su11143981
Chicago/Turabian StyleZu, Xiaoqian, Yongxiang Wu, Zhenduo Zhang, and Lu Yu. 2019. "Prediction of Consumption Choices of Low-Income Groups in a Mixed-Income Community Using a Support Vector Machine Method" Sustainability 11, no. 14: 3981. https://doi.org/10.3390/su11143981
Note that from the first issue of 2016, this journal uses article numbers instead of page numbers. See further details here.