Perceived Quality in Sports Centers in Southern Spain: A Case Study


1
Department of Physical Education and Sports, University of Granada, 18071 Granada, Spain
2
UNIR, International University of La Rioja, 26006 Logroño, Spain
3
Department of Languages, Arts and Sports, University of Malaga, 29071 Malaga, Spain
*
Author to whom correspondence should be addressed.
Sustainability 2019, 11(14), 3983; https://doi.org/10.3390/su11143983
Submission received: 3 June 2019
/
Revised: 18 July 2019
/
Accepted: 19 July 2019
/
Published: 23 July 2019
(This article belongs to the Special Issue Education for Sustainability in Physical Education)
Abstract
:The aim of this study was to analyze the level of satisfaction in three municipal sports centers in the city of Malaga and to learn and analyze the characteristics of users older than 40 years of age in these centers. A total of 303 persons (123 men and 180 women) from three sports centers in the city of Malaga participated in this study (M = 58.14, SD = 7.16 years). The Evaluation of Perceived Quality in Sports Services test (CECASDEP) was used, and the results demonstrated that the different dimensions studied—sports center, activity space, locker rooms, program of activities, and trainer—were very positively correlated. The level of customer loyalty increased with user satisfaction and perceived quality of services as well as the age of the person. Users were also found to be more motivated to take part in physical activities due to greater satisfaction. The highest scores were given to the trainers, who played a key role in all three sports centers. In conclusion, we gathered important insights into perceived quality in different sports centers. This information can be used by sports managers to strengthen dimensions with lower scores and improve those with higher scores. In addition, the study confirms that the level of customer loyalty is related to the perceived quality scores. Therefore, the use of measuring instruments is recommended to optimize the quality of sports services.
1. Introduction
Physical activities (PA) and sports among the Spanish people have changed in the past decades and have become a significant social phenomenon. The triumph of Spanish athletes in the sports world in the last 10 years, both as individuals and as teams, has planted a seed in the society, motivating people to take part in sports and physical activities.
This interest in sports has evolved in a positive manner in the last two decades, as manifested by physical, psychological, and social well-being, leading to an improvement in the quality of life of people. The concept of sports management has become more challenging due to the numerous tasks and actions it involves [1], and there is a growing need to implement adequate quality evaluation programs with the objective of improving sports services [2]. One of the most used strategies in management to deduce the internal weaknesses of a company is to perform the so-called SWOT analysis (strengths, weaknesses, opportunities, and threats). In this, a study on user satisfaction is employed as a tool to get a glimpse on the most common weaknesses of companies [3].
Research indicates that perceived service quality is determined primarily by the tangible elements of facilities and the attitudes and skills of employees [4,5].
According to the World Health Organization [6], the number of persons over 60 years of age is increasing throughout the world, including Europe, and especially Spain. In 2025, there will be 1.2 billion persons over 60 years of age worldwide, of which 840 million will live in developed countries. For this reason, PA must become an obligation [7] because it is a factor in maintaining health and preventing cardiovascular and metabolic diseases. This conclusion is supported not only by studies [8] but also by public administrations [9]. Taking part in a PA has a direct association with well-being and healthy lifestyle as well as improved health and quality of life [10,11,12].
The importance of perceived quality of service among people who take part in PA means there is a need to establish strategies aimed at greater user satisfaction. This can be made possible by the implementation of adequate quality programs [13]. There are various tools available to evaluate quality of service [14,15,16,17,18]. Sports activities require good trainers but also new elements and techniques, which are included in the concept of sports management [19].
The aim of this study was to measure the level of user satisfaction in three municipal sports centers in the city of Malaga and to learn and analyze the characteristics of users older than 40 years of age in these centers.
2. Material and Methods
2.1. Participants
A total of 303 users (123 men and 180 women) of sports centers in the city of Malaga, where management was strictly municipal, participated in the present study (M = 58.14 SD = 7.16 years). The participants trained in one of the three municipal sports centers, which had similar characteristics but were located in different zones of the city. The study was conducted in accordance with the Declaration of Helsinki and Spain´s Federal Judicial Authority Organization Act 15, December 13, 1999, for personal data privacy. Table 1 shows the distribution of age and gender of the participants in this study.
The average period of customer loyalty (steady attendance) among the users interviewed in the sports complexes was 2.72 years. Women had a higher average at 2.76 years, while men averaged 2.65 years.
The average period of customer loyalty at the sports centers varied depending on gender and increased with age (Figure 1).
2.2. Instruments
On the basis of studies done by Gronroos [20], Parasuraman, Zeithaml, and Berry [21], and Morales, Hernández, and Blanco [22], a questionnaire called Evaluation of Perceived Quality in Sports Services (CECASDEP) was prepared. This is an evaluation tool in the area of sports management, which examines users’ needs and requests in greater depth and takes into consideration both tangible and intangible aspects of service. The evaluation consists of six sections of questions relating to the following dimensions: sports installations, customer service, activity space, locker rooms, program of activities, and trainers.
The initial questionnaire contained 71 items divided into six dimensions. Gálvez-Ruiz and Morales Sánchez [13] subsequently modified the questionnaire by regrouping questions and shortening sections. The resulting and definitive questionnaire has five dimensions—sports installations, activity space, locker rooms, programs of activity, and trainers—and 51 items. Validity and reliability has previously been demonstrated for the Spanish population (reliability between 0.70 and 0.96 in all dimensions) with very acceptable values, according to Nunnally [23].
The responses are scored on a Likert scale between 1 and 5, with 1 being equivalent to “I completely disagree” and 5 being equivalent to “I completely agree”.
2.3. Procedure
Data collection took place in February 2013. All participants voluntarily agreed to participate in this study after receiving an explanation of its objective. The sports centers also agreed to individual data collection in the activity spaces corresponding to the various programs of physical activity. Investigators were present in order to help participants fill out the questionnaire correctly if needed. This study was approved by the Ethics Committee of the Universidad de Malaga.
3. Statistical Analysis
Statistical data processing was performed on SPSS for Windows version 21.0 (SPSS Inc., Chicago, IL, USA). Based on scores between 1 and 5 on the questionnaire, we calculated the average at 2.5 in order to establish the low and high perceived quality categories. Thus, results higher than this average were considered “pass” and those below the average were considered “fail”.
The non-normality of the variables was established. Consequently, nonparametric tests were used. Descriptive, comparative, and corelational analyses were performed on the variables in this study. The Mann–Whitney U and Kruskal–Wallis H tests were used to compare the independent variables of gender and customer loyalty, respectively. In addition, the Rho de Spearman test was used to assess the correlation between perceived qualities of sports service. The size of the effect was used to quantify the size of the difference that was found between both groups. Accordingly, we could say that this is a true measure of the significance for such a difference [24]. The threshold values for the Cohen effect sizes detected in a t-test (d) were 0.20 for small effects, 0.50 for moderate effects, and 0.80 for large effects. For ANOVA tests, those values (η2) were 0.10 for small effects, 0.25 for moderate effects, and 0.40 for large effects. The level of statistical significance was taken as p < 0.05.
4. Results
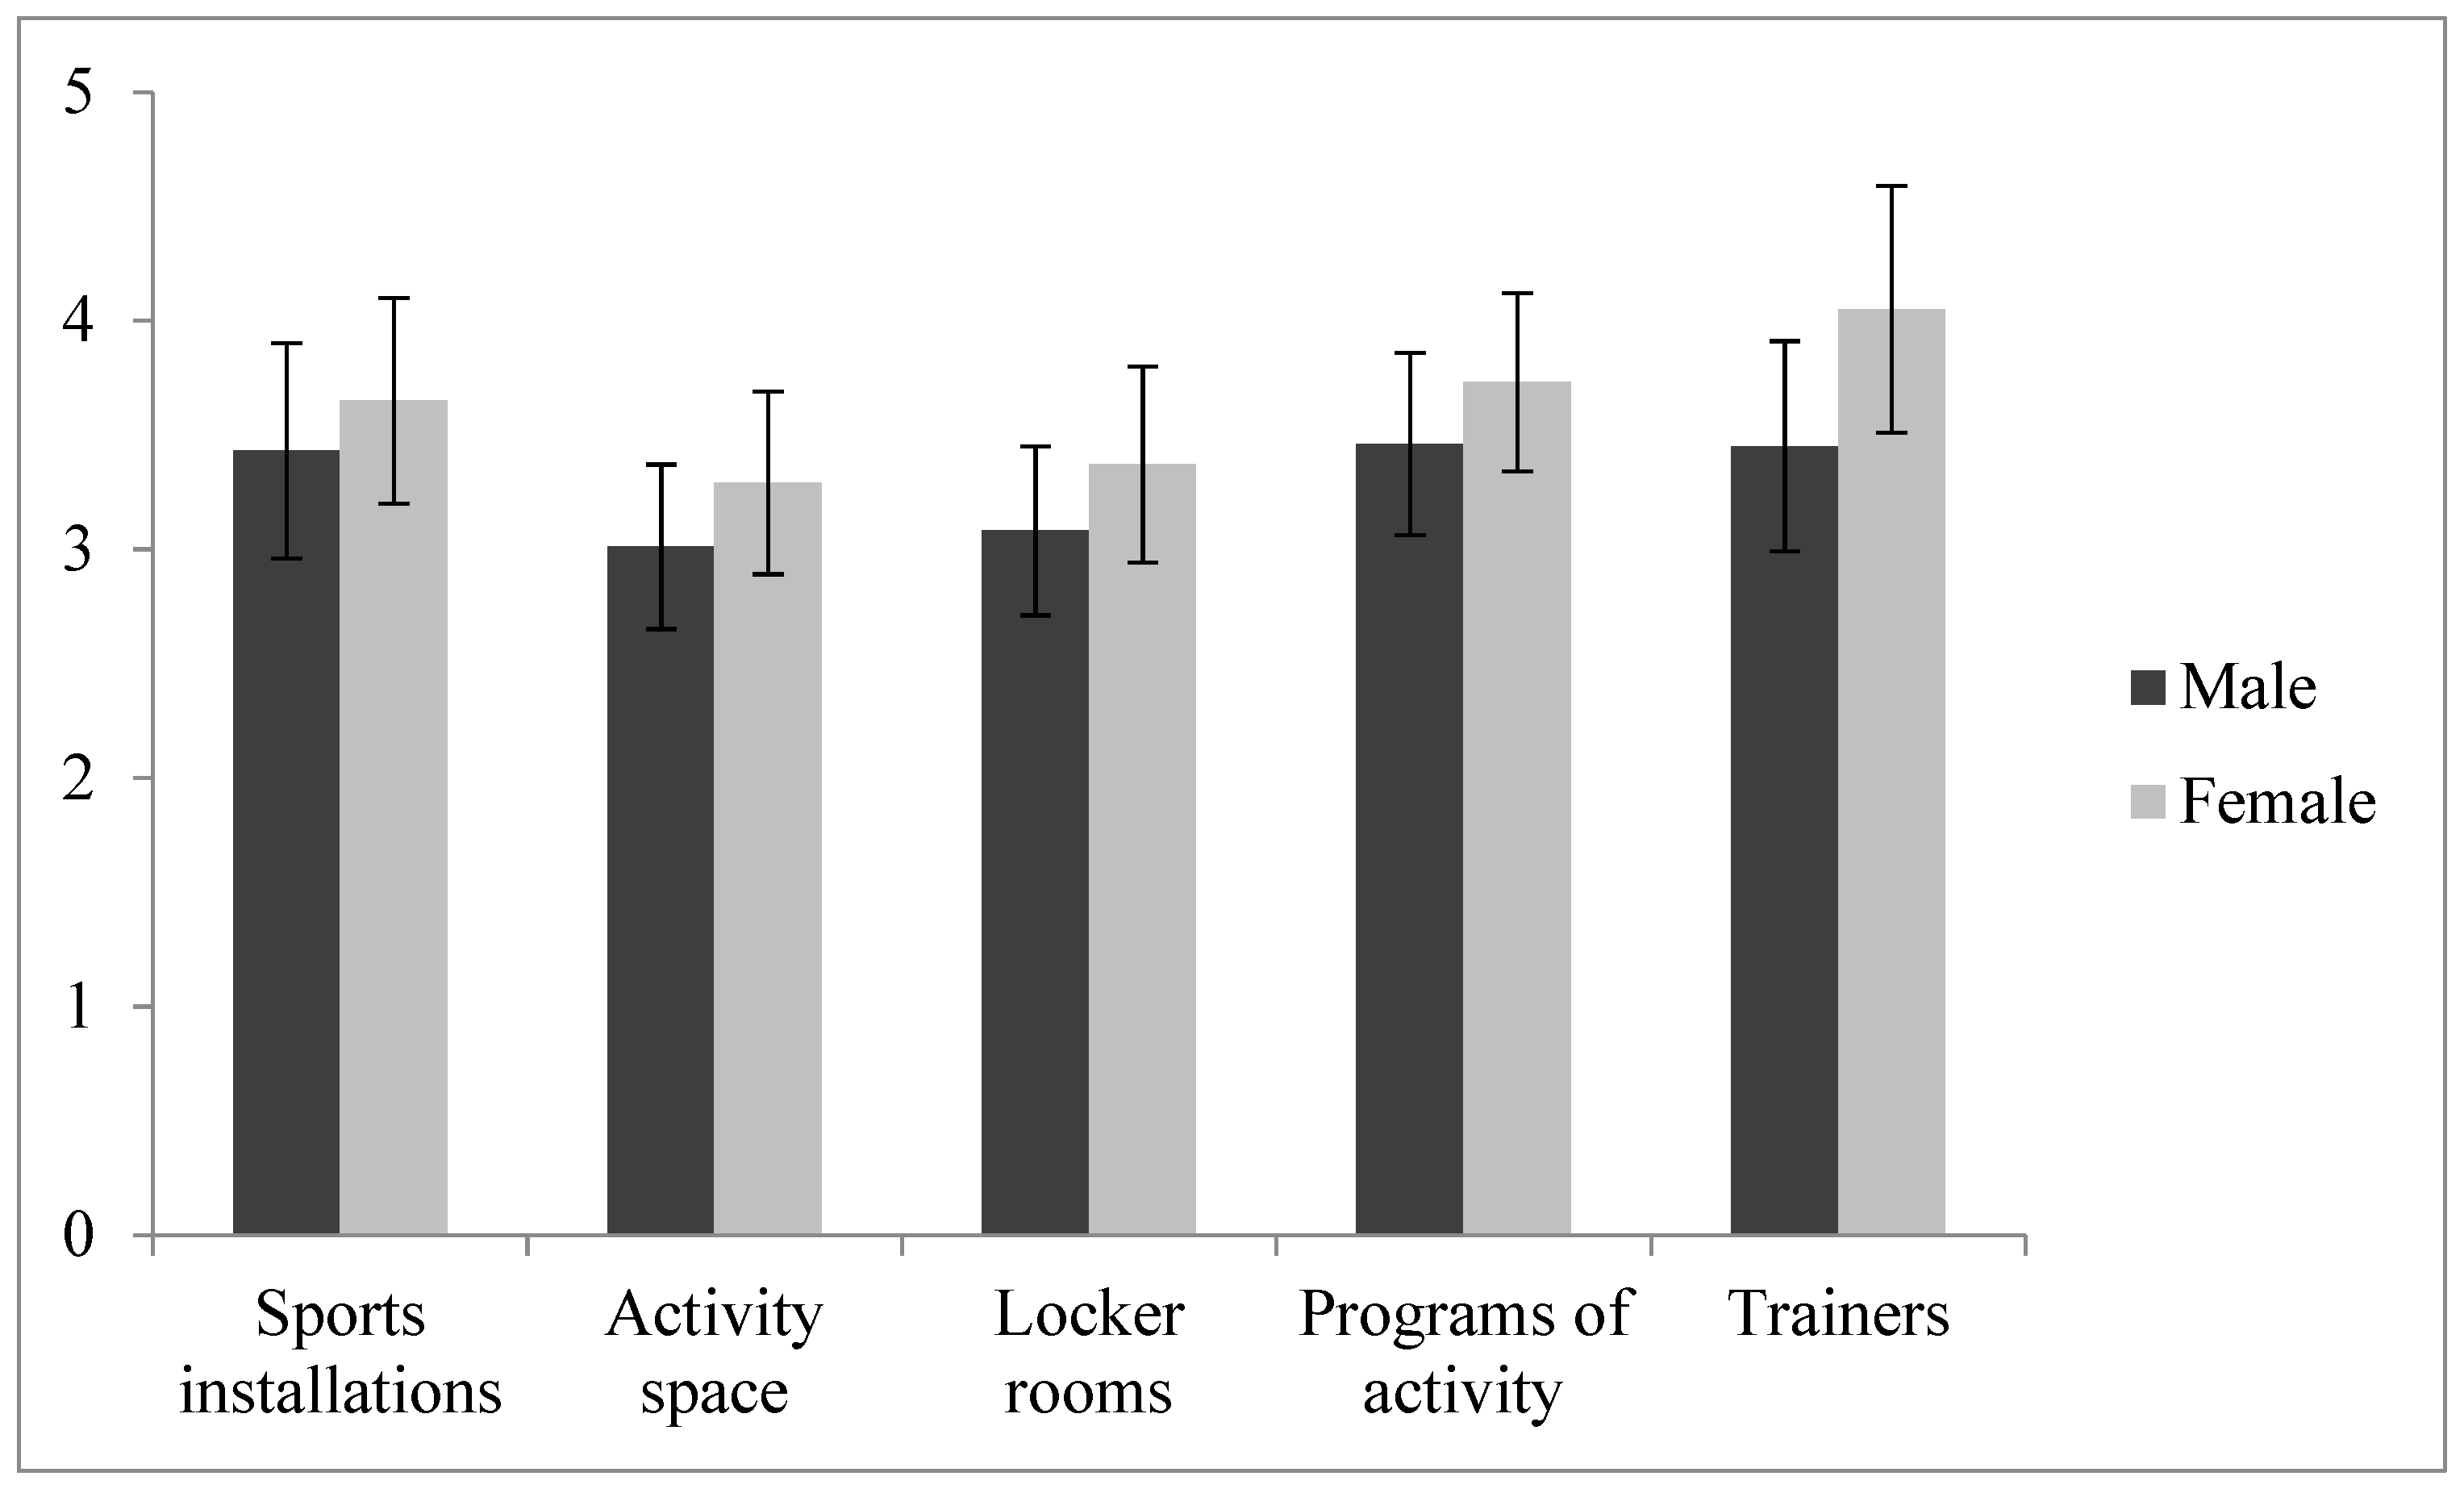
Firstly, the perception of quality of sports services between genders was evaluated, and the results are shown in Figure 2. It can be seen that there were significant differences in all dimensions (p < 0.01). The satisfaction level among women was higher in all the dimensions surveyed. The effect size of these differences was also high. The values were as follows for the five dimensions: sports installations, d = 0.48; activity spaces, d = 0.73; locker rooms, d = 0.71; program of activities, d = 0.69; and trainers, d = 1.18.
Secondly, a comparative analysis was performed on the perception of quality of service as a function of customer loyalty (Figure 3). In this respect, users who had been with the facility for two years perceived a lower quality of service given by the sports complex than those with four years of attendance (p < 0.05). The effect size of these differences was small. The values were as follows for the five dimensions: sports installations, η2 = 0.08; activity spaces, η2 = 0.07; locker rooms, η2 = 0.08; program of activities, η2 = 0.10; and trainers, η2 = 0.07.
Finally, a correlation analysis was performed between the dimensions of the test (Table 2). The results showed that the different dimensions of perception of quality of sports services were positively correlated. It is noteworthy that perception of quality of services received from the trainer positively correlated with the perception of quality found for the locker rooms and for the program of activities (Rho: 0.53 and 0.56, respectively, p < 0.01).
5. Discussion
The objective of this study was to investigate user satisfaction of persons over 40 years old in sports centers in the city of Malaga and to learn about the characteristics of these users.
Changes in the field of sports in the last 10 years and our present lifestyle have led to the inclusion of PA as an integral and important part of well-being. In addition to possible improvements to quality of life, PA represents a way to enjoy one’s leisure and free time. This implies a need for change in sports organization and management, with the inclusion of an evaluation of user satisfaction in all installations in order to satisfy society’s needs in general [8]. In this study, no differences were detected between sports centers regarding the perceived quality of sports service. The absence of differences in perception meant the sample was homogeneous, and differences could therefore be established with other independent variables in order to detect some objects for improvement. In spite of this, the sample cannot be considered representative as it is a case study, and it is not possible to generalize the results; it can only be used to describe the indicated perceptions without establishing cause–effect relationships [25].
Quality is fundamental for success and achievement of results and, consequently, for customer loyalty. This should be considered as a value that includes the entire organization and one where there is constant interaction among the elements that play a part in the process [26]. As the focal point of this process, the user and their opinion of perceived quality are fundamental in the evaluation of satisfaction [27,28,29].
At present, investigations on quality of service in the sports sector are increasing. This quality of service needs to be evaluated, and quality standards, which allow comparison with other sports environments, need to be controlled in order to maintain customer loyalty [17]. To date, most studies of quality have focused on identifying given dimensions in given sports activities, for leisure time as well as spectator sports, and although investigators have suggested various frameworks to summarize the factors, there is still no general agreement on one framework that takes into account all the dimensions.
Carrying out periodic and reliable evaluations of users’ perceived quality of services provided by sports centers is not an easy task. For this study, we used the CECASDEP questionnaire developed and validated by Gálvez and Morales [13]. At both national and international levels, there are other valid instruments available for the evaluation of perceived quality by users of sports services. Among the most recognized, we can name, in chronological order, those of Grönroos [20], Cronin and Taylor [30], Teas [31], and Brady and Cronin [32]. However, the works of Parasuraman, Zeinthaml, and Berry [14,33] using the SERVQUAL scale have undoubtedly had the greatest impact. This scale, based on expectations, is the most utilized tool in studies evaluating perceived quality of services [22,34].
Kim and Kim [35] developed the QUESC (Quality Excellence of Sports Centers) scale as an instrument specifically for evaluating quality in Korea. They established 11 dimensions: environment, employees’ attitude, reliability, information, program of activities, personal consideration, privileges, pricing, ease of comprehension, stimulation, and comfort. Another noteworthy instrument is the Inventory of Quality of Physical Activity Programs (ICPAF) in Spain, which was developed by Hernández-Mendo [36] and Morales, Hernández, and Blanco [37]. This useful instrument measures user satisfaction in the evaluation of relevant aspects of PA [38].
Vila, Sánchez, and Manassero [39] evaluated perceived user satisfaction using a questionnaire adapted by the University of Valencia and Baleares. Rial, Varela, Rial, and Real [40] measured perceived quality in privately owned sports centers using the QSport-10 scale, a questionnaire composed of 10 items divided into two dimensions: staff and installations.
The importance of trainers in an organization is notable in these studies. In the present study, participants gave their highest scores to trainers, up to 4.05 points out of a possible 5 (Figure 2). Similar results were reported in a study by Dorado [41], where the element receiving the highest score was the staff, while sports installation received the lowest score.
This study has several limitations or weaknesses. The first is the difficulty in obtaining authorizations to evaluate the quality of clients in sports centers. At the beginning of the investigation, four sports centers rejected evaluation of the quality of sports service in their centers. In addition, to avoid clients feeling that he or she would be identified, we only identified sex and age. However, participants could have been better characterized if we had information about weight, height, smoking habits, alcohol intake, medication consumption, and pathologies, among others. This data could have been valuable in determining the characteristics of clients and loyal users. Nevertheless, this study also has several strengths. A major finding of the present study was that users with greater customer loyalty (number of years attending a facility) gave the highest scores (Figure 3). This correlation has not been reported in the scientific literature to date. This scoring could be dependent on factors of well-being and confidence in the facility in general, although it appears to relate more closely to the trainer, an observation that should be examined in the future in order to reach a more definitive conclusion.
6. Conclusions
This study examined the perceived quality of service among people over 40 years of age in three sports centers in southern Spain. According to the CECASDEP questionnaire, which has been validated for Spanish adult samples, there was a notable difference between men and women in the dimensions of perceived quality. Women perceived a better quality of sports service, as observed by large effect sizes. However, this finding must be taken into account with caution as the small sample size of 303 participants means that it is not possible to generalize these results.
As a practical application, perceived quality is key to current management models and in meeting the demands of clients in sports centers. Using the CECADESP questionnaire, we have been able to demonstrate that the general level of satisfaction of perceived quality in users over 40 years of age at municipal sports centers in the city of Malaga can be classified as very positive, with a score of 7.1 out of 10. It was found that persons over 40 years of age choose a sports center for convenience, proximity to their house, and accessible prices and use it as a way to interact with others during their leisure time and maintain good health. In addition, they gave very positive appraisals of the trainers and formed a bond with them. Women demonstrated a higher level of satisfaction with the centers, adjusted more easily to the circumstances, and were more loyal to the centers. Men had more demands, were less accommodating, and requested changes in the program of activities.
It is recommended that sports managers pay special attention to the motivation and implication of sports instructors or trainers because this is the most valued dimension for users. This may help ensure that users do not abandon sports activities in favor of unhealthy lifestyle habits, such as a sedentary lifestyle. This study therefore has special relevance as the perception of high quality of sports service is associated with user satisfaction and, consequently, with the participation of users in sports. The importance of maintaining involvement in sports among the adult population is especially pertinent given the latest studies by the World Health Organization that indicate levels of sports participation continue to decline [42,43].
Author Contributions
The following statements should be used “conceptualization, A.C.-R. and W.O.-O.; methodology, J.L.C.-M.; software, A.C.-R.; validation, A.C.-R.; formal analysis, A.C.-R.; investigation, A.C.-R.; resources, W.O.-O.; data curation, A.C.-R.; writing—original draft preparation, A.C.-R.; writing—review and editing, W.O.-O.; visualization, W.O.-O.; supervision, J.L.C.-M.; project administration, W.O.-O.; funding acquisition, J.L.C.-M.
Funding
This research received no external funding
Conflicts of Interest
The authors declare no conflict of interest.
References
- Molina-García, J.; Castillo, I. Pensamiento sobre la gestión deportiva pública: Un estudio cualitativo con universitarios valencianos. Revista Actividad Física y Deporte: Ciencia y Profesión 2009, 10, 13–24. [Google Scholar]
- García, J.; Cepeda, G.; Martín, D. La satisfacción de clientes y su relación con la percepción de calidad en Centro de Fitness: Utilización de la escala CALIDFIT. Revista de Psicología del Deporte 2012, 21, 309–319. [Google Scholar]
- Aparicio Sarmiento, A.; López, G.; Isabel, M.; López Sánchez, G.F.; Díaz Suárez, A. Satisfacción de usuarios de dos clubes de pádel de Cartagena (Región de Murcia). Sport TK: Revista Euroamericana de Ciencias del Deporte 2016, 5, 27–32. [Google Scholar] [CrossRef]
- Kim, M.; Trail, G.T. The effects of service provider employment status and service quality exchange on perceived organizational image and purchase intention. Sport Manag. Rev. 2010, 13, 225–234. [Google Scholar] [CrossRef]
- García Mayor, J.; Vegara Ferri, J.M.; López Sánchez, G.F.; Díaz Suárez, A. Satisfacción de usuarios de servicios deportivos en Orihuela (Alicante). Sportk 2016, 5, 155–162. [Google Scholar] [CrossRef]
- World Health Organization. Physical Activity and Older People; WHO: Ginebra, Geneva, 2002. [Google Scholar]
- Salinas, F.; Cocca, A.; Viciana, J.; Kamal, M. Actividad Física y sedentarismo: Repercusiones sobre la salud y calidad de vida de las personas mayores. Retos: Nuevas tendencias en Educación Física 2010, 17, 126–129. [Google Scholar]
- Martínez, I.; Camps, A. La externalización de los servicios deportivos municipales. Estudio de caso de Bizkaia. Apunts: Educación Física y Deportes 2008, 92, 74–80. [Google Scholar]
- Ramos, P.; Pinto, J.A. Actividad física y ejercicio en los mayors; Instituto de Salud Pública Comunidad de Madrid: Madrid, Spain, 2005. [Google Scholar]
- Marcos, J.F.; Galiano, D. El envejecimiento y sus problemas; El ejercicio como solución de algunos de ellos; Consejería de Turismo y Deporte: Sevilla, Spain, 2004. [Google Scholar]
- Landi, F.; Onder, G.; Carpenter, I.; Cesari, M.; Soldato, M.; Bernabei, R. Physical activity prevented functional decline among frail comunity-living elderly subject in an international observational study. J. Clin. Epidemiol. 2007, 60, 518–524. [Google Scholar] [CrossRef]
- Rebollo, S.; Sánchez, A. Situación del mercado laboral actual en el ámbito de la actividad física y deportiva. Eur. J. Hum. Mov. 2000, 6, 141–154. [Google Scholar]
- Gálvez Ruiz, P.; Morales Sánchez, V. Evaluación de la calidad en los programas municipales deportivos: Generalizabilidad y optimización de diseños de medida. Rev. Cuad. de Psicol. del Deporte 2011, 11, 123–130. [Google Scholar]
- Parasuraman, A.; Zeithaml, V.; Berry, L. SERVQUAL: A multiple-item scale for measuring consumer perceptions of service quality. J. Retail. 1988, 64, 12–40. [Google Scholar]
- Afthinos, Y.; Theodorakis, N.D.; Nassis, P. Customer´s expectations of service in Greek fitness centres. Gender, age, type of sport center and motivation differences. Manag. Serv. Qual. 2005, 15, 245–258. [Google Scholar] [CrossRef]
- Sanz, I.; Redondo, J.; Gutiérrez, P.; Cuadrado, G. La satisfacción en los practicantes de spinning: Elaboración de una escala para su medición. Mot. Eur. J. Hum. Mov. 2005, 71, 17–36. [Google Scholar]
- Calabuig, F.; Quintanilla, I.; Mundina, J.J. La calidad percibida de los servicios deportivos: Diferencias según instalación, género, edad y tipo de usuario en servicios náuticos. Int. J. Med. Sci. Phys. Act. Sport 2008, 4, 25–43. [Google Scholar]
- Sánchez-García, C.; González-Carcelén, C.; López-Sánchez, G.; Díaz-Suárez, A. Satisfacción de clientes externos Estudio de caso de una piscina cubierta. SPORT TK-Revista EuroAmericana de Ciencias del Deporte 2017, 6, 81–88. [Google Scholar] [CrossRef]
- Mestre, J.A. Componentes de la gestión deportiva. Una aproximación. Revista de Educación Física 2013, 2, 1–19. [Google Scholar]
- Grönroos, C. A service quality model and its marketing implications. Eur. J. Mark. 1984, 18, 36–44. [Google Scholar] [CrossRef]
- Parasuraman, A.; Zeithaml, V.; Berry, L. A Conceptual Model of Service Quality and its Implications for Future Research. J. Mark. 1985, 49, 41–50. [Google Scholar] [CrossRef]
- Morales Sánchez, V.; Hernández Mendo, A.; Blanco, A. Evaluación de la calidad en organizaciones deportivas: Adaptación del modelo SERVQUAL. Revista de Psicología del Deporte 2009, 18, 137–150. [Google Scholar]
- Nunnally, J.C. Psychometric Theory; McGraw-Hill: New York, NA, USA, 1976. [Google Scholar]
- Coe, R.; Merino, C. Magnitud del efecto: Una guı´a para investigadores y usuarios. Rev. Psicol. 2003, 21, 147–177. [Google Scholar]
- Castro-Sánchez, M.; Zurita-Ortega, F.; Chacón-Cuberos, R. Motivación hacia el deporte en función de variables sociodemográficas en estudiantes universitarios de granada. J. Sport Health Res. 2019, 11, 55–68. [Google Scholar]
- García Ferrando, M. La gestión del deporte en el ámbito municipal: De la promoción a la fidelización del cliente. In Deporte y cambio social en el umbral del siglo XXI; Latiesa, M., Ed.; Esteban Sanz: Madrid, Spain, 2001; pp. 17–40. [Google Scholar]
- García-Mas, A. Psicología del turismo deportivo. Psicología del Deporte 2003, 2, 6–24. [Google Scholar]
- Redondo, J.C.; Olivar, D.; Redondo, A. El modelo EFQM de gestión de la calidad en las instalaciones deportivas; Wanceulen: Sevilla, Spain, 2006. [Google Scholar]
- Onetti-Onetti, W.; Castillo-Rodríguez, C.; Castillo-Rodríguez, A. Assessment of elderly people characteristics and their relationship with the perceived quality of sport management. Rev. Iberoam. de Ciencias de la Act. Física y el Deporte 2018, 7, 110–118. [Google Scholar]
- Cronin, J.J.; Taylor, S.A. Measuring service quality: A reexamination and extension. J. Mark. 1992, 56, 55–68. [Google Scholar] [CrossRef]
- Teas, R.K. Expectations, performance, evaluation and consumer’s perceptions of quality. J. Mark. 1993, 57, 18–34. [Google Scholar]
- Brady, M.; Cronin, J. Some new thoughts on conceptualizing perceived service quality: A hierarchical approach. J. Mark. 2001, 65, 34–49. [Google Scholar] [CrossRef]
- Parasuraman, A.; Zeithaml, V.; Berry, L. More on improving service quality measurement. J. Retail. 1993, 69, 140–147. [Google Scholar] [CrossRef]
- Barrera, R.; Reyes, M.C. Análisis comparado de las escalas de medición de la calidad de servicio. Personal communication. In XIII Jornadas Hispano-Lusas de Gestión Científica; University of Santiago de Compostela: Lugo, Spain, 2003; pp. 285–294. [Google Scholar]
- Kim, D.; Kim, S.Y. QUESC: An instrument for assessing the service quality of sport centers in Korea. J. Sport Manag. 1995, 9, 208–220. [Google Scholar] [CrossRef]
- Hernández Mendo, A. Un cuestionario para evaluar la calidad en programas de actividad física. Rev. de Psicol. del Deporte 2001, 10, 179–196. [Google Scholar]
- Morales Sánchez, V.; Hernández Mendo, A.; Blanco, A. Evaluación de la calidad en los programas de actividad física. Psicothema 2005, 17, 311–317. [Google Scholar]
- Hayes, B.E. Cómo medir la satisfacción del cliente: Desarrollo y utilización de cuestionarios; Ediciones Gestión 2000: Barcelona, Spain, 2002. [Google Scholar]
- Vila, I.; Sánchez, C.; Manassero, M.A. Satisfacción percibida de los usuarios de las instalaciones deportivas municipales de Palma de Mallorca. Rev. Iberoam. de Psicol. del Ejerc. y el Deporte 2009, 4, 59–74. [Google Scholar]
- Rial, J.; Varela, J.; Rial, A.; Real, E. Modelling and Measuring Perceived Quality in Sports Centres: QSport-10 scale. Int. J. Sport Sci. 2010, 18, 57–73. [Google Scholar]
- Dorado, A. Análisis de la satisfacción de los usuarios del servicio deportivo municipal. Rev. de Educ. Física INDEref. 2007, 35, 17–22. [Google Scholar]
- López Sánchez, G.F.; González Víllora, S.; Díaz Suárez, A. Level of habitual physical activity in children and adolescents from the Region of Murcia (Spain). Springer Plus 2016, 5, 1–6. [Google Scholar] [CrossRef] [PubMed]
- López Sánchez, G.F.; Ahmed, D.; Borrego Balsalobre, F.J.; López Sánchez, L.; Díaz Suárez, A. Level of habitual physical activity in 8-9 years old schoolchildren from Spain and India. MHSalud Rev. en Cienc. del Mov. Hum. y Salud 2016, 12, 1–10. [Google Scholar]
Figure 1.
Distribution of customer loyalty according to age span and gender.

Figure 2.
Mann–Whitney U test of sports service quality according to gender.

Figure 3.
Kruskal–Wallis H test of perception of quality of service as a function of customer loyalty (1–5).
Figure 3.
Kruskal–Wallis H test of perception of quality of service as a function of customer loyalty (1–5).


Table 1.
Characteristics of the participants.
| Years | Male (M) | Female (F) | Total |
|---|---|---|---|
| 41–50 | 22 | 30 | 52 |
| 51–60 | 67 | 73 | 140 |
| 61–70 | 34 | 68 | 102 |
| >70 | 0 | 9 | 9 |
Table 2.
Rho de Spearman test between perceived quality of sports service.
| Activity Space | Locker Rooms | Programs of Activity | Trainers | |
|---|---|---|---|---|
| Customer loyalty | 0.17 ** | 0.14 * | 0.23 ** | 0.31 ** |
| Sports installations | 0.44 ** | 0.35 ** | 0.45 ** | 0.32 ** |
| Activity space | 0.67 ** | 0.51 ** | 0.51 ** | |
| Locker rooms | 0.48 ** | 0.53 ** | ||
| Programs of activity | 0.56 ** |
** p < 0.01; * p < 0.05.
© 2019 by the authors. Licensee MDPI, Basel, Switzerland. This article is an open access article distributed under the terms and conditions of the Creative Commons Attribution (CC BY) license (http://creativecommons.org/licenses/by/4.0/).
Share and Cite
MDPI and ACS Style
Castillo-Rodriguez, A.; Onetti-Onetti, W.; Chinchilla-Minguet, J.L. Perceived Quality in Sports Centers in Southern Spain: A Case Study. Sustainability 2019, 11, 3983. https://doi.org/10.3390/su11143983
AMA Style
Castillo-Rodriguez A, Onetti-Onetti W, Chinchilla-Minguet JL. Perceived Quality in Sports Centers in Southern Spain: A Case Study. Sustainability. 2019; 11(14):3983. https://doi.org/10.3390/su11143983
Chicago/Turabian StyleCastillo-Rodriguez, Alfonso, Wanesa Onetti-Onetti, and José Luis Chinchilla-Minguet. 2019. "Perceived Quality in Sports Centers in Southern Spain: A Case Study" Sustainability 11, no. 14: 3983. https://doi.org/10.3390/su11143983
Note that from the first issue of 2016, this journal uses article numbers instead of page numbers. See further details here.