1. Introduction
Each year approximately 1.3 million people die in traffic crashes around the world and between 20 and 50 million people are injured or disabled. Road traffic deaths account for 25% of all injury deaths worldwide, with traffic injuries being the 8th cause of death for people of all ages [
1]. While all the regions of the world experience road traffic injuries, low-and middle-income countries (including Latin American countries) are disproportionately affected. Although these countries account only for 54% of vehicles registered world-wide, they account for 90% of road traffic fatalities [
1].
The Latin America and the Caribbean region has one of the highest roadway fatality rates in the world, with approximately 17 traffic related fatalities per 100,000 inhabitants, compared to less than 10 fatalities per 100,000 inhabitants in high-income countries [
2].
Active transportation, typically in the form of walking or cycling, is an essential mode of transportation in developing countries, where walking accounts for between 9% and 20% of all trips. However, pedestrians, particularly in low-income countries, are highly vulnerable road users, as they face a higher risk of injury and are involved in a large share of fatal collisions with vehicles relative to other modes [
3]. Pedestrians and cyclists represent more than 25% of the fatalities in Latin American countries, with the share rising to more than 50% in some countries (in comparison to 16% of road fatalities in the United States) [
4,
5]. In the face of increasing pressure on cities associated with rapid urban growth and motorization, road traffic injuries and fatalities, particularly for vulnerable users, are expected to increase [
6].
While many developed countries have established road safety programs and action plans, (e.g., “Vision Zero”), such programs are often absent or weak in Latin America. Crash data and knowledge needed for designing and evaluating traffic safety programs frequently do not exist or are limited in quality. This is attributed to several factors. Weak institutional arrangements often impede the development and management of adequate crash notification and registration systems. Additionally, government entities frequently lack the economic resources needed for the acquisition of the adequate tools for traffic safety analysis and evaluation. As a result, crash data needed for designing effective traffic safety programs frequently do not exist or are limited in quality with levels of underreporting of traffic incidents estimated to reach as high as 50% [
7,
8,
9,
10].
Instead of using a reactive crash-based approach, recent developments in surrogate safety measures and video analytic tools offer an alternative approach that can lower the monetary and time costs of traffic safety analysis. These measures utilize data on road user interactions or conflicts that do not turn into crashes but can be observed frequently. They can be divided into measures of time or distance proximity, such as post-encroachment time (PET) or time-to-collision (TTC), and event severity such as speeds, trajectory angles, type of road users involved, among others. This approach is particularly attractive in cases where traffic collision data is incomplete, missing, or the number of crashes observed too small for causal inference [
11]. It can also provide a rapid analysis in the stages of diagnosis and in before-and-after studies, allowing for the development and implementation of pro-active road safety programs and strategies, enabling authorities to act before collisions occur.
Most studies applying surrogate safety tools focus on the developed countries context, which can vary dramatically from that of developing countries [
12]. Traffic conditions tend to be more variable and chaotic, and transportation infrastructure, particularly for non-motorized modes, tends to be lacking or of very low quality in developing countries. For example, rapid unplanned urban development can lead to city blocks being infilled, leaving little room for sidewalks or cycle lanes, forcing pedestrians and cyclists to travel in roads mixed with vehicle traffic [
13]. These factors can lead to distinct traffic patterns and risk factors that contribute to injury collisions compared to those found in developed countries.
Research on the causes of injury crashes and the effectiveness of measures to reduce them is key to the effective targeting of limited resources for traffic safety-related programs. However, few studies have been conducted on this topic in the context of developing countries. Accordingly, the objective of this paper is to develop and test a methodology for the implementation of a surrogate-based traffic safety analysis that can aid in the diagnosis and evaluation of countermeasures to improve pedestrian safety in Latin American countries. The study develops and applies a methodology for pedestrian safety analysis using a video analytics tool and surrogate safety measures. The objective is then to identify the contributing factors that are associated with high-risk vehicle-pedestrian interactions at three common types of junctions and evaluate low-cost countermeasures with using the surrogate measures and before-after approach [
14].
To this end, we implemented a pilot project involving a sample of intersections in the city of Cochabamba in central Bolivia. The fourth largest city in the country, with an urban population of more than 600,000 citizens and a large indigenous population, urban mobility in the city is highly dependent on public transit and walking, given that a substantial portion of the population is low-income individuals. Nearly 2 million trips are made during a weekday, with 53% of those made by public transportation, and 24% by walking [
15]. Over 4000 crashes (22% of those crashes involved a pedestrian) were reported in the metropolitan area of Cochabamba in 2012, representing 10% of those at the national level in the same year. The area also has one of the highest mortality rates for pedestrians in the country; for every five crashes that were fatal, two involved a pedestrian [
16].
This paper is structured as follows.
Section 2 presents a review of the literature.
Section 3 and
Section 4 explain the data collection and methodology used for the analysis.
Section 5 presents the results and analysis of the data and
Section 6 closes with conclusions and reflections on policy implications of the research findings.
2. Literature Review
This literature review is divided into three sections.
Section 2.1 reviews the literature on pedestrian safety in the context of developing countries, including Latin America.
Section 2.2 discusses surrogate safety methodologies applied to crosswalk safety.
Section 2.3 explores the literature on impacts of pedestrian crossing and traffic-calming treatments in the context of low-medium income economies.
2.1. Pedestrian Safety in the Context of Developing Countries
Past research on pedestrian safety at crosswalks in developing countries [
17,
18,
19,
20,
21] finds a high rate of pedestrian-vehicle conflicts and crashes in Latin American and Caribbean cities. This is attributed in part to a greater variety and intensity of traffic mix and to a lack of infrastructure that provides separation between fast, motorized, and slow-moving non-motorized road user groups. Given the frequent lack of adequate pedestrian infrastructure, pedestrians often wait in the street instead of on the sidewalk before crossing, leading to increased exposure. Moreover, both vehicles and pedestrians frequently do not comply with traffic rules: vehicles frequently fail to yield to pedestrians, and pedestrians tend to cross streets outside of crosswalk boundaries [
22].
Although the safety of pedestrians is a heavily researched topic in developing countries, limited work has examined vehicle–pedestrian interactions and conflicts, and the underlying factors that cause collisions. Pedestrian safety studies have been conducted mainly using crash data (fatal and non-fatal accidents), which as discussed before, can suffer from several issues including underreporting, location errors, and misclassification, among others, leading to possible biases and errors in study results and conclusions [
10]. Among the few studies, Diogenes and Lindau [
23] analyzed pedestrian crashes in Porto Alegre, Brazil, to evaluate the potential risk of pedestrian crashes at midblock crossings with and without traffic signals using a Poisson regression model. The authors found that pedestrian crash risk is influenced by the presence of busways and bus stops, road width, traffic volume and the number of lanes. Despite the large body of literature on pedestrian safety, there is a lack of research investigating pedestrian safety in the Latin American context. In part, as mentioned previously, this is due to the lack of crash data in this region.
2.2. Surrogate Safety Measures and Methodologies
Due to the limitations of using crash data, many studies have attempted to use surrogate safety methods to investigate pedestrian-vehicle interactions and conflicts [
12,
24,
25], with numerous surrogate safety indicators having been developed in the last few decades [
8]. Traffic conflicts are defined as an event involving the interaction of two or more road users in a traffic flow situation in which one or both road users must take evasive action such as braking or swerving to avoid a collision [
26]. Methods for surrogate safety analysis of traffic conflicts can be categorized as either event-based techniques or as traffic flow techniques. Analyses that consider the occurrence or severity of individual “near-crash” events (including individual conflicts) are considered event-based techniques. Other surrogate safety techniques may use aggregate measures of traffic flow, including traffic volumes and speeds.
Common event-based surrogate safety measures of traffic risk include time-to-collision (TTC) and post-encroachment time (PET). TTC is “the time required for two vehicles to collide if they continue at their present velocity and on the same path” [
27] or, more generally, if their movements remain unchanged. Conflicts between pedestrians and vehicles may be divided into discrete severity levels based on different PET and TTC thresholds. However, this technique can be modified to include variations in speed and direction using motion prediction. TTC is measured continuously and, depending on the choice of motion prediction method, will yield a vector of measurements over time when there is a collision course. PET is defined as the difference in time between the first and second road users (vehicles or nonmotorized) arriving at the potential conflict point [
22] (
Figure 1). It is based on observed trajectories and can be computed only if trajectories intersect. Both PET and TTC can usually be computed for the same interaction and are complementary in the analysis of conflicts [
27].
Surrogate risk measures should ideally incorporate both collision (or crash) risk and injury severity risk associated with conflicts [
24]. Vehicle speed is a key predictor of the crash risk potential and the likelihood of injury in the case of a collision [
8]. PET is particularly suited to predicting collisions at pedestrian crossings [
25] and those associated with interactions involving turning movements PET is also faster to compute than TTC (with more realistic motion prediction methods). Several correlation studies using data from actual crashes and surrogate collision risk measures have found both TTC and PET to be reliable predictors of collision risk (7 for PET and 5 in the case of TTC) [
24,
28].
With the improvement of computer power, computer vision techniques have become a useful tool for such surrogate safety analysis. Although rarely used in Latin American countries, the development of computer vision techniques has created the possibility of investigating conflicts and crossing behaviors in a more precise and microscopic way [
12,
29,
30]. In addition, the relationship between traffic conflicts and actual crash outcomes have been demonstrated in several recent studies that found that traffic conflicts provide a useful insight into what leads to collisions [
14,
28,
31,
32,
33,
34]. Microscopic data is extracted from video that has been processed and extracted as user trajectories in order to identify patterns in traffic events [
35].
The purpose of the techniques is to collect the necessary data to help with the prediction of conflicts or near collisions (defined as an event involving the interaction of two or more road users, other in a traffic flow situation in one or both road users must take evasive action such as braking or swerving to avoid a collision [
36]. The development of these techniques has created the possibility of investigating conflicts and crossing behaviors in a more precise and microscopic way than with crash data [
12,
22,
29].
As some examples, video analysis has been used to analyze collision on right-turn smart channels [
37], to gain understanding of collision factors [
35], to automatically collect cyclist data [
38], analysis of cyclist behavior when there are discontinuities on a cyclist network [
39], develop conflict-based safety performance functions for signalized intersections [
40]. Its capacity to compute large amount of road users as demonstrated in a study of nearly 40 roundabouts [
41]. In addition, the relationship between surrogate safety measures based upon traffic conflicts and actual crash outcomes has been demonstrated in several recent studies that found that traffic conflicts provide a useful insight into what leads to collisions [
14,
28,
31,
32,
33,
34]. To the authors’ knowledge, no prior studies have documented the feasibility of this approach in low-income countries using surrogate safety analysis.
2.3. Impacts of Pedestrian Crossing and Traffic Calming Treatments
In developed countries, a wide variety of countermeasures have been investigated to address pedestrian safety issues. Most of these include before-after studies investigating the effectiveness of treatments applied to sites strategically selected using guidelines such as those published by the American Association of State Highway and Transportation Officials (AASHTO) manual [
42] or others. Effectiveness is then evaluated by comparing the crash frequency and/or rates before and after the implementation of countermeasures. The effectiveness of the measures depends on the road and traffic conditions and the compliance and enforcement of traffic rules, among other factors. Infrastructure measures such as installing traffic lights and pedestrian signals, extending curbs, building raised medians on multi-lane roads and improving lighting and visibility have been found to be effective safety measures to varying degrees [
43].
In developing countries, financial constraints make particularly salient the identification of low-cost treatments so that they can be replicated in large numbers (at the city scale). Nevertheless, in Latin American countries, research on treatment effectiveness is less prevalent. Several before-after studies have been documented in developed countries using surrogate safety analysis [
8,
12,
24,
25]; however, to the authors’ knowledge; no studies have documented the feasibility of this approach in low-income countries. Additionally, few methodological approaches have been developed to identify risk factors and evaluate the effectiveness of countermeasures in the context of little to no available crash data. This study evaluates the impact of low-cost and temporary changes to the road environment in a short time period using a surrogate safety approach.
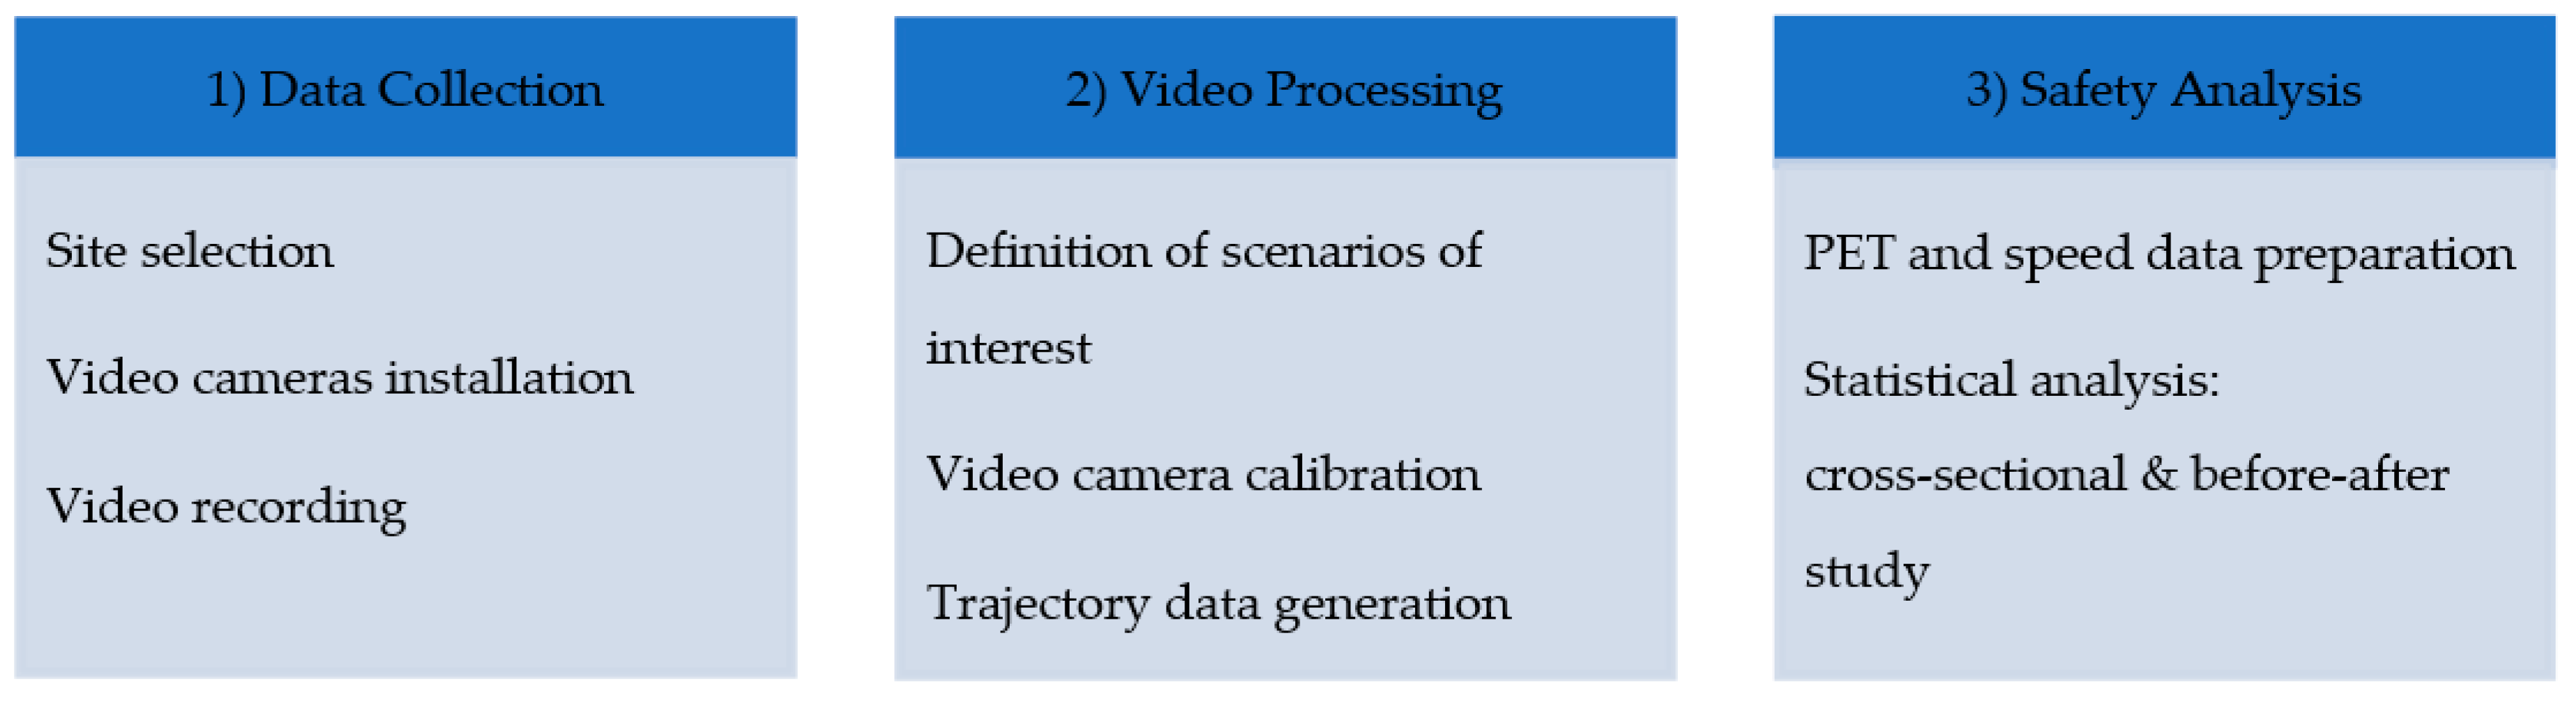
3. Methodology
The research method was implemented in three stages: (1) site selection and data collection, (2) video processing, and (3) safety analysis (
Figure 2).
3.1. Identification and Selection of Sites
The selection of sites (intersections) was carried out through the participation of a working group that included transportation engineers and planners working for the local government of the city of Cochabamba and road safety experts from the Inter-American Development Bank. A preliminary long list of nine of locations was first defined by the local authorities. Three of these sites were roundabouts and the remainder were intersections. After a field visit, a final shortlist of sites was selected for the diagnosis. The site selection sought to include the three most common types of intersections in the city: T intersections, at 4-legged non-signalized and signalized intersections, and roundabouts. In order to observe the maximum number of interactions and have a wide range of traffic conditions, the presence of high pedestrian activity and vehicle traffic were also criteria considered in the site selection as well as the availability of feasible locations to install cameras at the appropriate height and angles to capture frequented pedestrian crossings. For the countermeasure evaluation, low-cost treatments were temporally implemented in two sites, using a similar approach to that referred to as “tactical urbanism design” an approach that aims to reform and improve urban spaces through fast and easily applied measures that demonstrate the possibility of large-scale and long-term changes in cities [
44].
3.2. Video Data Collection and Processing
Data was collected in 2017 between the months of July and November using video cameras that were installed temporarily on existing infrastructure (lamp posts and buildings). Recordings were all conducted during the dry season in Bolivia, and the weather was similar during the time of the video collection.
High-definition cameras were used with a 2048 × 1536 pixels resolution and 30 frames per second. Cameras were installed at a minimum height of five meters. Collected video data was then processed using a computer vision software solution, Brisk Lumina, developed by Brisk Synergies, which integrates and utilizes deep and machine learning object detection algorithms for traffic safety analysis. Algorithms process data on moving objects in video (in this case vehicles and pedestrians), despite variations from the original forms (inputs for the learning model) with respect to their basic characteristics of position, shape and lighting; and to follow its trajectories in different environments.
Video processing was conducted in three steps: (1) definition of scenarios of interest; (2) video calibration; and (3) data generation. A traffic scenario is composed of a vehicular traffic movement that interacts with pedestrians and generates crash risk exposure, such as through or turning vehicles interacting with pedestrians crossing at a given intersection approach. In roundabouts, movements are divided into a pedestrian interacting with vehicles going through the roundabout or turning to leave it.
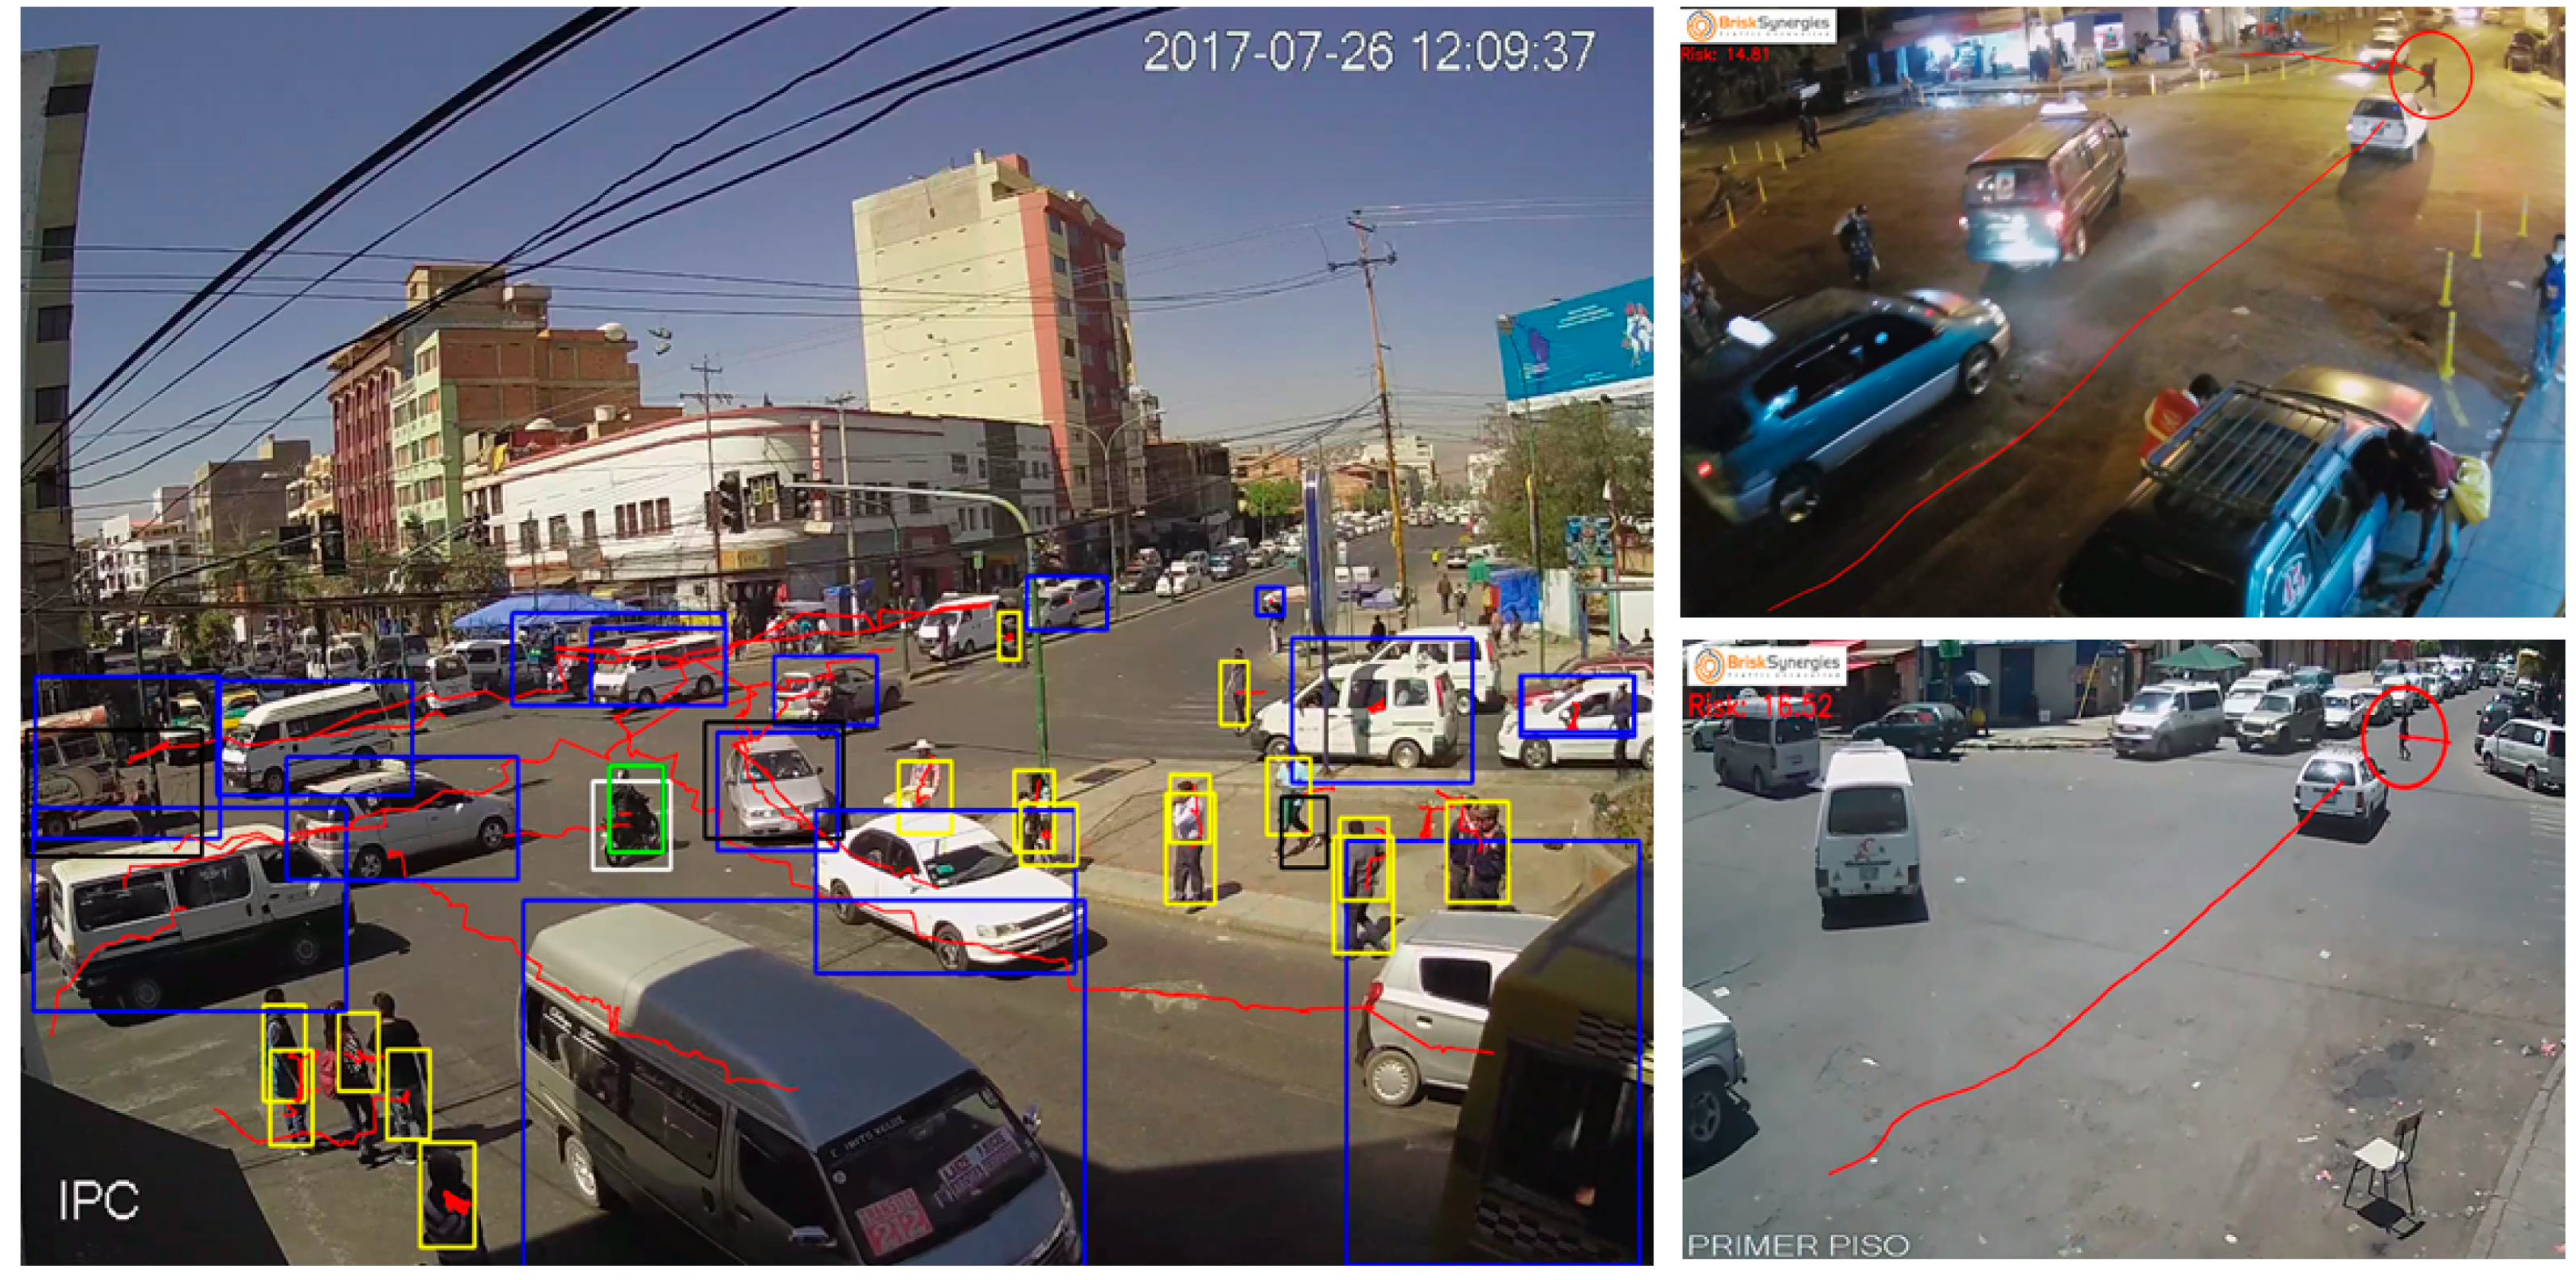
Video calibration included adjusting homography, defining the conflict zones, and applying pre-trained deep learning models. Homography is defined as two images of the same planar surface in space that are related to each other. In this case, it was used to map the points in the video corresponding to coordinates in the street. The software detects, classifies and tracks road users in the video to generate data on the road-user type (e.g., car, truck, bus, motorcycle, pedestrian, etc.), trajectories, position, and speed and surrogate safety measures for each road user interactions at each frame (
Figure 3).
The object detection and classification elements utilize a deep learning neural network capable of detecting different types of objects (e.g., truck, bus, car, pedestrian, etc.). A commercial computer vision software was used for object (road-user) detection, classification and tracking. For improving detection and classification accuracy, the neural-network models had been trained on many large-scale datasets. Object tracking and detection of road user trajectories were used to compute, speeds, vehicle counts per unit time, and surrogate safety measures for each road user interaction (
Figure 3 and
Figure 4).
3.3. Generation of Surrogate Safety Measures
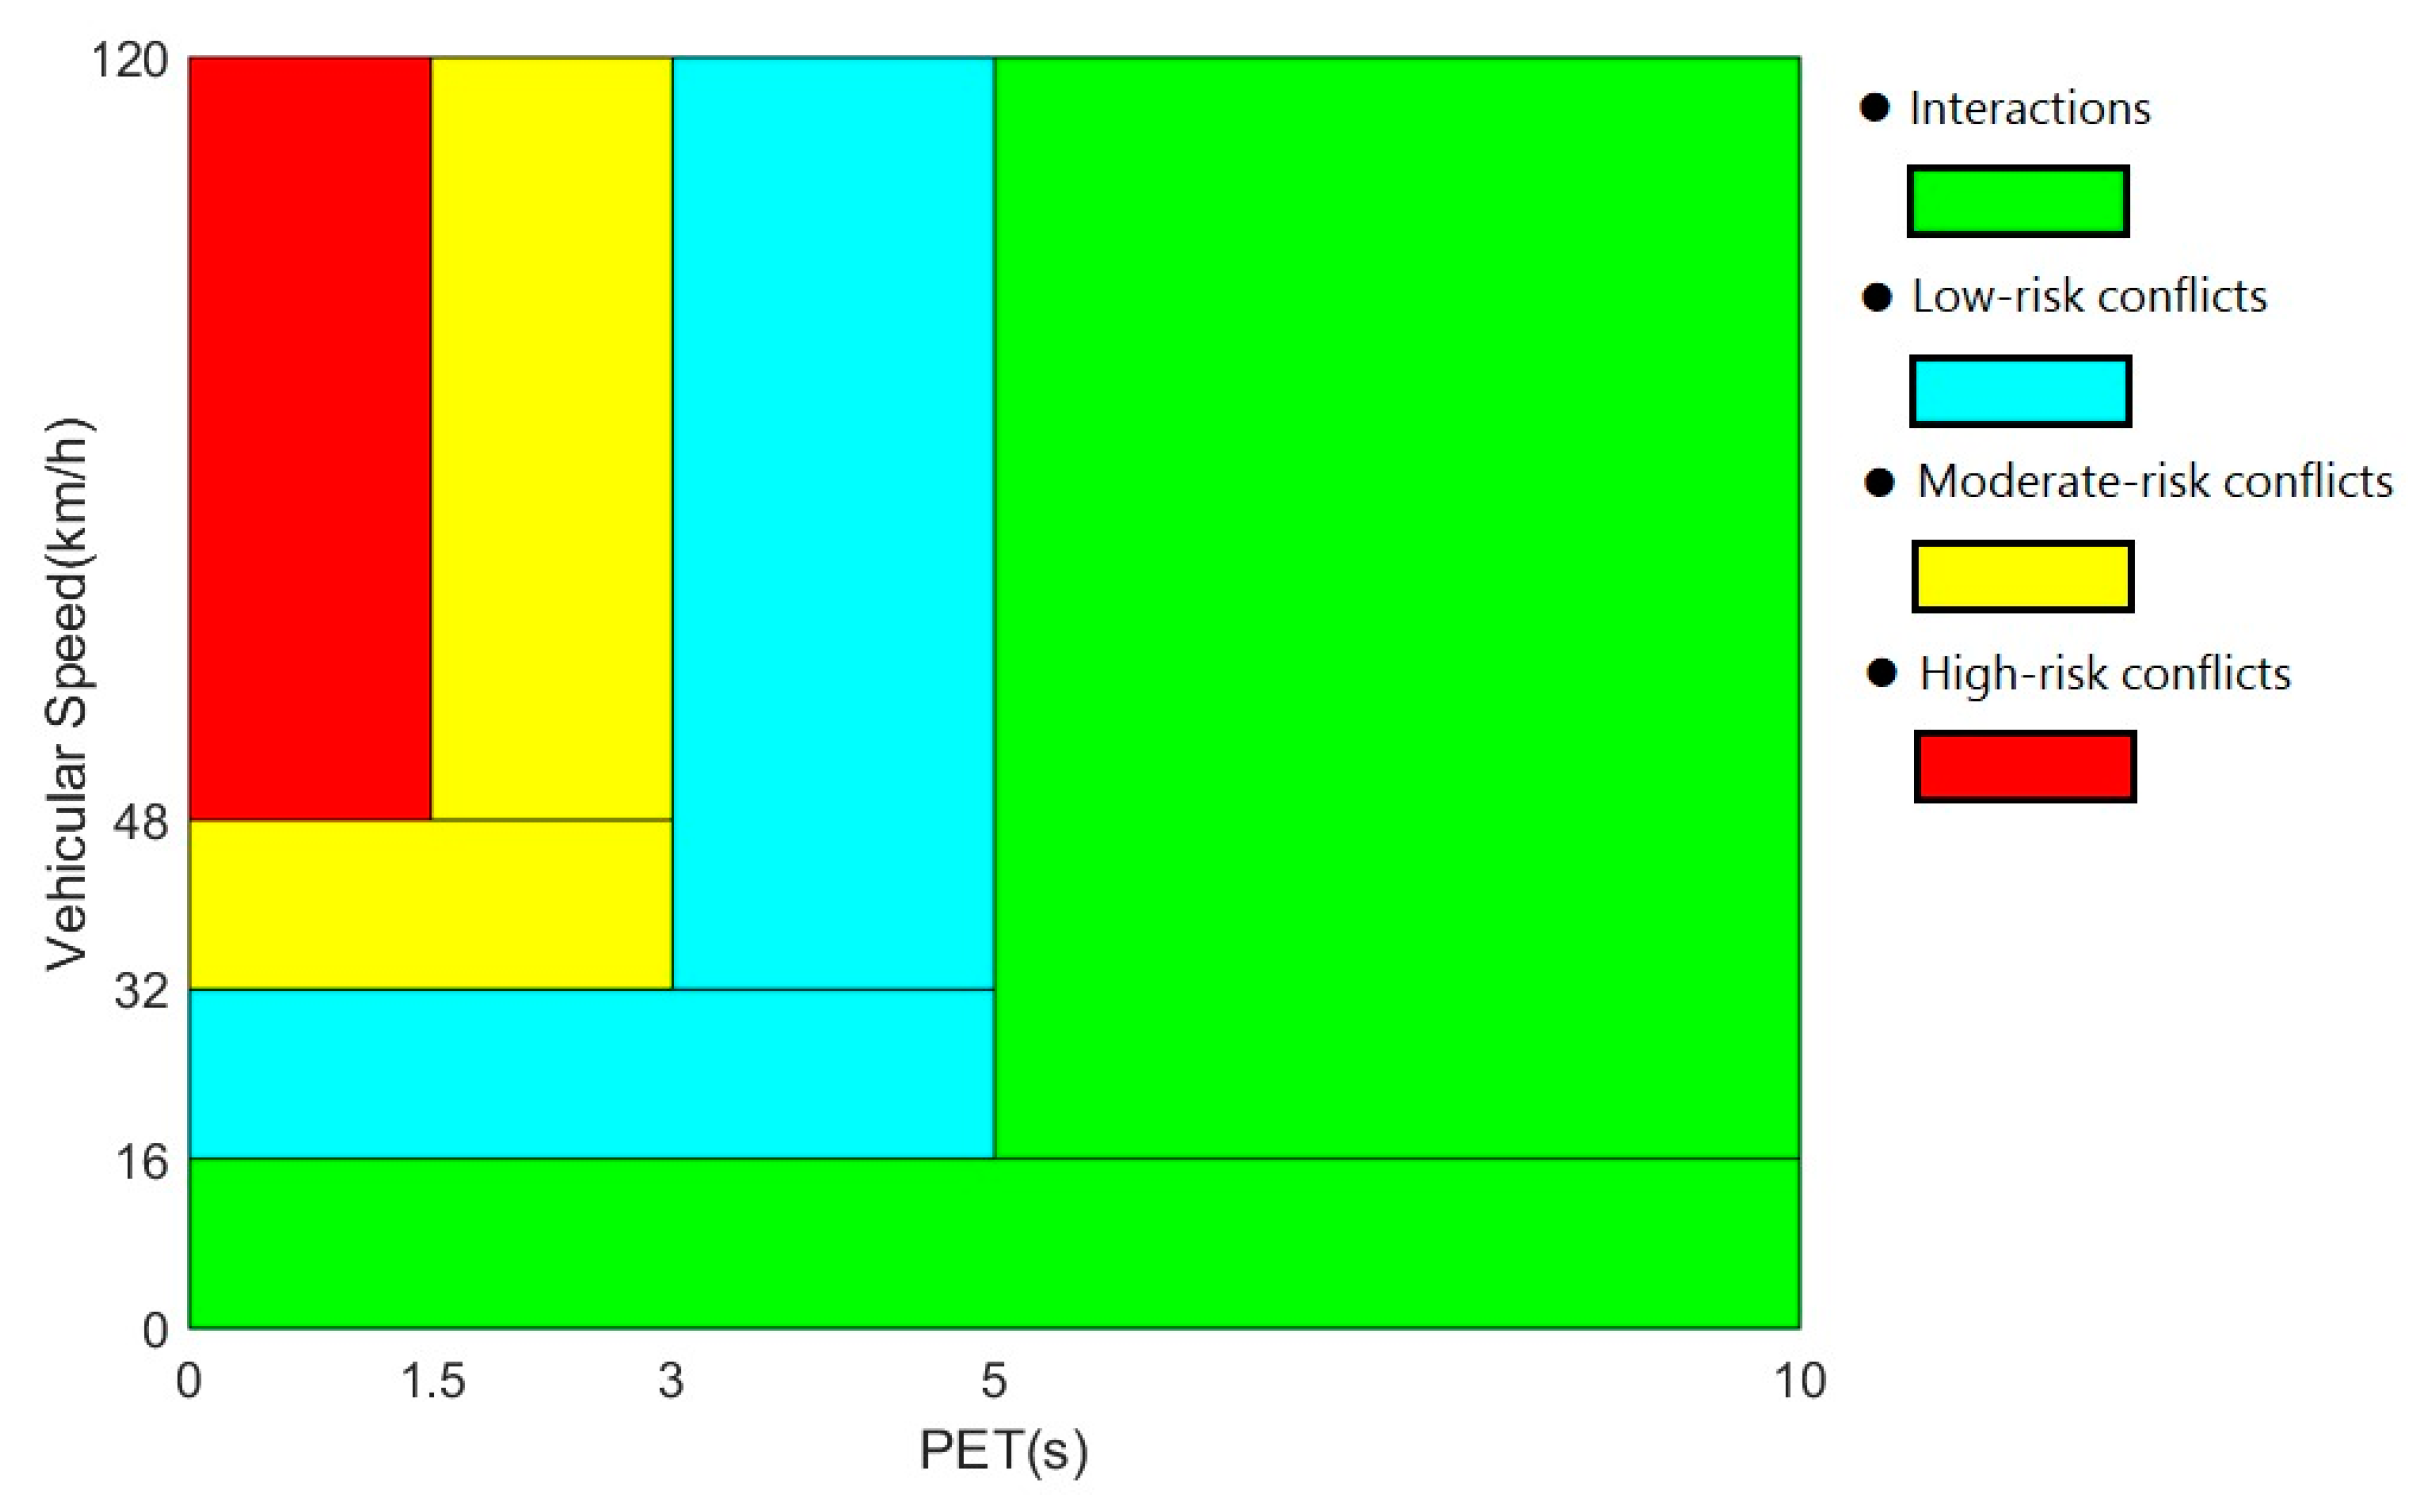
Three surrogate traffic safety measures were analyzed: (1) vehicle speed, (2) PET, and (3) a crash severity risk index. As PET alone is insufficient to estimate the injury risk of a potential collision, we combine the PET and the 85th percentile speed of each vehicle into a single surrogate risk indicator (RI), to capture both the risk of injury and collision. We calculate the ratio of vehicle speed over PET (RI = VS85/PET). Next, we classify risk levels based upon published probabilities of fatal injuries in pedestrian–vehicle collisions at varying vehicle speeds and human reaction and breaking times in the literature.
According to Fuller et al., 2009 [
45], the probability of a fatal pedestrian injury involving a vehicle at 32 km/h, 48 km/h and 64 km/h car speeds, is 5%, 45% and 85%, respectively. The human reaction and braking time depend on the driver’s age, physical condition and concentration; however, 1.5 s can be considered the average estimate for the simplest kind of reaction time to react to a potential collision [
46,
47].
Figure 5 shows the conflict severity by PET and speed where the speed represents the 85th percentile speed of the involved vehicle in km/h, and the PET is in seconds.
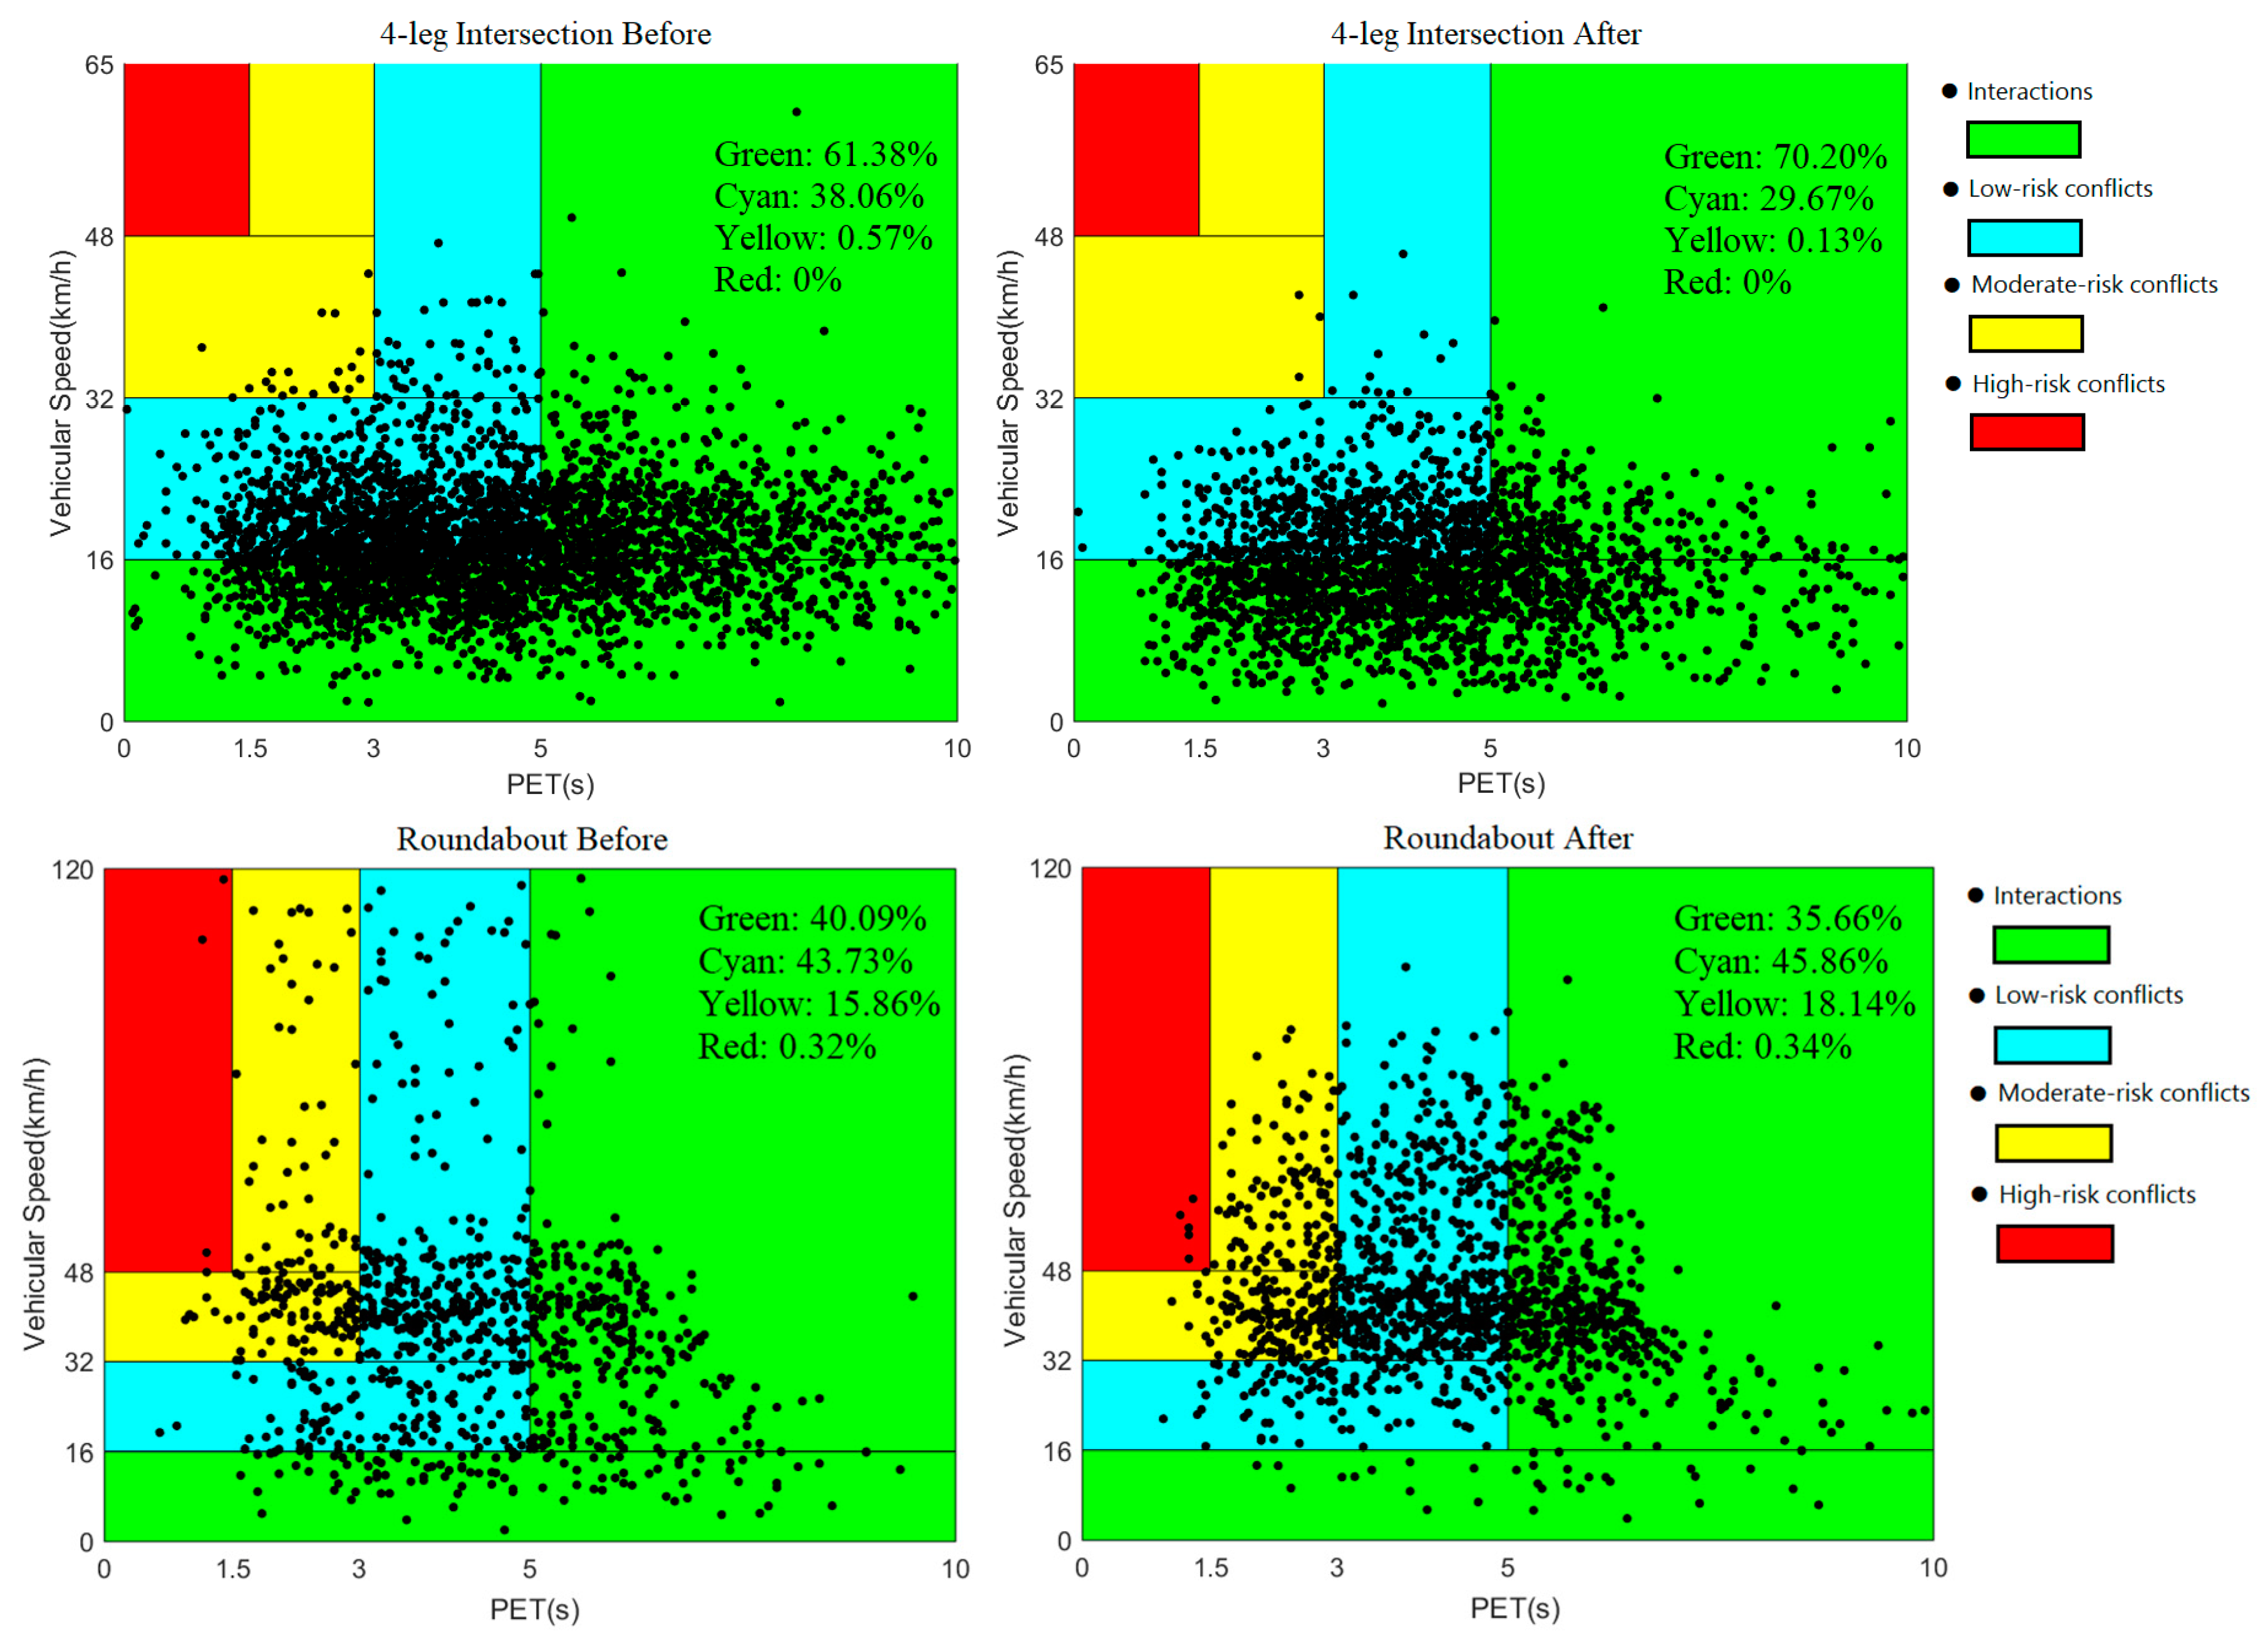
Based on collision probability measured as PET and severity injuries, measured as vehicle speed at impact, pedestrian–vehicle interactions were classified by the degree of risk into four categories: safe interactions (green), low (cyan), moderate (yellow), and high (red). High-risk interactions are defined as when speed is higher than 48 km/h and PET is lower than 1.5 s, moderate-risk conflicts are defined as when vehicle speed is higher than 32 km/h and PET is lower than 3 s, low-risk conflicts are defined as vehicle speeds above 16 km/h but less than 32 km/h and PET is less than 5 s, and safe interactions are defined as vehicle speeds below 16 km/h and PET is higher than 5 s.
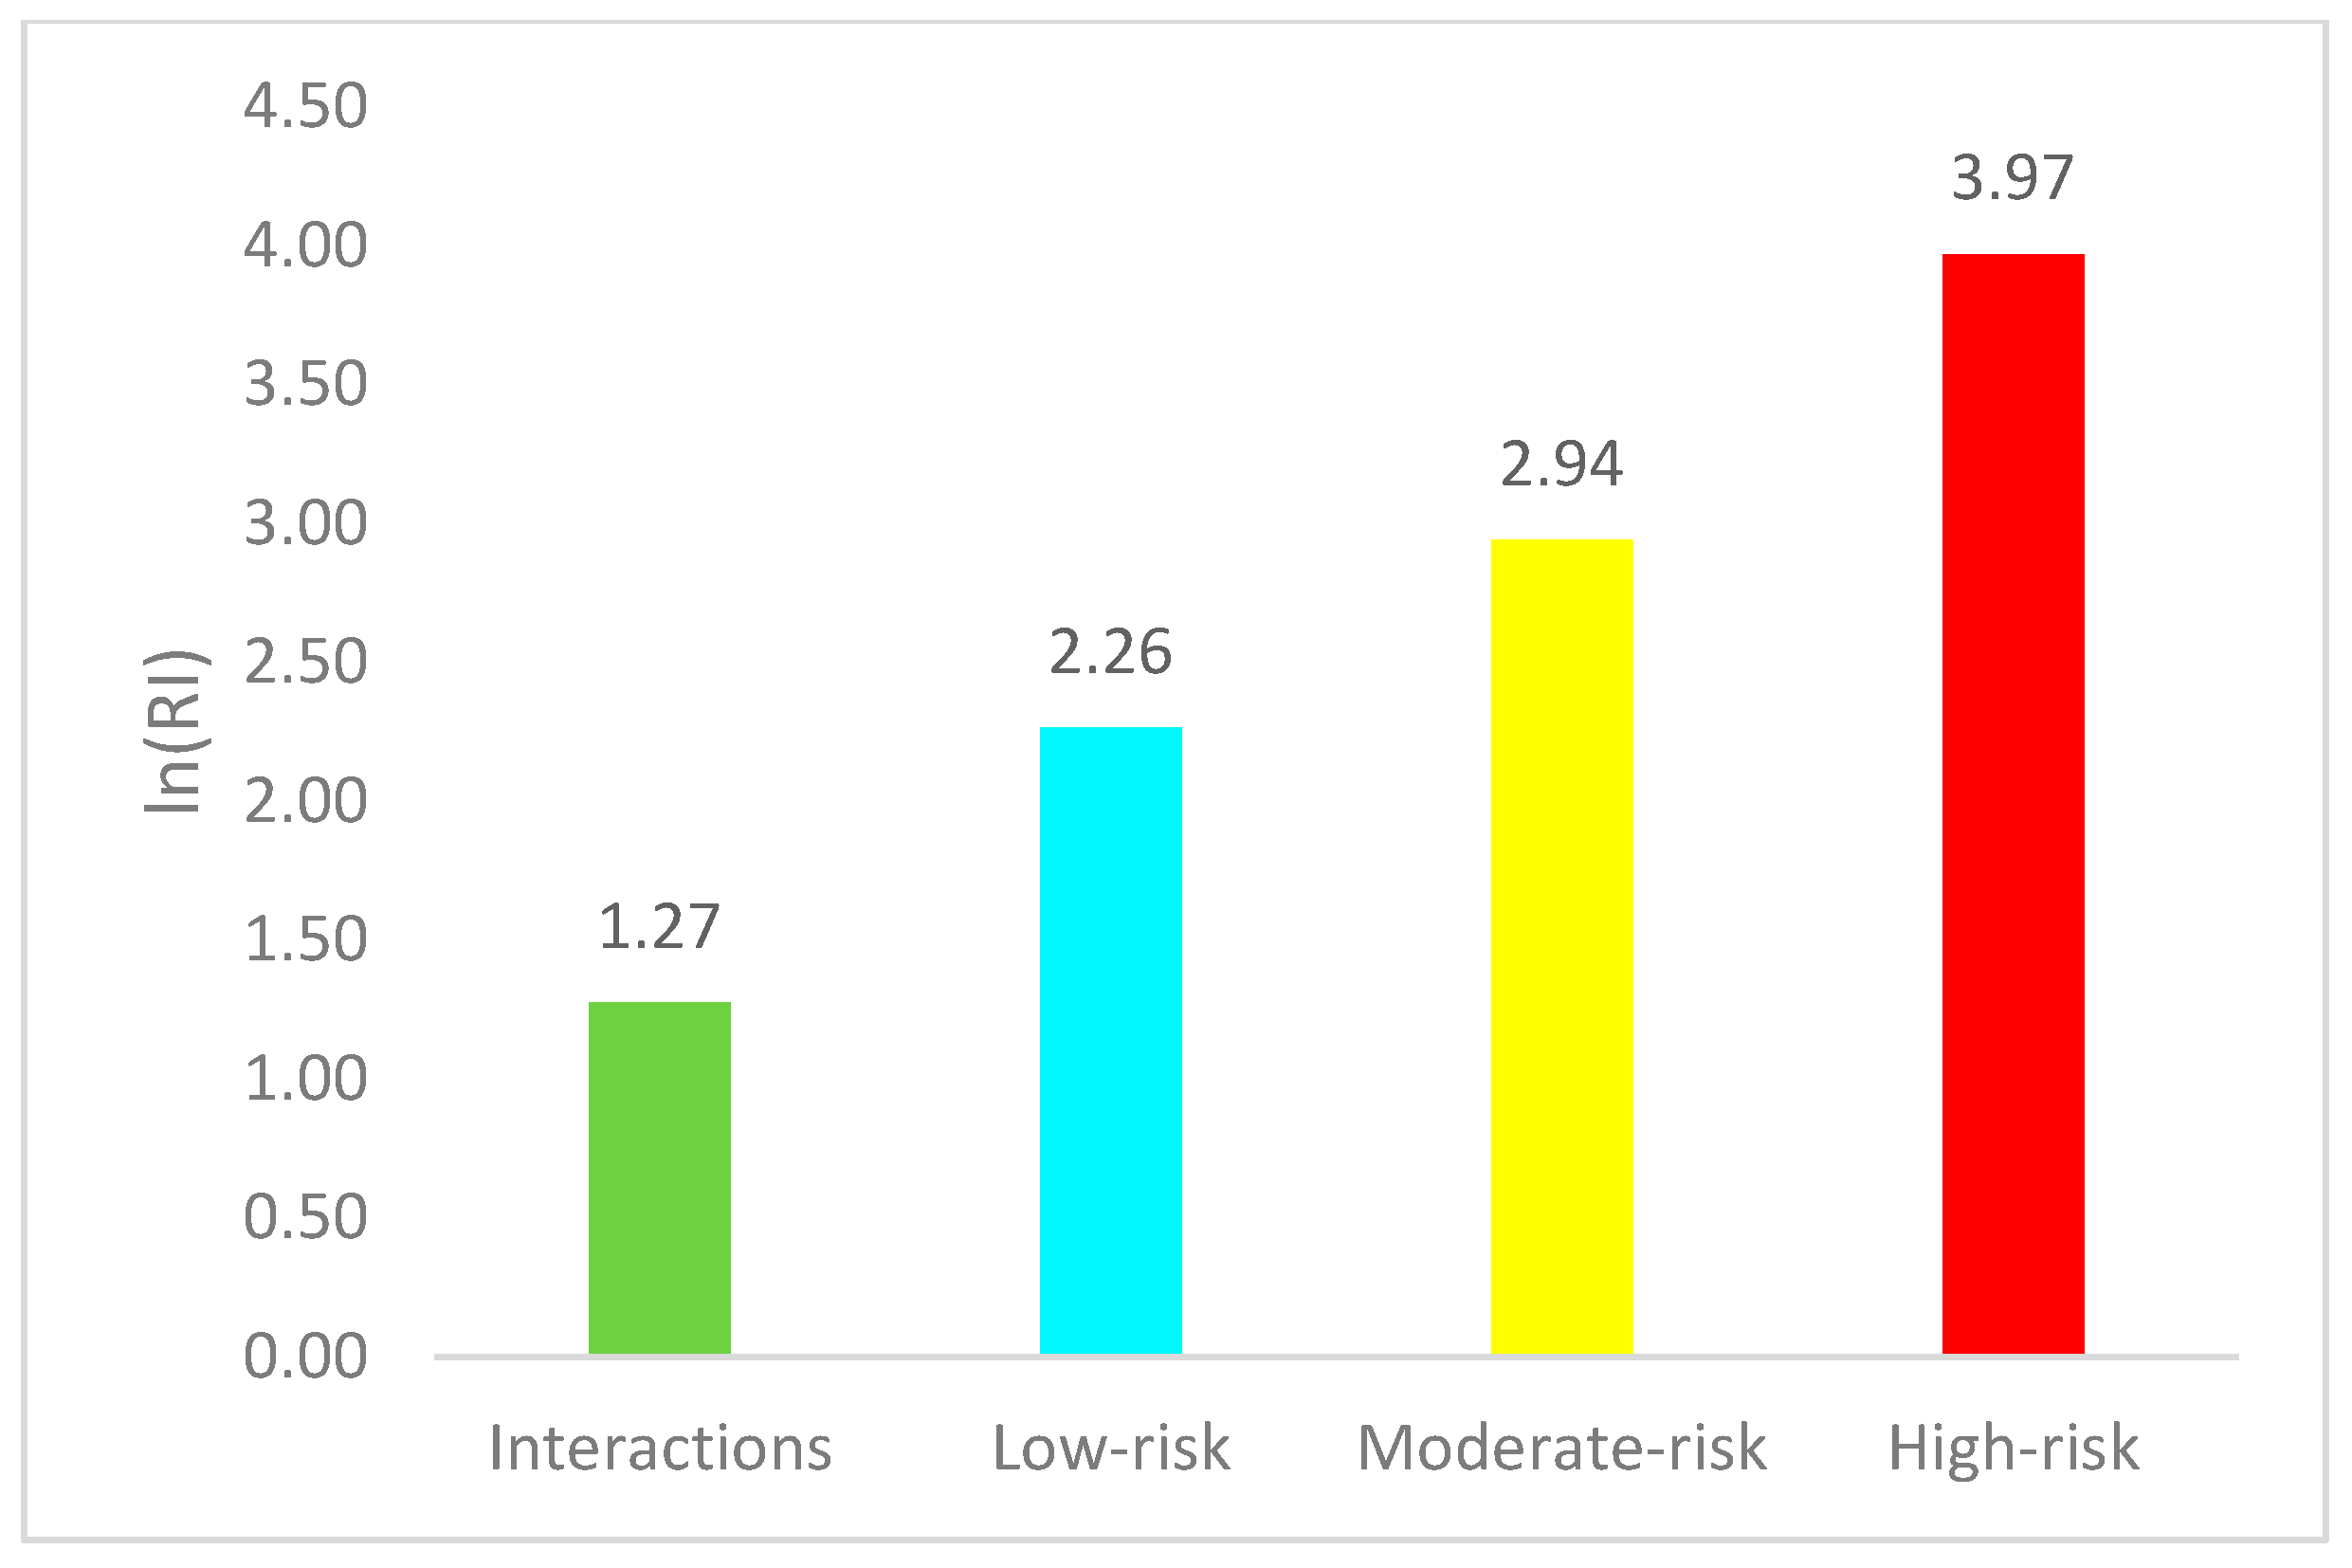
Figure 6 displays the relationship between our defined risk categories and the log of risk index. High-risk interactions have a mean log of RI of 3.97 (sd = 0.33), moderate-risk 2.94 (sd = 0.39) and low-risk 2.26 (sd = 0.27).
3.4. Statistical Regression Analysis
To identify salient factors associated with each of the three surrogate measures, a multilevel mixed-effects linear regression model was estimated, using intersection-level random effects and an independent covariance structure [
48]. This model structure accounts for correlation among observations of vehicle–pedestrian interactions at the intersection level.
Data consists of all interactions in which the pedestrian arrived at the intersection first with a PET of less than 10 s. The outcome measures include the following: (1) the log of the risk index (VS85/PET), (2) inverse of PET, and (3) vehicle speed (VS85/PET). We utilize the natural log of the risk indicator and a log-linear functional form in order to normalizes the distribution of the variable and allow for the interpretation the coefficient estimates as percentage changes.
The first set of models estimate the relationship between these outcomes and various factors for each of these measures in a multi-level form:
where
is the surrogate measures, (vehicle speed, 1/PET and ln (RI)) for pedestrian–vehicle interaction
i at the intersection site,
j and
is the vector of explanatory variables including night time, peak hour, intersection type, movement type, traffic flow, traffic volume, vehicle type, crossing distance (
Table 1).
βp is the vector of unknown regression parameters,
j represents random effects for each intersection site,
j, and
εij represents the random error of the regression estimate.
The effect of the treatments on the surrogate risk measures was evaluated using the structural form:
where all variables are denoted as in Equation (1), and
is the estimate effect of the pedestrian treatment,
in intersections.
We evaluated a set of models, combining intersections type and which user type arrived at the collision point first and the three risk indicators. As PET decreases, the probability of collision is assumed to increase; thus, higher values of 1/PET, speed, and speed/PET, are not desirable from a traffic safety point of view, given their correlation with crash severity in the case of a collision. In the modeling results, positive coefficients correspond to more dangerous scenarios and negative coefficients correspond to safer scenarios.
3.5. Temporary Treatment Design and Implementation
To illustrate the methodology in the context of before-after studies and to investigate the potential impact of low-cost temporary countermeasures to protect pedestrians, two locations were selected for the implementation of designed countermeasures. A 4-legged intersection (site ID 4) with two lanes in each direction, and a large roundabout (site ID 5), with eight points of entry and exits divided into three major and two minor roads. The 4-legged intersection is a major road with a physical median and an exposed pedestrian crossing distance (PCD) of 20 m, while that for the minor road was 15 m. All the major roads of the roundabout have divisor medians; two of them are three lanes per direction with a PCD of 53 and 59 m, while the remaining major road is two lanes per direction and 36 m of PCD. The minor roads of the roundabout are one lane per direction with 11 and 14 m of PCD. Both sites lacked lane and crosswalk pavement marking. Also, vehicle turning radius and crossing distances were very long in the case of the old-style roundabout.
Both sites lacked lane and crosswalk pavement marking. Also, vehicle turning radius and crossing distances were very long in the case of the roundabout. Accordingly, curb extensions were implemented on the 4-legged intersection as a traffic calming measure to extend the sidewalk, reducing the crossing distance, reducing speeds and eliminating parking from the crosswalk area. The design was implemented using temporal plastic bollards. The treatments reduced the pedestrian exposed crossing distance, from 13 m to 8 m. For the roundabout, to reduce crossing distance, the median was extended also with bollards. In both locations, pedestrian crosswalk crossings were implemented using the standard white color with zebra patterns and with a width of 2.5 m.
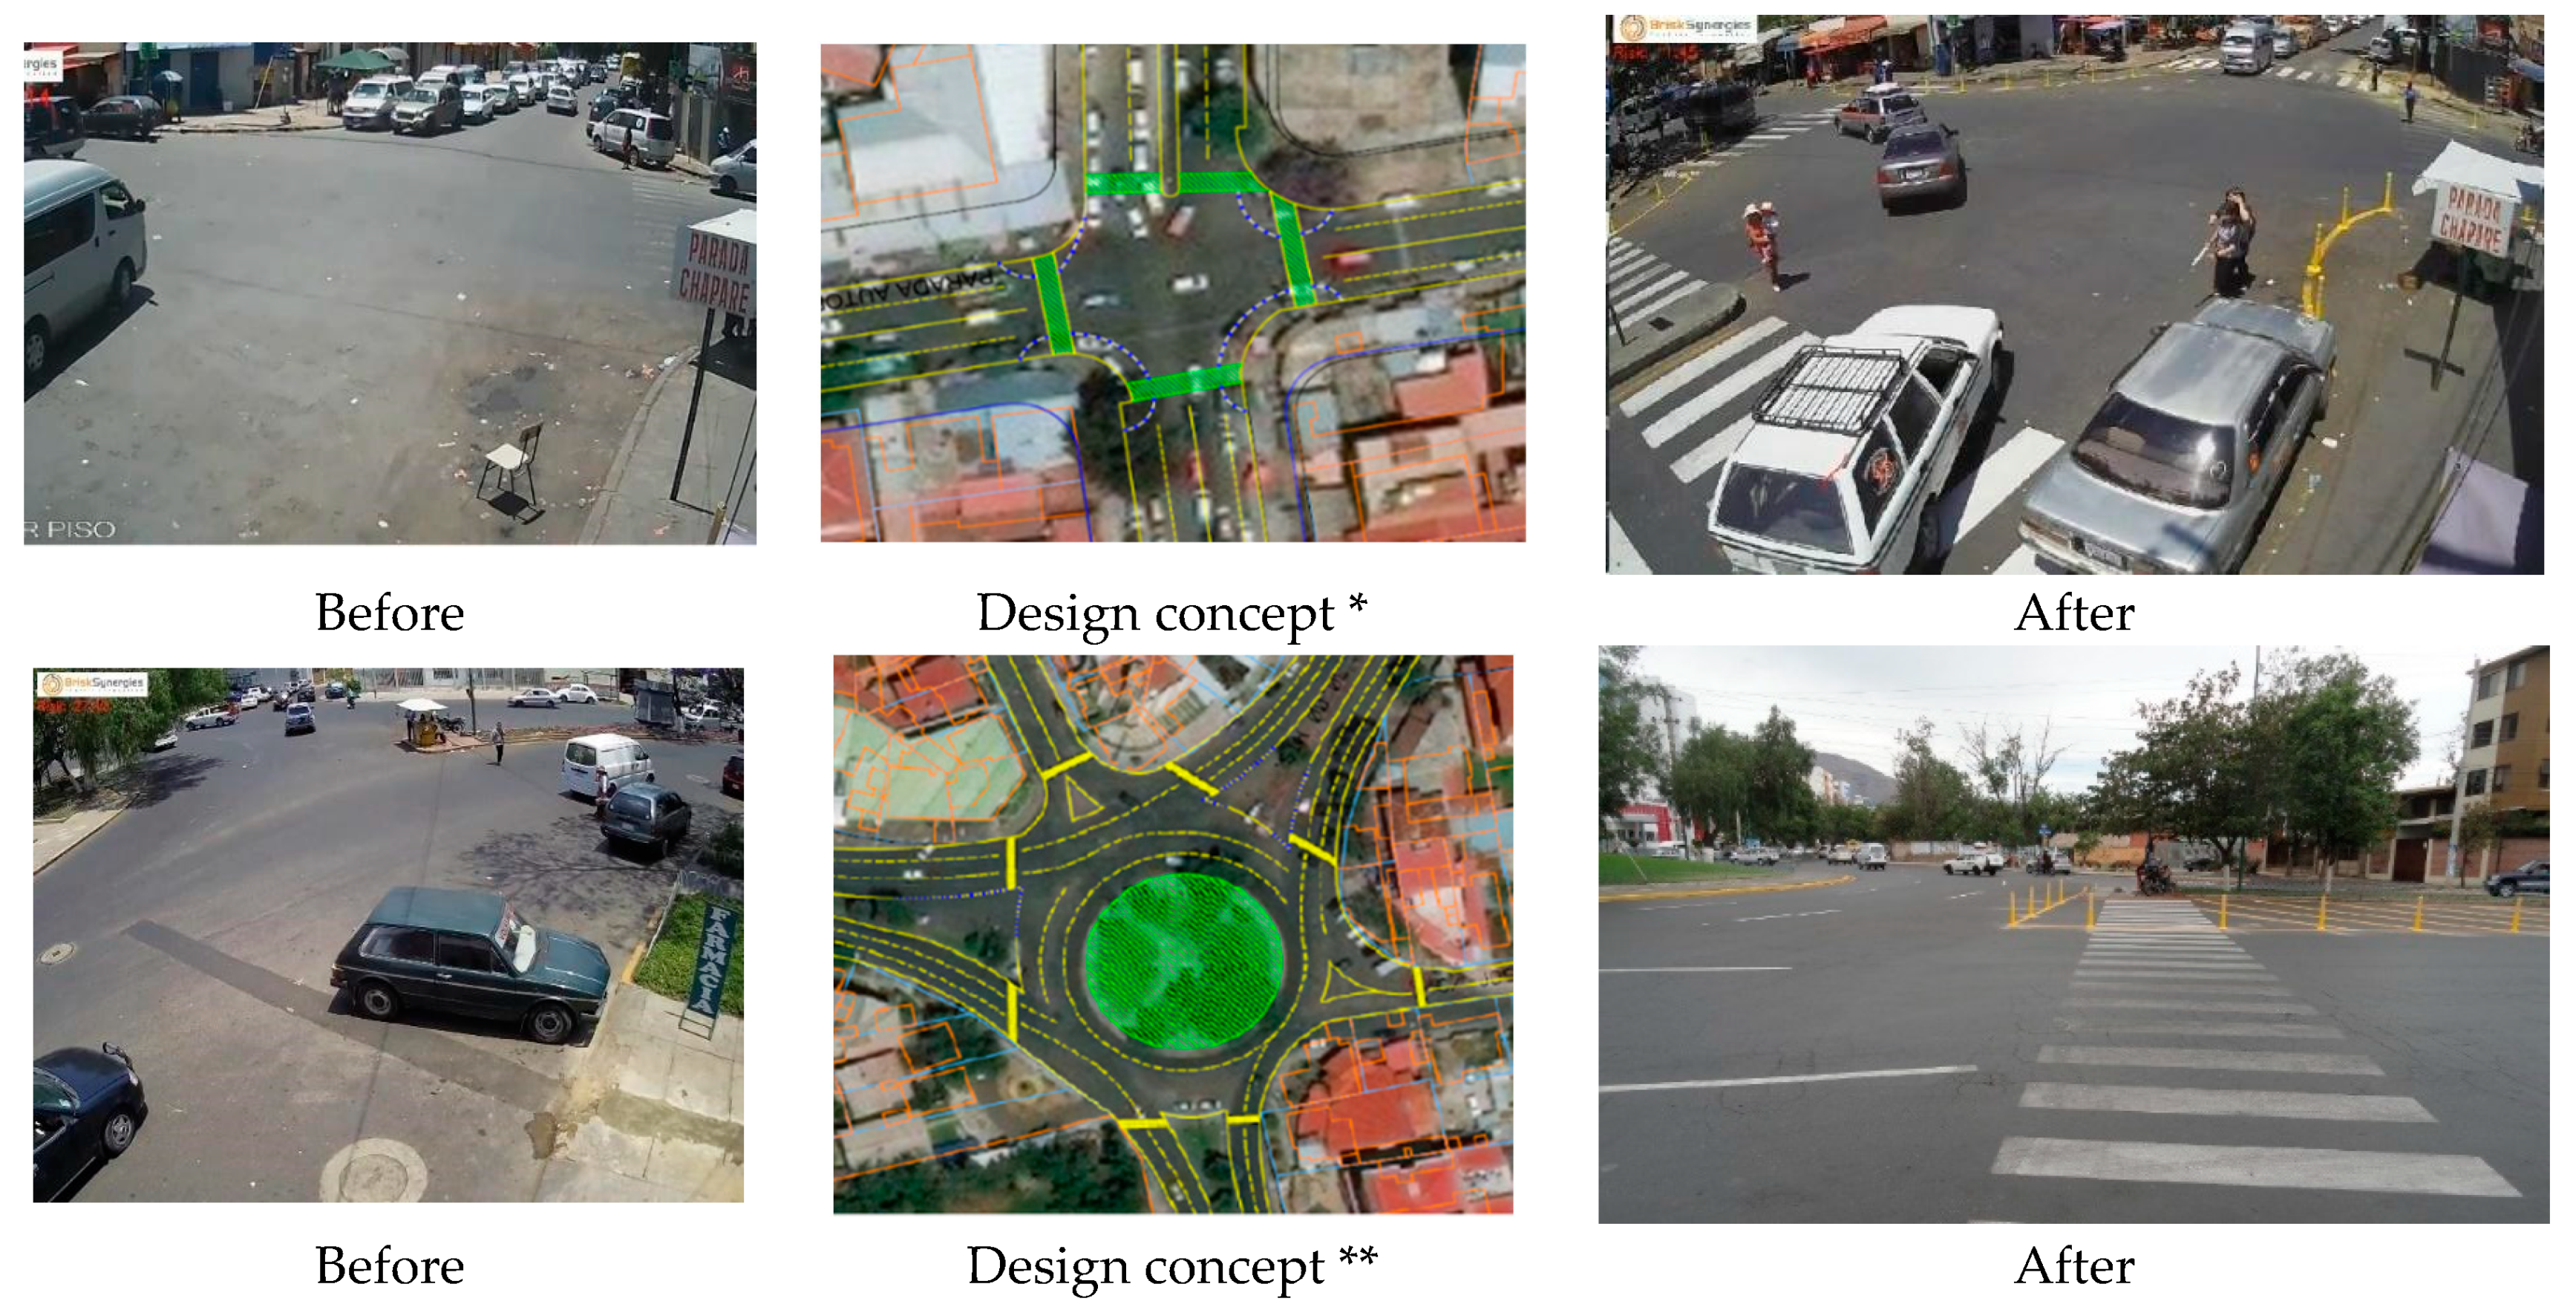
Figure 7 illustrates the conditions before and after treatment implementation as well as the design concept. Video data was collected from the two sites before and after the treatment. Video recordings were conducted during the same hours and days of the week before and after the interventions. Note that the post-treatment (after) recordings took place one week after completing the road treatments and during the same days of the week and hours of the day, so that changes in conflicts that occurred are more likely to be associated with the treatments rather than other major changes to the intersections or traffic conditions.
4. Data Generation
From the five study locations, thousands of vehicle–pedestrian interactions were recorded and detected using the video data processing techniques described above, from which a set of variables was generated that includes road-user types, road-user trajectory for each vehicle-pedestrian interaction, the 85th percentile, median, and 15th percentile speeds, vehicle traffic movements (right turn, left turn or through vehicle movement for intersections, and through or turning movement for roundabouts), who arrives first at the collision point, vehicle counts per 15 min time interval, and whether the event occurred at night time or at peak hours. Intersection types were categorized as standard intersections, either with or without traffic controls, or roundabouts (all roundabouts in the sample were unsignalized). Principle vehicle trajectories were also identified for each vehicle-pedestrian interaction and were classified as either through or turning movements (left or right). Traffic volume for the purposes of this paper was defined as the number of vehicles per 15-min interval per meter given that several intersections lacked lane markings and had variable lane widths. Only interactions in which the PET is less than 10 s, well above the threshold that would be considered to pose a traffic collision risk are included in the analysis.
Table 2 summarizes PET and average speed (as measured at the 85th percentile) by study location and type of signalization. In total, there are 27,995 interactions in which the pedestrian arrived first. The highest average speed is observed at the roundabout, 43 km/h, followed by the non-signalized intersection, 31.82 km/h, and the smallest average PET is at roundabouts, with an average of 4.27 s. Average crossing distance in meters of the study locations ranges from 5.98 to 12.60 m.
Table 3,
Table 4,
Table 5 and
Table 6 summarize the main variables used in the models for all intersections and by intersection type. Overall mean risk (RI) is 6.60 km/h-s, vehicle speeds average 25.9 km/h and PET, on average is 4.95 s. Twenty-two percent of the interactions (pedestrian-vehicle) occurred during the peak hour, while 25% were observed during night-time (
Table 3). Overall, mean traffic volumes of 74.7 vehicles per 15-min intervals were observed throughout the day.
Comparing the statistics by intersection type, stark differences can be observed in terms of vehicle speed, PET, risk, and traffic volume. Average RI is 6.1 km/h-s for standard intersections, while within roundabouts mean RI reaches 10.07 km/h-s (
Table 4). For roundabouts we see that the mean RI is 11.3 versus, 71% higher than the average RI of 6.6 observed in the data. The most dangerous site in terms of crash risk was the old-style roundabout (ID 4) as it has the highest vehicle speeds among the intersections (41 km/h) (
Table 2). This type of roundabout is common in Cochabamba, and in Latin America in general, and poses a severe safety problem to pedestrians due to high vehicle speeds and a lack of protected crossings for pedestrians.
Measured vehicle speed in roundabouts are also substantially higher than other types of intersections, with average speeds of 40.5 km/h compared to 24.3 km/h for intersections, and 25.9 km/h overall. PET ranges from 0.03 s to 9.97, with an average of 4.95 s. However, PET is slightly lower in roundabouts, 4.3 versus 5.0 for intersections. Pedestrian crossing distance is 11.4 m on average, with slightly lower crossing distances for the roundabouts.
5. Results and Analysis
The model results are discussed in two subsections. The first presents the results of cross-sectional multilevel regression analysis and the second the results of before–after treatment impacts.
Table 7 and
Table 8 present the coefficients of multilevel mixed-effects regressions for the independent variables denoted in each row for the outcomes denoted in each column, using video-generated data conflicts between pedestrian and vehicles in the studied intersections. The regression results for the general model (which includes all study sites) are presented in
Table 7, while those by intersection type are presented in
Table 8.
Table 9 and
Table 10 present the summary statistics and regression results for the before-after analysis.
5.1. Cross-Sectional Regression Analysis
Overall, two key factors are observed to have a significant association with risk indicators (RI, speed, and 1/PET): (1) motorcycles (2) turning movements in intersections and in the roundabouts studied. The presence of motorcycles sharply increases crash risk across all three indicators (RI, 1/PET, and speed), and this is mostly associated with their tendency to circulate at considerably higher speeds. Four types of vehicles are observed: cars, buses, trucks and motorcycles, with cars being the comparative group (or omitted category). Motorcycles increase the risk ratio by 55.8% (statistically significant at the 1% confidence level). Speeds increase by 13.3 km/h compared to cars (50% increase relative to mean car travel speeds), after controlling for other factors (time of day, intersection type, turning movements). The 1/PET measure increases by 0.242 (or a PET of 4.13 s) relative to the mean PET of 4.95 s. Next, we find that turning movements, particularly in roundabouts, are highly significant and large predictors of crash risk, increasing the risk index by 17.4%, and by an additional 61.3% in roundabouts. This appears to be mostly driven by accelerations to higher vehicle speeds during these movements, which increase by 13.7 km/h from a mean of 35 km/h for roundabouts).
In terms of time of day, peak hours events are associated with an increase in RI of 4.4% on average. This is primarily driven by slightly higher vehicle speeds, which increase by 3.1% (from a mean of 25 km/h) (See
Table 7). Crossing distance and night-time interactions have a small but significant downward effect on the risk ratio. However, the effect of crossing width on velocity and PET are statistically insignificant and this effect reverses for the roundabouts only regressions (
Table 8). Traffic flow has a positive and statistically significant correlation with risk and speed (an increase of 1.3% in RI) and speed (+0.627 km/h). Traffic volume, measured as the ratio of vehicle flow to crossing distance (vehicles per 15-min intervals per meter), however, decreases risk and speeds, with risk declining by 1.4% and speeds by 6.342 km/h, which is likely to be associated with congested conditions which tend to reduce speeds.
Vehicle–pedestrian interactions occurring during night-time are associated with a small reduction (2.5%) in the risk index. This may be related to slower overall travel speeds and lower traffic volumes at night, as seen in the summary statistics, although these are not statistically significant in the aggregate level regression results in the aggregate model.
5.2. Intersections
Turning to the intersections only models, the results show that motorcycles have a statistically significant and large effect on risk and speeds. With magnitudes of the coefficients being similar to those in the aggregate model, motorcycles are associated with a 2.5% increase relative to the mean of 24.3 km/hour and risk increases by 4% (
Table 8).
Motorcycles play an important role in intersections, as their presence is significantly associated with a 60.9% increase in risk and an increase in speed of 15.2 km per hour on average, a 58% increase relative to mean vehicle speeds, leading to an increase of 0.291 in the inverse of PET (equivalent to an average decrease in PET of 3.4 s). The regression results suggest that buses tend to be associated with lower surrogate risk outcomes. This may be related to their size and functionality in the city, needing to stop frequently to pick up and drop off passengers and thus lower overall operating speeds. It should be noted that one limitation of the surrogate risk indicators is that they do not take into about vehicle mass and the related probability of crash severity in the case of a collision.
The second most important contributor to risky interactions for the intersections are left-hand turning movements. Left turns increase the risk index by 15.7%, and speeds by 2.13 km/hour (an 8.8% increase relative the mean vehicle velocity). Right-hand turns tend to result in lower vehicle speeds (−4.63 km/h) and a decrease overall risk of 12.8%, as measured by the probability of crash severity (speed). So while both types of turning movements are associated with high probability of collision, the left-hand turning movements in which vehicles have time reach higher vehicle speeds as the intersect with pedestrians at the end of their turn, and therefore are more likely to be moving at higher velocities and present more overall risk to pedestrians if a collision occurs.
Finally, the regression results also suggest that providing greater crossing distance to pedestrians correlated with a small but statistically significant decrease in overall risk of 2.4%. This counterintuitive result may be related to higher traffic congestion along the wider, more heavily traveled, streets and the associated reduction in mean speeds. We observe that traffic volumes, measured as traffic flow per meter, tend increase the inverse of PET (by 0.048) by 16% under these circumstances, due to more interactions of vehicle–pedestrians moving along a longer trajectory.
5.3. Roundabouts
In the roundabout models, we observe that motorcycles once again play an important contribution to elevated risk. The presence of motorcycles contributes significantly to an increase of 17.6% of the general risk index for pedestrians. Notably, the marginal contribution of motorcycles to the risk index is lower than that for the intersections. However, with the findings for the interaction terms in the general model, turns in roundabouts increase vehicle speeds (by 16.2 km/h) and pedestrian-vehicle conflict risk considerably (by 77.3%). In contrast to the intersection models, increased pedestrian crossing distance tends to increase overall risk. This is likely related to overall increased speeds and that vehicles tend to intersect with pedestrians during turning movements, which as we have seen are also at higher velocities in roundabouts compared to intersections. Traffic volume (vehicle flow/meter) has a statistically significant downward effect on speed; as traffic volume increases, speeds decrease slightly (4.5 km/h). Night-time has a significant effect on RI in these intersections, decreasing risk by 12.7%. This appears to be related to slightly slower vehicle speeds at night (−3.86 km/h), like what was observed in the intersections-only models. Given that reaction times may be slower under less visibility, this reduction in risk may be over-estimated for nighttime observations.
5.4. Analysis of Intersection Treatments
The histograms in
Figure 8 and
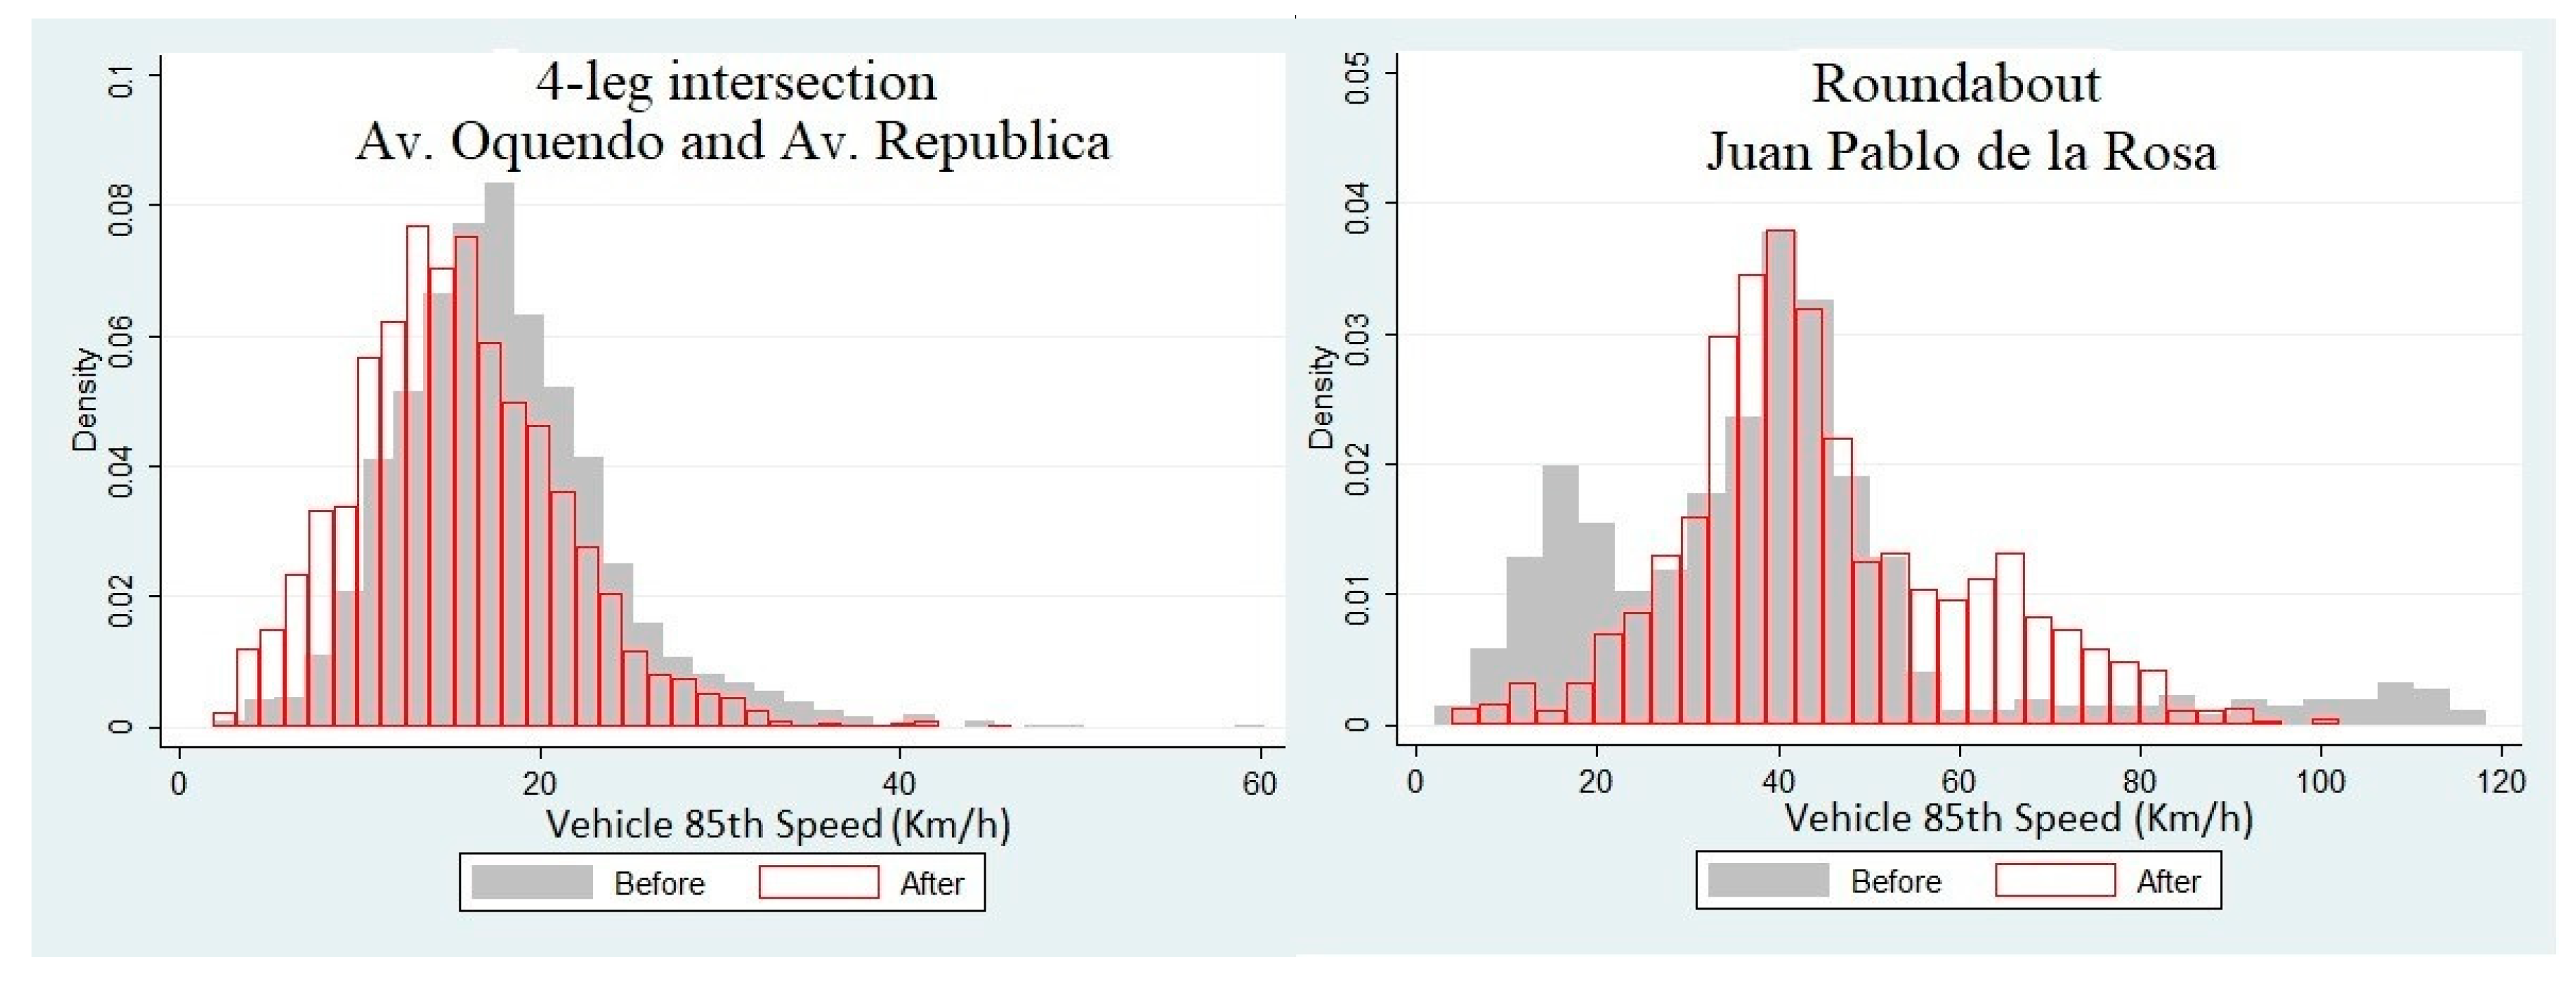
Table 9 below show risk indicators both before and after the 4-legged intersection and the roundabout received treatment. In the case of the 4-legged intersection, the treatment lead to a decrease in speeds, from a mean of 17.9 km/h to a mean of 15.4 km/h. The speed distribution for the intersection is clustered around the mean and has a small standard deviation. The treatment led to a clear shift to lower speeds, seen in the left histogram. In the case of the roundabout, the speed distribution is dispersed, and a clear pattern cannot be observed. While the treatment reduced the number of conflicts involving excessive speeds, representing an improvement in safety for the most severe conflicts, average speeds increased by nearly 6 km/h.
The risk categories defined previously in
Section 3.3, for the roundabout and the four-legged intersection, both before and after treatment are illustrated in
Figure 9. Each point represents a single event between a pedestrian and vehicle with a PET < 10 s. It is observed that for the 4-legged intersection, there is a slight decrease in the number of moderate risk (yellow) and low risk (cyan) conflicts, and an increase in the safer interactions (green), suggesting that the treatment was mildly effective. For the roundabout, the number of high-risk conflicts (red) remains almost unchanged, while there was a shift in proportion of non-dangerous interactions to low and moderate risk conflicts, which implies that while the number of extreme speeds declined (see lower left-hand scatter plot in
Figure 8) the treatment did not significantly improve overall safety and in fact overall speeds increased.
Turning to the regression models which estimate the impact of treatment (
Table 10), the parameter “treated” denotes whether the interaction corresponds to before or after the treatment, where “treated = 0” denotes before, and “treated = 1” denotes after. The results of the model suggest that the treatment decreased collision risk estimates for the 4-leg intersection, consistent with what was seen in the summary statistics (column 1). The treatment has a significant effect on vehicle velocity (column 3), with an estimated reduction of 2.245 km/h, or 9%. Furthermore, the risk ratio decreased by 13.5% (column 1). However, PET appears to have been unaffected (column 2). Nevertheless, the results suggest that the interventions had a positive effect on traffic calming by reducing vehicle speeds and risk.
For the roundabout, the treatment appears to have had a slightly negative effect on pedestrian–vehicle collision risk. The overall risk (RI) increased by 6.1% (
Table 10, column 4). While inverse PET decreased marginally, possibly due to the increased pedestrian protection provided by the treatment, inverse PET declined slightly (by 0.010, equivalent to a fraction of a second (0.002) increase in PET and significant only at the 10% confidence level) (
Table 10, column 5). The coefficient on vehicle speeds is positive and large (5.76, although not statistically significant) (
Table 10, column 6). One possible explanation for the increased vehicle–pedestrian risk is that vehicles might have be enabled to circulate faster because the lane markings included in treatment channelized vehicle traffic, reducing conflicts between vehicles and enabling them to travel faster through the roundabout.
Moreover, as vehicle speeds in the roundabout are significantly higher than in the intersections, pedestrian treatments applied in this case appear to have been insufficient to counteract the increase in speeds. Significant additional geometric design changes would likely be required to make the roundabout safer. Such measures could include traffic signalization, the implementation of additional traffic-calming components such as raised pedestrian crossings or larger bulb-outs, separation between vehicles and vulnerable road users through exclusive lanes for bikes, adding more pedestrian safe zones, or reducing the number of lanes in the pedestrian crossings (see [
49]).
6. Conclusions
This paper presents a proactive surrogate safety methodology for identifying pedestrian injury-risk factors and evaluating low-cost temporary countermeasures at intersections in the Latin American context. Using computer vision and deep-learning techniques, road-user trajectories, speeds and conflicts were automatically generated for thousands of vehicle–pedestrian interactions. A set of variables for each vehicle–pedestrian interaction were generated for all pedestrian–vehicle interactions in which the pedestrian arrives first to the collision point and where the PET was less than 10 s. Regression models were then applied in order to model underlying determinants for several risk indicators, including a risk ratio that combines the product of the inverse of the PET, and the 85th vehicle speed for each event.
Various factors were identified as significantly related to the surrogate pedestrian vehicle risk indicators. Compared to other motor-vehicle types, motorcycles pose a serious threat to traffic safety given their tendency to speed, a behavior that is even more pronounced in roundabouts. This is an important observation given the proliferation of motorcycle traffic in many Latin American cities and emerging safety issues. Motorcycles are not only the most dangerous motorized transportation mode but also a mode deteriorating the safety of active road users (pedestrians and bicycles).
With respect to other intersection types, the multilane roundabout examined in this study was found to be the most dangerous intersection across all safety indicators. This is not surprising given the vehicle operating speeds and volumes that are much higher than regular intersections along with the larger crosswalk crossing distances. These three risk-exposure factors (high speeds with large volumes and crossing distances) make roundabouts a high-risk location for pedestrians in cities like Cochabamba. As an additional note, the most dangerous vehicle movements were identified as left-hand turns at standard intersections and turning in and out of roundabouts.
In the before–after analysis, only low-cost provisional treatments in the four-way intersection were effective at reducing speeds and risk, while in the roundabout, the treatment had a slightly negative impact on risk. This suggests that treatments of the type implemented in this case study might not be effective in roundabouts. Given the complexity of the traffic safety problems at those locations, more complex design treatments could be evaluated. This could include the transformation of old-roundabouts into modern roundabouts, the implementation of traffic signalization, and other traffic calming measures, in which designs consider pedestrian safety as a priority, including raised crosswalks, pedestrian crossings further back from the intersection, pedestrian-activated crossing lights, among others. This could be particularly important in urban locations with high pedestrian volumes.
Perhaps the most important contributions of this paper are the proposition and implementation of a proactive surrogate safety methodology in a medium-sized city in a developing Latin America country. The evaluation of temporary countermeasures using rapid, low-cost surrogate analysis, before the installation of permanent treatments can lower the potential risk of misallocation of scarce resources for road safety treatments and can potentially improve overall program effectiveness. The proposed methodology could be replicated in other studies or cities to evaluate alternative temporary (or permanent) treatments. This methodology also aims at introducing the concept of temporary low-cost designs that should be evaluated in a short period of time to minimize injury risk, and before treatments are replicated in a large scale in cities. The implementation of this methodology in other cities/studies could help identify a set of key injury factors and effective treatments. This would help improve pedestrian safety in a proactive and effective way.
Several limitations of this study should be noted. From the treatment effectiveness point of view, the results should be taken with caution given that the locations involved in this study are not representative of all city intersections and the sample of sites is small. The same caution applies to the risk factors; a large sample of intersections from the same city or other cities should be considered before coming with general conclusions. Validation of the surrogate safety measures using crash data could also be done in the future using longer-term video data in which both crashes and conflicts can be observed. Future research is needed to further explore the validation of surrogate safety measures, and to compare surrogate indicators with actual crash events.
Author Contributions
The authors confirm contribution to the paper as follow: study conception and design: L.S., L.M.-M., E.Z.; data collection: L.S., L.M.-M., E.Z.; analysis and interpretation of results: L.S., L.M.-M., M.E.; draft manuscript preparation: M.E., L.S., B.L.-N., E.Z. All authors reviewed the results and approved the final version of the manuscript.
Funding
This research was funded by a grant from a “Cutting Edge” grant from the Inter-American Development Bank.
Acknowledgments
The authors would like to thank the following people for their valuable contributions to this paper. The authors are grateful to the planners and transport engineers in the municipal government of Cochabamba, Bolivia, for their collaboration throughout the project and help with the identification of intersections sites, and project coordination. BRISK Synergies was instrumental in video data processing and generation. Shirley Cañete, Ana María Pinto, and Marisela Ponce de León, Inter-American Development Bank, provided very useful comments on the project design. The authors are also grateful to Joao Sarolli and Jean Pol Armijos, at the Inter-American Development Bank, and anonymous peer reviewers for their comments and suggestions on earlier manuscript drafts.
Conflicts of Interest
The authors declare no conflict of interest. The funders had no role in the design of the study; in the collection, analyses, or interpretation of data; in the writing of the manuscript; or in the decision to publish the results.
References
- World Health Organization (WHO). Global Status Report on Road Safety 2018; WHO: Washington, DC, USA, 2018. [Google Scholar]
- Pan American Health Organization (PAHO). Road Safety in the Americas; PAHO: Washington, DC, USA, 2016. [Google Scholar]
- Warburton, D.E.R. Health Benefits of Physical Activity: The Evidence. Can. Med. Assoc. J. 2006, 174, 801–809. [Google Scholar] [CrossRef] [PubMed]
- International Transport Forum (ITF). Benchmarking Road Safety in Latin America; Case-Specific Policy Analysis; ITF: Paris, France, 2017; Available online: https://www.itf-oecd.org/sites/default/files/docs/benchmarking_road_safety_latin_america.pdf (accessed on 21 May 2019).
- National Highway Traffic Safety Administration (NHTSA). Traffic Safety Facts; NHTSA: Washington, DC, USA, 2019. [Google Scholar]
- Roquel, D.; Masoumil, H. An Analysis of Car Ownership in Latin American Cities: A Perspective for Future Research. Period. Polytech. Transp. Eng. 2016, 44, 5–12. [Google Scholar] [CrossRef]
- Ahmed, A.; Sadullah, A.F.M.; Yahya, A.S. Errors in accident data, its types, causes and methods of rectification-analysis of the literature. Accid. Anal. 2017. [Google Scholar] [CrossRef] [PubMed]
- de Ceunynck, T. Defining and Applying Surrogate Safety Measures and Behavioural Indicators through Site-Based Observations. Ph.D. Thesis, Lund University, Lund, Sweden, 2017. [Google Scholar]
- Pombo, J.; Jing, G. Recent Developments in Railway Track and Transportation Engineering; Proceedings of the 1st GeoMEast International Congress and Exhibition, Egypt, 2017 on Sustainable Civil Infrastructures; Springer: New York, NY, USA, 2017. [Google Scholar]
- Lord, D.; Miranda-Moreno, L.F. Effects of low sample mean values and small sample size on the estimation of the fixed dispersion parameter of Poisson-gamma models for modeling motor vehicle crashes: A Bayesian perspective. Saf. Sci. 2008, 46, 751–770. [Google Scholar] [CrossRef]
- Guo, F.; Klauer, S.G.; McGill, M.T.; Dingus, T.A. Task 3-Evaluating the Relationship Between Near-Crashes and Crashes: Can Near Crashes Serve as a Surrogate Safety Metric for Crashes; DOT HS 811 382; Virginia Tech Transportation Institute: Blacksburg, VA, USA; Department of Transportation, National Highway Traffic Safety Administration: Washington, DC, USA, 2010.
- Mahmud, S.M.S.; Ferreira, L.; Hoque, M.S.; Tavassoli, A. Application of proximal surrogate indicators for safety evaluation: A review of recent developments and research needs. IATSS Res. 2017, 41, 153–163. [Google Scholar] [CrossRef]
- Constant, A.; Lagarde, E. Protecting Vulnerable Road Users from Injury. PLoS Med. 2010, 7, e1000228. [Google Scholar] [CrossRef] [PubMed]
- Archer, J. Indicators for Traffic Safety Assessment and Prediction and Their Application in Micro-Simulation Modelling: A Study of Urban and Suburban Intersections. The Greater Stockholm area Defined by Accident Occurrence (from STRADA). 2005. Available online: http://worldcat.org/isbn/9173231193 (accessed on 12 July 2019).
- ICES. Plan de Acción del Área Metropolitana de Cochabamba; ICES: Sale, UK, 2013; p. 74. [Google Scholar] [CrossRef]
- Inter-American Development Bank. Plan Maestro de Movilidad Urbana Sustentable Para el Área Metropolitana de Cochabamba; Inter-American Development Bank: La Paz, Bolivia, 2015. [Google Scholar]
- Ali, M.; Najafi, F.T. A Cost-Effective Methodology for Pedestrian Road Crossing for Developing Countries. In Proceedings of the 120th ASEE Annual Conference and Exposition, Atlanta, GA, USA, 23–26 June 2013; pp. 1–11. [Google Scholar]
- Asaithambi, G.; Kuttan, M.O.; Chandra, S. Pedestrian Road Crossing Behavior Under Mixed Traffic Conditions: A Comparative Study of an Intersection Before and After Implementing Control Measures. Transp. Dev. Econ. 2016, 2, 14. [Google Scholar] [CrossRef]
- Ferenchak, N.N. Pedestrian age and gender in relation to crossing behavior at midblock crossings in India. J. Traffic Transp. Eng. 2016, 3, 345–351. [Google Scholar] [CrossRef] [Green Version]
- Hamed, M.M. Analysis of pedestrians’ behavior at pedestrian crossings. Saf. Sci. 2001, 38, 63–82. [Google Scholar] [CrossRef]
- Quistberg, D.A.; Koepsell, T.D.; Boyle, L.N.; Miranda, J.J.; Johnston, B.D.; Ebel, B.E. Pedestrian signalization and the risk of pedestrian-motor vehicle collisions in Lima, Peru. Accid. Anal. Prev. 2014, 70, 273–281. [Google Scholar] [CrossRef] [Green Version]
- Poó, F.M.; Ledesma, R.D.; Trujillo, R. Pedestrian crossing behavior, an observational study in the city of Ushuaia, Argentina. Traffic Inj. Prev. 2018, 19, 305–310. [Google Scholar] [CrossRef] [PubMed]
- Diogenes, M.; Lindau, L. Evaluation of Pedestrian Safety at Midblock Crossings, Porto Alegre, Brazil. Transp. Res. Rec. J. Transp. Res. Board 2010, 2193, 37–43. [Google Scholar] [CrossRef] [Green Version]
- Johnsson, C.; Laureshyn, A.; de Ceunynck, T. In search of surrogate safety indicators for vulnerable road users: A review of surrogate safety indicators. Transp. Rev. 2018, 38, 765–785. [Google Scholar] [CrossRef]
- Peesapati, L.; Hunter, M.; Rodgers, M.O. Evaluation of Post-encroachment Time as Surrogate for Opposing Left-Turn Crashes. Transp. Res. Rec. J. Transp. Res. Board 2013, 2386, 42–51. [Google Scholar] [CrossRef]
- Federal Highway Administration (FHWA). Surrogate Safety Assessment Model and Validation: Final Report; Publication No. FHWA-HRT-08-051; Turner-Fairbank Highway Research Center: McLean, VA, USA, 2008. Available online: https://www.fhwa.dot.gov/publications/research/safety/08051/08051.pdf (accessed on 15 July 2019).
- Van Der Horst, A.R.A.; de Goede, M.; de Hair-Buijssen, S.; Methorst, R. Traffic conflicts on bicycle paths: A systematic observation of behaviour from video. Accid. Anal. Prev. 2014, 62, 358–368. [Google Scholar] [CrossRef]
- Ozbay, K.; Yang, H.; Bartin, B.; Mudigonda, S. Derivation and Validation of New Simulation-Based Surrogate Safety Measure. Transp. Res. Rec. J. Transp. Res. Board 2009, 2083, 105–113. [Google Scholar] [CrossRef]
- Fu, T.; Miranda-Moreno, L.; Saunier, N. A novel framework to evaluate pedestrian safety at non-signalized locations. Accid. Anal. Prev. 2018, 111, 23–33. [Google Scholar] [CrossRef] [PubMed]
- St-Aubin, P. Driver Behaviour and Road Safety Analysis Using Computer Vision and Applications in Roundabout Safety. Ph.D. Thesis, Polytechnique Montreal, Montreal, QC, Canada, 2016. [Google Scholar]
- El-Basyouny, K.; Sayed, T. Safety performance functions using traffic conflicts. Saf. Sci. 2013, 51, 160–164. [Google Scholar] [CrossRef]
- Sayed, T.; Zaki, M.H.; Autey, J. Automated safety diagnosis of vehicle-bicycle interactions using computer vision analysis. Saf. Sci. 2013, 59, 163–172. [Google Scholar] [CrossRef]
- Songchitruksa, P.; Tarko, A. Practical Method for Estimating Frequency of Right-Angle Collisions at Traffic Signals. Transp. Res. Rec. J. Transp. Res. Board 2007, 1953, 89–97. [Google Scholar] [CrossRef]
- Yang, H. Simulation-Based Evaluation of Traffic Safety Performance Using Surrogate Safety Measures. Ph.D. Thesis, Rutgers University, New Brunswick, Newark and Camden, NJ, USA, 2012. [Google Scholar]
- Saunier, N.; Mourji, N.; Agard, B. Investigating Collision Factors by Mining Microscopic Data of Vehicle Conflicts and Collisions. Transp. Res. Rec. 2011, 2237, 41–50. [Google Scholar] [CrossRef]
- Vanparijs, J.; Int Panis, L.; Meeusen, R.; de Geus, B. Exposure Measurement in Bicycle Safety Analysis: A Review of the Literature. Accid. Anal. Prev. 2015, 84, 9–19. [Google Scholar] [CrossRef] [PubMed]
- Sacchi, E.; Sayed, T.; Deleur, P. A Comparison of Collision-Based and Conflict-Based Safety Evaluations: The Case of Right-Turn Smart Channels. Accid. Anal. Prev. 2013, 59, 260–266. [Google Scholar] [CrossRef] [PubMed]
- Zaki, M.; Sayed, T.; Cheung, A. Computer Vision Techniques for the Automated Collection of Cyclist Data. Transp. Res. Rec. J. Transp. Res. Board 2013, 2387, 10–19. [Google Scholar] [CrossRef]
- Nabavi-Niaki, M.S.; Saunier, N.; Miranda-Moreno, L.F. Analysis of Cyclist Behaviour at Cycling Network Discontinuities Using Computer Vision. In Proceedings of the 95th Annual Meeting of the Transportation Research Board, Washington, DC, USA, 10–14 January 2016. [Google Scholar] [CrossRef]
- Essa, M.; Sayed, T. Traffic Conflict Models to Evaluate the Safety of Signalized Intersections at the Cycle Level. Transp. Res. Part C Emerg. Technol. 2018, 89, 289–302. [Google Scholar] [CrossRef]
- St-Aubin, P.; Saunier, N.; Miranda-Moreno, L. Large-Scale Automated Proactive Road Safety Analysis Using Video Data. Transp. Res. Part C Emerg. Technol. 2015, 58, 363–379. [Google Scholar] [CrossRef]
- AASHTO. Highway Safety Manual; AASHTO: Washington, DC, USA, 2010. [Google Scholar]
- Mead, J.; Zegeer, C.; Bushell, M. Evaluation of Pedestrian-Related Roadway Measures: A Summary of Available Research 1–115; Pedestrian and Bicycle Information Center: Chapel Hill, NC, USA, 2014. [Google Scholar]
- Fernandes, A.; Barata, A.S.F. Tactical Urbanism and Sustainability: Tactical Experiences in the Promotion of Active Transportation. World Acad. Sci. Eng. Technol. Int. J. Urban Civ. Eng. 2017, 11, 734–739. [Google Scholar]
- Fuller, R.; Gormley, M.; Stradling, S.; Broughton, P.; Kinnear, N.; O’Dolan, C.; Hannigan, B. Impact of speed change on estimated journey time: Failure of drivers to appreciate relevance of initial speed. Accid. Anal. Prev. 2009, 41, 10–14. [Google Scholar] [CrossRef]
- Hayes, G.; Koppa, R.; White, J.T.; White, M.C. Driver-Vehicle Performance in Closed Loop Tests. SAE Tech. Pap. 1975. [Google Scholar] [CrossRef]
- Lerner, N.D. Brake Perception-Reaction Times of Older and Younger Drivers. In Proceedings of the Human Factors and Ergonomics Society Annual Meeting, Seattle, WA, USA, 11--15 October 1993; Volume 37, pp. 206–210. [Google Scholar] [CrossRef]
- StataCorp. Stata Statistical Software: Release 14; StataCorp LP: College Station, TX, USA, 2015. [Google Scholar]
- World Resources Institute (WRI). Cities Safer by Design; WRI: Washington, DC, USA, 2015. [Google Scholar]
Figure 1.
Post-encroachment time (PET).
Figure 1.
Post-encroachment time (PET).
Figure 2.
Surrogate automated-video process.
Figure 2.
Surrogate automated-video process.
Figure 3.
Example of computer object classification and conflict detection. (Notes: Objects detected in the photo are indicated by colored rectangular lines where, yellow equals pedestrian, blue box corresponds to vehicle. The redlines delineates vehicle paths or trajectories.)
Figure 3.
Example of computer object classification and conflict detection. (Notes: Objects detected in the photo are indicated by colored rectangular lines where, yellow equals pedestrian, blue box corresponds to vehicle. The redlines delineates vehicle paths or trajectories.)
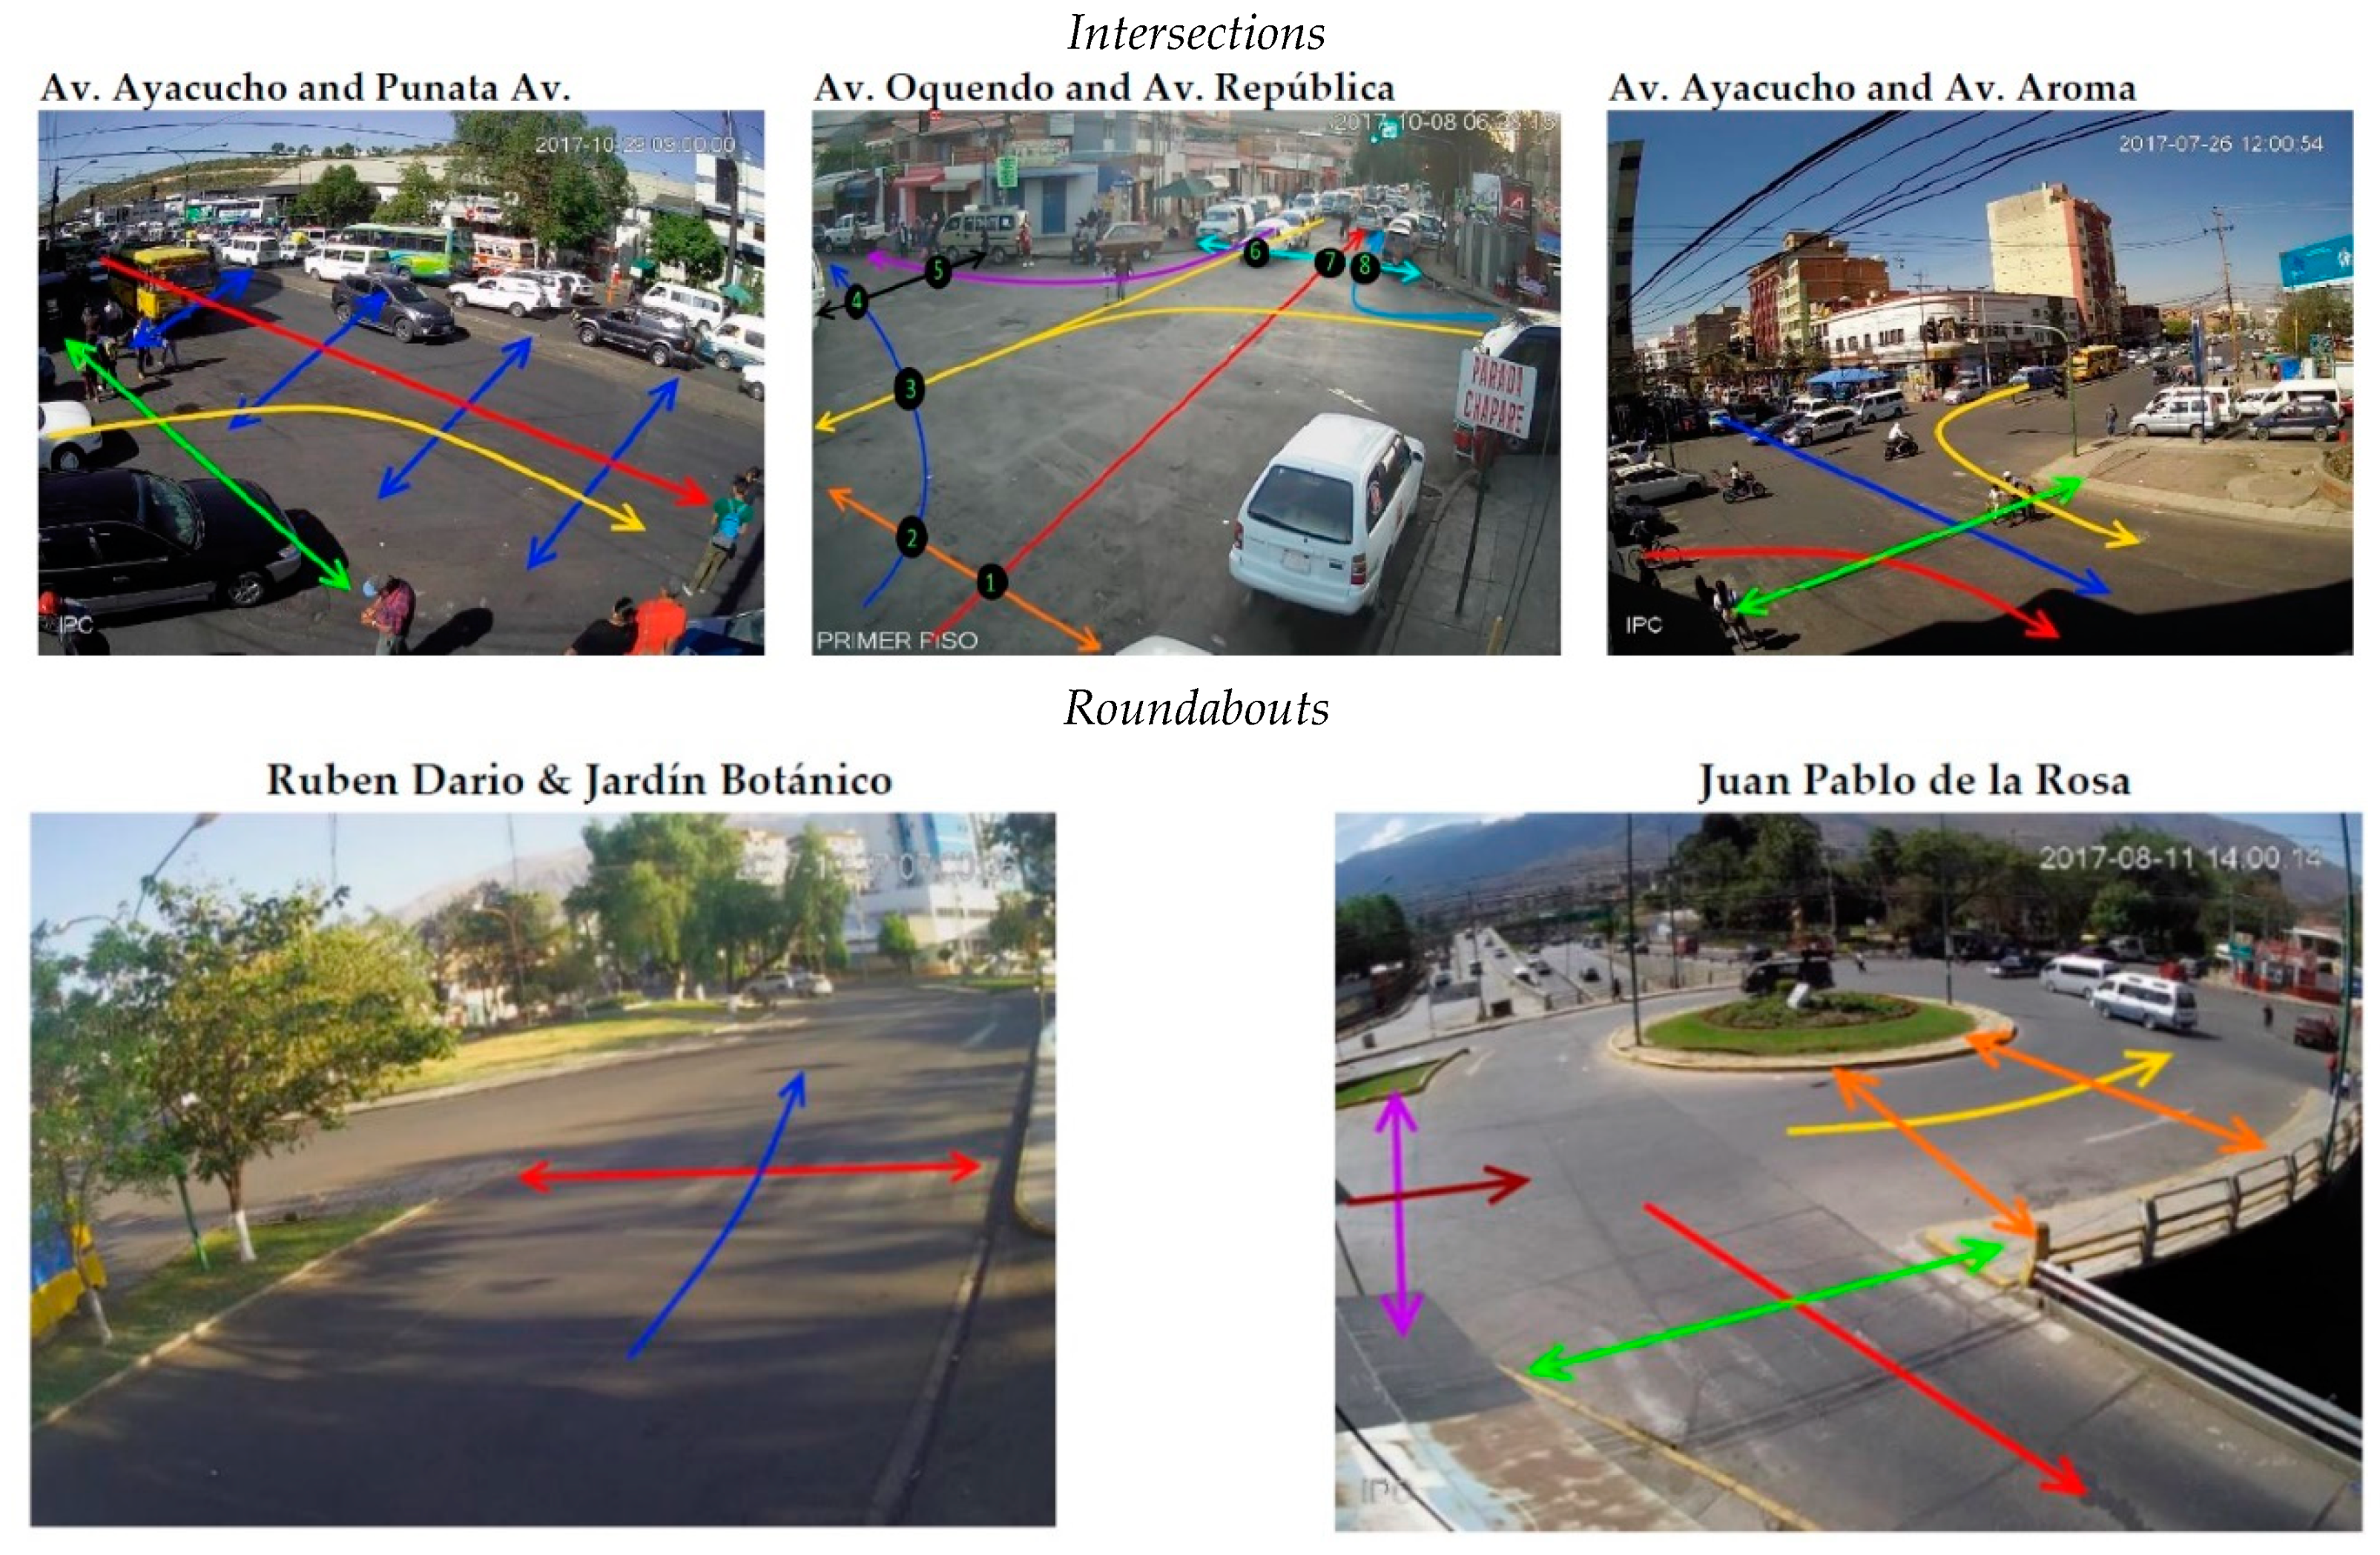
Figure 4.
Scenario definitions. (Notes: Arrows on screen images indicate trajectories analyzed at each site (e.g., through movement, right turns, and left-hand turns).)
Figure 4.
Scenario definitions. (Notes: Arrows on screen images indicate trajectories analyzed at each site (e.g., through movement, right turns, and left-hand turns).)
Figure 5.
Conflict severity classification.
Figure 5.
Conflict severity classification.
Figure 6.
Log of risk index versus risk category.
Figure 6.
Log of risk index versus risk category.
Figure 7.
Treated 4-legged intersection and roundabout: before and after temporary treatment implementation. (Notes: * Temporary treatments: crosswalk crossing and lane pavement marking along with curb extensions using flexible plastic bollards. ** Temporary treatments: crosswalk crossing and lane pavement marking along with the increase of the median width using flexible plastic bollards.)
Figure 8.
Before–after speed histograms.
Figure 8.
Before–after speed histograms.
Figure 9.
Severity of car–pedestrian conflicts before and after treatment.
Figure 9.
Severity of car–pedestrian conflicts before and after treatment.
Table 1.
Definition of variables.
Table 1.
Definition of variables.
| Variable | Description | Categories/Units |
|---|
| PET | Post-encroachment time between two road users | Seconds |
| VS85 | 85TH percentile of the vehicle speeds | km/h |
| Risk index | This is the ratio of VS85 and PET | VS85/PET |
| Intersection type | Intersection type where study crossing is located | Categorical variable with 3 categories: 3-leg, 4-leggedor roundabout |
| Arrived first | Who arrives first to conflict point: the pedestrian or vehicle | 0 = vehicle and 1 = pedestrian |
| Movement type | Type of vehicle movement when traversing intersection | Categorical variable with 3 categories: right, left or through movement interactions |
| Peak hour | The interaction is during peak hours (7 a.m. to 9 a.m., 3 p.m. to 5 p.m.). | 0 = not peak hours and 1 = peak hours |
| Night-time | The interaction is during night-time (7 pm to 7 a.m.). | 0 = daytime and 1 = night-time |
| Crossing distance | Crossing distance that the pedestrians must walk. | Meters |
| Traffic flow at crossing * | 15-min vehicles traffic count at crossing point. | Vehicles per 15 min |
| Traffic volume | Ratio of vehicle flow to crossing width in meters | Vehicles/(m-15 min) |
| Vehicle type | The type of vehicle involved in the interaction. | Categorical variable with 4 categories: car, truck, bus or motorcycle |
| Treated | Whether the interaction has been treated site or not. | 0 = not treated (before) and 1 = treated (after) |
Table 2.
Observations by site type.
Table 2.
Observations by site type.
| | Site | Type | Number of Observations | Average PET | Average Vehicle Speed * | Average Crossing Distance (Meters) |
|---|
| Study locations | ID 1: Av. Ayacucho and Av. Punata | 3-legged intersection | 6470 | 5.33 | 31.82 | 10.23 |
| ID 2: Av. Ayacucho and Av. Aroma | 4-legged intersection | 12,955 | 5.17 | 23.89 | 11.5 |
| ID 3: Av. Rubén Darío-Jardín Botánico | Roundabout | 323 | 4.25 | 22.23 | 5.98 |
| ID 4: Av. Oquendo and Av. República | 4-legged intersection | 5853 | 4.35 | 16.90 | 12.60 |
| ID 5: Rotunda de Juan Pablo de la Rosa | Roundabout | 2394 | 4.27 | 43.00 | 10.36 |
| Type of control | Non-Signalized | | 9187 | 5.33 | 31.82 | |
| Signalized | | 18,808 | 4.92 | 21.72 | |
| Total | | | 27,995 | | | |
Table 3.
Summary statistics: all intersections.
Table 3.
Summary statistics: all intersections.
| | Mean | Std. Dev. | Min | Max |
|---|
| Risk (RI) | 6.60 | 8.7 | 0.12 | 1028.7 |
| Ln (Risk) | 1.63 | 0.7 | −2.14 | 6.9 |
| PET (seconds) | 4.95 | 2.2 | 0.03 | 9.97 |
| 1/PET (1/seconds) | 0.26 | 0.3 | 0.10 | 33.3 |
| Speed (km/h) | 25.9 | 14.3 | 0.4 | 119.6 |
| Night-time (proportion) | 0.25 | 0.4 | 0 | 1 |
| Peak Hour (proportion) | 0.22 | 0.4 | 0 | 1 |
| Crossing distance (meters) | 11.28 | 1.7 | 4.7 | 14 |
| Traffic Flow (per 15 min) | 74.65 | 55.0 | 2 | 421 |
| Observations | 27,995 | | | |
Table 4.
Summary statistics: by type of intersection.
Table 4.
Summary statistics: by type of intersection.
| | Intersections | Roundabouts |
|---|
| Mean | Std. Dev. | Min | Max | Mean | Std. Dev. | Min | Max |
|---|
| Risk (RI) | 6.1 | 8.6 | 0.1 | 1028.7 | 11.3 | 7.8 | 0.4 | 93.4 |
| Ln (Risk) | 1.6 | 0.7 | −2.1 | 6.9 | 2.2 | 0.7 | −0.8 | 4.5 |
| PET (seconds) | 5.0 | 2.2 | 0.0 | 10.0 | 4.3 | 1.6 | 0.7 | 9.9 |
| 1/PET (1/seconds) | 0.3 | 0.3 | 0.1 | 33.3 | 0.3 | 0.1 | 0.1 | 1.5 |
| Speed (km/h) | 24.3 | 12.8 | 0.4 | 119.6 | 40.5 | 18.8 | 2.1 | 118 |
| Night-time | 0.3 | 0.4 | 0.0 | 1.0 | 0.2 | 0.4 | 0 | 1 |
| Peak hour | 0.2 | 0.4 | 0.0 | 1.0 | 0.2 | 0.4 | 0 | 1 |
| Crossing distance (meters) | 11.4 | 1.5 | 8.0 | 14.0 | 9.8 | 2.2 | 4.7 | 13.5 |
| Traffic flow (per 15 min) | 65.0 | 42.6 | 2.0 | 182.0 | 164.6 | 73.2 | 13.0 | 421.0 |
| Observations | 25,278 | | | | 2717 | | | |
Table 5.
Mean vehicle speeds (85th percentile) by type.
Table 5.
Mean vehicle speeds (85th percentile) by type.
| | 85th Percentile | Median Speeds |
|---|
| Vehicle Type | Mean | Std. Dev. | Freq. | Mean | Std. Dev. | Freq. |
|---|
| Car | 26.3 | 14.4 | 23,674 | 16.7 | 10.8 | 23,674 |
| Bus | 21.8 | 10.9 | 3485 | 12.7 | 9.2 | 3485 |
| Truck | 25.3 | 16.8 | 626 | 14.9 | 12.7 | 626 |
| Motorcycle | 46.5 | 20.8 | 210 | 30.9 | 13.9 | 210 |
| Total | 25.9 | 14.3 | 27,995 | 16.3 | 10.9 | 27,995 |
Table 6.
Summary statistic: by time of day.
Table 6.
Summary statistic: by time of day.
| | Night-Time | Daytime |
|---|
| Mean | Std. Dev. | Min | Max | Mean | Std. Dev. | Min | Max |
|---|
| Risk (RI) | 6.36 | 5.48 | 0.35 | 107.40 | 6.69 | 9.54 | 0.12 | 1028.67 |
| Ln (Risk) | 1.61 | 0.67 | −1.06 | 4.68 | 1.64 | 0.69 | −2.14 | 6.94 |
| PET (seconds) | 5.02 | 2.14 | 0.10 | 9.95 | 4.93 | 2.16 | 0.03 | 9.97 |
| Speed (km/h) | 25.73 | 14.48 | 1.80 | 116.60 | 25.93 | 14.24 | 0.40 | 119.61 |
| Traffic Flow (per 15 min) | 67.50 | 46.73 | 2.00 | 313.00 | 77.09 | 57.41 | 3.00 | 421.00 |
| Observations | 7133 | | | | 20,862 | | | |
Table 7.
Determinants of surrogate collision risk indicators: all intersections.
Table 7.
Determinants of surrogate collision risk indicators: all intersections.
| | Ln(risk) | 1/PET | Vehicle Velocity (85th Percentile) |
|---|
| | b/se | b/se | b/se |
|---|
| Night-time | −0.025 ** | −0.005 | −0.026 |
| | (0.010) | (0.004) | (0.183) |
| Peak-hour | 0.044 *** | 0.003 | 0.825 *** |
| | (0.011) | (0.005) | (0.195) |
| Traffic Flow | 0.013 *** | −0.001 *** | 0.627 *** |
| | (0.001) | (0.000) | (0.017) |
| Bus | −0.154 *** | −0.012 ** | −3.244 *** |
| | (0.013) | (0.005) | (0.233) |
| Truck | −0.016 | 0.010 | −1.603 *** |
| | (0.031) | (0.014) | (0.577) |
| Motorcycle | 0.558 *** | 0.242 *** | 13.310 *** |
| | (0.050) | (0.022) | (0.917) |
| Crossing Distance | −0.070 *** | 0.007 *** | −2.533 *** |
| | (0.006) | (0.002) | (0.108) |
| Traffic Flow | −0.140 *** | 0.010 ** | −6.342 *** |
| | (0.010) | (0.004) | (0.186) |
| Turning Movement | 0.174 *** | 0.024 *** | 2.380 *** |
| | (0.016) | (0.007) | (0.287) |
| Roundabout | −0.099 | 0.019 | 0.223 |
| | (0.124) | (0.025) | (4.243) |
| Turning Movement # Roundabout | 0.610 *** | 0.012 | 13.746 *** |
| | (0.053) | (0.022) | (0.968) |
| Constant | 2.311 *** | 0.198 *** | 50.242 *** |
| | (0.096) | (0.028) | (2.866) |
| Observations | 24,215 | 24,215 | 24,215 |
Table 8.
Disaggregated effects: 4-way intersections and roundabouts.
Table 8.
Disaggregated effects: 4-way intersections and roundabouts.
| | Intersections (4-Way) | Roundabouts |
|---|
| | Ln (Risk) | 1/PET | Velocity | Ln (Risk) | 1/PET | Vehicle Speed |
|---|
| | b/se | b/se | b/se | b/se | b/se | b/se |
|---|
| Night-time | −0.023 ** | −0.005 | 0.077 | −0.127 *** | −0.010 | −3.854 *** |
| | (0.010) | (0.004) | (0.183) | (0.041) | (0.011) | (0.835) |
| Peak-hour | 0.040 *** | 0.003 | 0.616 *** | 0.082 ** | 0.012 | 1.991 *** |
| | (0.011) | (0.005) | (0.197) | (0.036) | (0.009) | (0.734) |
| Traffic Flow | −0.003 | −0.005 *** | 0.158 *** | 0.007 *** | 0.000 | 0.395 *** |
| | (0.002) | (0.001) | (0.034) | (0.001) | (0.000) | (0.030) |
| Bus | −0.164 *** | −0.012 ** | −3.455 *** | −0.075 | 0.018 | 0.616 |
| | (0.013) | (0.006) | (0.230) | (0.079) | (0.020) | (1.589) |
| Truck | −0.058 * | 0.010 | −2.925 *** | 0.016 | −0.008 | 2.518 |
| | (0.033) | (0.015) | (0.595) | (0.084) | (0.021) | (1.688) |
| Motorcycle | 0.609 *** | 0.291 *** | 15.213 *** | 0.176 ** | 0.058 *** | 2.488 |
| | (0.057) | (0.025) | (1.031) | (0.084) | (0.021) | (1.703) |
| Crossing distance | −0.024 *** | 0.017 *** | −1.099 *** | 0.109 *** | −0.004 | 3.671 *** |
| | (0.008) | (0.002) | (0.146) | (0.022) | (0.005) | (0.451) |
| Traffic Volume | 0.021 | 0.048 *** | −1.527 *** | −0.079 *** | −0.003 | −4.560 *** |
| | (0.020) | (0.007) | (0.361) | (0.013) | (0.003) | (0.273) |
| Signalized Intersection | −0.122 * | 0.044 *** | −8.802 *** | | | |
| | (0.072) | (0.007) | (1.482) | | | |
| Right Turn | −0.128 *** | −0.004 | −4.631 *** | | | |
| | (0.021) | (0.007) | (0.376) | | | |
| Left Turn | 0.157 *** | −0.001 | 2.134 *** | | | |
| | (0.017) | (0.006) | (0.314) | | | |
| Turning Movement | | | | 0.773 *** | 0.020 * | 16.230 *** |
| | | | | (0.040) | (0.010) | (0.893) |
| Constant | −2.863 *** | −24.050 * | 0.17 | 0.698 *** | 0.278 *** | 4.774 |
| | (0.44) | (12.98) | (0.43) | (0.190) | (0.043) | (4.931) |
| Observations | 22,959 | 22,959 | 22,959 | 1256 | 1256 | 1256 |
Table 9.
Summary statistics before and after treatment.
Table 9.
Summary statistics before and after treatment.
| | 4-Legged Intersection Before | 4-Legged Intersection After | Roundabout Before | Roundabout After |
|---|
| Average PET (seconds) | 4.43 | 4.22 | 4.24 | 4.29 |
| Average 85th Speed (km/h) | 17.89 | 15.38 | 39.55 | 45.21 |
| Observations | 3534 | 2319 | 933 | 1461 |
Table 10.
Impacts of pedestrian safety treatments.
Table 10.
Impacts of pedestrian safety treatments.
| | Intersections | Roundabouts |
|---|
| | Ln (Risk) | 1/PET | RU2 85th Speed | Ln (Risk) | 1/PET | RU2 85th Speed |
|---|
| | (1) | (2) | (3) | (4) | (5) | (6) |
|---|
| Night-time | −0.057 *** | −0.012 | −0.647 *** | −0.154 *** | −0.022 *** | −2.883 *** |
| | (0.022) | (0.021) | (0.200) | (0.032) | (0.007) | (0.816) |
| Peak-hour | 0.005 | −0.005 | −0.133 | 0.076 *** | 0.006 | 2.703 *** |
| | (0.020) | (0.019) | (0.184) | (0.029) | (0.006) | (0.757) |
| Traffic Flow | 0.008 *** | 0.000 | 0.103 *** | 0.002 | 0.000 | 0.051 |
| | (0.003) | (0.002) | (0.023) | (0.001) | (0.000) | (0.035) |
| Bus | −0.092 *** | −0.024 | −0.109 | −0.358 *** | −0.002 | −6.934 *** |
| | (0.023) | (0.022) | (0.214) | (0.080) | (0.018) | (2.067) |
| Truck | −0.142 *** | −0.055 | 0.169 | 0.221 *** | 0.016 | 8.297 *** |
| | (0.039) | (0.037) | (0.358) | (0.057) | (0.012) | (1.467) |
| Motorcycle | 0.734 *** | 1.850 *** | 5.626 *** | 0.260 *** | 0.059 *** | 3.927 ** |
| | (0.141) | 0.134) | (1.285) | (0.067) | (0.015) | (1.725) |
| Crossing distance | −0.014 * | 0.002 | 0.097 | 0.082 *** | 0.001 | 4.669 *** |
| | (0.008) | (0.008) | (0.074) | (0.025) | (0.005) | (0.639) |
| Traffic Volume | −0.114 *** | −0.002 | −1.646 *** | −0.023 | 0.000 | −0.837 ** |
| | (0.025) | (0.024) | (0.232) | (0.015) | (0.003) | (0.378) |
| Turning Movement | | | | 0.567 *** | 0.016 * | 10.667 *** |
| | | | | (0.040) | (0.009) | (1.036) |
| Right Turn | −0.138 *** | −0.025 | −3.292 *** | | | |
| | (0.023) | (0.022) | (0.213) | | | |
| Left Turn | −0.220 *** | −0.018 | −5.096 *** | | | |
| | (0.029) | (0.027) | (0.262) | | | |
| After Treatment | −0.135 *** | 0.003 | −2.245 *** | 0.061 ** | −0.010 * | 0.576 |
| | (0.017) | (0.016) | (0.154) | (0.025) | (0.005) | (0.632) |
| Constant | 1.791 *** | 0.288 *** | 20.212 *** | 1.013 *** | 0.248 *** | −10.374 |
| | (0.100) | (0.095) | (0.912) | (0.253) | (0.056) | (6.518) |
| Observations | 5853 | 5853 | 5853 | | | |
© 2019 by the authors. Licensee MDPI, Basel, Switzerland. This article is an open access article distributed under the terms and conditions of the Creative Commons Attribution (CC BY) license (http://creativecommons.org/licenses/by/4.0/).


