Experimental Study on Seismic Behavior of Masonry Walls Strengthened by Reinforced Mortar Cross Strips


1
Department of Civil Engineering, Ocean University of China, 266100 Qingdao, China
2
Institute of Defense Engineering, Academy of Military Science, The People’s Liberation Army, Beijing 100850, China
*
Author to whom correspondence should be addressed.
Sustainability 2019, 11(18), 4866; https://doi.org/10.3390/su11184866
Submission received: 30 June 2019
/
Revised: 12 August 2019
/
Accepted: 16 August 2019
/
Published: 5 September 2019
(This article belongs to the Special Issue Structural Upgrading Systems for Sustainable and Resilient Concrete Infrastructure)
Abstract
:Due to the poor seismic performance, strengthening of masonry structures is always a significant problem worthy to study. It has been proven that the bearing capacity of existing masonry buildings can be enhanced greatly with efficient strengthening measures. An experimental program was conducted to investigate seismic performance of un-reinforced masonry (URM) walls strengthened by reinforced mortar (RM) cross strips. Eleven walls were tested under horizontal low-cyclic load, simultaneously with a vertical constant load on the top face. Three URM walls were tested as reference. The other eight walls were externally strengthened with 40 and 60 mm thick of RM cross strips on one or both faces. Test results showed that externally strengthening with RM cross strips was an efficient way to enhance the seismic performance of URM walls. The failure modes were divided into shear failure and shear-compression failure. All the tested walls did not collapse until the test ended, while many diagonal cracks and few vertical cracks appeared on mortar strips. After strengthening, the shear capacity of the strengthened walls increased by at least 38.2%, and the reinforcement ratio was noted to be the key factor to influence the shear capacity with positive correlation. Besides, RM cross strips did improve deformation capacity greatly.
1. Introduction
Masonry has been used as a building technique for thousands of years. From the Medieval period, a great variety of masonry typologies were studied and applied [1,2]. Even if the concrete and steel structures became the most common forms for the modern buildings [3], URM structures were also widely used, especially in rural areas, due to its advantages of wide material source, good durability, good thermal insulation performance and low cost. In China, lots of brick or hollow brick masonry houses have been built from last century, both in seismic and non-seismic regions. Though it can accommodate many people for living, masonry structures are the largest part of the world’s dangerous building stock. Researches show that masonry structures face more serious damage problems during the earthquake, compared to concrete or steel structures. As a result of the weak bond between the brick and mortar, URM has low tensile, flexural and shear strength [4,5]. Meanwhile, the variability in masonry typologies results in a large scattering of mechanical properties, making masonry material one of the most variable within construction materials. Due to these composition characteristics, its brittle nature is determined, which makes sense of masonry’s poor seismic performance.
Indeed, earthquake-induced damage of masonry structures is a significant factor leading to casualties and economic losses, which limits its application of masonry structures in the seismic regions [6,7,8]. Seismic strengthening of masonry structures has been an important research subject. Among the existing strengthening techniques, using traditional materials for surface treatments is the main categories [9,10,11,12,13,14]. By adding concrete or mortar layers on the masonry surface, the integrity of masonry structures can be strengthened. Besides, combined with the reinforcement materials in the layers, the seismic shear strength and deformation can be improved greatly [15,16,17,18,19,20,21]. However, the structural stiffness and interior space of the building would change greatly when the thicker reinforced layers were applied.
In recent years, external bonding fiber reinforced plastics (FRP) is a new kind of strengthening method, characterized by its high strength to weight ratio, thinner cross-sections, and convenient construction. Many experimental studies have been conducted on the strengthening of masonry walls using FRP materials [22,23,24,25]. Using special fiber adhesive, the FRP materials are bonded diagonally, vertically or horizontally on the surface of walls, which has been proven to enhance the seismic capacity of masonry structures [26,27,28,29,30,31]. Also, external bonding FRP method is associated with some limitations, such as the debonding of the FRP sheets from masonry structures and performance degradation under high temperature environment [32].
Newly textile-reinforced mortar (TRM) or concrete (TRC) composites, sort of like mesh reinforcement cement materials, have also been used to strengthen masonry structures [13,33,34,35]. Instead of steel bars, fiber fabric meshes were used as reinforced materials. Fabric meshes usually are knitted in orthogonal directions by dipped fiber bundles. The mortar or concrete matrix does not only transfer the stress between fabric mesh and the masonry wall, but also provides external protection for fabric mesh against the harsh environment. Compared with the above two methods, TRM or TRC strengthening method has less impact on interior space and better heat resistance, but the cost-effective ratio is far from satisfactory because of expensive fiber materials and complex construction. Under in-plane load, out-of-plane failure was an important issue for single-faced strengthened walls because of the eccentricity of load, and in-plane diagonal crashing was the governing failure mode for double-faced strengthened walls [32,36,37].
To overcome the drawbacks of these strengthening techniques, a new type of strengthening method, using reinforced mortar (RM) cross strips as reinforced layer, is presented here by improving the traditional surface treatment technique. It is known that URM is the main lateral shear load-bearing member under an earthquake. Cross diagonal cracks in-plane would occur on the surface of the masonry walls, after principal tensile stress exceeds the ultimate tensile strength [38,39]. In order to delay the appearance of diagonal cracks and resist shear force, RM cross strips strengthening method was proposed here. Compared to traditional surface retrofitting with mesh reinforcement cement mortar, the X-shaped RM cross strips were smeared or sprayed on the diagonal region of the masonry wall, the position of high principal stress under in-plane load. Instead of coating all the wall as in the traditional method, the diagonal mortar strips were only 250–300 mm wide. In each mortar strip, the reinforcement mesh was composed of three diagonal reinforced steel bars and ten distributed steel bars, as shown in Figure 1b. The end of these diagonal steel bars was connected to the masonry wall with special adhesives. In this way, RM cross strips and URM wall compose an integrated member to resist the earthquake.
In this study, half-scale masonry walls strengthened by reinforced mortar cross strips were tested under horizontal low-cyclic load. The response of strengthened walls was compared with un-reinforced masonry walls. The influence of mortar thickness, mortar strength, and the reinforcement ratio in the strengthening method was investigated experimentally.
2. Experimental Program
2.1. Test Schedule
In order to be in compliance with the practice, ordinary clay solid bricks and normal mortar were used to build the URM walls. According to the orthogonal test method, a series of 11 URM and strengthened masonry walls were fabricated and tested in the laboratory. Three URM walls were tested as reference specimens, named WR1–WR3. As well the left 8 masonry walls were strengthened with RM cross strips, named W1~W8. The sizes of most specimens were 2100 mm long, 1560 mm high and 240 mm thick, except for specimen WR3 and W8 with dimensions 1560 × 1560 × 240 mm3. The details of URM wall and reinforced wall are presented in Figure 1.
There were several variables in the experiment including masonry mortar strength grade, strip mortar strength grade and mortar thickness, reinforcement ratio of the strip, vertical stress, and reinforcement locations (strengthened on one or two faces). Due to the little influence of brick strength, the same bricks with dimensions 240 × 115 × 53 mm3 and strength grade MU10 (characteristic compression strength of 10 MPa) were used in these specimens. The mortar strength grade of these un-reinforced walls has been determined as M1, M2.5 and M10 (characteristic compression strength of 1 MPa, 2.5 MPa and 10 MPa). To obtain a better strengthening effect, the mortar with higher strength grade (respectively M2.5, M5 and M10) was used for cross strips. Four diameters of steel bars ranged from 6 to 12 mm, while the strip thickness was set to 40 and 60 mm. In practice, the vertical stresses are different for masonry walls in different stories. In that case, three different vertical stresses were determined as 0.516 MPa for the walls in ground floor of a seven-story building, 0.4 MPa for the walls in third floor of a seven-story building, and 0.21 MPa for the walls in the top floor of a seven-story building. The stresses were defined by load per section area in the vertical direction. Besides, both single-faced and double faced strengthening schemes were used to investigate the strengthening effects. Details of the strengthening schemes are shown in Table 1.
2.2. Material Properties
The masonry bricks were from the same batch produced in local construction material company. Physical properties of the bricks were obtained by compression tests on ten bricks. According to Chinese code GB/T 2542-2012 [40], each brick was cut in half, with dimensions 120 × 115 × 53 mm3 for half brick. Using 5 mm thick cement mortar on the surface with dimensions 120 × 115 mm2, the two half-bricks bonded together as one test sample. The mortar strength was 20 MPa, and the mass mixing proportion was 1:0.67:4.18 for cement, water and sand. The average compressive strength of ten test samples was 9.11 MPa, the variable coefficient was 0.16, and the standard deviation was 1.41. According to Chinese code JGJ/T 70-2009 [41], mortar test prisms of 70.7 × 70.7 × 70.7 mm3 were tested for compressive strength. At 28 days, the average compressive strength of six prisms was 0.92 MPa for Grade M1, 2.47 MPa for Grade M2.5, 7.33 MPa for Grade M5, and 10.97 MPa for Grade M10. All the reinforced and distributed rebars came from local company Jiali Rolled Steel Ltd. For the tensile tests, a yield strength of 483 MPa was recorded for the steel bars with 6 mm diameter, as well as 505 MPa for rebars with 8 mm diameter rebars, 512 MPa for 10 mm diameter rebars, and 445 MPa for 12 mm diameter rebars. The material properties are shown respectively in Table 2.
2.3. Specimens Construction
2.3.1. Masonry Wall
For each masonry wall, two reinforced concrete members were designed as foundation and loading beams, respectively. The bottom one was a cross-shaped concrete joint to support the masonry wall above, as shown in Figure 2a. A layer of 10 mm thick mortar was used to connect the masonry wall to the bottom concrete joint. The joint was composed of one 2.5 m long primary beam and two 1.2 m long secondary beams, intersecting at the 1/3 length and 2/3 length of the primary beam. Both primary and secondary beams have the same cross Section 240 × 400 mm, and the same reinforcement condition. Six longitudinal steel bars with a diameter of 14 mm were used for the foundation beams, two bars in compression zone, two in tension zone, and two at the half-height of the cross section. The reinforced concrete member on the top surface of the wall was used as a loading beam with dimensions 2200 × 240 × 180 mm3. Four steel bars with a diameter of 14 mm were used as longitudinal reinforcement of the loading beam. Stirrups with a diameter of 8 mm and spacing 200 mm were set in both bottom and upper concrete members.
According to the related technical specification and experiences, effective control measures on construction quality were applied to ensure the quality of un-reinforced masonry wall. The bricks of each layer have the same arrangement and were orthogonal with the adjacent layers. When the bricks were under construction, the thickness of masonry mortar in the vertical and horizontal directions was limited in 10 ± 1 mm, and the wall dimensions were strictly controlled with the position scale. All the specimens were built by two professional masons using the streamline method to ensure construction equality. Figure 2a show a typical photograph of the un-reinforced masonry wall in this test.
2.3.2. Reinforcement
After curing of 28 days since the completion of the un-reinforced wall construction, the mortar strength was up to more than 70 percent of its ultimate compressive strength, shown in Table 2. In that case, the strengthening procedure of these un-reinforced walls started.
According to the experimental design plan, the axis and fixing position of reinforcement bars was set out first on the surface of the masonry wall, as well as the layout of reinforced mortar cross strips. For each strip, three diagonal reinforced and ten transverse distributed steel bars were assembled to orthogonal mesh in advance. The diameter of diagonal bars for each specimen was shown in Table 1. The distributed steel bars in RM cross strips had a diameter of 6 mm and a spacing of 300 mm for all strengthened specimens. After that, the steel meshes were fixed on the wall by the staggered connecting bars, which were installed with a spacing of 600 mm, as shown in Figure 1b. The connecting bars (6 mm in diameter) were L-shaped for single-faced strengthening form, and S-shaped for double-faced strengthening form. The end of the diagonal reinforced bars was in a right-angle bent shape and also installed into the masonry wall with structural adhesives. From pull-out tests conducted by the manufacturer, the bond strength of the steel bar-adhesive-concrete interface was 23.7–28.8 MPa. After fixation, the overlay mortar was manually plastered on the wall to protect the rebars and transfer shearing stress. The mortar layer was 250 mm wide, 40 or 60 mm thick and disposed in cross. In order to enhance the anchorage performance, an additional horizontal mortar strip was plastered below the loading beam and connected with the end of RM cross strips.
During the construction process of smearing overlay mortars, layered construction was used to obtain greater uniformity. The thickness of each layer did not exceed 15 mm in one-day construction. So that the mortar strip construction was completed in two days. After strengthening construction, all the specimens had been wet cured for 28 days. The strengthening procedure is shown in Figure 2b,c.
2.4. Test Setup and Testing Procedures
All specimens were tested under lateral cyclic loading, simultaneously with a vertical constant load on the top face. Both lateral and vertical loading was applied on the loading beam by a four-bar linkage loading device, shown in Figure 3. This loading device consisted of a counterforce frame, a four-bar linkage, an L-shaped loading steel beam and two hydraulic actuators. The L-shaped steel beam could effectively restrain the top of the wall from rotating, so that the specimens would eventually fail due to only shear load rather than bending load. In order to transfer the lateral force effectively, a fixing device, composed of four threaded steel rods and two bolted end-plates, was used to integrate the concrete loading beam and the L-shaped steel beam. When the installation is complete, a preloading test was carried out to check whether the test devices can work properly. In this process, fifty percent of the requested vertical load was applied, then 20 kN was used as a lateral cyclic load for three times.
After the check work was finished, the seismic test began. First, the requested vertical load was applied with a 1000 kN capacity actuator and kept constant during the whole test. Thereafter, the lateral cycle load was applied with a 500 kN capacity actuator, according to the Chinese Code JGJ/T 101-2015 [42], specification for the seismic test of buildings. Plotted in Figure 4, the control method consists of a series of reversed force and displacement cycles, and each cycle was four minutes. The force control, with increment by 20 kN per cycle, was used until the first crack appeared. At that moment, the horizontal load and displacement of loading point were defined as cracking load and cracking displacement, respectively. After that, the displacement cycles began with increment by the value of cracking displacement. For each displacement increment, three cycles of the same amplitude are applied. This loading mode can be controlled manually and modified as needed. When the recorded lateral force decreased to 85 percent of peak load, the test was terminated.
Various transducers have been employed to record the structural responses, including the horizontal and vertical displacement in-plane, the displacement out-of-plane, the loading force and the strain of steel bars. The displacement transducers were placed at both edges of the loading concrete beam to measure the vertical and horizontal displacement in-plane. Additional two transducers at the mid-span of upper and bottom concrete beams were assigned for collecting the relative horizontal displacement. The last transducer was located at the middle of the upper loading beam to measure the out-of-plane displacement. The average horizontal displacement of three measure points on the upper beam was defined as the horizontal displacement of loading point for the test specimen. Besides, the horizontal and vertical loads were also received by the force transducers, which were integrated into the actuators. In order to access the conditions of steel stress development, the ten strain gauges were stuck on the middle and quarter span of the diagonal reinforcement bars. The position of transducers and strain gauges are illustrated in Figure 5.
3. Experimental Observations
During the test, the development of cracking and the failure modes of all the specimens were observed and recorded. In general, shear failure was the main failure mode for all the specimens when the test ended. Only few vertical cracks were found on some strengthened masonry walls W1–W4. According to the observations and component classification, 11 un-reinforced and strengthening walls could be divided into three groups.
3.1. Behavior of Un-Reinforced Walls WR1–WR3
A shear failure mode was observed for the three un-reinforced walls, the behavior of which were similar. Take specimen WR2 for example (Figure 6b), the test response was described as follows. In the force cycling stage, the deformation increases linearly. When the horizontal load reached 97 kN, the first crack appeared in the center of the wall. It was a diagonal oblique cracking from the upper left to the lower right. The crack propagated mainly along the horizontal and vertical mortar bed joint, and few bricks fractured in the middle. Thereafter, as the control displacement increased, the maximum horizontal load did not increase, and the first crack extended to the bottom and top of the wall. When the displacement of loading point reached 8 mm, another oblique crack appeared along the other diagonal direction of the wall. While continuing to load, the main oblique crack gradually enlarged until the test ended, at which the bearing capacity of the wall decreased to 85 percent of the peak load. The crack distribution of WR1, WR2, WR3 at the ending of tests are shown in Figure 6a–c.
3.2. Behavior of Strengthened Walls W1–W4
Specimens W1–W4 displayed shear-compression failure with diagonal and vertical cracks in the un-strengthened zone of the walls. Most cracks on the RM cross strips were perpendicular to the diagonal direction, resulted from the tensile force. Take specimen W1 for example (Figure 7a), no cracks appeared under vertical load, and slight cracks first appeared on the middle length of RM cross strips when the horizontal load exceeded 100 kN. When loaded to 140 kN, more cracks appeared on RM cross strip, and the mortar strips had a tendency to peel away from the masonry wall. Meantime, vertical cracks occurred on the horizontal mortar strip. The diagonal cracks on the masonry walls didn’t appear until the load reached 160 kN. These cracks propagated along both mortar strips. Under the vertical and horizontal loads, a vertical crack appeared on the left part of the masonry wall, from the upper position of steel bars anchorage to the bottom of the wall. For specimen W4, there was a horizontal crack occurring along the junction between the bottom beam and masonry wall, which may be caused by improper construction. After the horizontal load exceeded 170KN, no more cracks appeared, and displacement control loading began. Comparing W1, W4 with WR1, WR2, the peak and ultimate deformation respectively increased about sixfold and threefold. The failure of specimens W1–W4 are shown in Figure 7a–d.
3.3. Behavior of Strengthened Walls W5–W8
The failure mode of specimens W5–W8 were all shear failure, shown in Figure 8a–d. Take the single-faced strengthened specimen W5 for example (Figure 8a). With the horizontal load increasing, the first two cracks appeared at about 160 kN. One crack appeared on the mortar strip in the lower left corner, while the other crack occurred at the junction of the two cross strips. Meanwhile, slight cracks appeared at the joint of the masonry wall and overlay mortar. Horizontal fracture in the back side showed up along the lower mortar bed when the horizontal force exceeded 190KN. At the same time, vertical cracks appeared on the left side of the masonry wall. Oblique crack appeared on the back of the wall until the horizontal force reached 200 kN. So far, it is considered that the wall entered the stage of elastoplastic deformation. Loading mode turned to displacement control. In the following stage, some vertical cracks appeared on the upper triangular region (the mortar strip divided the wall into four triangular). After that, oblique cracks came out in all the triangle areas except for the lower one. These oblique cracks were located close and parallel to the strips. Visible crossing cracks were discovered on the back side of the specimen (the un-strengthened face). With the increase of horizontal displacement, more cracks appeared on the back of the wall, parallel to the main diagonal cracks. Then the bearing capacity of the wall descended, and the final horizontal displacement of loading point was 9.67 mm when the test ended. Removing the overlay mortar, the observation of end anchorage for diagonal rebars is given in Figure 8e. The bricks around anchorage point were crushed with no rebar separation from the wall.
4. Experimental Results and Discussion
4.1. Damage Mechanism
RM cross strips strengthening composite wall consisted of an original un-reinforced wall, cross mortar strips and reinforcement bars. All the three parts make up a new structure system to bear the horizontal and vertical loads. At the early stage of the cycle loading progress, the wall stress was small and no cracks appeared, so that the structure response was in the elastic period. With the increasing of horizontal loading, first crack appeared on the overlay mortar, and it is in a direction perpendicular to the diagonal steel bars, which showed that the RM strip resisted mainly axial load. Further, based on the cyclical change of measured steel bar strain, it indicated that RM cross strips behaved just like a strut-and-tie member under the cycle loading.
Continuing to increase the load till the cracking load of the specimen, diagonal cracks occurred, paralleled to the RM mortar strip. It revealed that the structure entered the elastic-plastic stage. After that, the main cracks enlarged with the increase of horizontal load, which has been accompanied by the generation of new cracks. Then the specimen entered the stable development stage of cracking. In this stage, the stiffness further reduced, and the length and width of cracks further increased until the appearance of full-length cracks. It is worth mentioning that the number of cracks did not increase.
Ideally, the RM cross strips were supposed to fail before the shear failure of the masonry wall. However, neither the yielding of steel bars nor the crushing of RM strip was found during the test. So the failure of the whole structure was mainly caused by the shear destruction of the original wall. Nevertheless, the reinforced mortar cross strips play a greater role in improving the bearing capacity of the un-reinforced wall, and make specimens W1–W4 experience shear-compression failure under high vertical stress level (0.516 MPa). Besides, the development of cracks was constrained by the cross mortar strip, which improved the ductility of the wall.
4.2. Bearing Capacity
Table 3 shows the results of the cracking load, peak load, and the maximum stress of the rebars during the test. The cracking load was defined by the load under which the first crack appeared.
These results show that the strengthened walls achieve obviously higher cracking and peak loads than that of the reference un-reinforced walls, regardless of reinforcement configuration. The cracking load increases from 20.1% (W6) to 42.0% (W1), while the peak load increases from 38.2% (W2) to 65.0% (W6). Comparing W3 with W2, and W4 with W5, it is found that the influence of double-faced strengthening is higher on the peak load than on the cracking load, which could be attributed to the reinforcement bars in the elastoplastic stage. The comparison between WR1 and WR2 proved that the higher vertical stress level (from 0.516 to 0.21) has a positive role in the enhancing of bear capacity by 26.9%. According to the above conclusion, a stronger impact, contributed by the reinforcement ratio, can be derived from the load results of W6 (6 mm rebar in diameter) and W7 (10 mm rebar in diameter). For specimen W7, the peak load is improved by 37.3% with the vertical stress level 0.4. Besides, it must be noted that all the reinforcement bars are far from yielding, which results in lower effectiveness in material utilization. It can be avoided by using the small diameter reinforcing bars, such as the condition in specimen W6. When the peak load reached, the maximum stress of 6mm rebar in diameter was 345.4 MPa, 71.5% of the yielding strength.
4.3. Hysteresis Loops and Skeleton Curves
Taking the horizontal displacement at the middle of the loading beam as abscissa, and the force applied by the horizontal actuator as ordinate, the hysteresis curves in the test can be partly drawn in Figure 9a–f. The dissipated energy during a cycle is defined as the area formed by the loop in the load–displacement curve [20]. It can be seen from the hysteresis curves that the enclosed area of the hysteresis curve is elongated at the beginning of the test, and the force has a linear relationship with the displacement. It is shown that the specimens worked in elastic state with negligible stiffness degradation and residual deformation. After the cracks occurred, the different development stages appeared in the curves for un-strengthened and strengthened specimens. For the un-reinforced walls WR1~WR3, the post-cracking force had little increase with the deformation increasing, and soon followed by the descendent of bearing capacity, which was contributed to the accumulation of damage. By contrast, the post-cracking force of the walls W1–W8, strengthened with RM cross strips, displayed a great increasing trend, and the rising amplitudes of peak loads were more than 50 percent. Due to the energy consumption during the cracking process, the hysteresis loop area began to increase, and there was residual deformation at that time. The hysteresis loop changed to the fusiform shape, and finally anti-S shape due to the larger slippage and the increasing of the diagonal cracks.
The skeleton curve is an envelope of the hysteresis curve, which lines each peak points under the cycle loading class. All the skeleton curves for the specimens are shown in Figure 10a–c. The figure reveals that before the crack appeared, the curve slope of the strengthened wall is higher than that of un-reinforced wall. What’s more, the strengthened specimens exhibited longer straight elastic behavior. It indicates that reinforced mortar (RM) cross strip strengthening method can improve the cracking load and initial stiffness of the wall. Strengthened specimens have a significant improvement in the load and displacement of both the peak and damage points. That indicates that the cross strips can work well together with the brick wall, increase the bearing capacity of the wall, and delay the appearance of cracks and failure of specimens.
In Figure 10a, a better strengthening effect has been achieved for specimens W3, W4, W5 and W7, in contrast with specimens W1, W2 and W6. Consequently, the increasing of strip mortar strength, the diameter of steel bar and vertical stress level, especially of double-faced strengthening method, can significantly improve the seismic performance of the strengthened specimens. For specimens W3, W5 and W6, after the peak points, the curves decrease much faster than other specimens in the same group. It can be inferred that the lower strip mortar strength or the small reinforcement ratio would have an adverse effect on post-peak bearing capacity.
As shown in Figure 10b,c, the vertical stress level and depth-width ratio have a significant influence on the bearing capacity of the un-reinforced wall. When the vertical stress level reduced or the depth-width ratio increased, the bearing capacity of the wall will decrease. For specimen W8, the masonry mortar strength is nearly 5 times, the depth-width ratio is 1.35 times, but the shear capacity is slightly lower than that of specimen W7. It shows that the increase of depth-width ratio will reduce the shear capacity of the masonry wall. Further, the effect of depth-width ratio on shear capacity is much greater than that of mortar strength. Besides, it can be seen from Figure 10c that RM cross strip strengthening method can also effectively improve the seismic capacity and ductility of the high-strength masonry walls.
4.4. Stiffness and Ductility
The details of ductility and stiffness of specimens are shown in Table 4. The secant stiffness degradation curves are given in Figure 11.
Ratio μ = Δu/Δcr is defined as the ductility coefficient. Where Δu is the ultimate displacement corresponding to the peak shear load during the test (ultimate load). Δcr is defined as the displacement corresponding to the shear load when the cracking began. Ratio βcr = Kcr /K0, βu = Ku/K0 are defined as the stiffness reduction coefficients. Where K0 is the initial stiffness, Kcr is the cracking stiffness, Ku is the peak stiffness, βcr is the stiffness reduction coefficient when cracking, and the stiffness reduction coefficient corresponding to the peak load is using βu to express [20].
It can be seen from Table 4, the ductility coefficient μ for all the strengthened walls is beyond 3.5, even reaches 10.75 for the specimen W2. For single-faced strengthening (W5), the ductility coefficient is 3.65, which is 1.6 times than the ductility coefficient of un-reinforced wall WR1. For double-faced reinforcement (W1, W3 and W4) of the same vertical stress level with W5, the ductility coefficient is increased by 2.8 times, higher than that of the single-faced reinforcement. In addition, the increasing of ductility is a little higher than the bearing capacity. It also can be found that the higher mortar strength (W6, W7) has a better improving effect on the ductility.
The slope of parallel segments, appeared in the first few circles, is taken as the initial stiffness of the specimens K0. The results in Table 4 show that the initial stiffness of the strengthened specimens is marginally improved, which is beneficial to shear capacity. From the results, the strength of cross strip mortar is positively correlated with the structural stiffness. The improvement of K0 for double-faced strengthening (W3, W4) is better than single-faced strengthening (W2, W5). Furthermore, the stiffness decrease in ultimate state is denoted by βu. It is obvious to see from Table 4, the average value of βu for the strengthening wall is 0.17, which is approximately half of un-reinforced walls. By contrast, RM cross mortar strengthening can effectively improve the utilization rate of structural materials and make the construction more economical.
From Figure 11, stiffness degradation tends to be basically the same for all the specimens. It is worth noting that the stiffness degradation rate of strengthening specimens is lower than that of un-reinforced specimens, which is more obvious after cracking. That’s because RM cross strips can effectively restrain the enlargement of diagonal cracks, and slow the degradation of structural stiffness. As a consequence, the structure has better seismic performance after retrofitting. Unlike un-reinforced walls, RM cross strip strengthening wall has more factors affecting the structural stiffness of the strengthened wall. By comparison, strengthening on both faces and increasing the vertical load can effectively reduce the degradation rate of stiffness, as well as using steel bars of larger diameter and strip mortar of higher strength.
5. Conclusions
The experimental study in this paper puts forward a new strengthening method, and underlines the benefits of using reinforced mortar (RM) cross strips to strengthen the seismic capacity of un-reinforced masonry wall. From the experimental results, the main conclusions are as follows.
RM cross strips strengthening is an effective method to improve the shear capacity and seismic performance of un-reinforced masonry walls. So far as feasible, RM cross strips strengthening method adds a negligible quantity of stiffness and mass to the original structure, with the advantages of easy construction, low cost and low impact.
After the strengthening, the cracks appeared first on the RM cross strips instead of the masonry walls, perpendicular to the diagonal steel bars. Just like a strut-and-tie member, RM cross strips mainly resisted the axial tensile and compressive load under the cycle loading.
At the ultimate bearing capacity condition, RM cross strips can still maintain integrity, and support the wall to prevent collapse. It can be concluded that the construction measures, including the arrangement of connecting bars and the end anchorage of steel rebars, can make the RM strips have a good co-working performance with the masonry wall.
The cracking load of the strengthened walls increased by 20.1–42.0%, while the ultimate load improved by 38.2–65.0%. The influence of double-faced strengthening is higher on the peak load than on the cracking load. The increase of the strip reinforcement ratio, vertical stress level and mortar strength all do help to improve the shear capacity. It can be found that the increase of depth-width ratio will decrease the shear capacity, and the effect of depth-width ratio is much greater than the strength grade of masonry mortar.
The effectiveness of improving ductility and delaying stiffness degradation is also satisfactory. The ductility is improved by 1.6 times for single-faced strengthening, and 2.8 times for double-faced method. The stiffness degradation of strengthening specimens has been reduced in the test, especially after cracks occurred. As a consequence, higher vertical load, higher reinforcement ratio and higher strip mortar strength can effectively increase the ductility and reduce the stiffness degradation.
It is important to indicate that shear failure is still the main failure for RM strengthened walls, though vertical cracks appeared on the specimens W1–W4 when the test ended. Further research should be conducted to investigate the change mechanism of failure mode and the proper design method, in order to make this strengthening technique more applicable for URM.
Author Contributions
Conceptualization, J.J.; data curation, Z.-a.S., K.D.; funding acquisition, K.D., X.Z.; investigation, Z.-a.S., K.D.; methodology, J.J., X.Z.; supervision, J.J.; writing—original draft preparation, Z.-a.S., K.D.; writing—review and editing, Z.-a.S., K.D.
Funding
The research described here was supported by the Fundamental Research Funds for the Central Universities (Grant number 841813023), Postdoctoral Science Foundation of China (Grant number 2019M652477), and Post-doctoral Applied Research Project of Qingdao (Grant number 861905042002).
Acknowledgments
The authors would like to thank the anonymous reviewers for their constructive suggestions to improve the quality of the paper.
Conflicts of Interest
The authors declare no conflict of interest.
References
- Krzan, M.; Gostic, S.; Cattari, S.; Bosiljkov, V. Acquiring reference parameters of Masonry for the structural performance analysis of historical buildings. Bull. Earthq. Eng. 2015, 13, 203–236. [Google Scholar] [CrossRef]
- Santhakumar, A.R.; Mathews, M.S.; Thirumurugan, S.; Uma, R. Seismic retrofitting of historic masonry buildings–case study. Adv. Mater. Res. 2010, 133, 991–996. [Google Scholar] [CrossRef]
- Moradi, M.J.; Hariri-Ardebili, M.A. Developing a library of shear walls database and the neural network based predictive meta-model. Appl. Sci. 2019, 9, 2562. [Google Scholar] [CrossRef]
- Cardoso, R.; Lopes, M.; Bento, R. Seismic evaluation of old masonry buildings. Part I: Method description and application to a case-study. Eng. Struct. 2005, 27, 2024–2035. [Google Scholar] [CrossRef]
- Zhao, B.; Taucer, F.; Rossetto, T. Field investigation on the performance of building structures during the 12 May 2008 Wenchuan earthquake in China. Eng. Struct. 2009, 31, 1707–1723. [Google Scholar] [CrossRef]
- Giamundo, V.; Lignola, G.P.; Maddaloni, G.; Balsamo, A.; Prota, A.; Manfredi, G. Experimental investigation of the seismic performances of IMG reinforcement on curved masonry elements. Compos. Part B Eng. 2015, 70, 53–63. [Google Scholar] [CrossRef]
- Marini, A.; Belleri, A.; Preti, M.; Riva, P.; Giuriani, E. Lightweight extrados restraining elements for the anti-seismic retrofit of single leaf vaults. Eng. Struct. 2017, 141, 543–554. [Google Scholar] [CrossRef]
- Ehsani, M.R.; Saadatmanesh, H.; Velazquez-Dimas, J.I. Behavior of retrofitted URM walls under simulated earthquake loading. J. Compos. Constr. 1999, 3, 134–142. [Google Scholar] [CrossRef]
- Paret, T.F.; Freeman, S.A.; Searer, G.R.; Hachem, M.; Gilmartin, U.M. Using traditional and innovative approaches in the seismic evaluation and strengthening of a historic unreinforced masonry synagogue. Eng. Struct. 2008, 30, 2114–2126. [Google Scholar] [CrossRef]
- Shermi, C.; Dubey, R.N. Study on out-of-plane behaviour of unreinforced masonry strengthened with welded wire mesh and mortar. Constr. Build. Mater. 2017, 143, 104–120. [Google Scholar] [CrossRef]
- Banerjee, S.; Nayak, S.; Das, S. Enhancing the flexural behavior of masonry wallet using PP band and steel wire mesh. Constr. Build. Mater. 2019, 194, 179–191. [Google Scholar] [CrossRef]
- Ademović, N. Structural and Seismic Behavior of Typical Masonry Buildings from Bosnia and Herzegovina. Master’s Thesis, University of Minho, Guimarães, Portugal, 2011. [Google Scholar]
- Hadzima-Nyarko, M.; Ademović, N.; Pavić, G.; Šipoš, T.K. Strengthening techniques for masonry structures of cultural heritage according to recent Croatian provisions. Earthq. Struct. 2018, 15, 473–485. [Google Scholar] [CrossRef]
- Ademović, N.; Hadzima-Nyarko, M. Seismic Vulnerability, Damage and strengthening of masonry structures in the Balkans with a focus on Bosnia and Herzegovina. In Proceedings of the 16th European Conference on Earthquake Engineering, Thessaloniki, Greece, 18–21 June 2018; pp. 1–12. [Google Scholar]
- Farooq, S.H.; Shahid, I.; Ilyas, M. Seismic performance of masonry strengthened with steel strips. KSCE J. Civ. Eng. 2014, 18, 2170–2180. [Google Scholar] [CrossRef]
- Wu, H.; Zhao, S.C.; Xu, H. Seismic strengthening of masonry school building with steel mesh mortar splint. Appl. Mech. Mater. 2013, 351, 382–385. [Google Scholar] [CrossRef]
- Ademović, N.; Hrasnica, M.; Oliveira, D.V. Pushover analysis and damage assessment of a typical masonry residential building in Bosnia and Herzegovina. Eng. Struct. 2013, 50, 13–29. [Google Scholar] [CrossRef]
- Sathiparan, N. Mesh type seismic retrofitting for masonry structures: Critical issues and possible strategies. Eur. J. Environ. Civ. Eng. 2015, 19, 1136–1154. [Google Scholar] [CrossRef]
- Papanicolaou, C.; Triantafillou, T.; Lekka, M. Externally bonded grids as strengthening and seismic retrofitting materials of masonry panels. Constr. Build. Mater. 2011, 25, 504–514. [Google Scholar] [CrossRef]
- Ademović, N.; Oliveira, D.V. Damage indicators for unreinforced masonry building walls subjected to seismic actions. Build. Mater. Struct. 2017, 60, 17–32. [Google Scholar] [CrossRef] [Green Version]
- Baloevil, G.; Radnil, J.; Grgil, N.; Mate, D. The application of a reinforced plaster mortar for seismic strengthening of masonry structures. Compos. Part B Eng. 2016, 93, 190–202. [Google Scholar] [CrossRef]
- Xu, L.; Zhang, S.; Hu, X.; Zhang, M. Seismic responses of masonry structures strengthened with FRP laminates: A shaking-table study. In Proceedings of the 15th World Conference on Earthquake Engineering, Lisbon, Portugal, 24–28 September 2012. [Google Scholar]
- Can, Ö. Investigation of seismic performance of in-plane aligned masonry panels strengthened with Carbon Fiber Reinforced Polymer. Constr. Build. Mater. 2018, 186, 854–862. [Google Scholar] [CrossRef]
- Al-Jaberi, Z.; Myers, J.J.; ElGawady, M.A. Pseudo-static cyclic loading comparison of reinforced masonry walls strengthened with FRCM or NSM FRP. Constr. Build. Mater. 2018, 167, 482–495. [Google Scholar] [CrossRef]
- Witzany, J.; Zigler, R.; Kroftová, K. Strengthening of compressed brick masonry walls with carbon composites. Constr. Build. Mater. 2016, 112, 1066–1079. [Google Scholar] [CrossRef]
- Fagone, M.; Ranocchiai, G. Experimental investigation on out-of-plane behavior of masonry panels strengthened with CFRP sheets. Compos. Part B Eng. 2018, 150, 14–26. [Google Scholar] [CrossRef]
- Santa-Maria, H.; Alcaino, P. Repair of in-plane shear damaged masonry walls with external FRP. Constr. Build. Mater. 2011, 25, 1172–1180. [Google Scholar] [CrossRef]
- Ademović, N.; Oliveira, D.V.; Lourenco, P.B. Seismic evaluation and strengthening of an existing masonry building in Sarajevo, B&H. Buildings 2019, 9, 30. [Google Scholar] [CrossRef]
- Valluzzi, M.; Tinazzi, D.; Modena, C. Shear behavior of masonry panels strengthened by FRP laminates. Construct. Build. Mater. 2002, 16, 409–416. [Google Scholar] [CrossRef]
- Cecchi, A.; Milani, G.; Tralli, A. In-plane loaded CFRP reinforced masonry walls: Mechanical characteristics by homogenisation procedures. Compos. Sci. Technol. 2004, 64, 2097–2112. [Google Scholar] [CrossRef]
- Aiello, M.; Sciolti, S. Bond analysis of masonry structures strengthened with CFRP sheets. Constr. Build. Mater. 2006, 20, 90–100. [Google Scholar] [CrossRef]
- Shabdin, M.; Zargaran, M.; Attari, N.K.A. Experimental diagonal tension (shear) test of Un-Reinforced Masonry (URM) walls strengthened with textile reinforced mortar (TRM). Constr. Build. Mater. 2018, 164, 704–715. [Google Scholar] [CrossRef]
- Papanicolaou, C.G.; Triantafillou, T.C.; Karlos, K.; Papathanasiou, M. Textile-reinforced mortar (TRM) versus FRP as strengthening material of URM walls: In-plane cyclic loading. Mater. Struct. 2007, 40, 1081–1097. [Google Scholar] [CrossRef]
- Bernat, E.; Gil, L.; Roca, P.; Escrig, C. Experimental and analytical study of TRM strengthened brickwork walls under eccentric compressive loading. Constr. Build. Mater. 2013, 44, 35–47. [Google Scholar] [CrossRef]
- Carozzi, F.G.; Milani, G.; Poggi, C. Mechanical properties and numerical modeling of fabric reinforced cementitious matrix (FRCM) systems for strengthening of masonry structures. Compos. Struct. 2014, 107, 711–725. [Google Scholar] [CrossRef]
- Wang, X.; Lam, C.C.; Iu, V.P. Comparison of different types of TRM composites for strengthening masonry panels. Constr. Build. Mater. 2019, 219, 184–194. [Google Scholar] [CrossRef]
- Ramaglia, G.; Lignola, G.P.; Balsamo, A.; Prota, A.; Manfredi, G. Seismic strengthening of masonry vaults with abutments using textile-reinforced mortar. J. Compos. Constr. 2016, 21, 04016079. [Google Scholar] [CrossRef]
- Indirli, M.; Kouris, L.A.S.; Formisano, A.; Borg, R.P.; Mazzolani, F.M. Seismic damage assessment of unreinforced masonry structures after the Abruzzo 2009 earthquake: The case study of the historical centers of L’Aquila and Castelvecchio Subequo. Int. J. Archit. Herit. 2013, 7, 536–578. [Google Scholar] [CrossRef]
- Betti, M.; Galano, L.; Petracchi, M.; Vignoli, A. Diagonal cracking shear strength of unreinforced masonry panels: A correction proposal of the b shape factor. Bull. Earthq. Eng. 2015, 13, 3151–3186. [Google Scholar] [CrossRef]
- Chinese Code GB/T 2542-2012. Test Methods for Wall Bricks; Standards Press of China: Beijing, China, 2012. [Google Scholar]
- JGJ/T 70-2009. Standard for Test Method of Performance on Building Mortar; China Architecture & Building Press: Beijing, China, 2009. [Google Scholar]
- JGJ/T 101-2015. Specification for Seismic Test Methods of Buildings; China Architecture & Building Press: Beijing, China, 2015. [Google Scholar]
Figure 1.
Dimensional details of masonry specimens (dimension in mm).
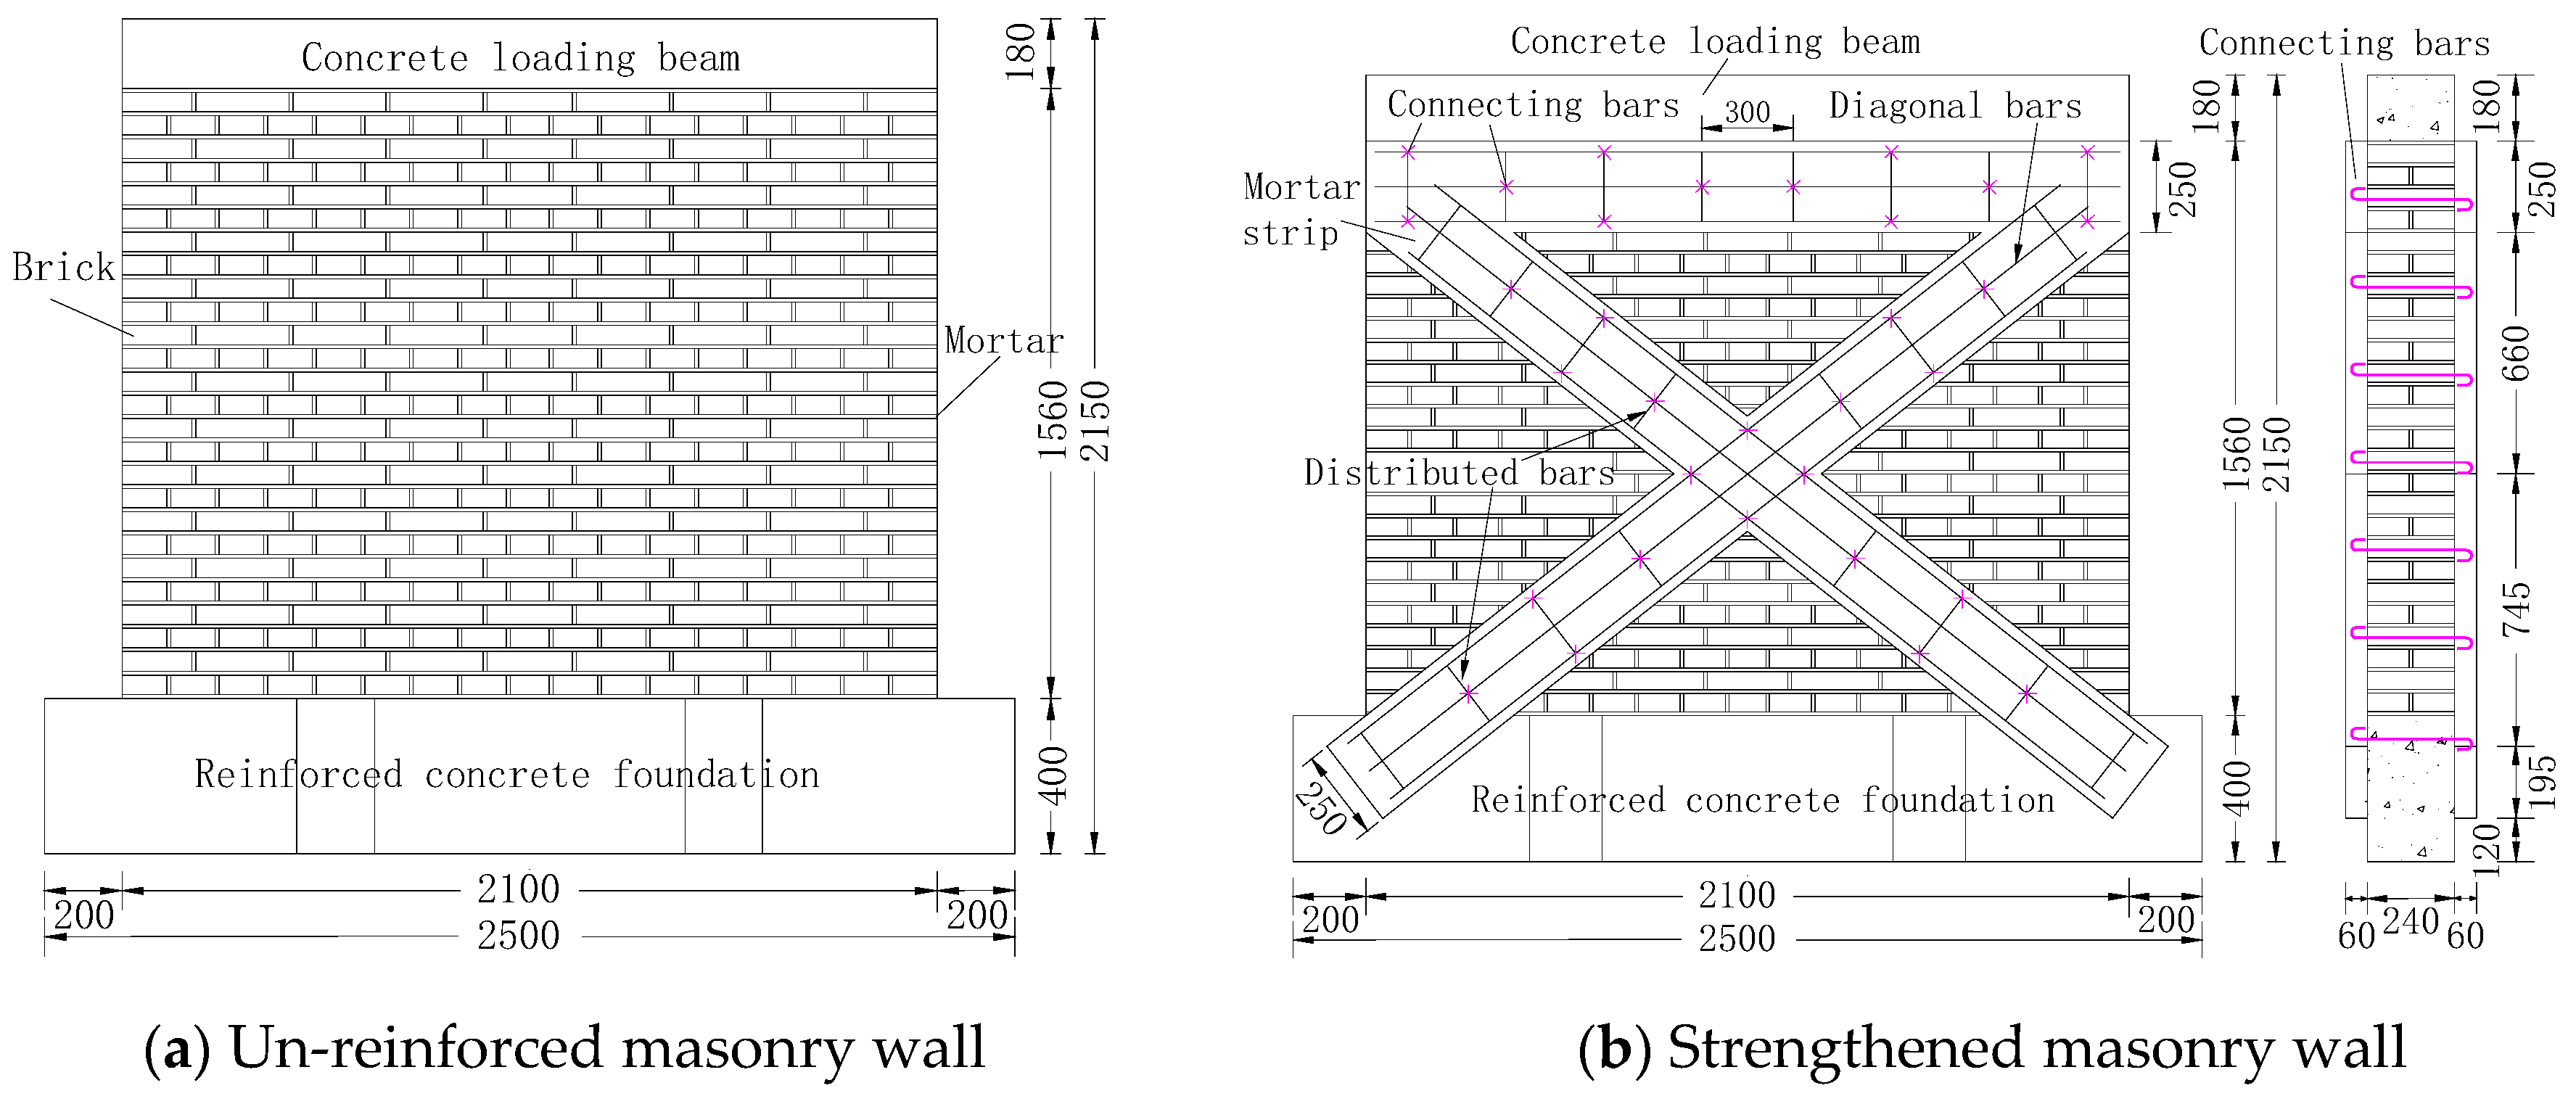
Figure 2.
Reinforcement construction process.

Figure 3.
Four-bar loading device.

Figure 4.
Experimental loading mode.
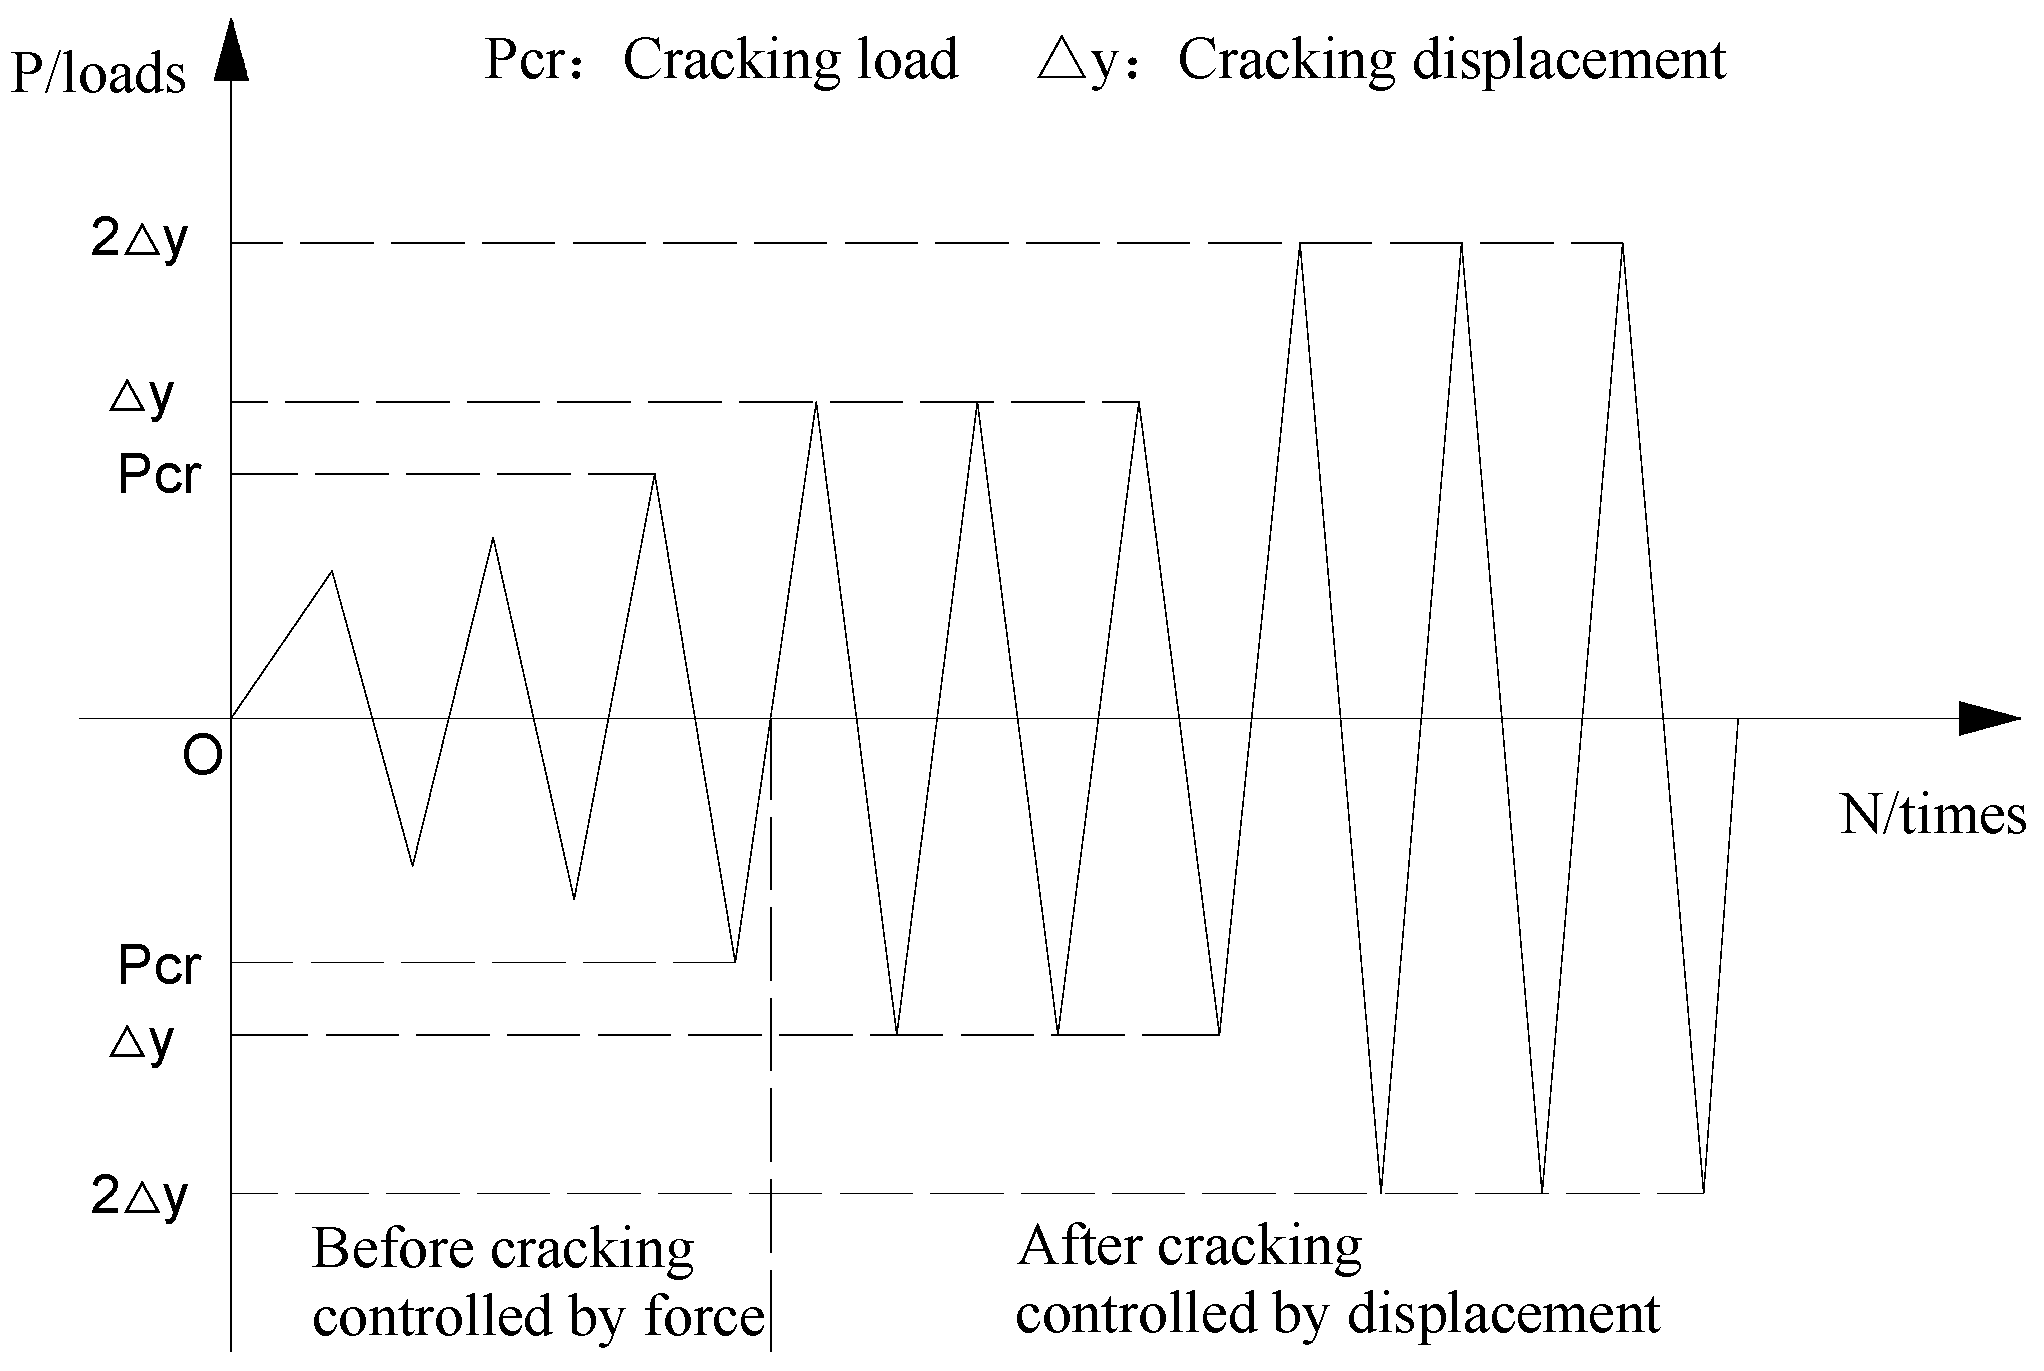
Figure 5.
Sensors and stress gauges position.

Figure 6.
The crack distribution of un-reinforced masonry walls at the ending of tests.

Figure 7.
The crack distribution of strengthened masonry walls W1–W4 at the ending of tests.
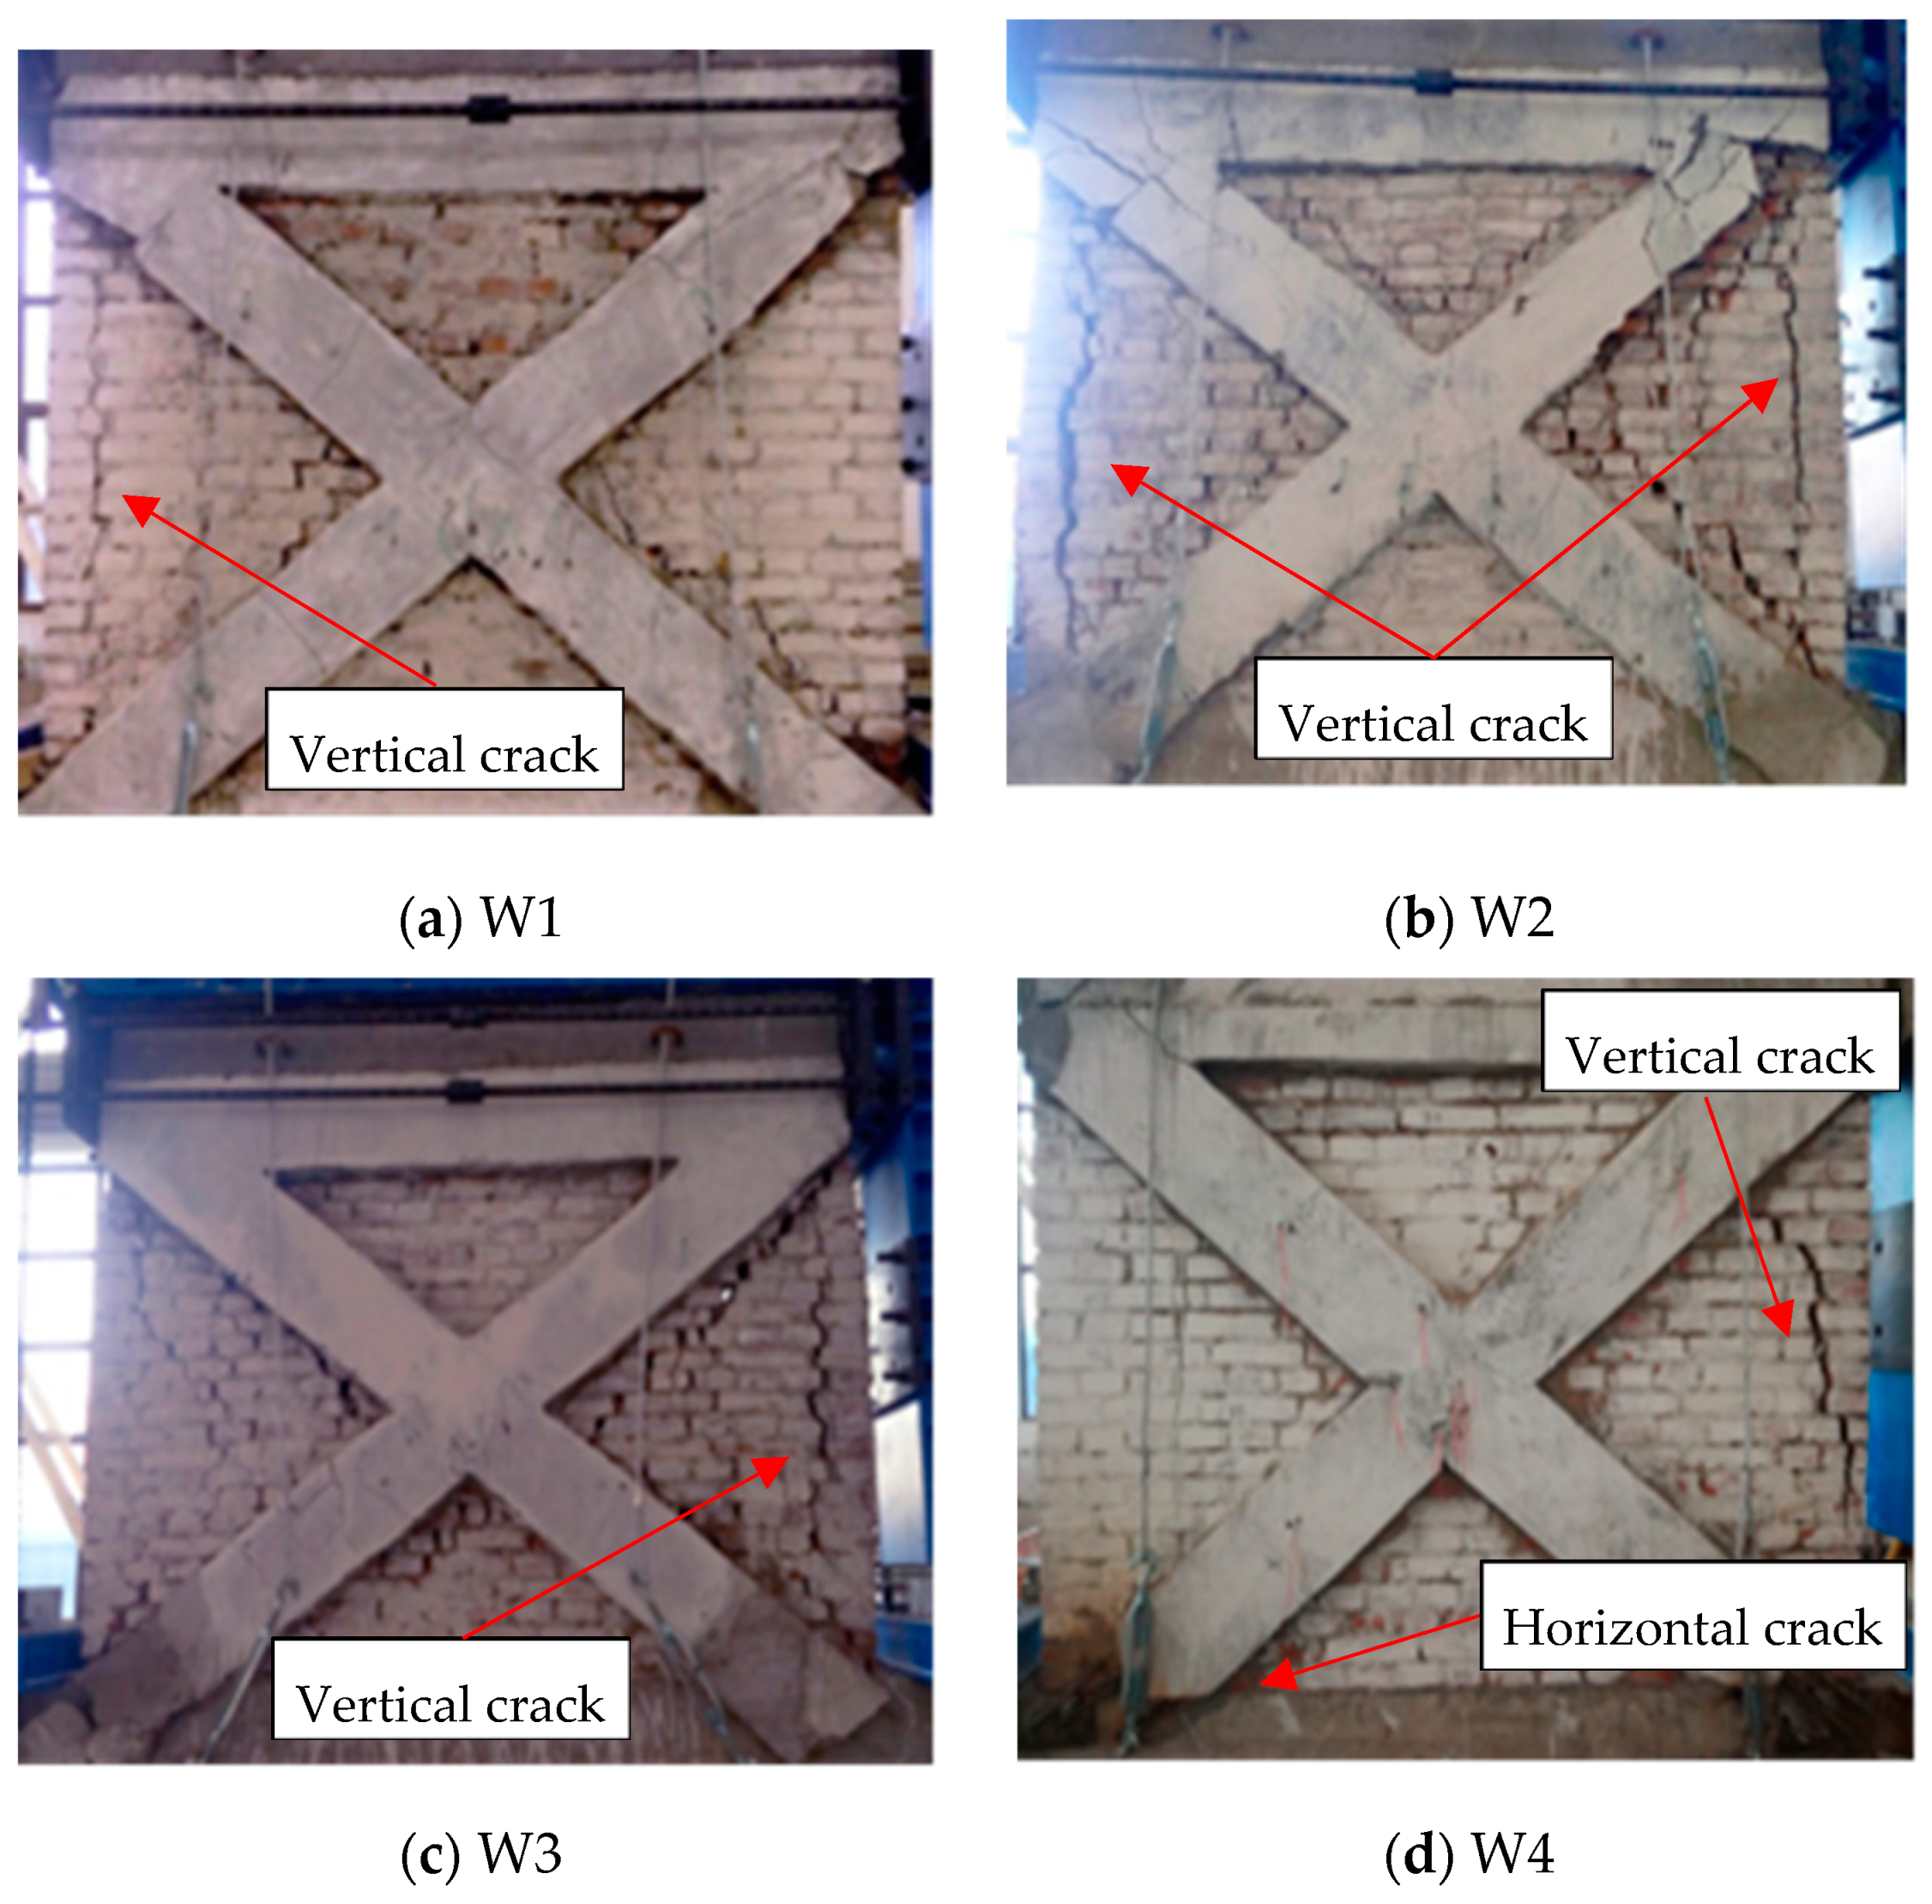
Figure 8.
The crack distribution of strengthened masonry walls W5–W8 at the ending of tests.
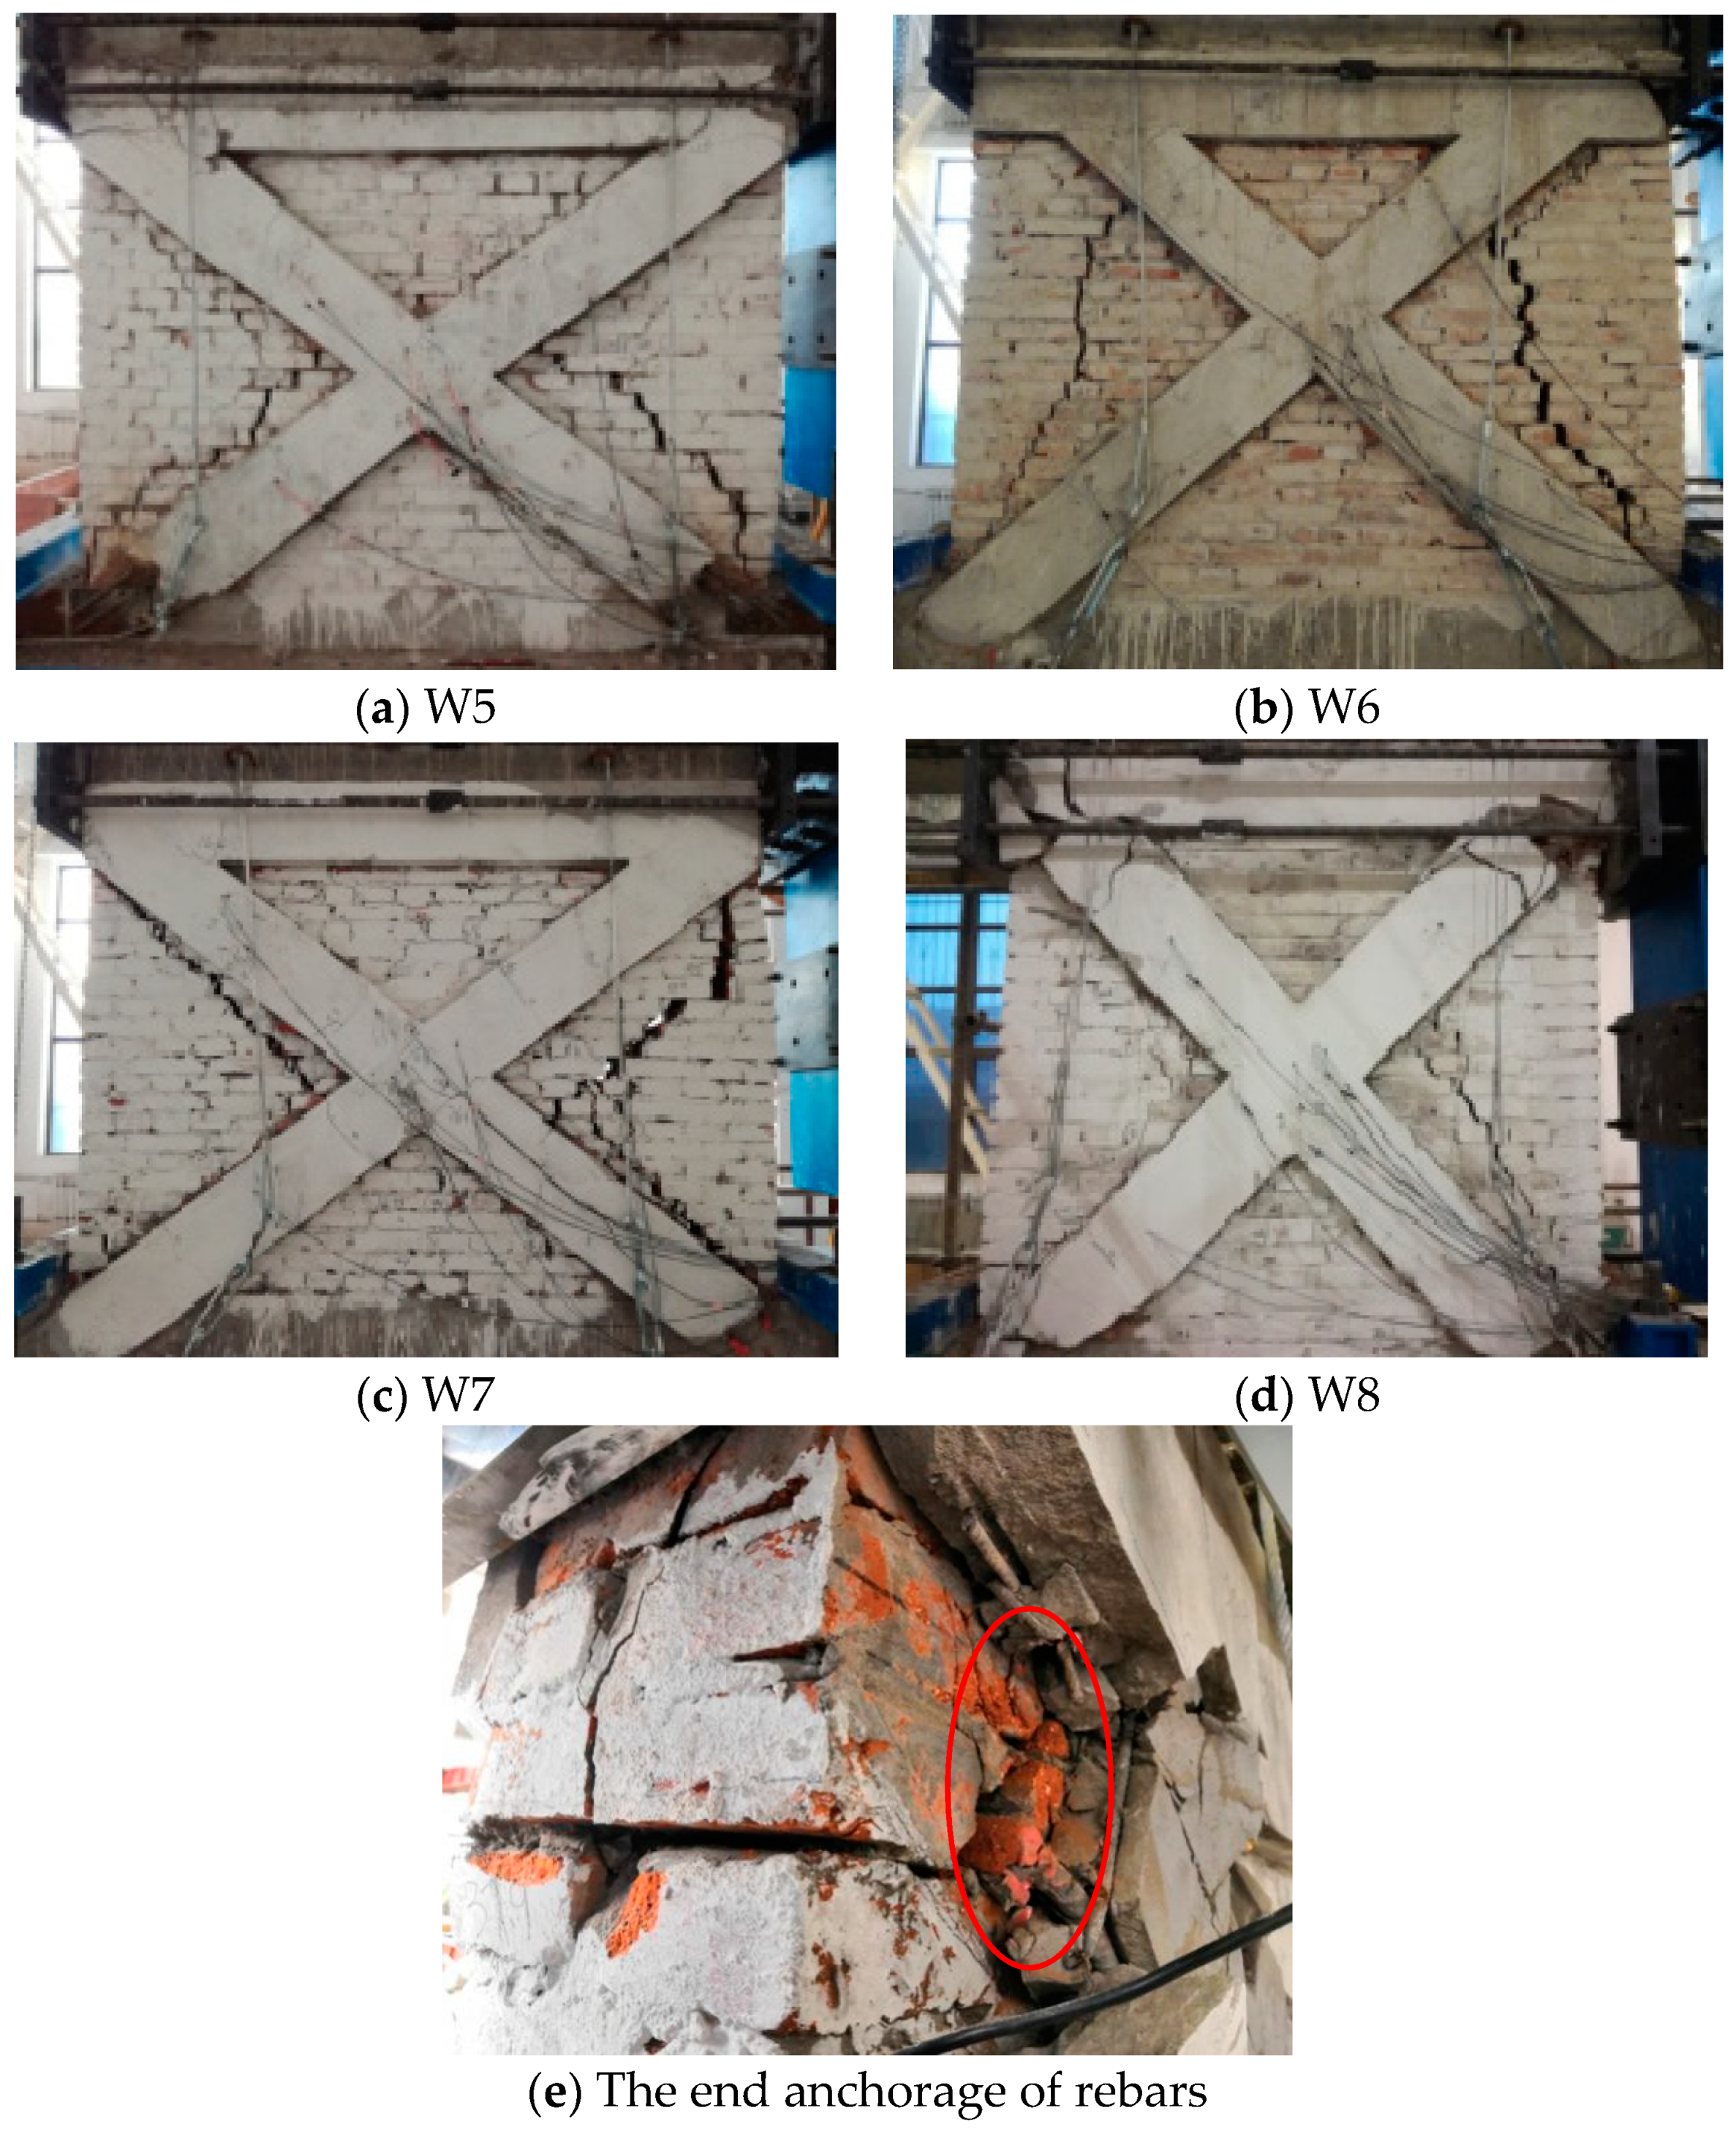
Figure 9.
Hysteresis curves of partly specimens.
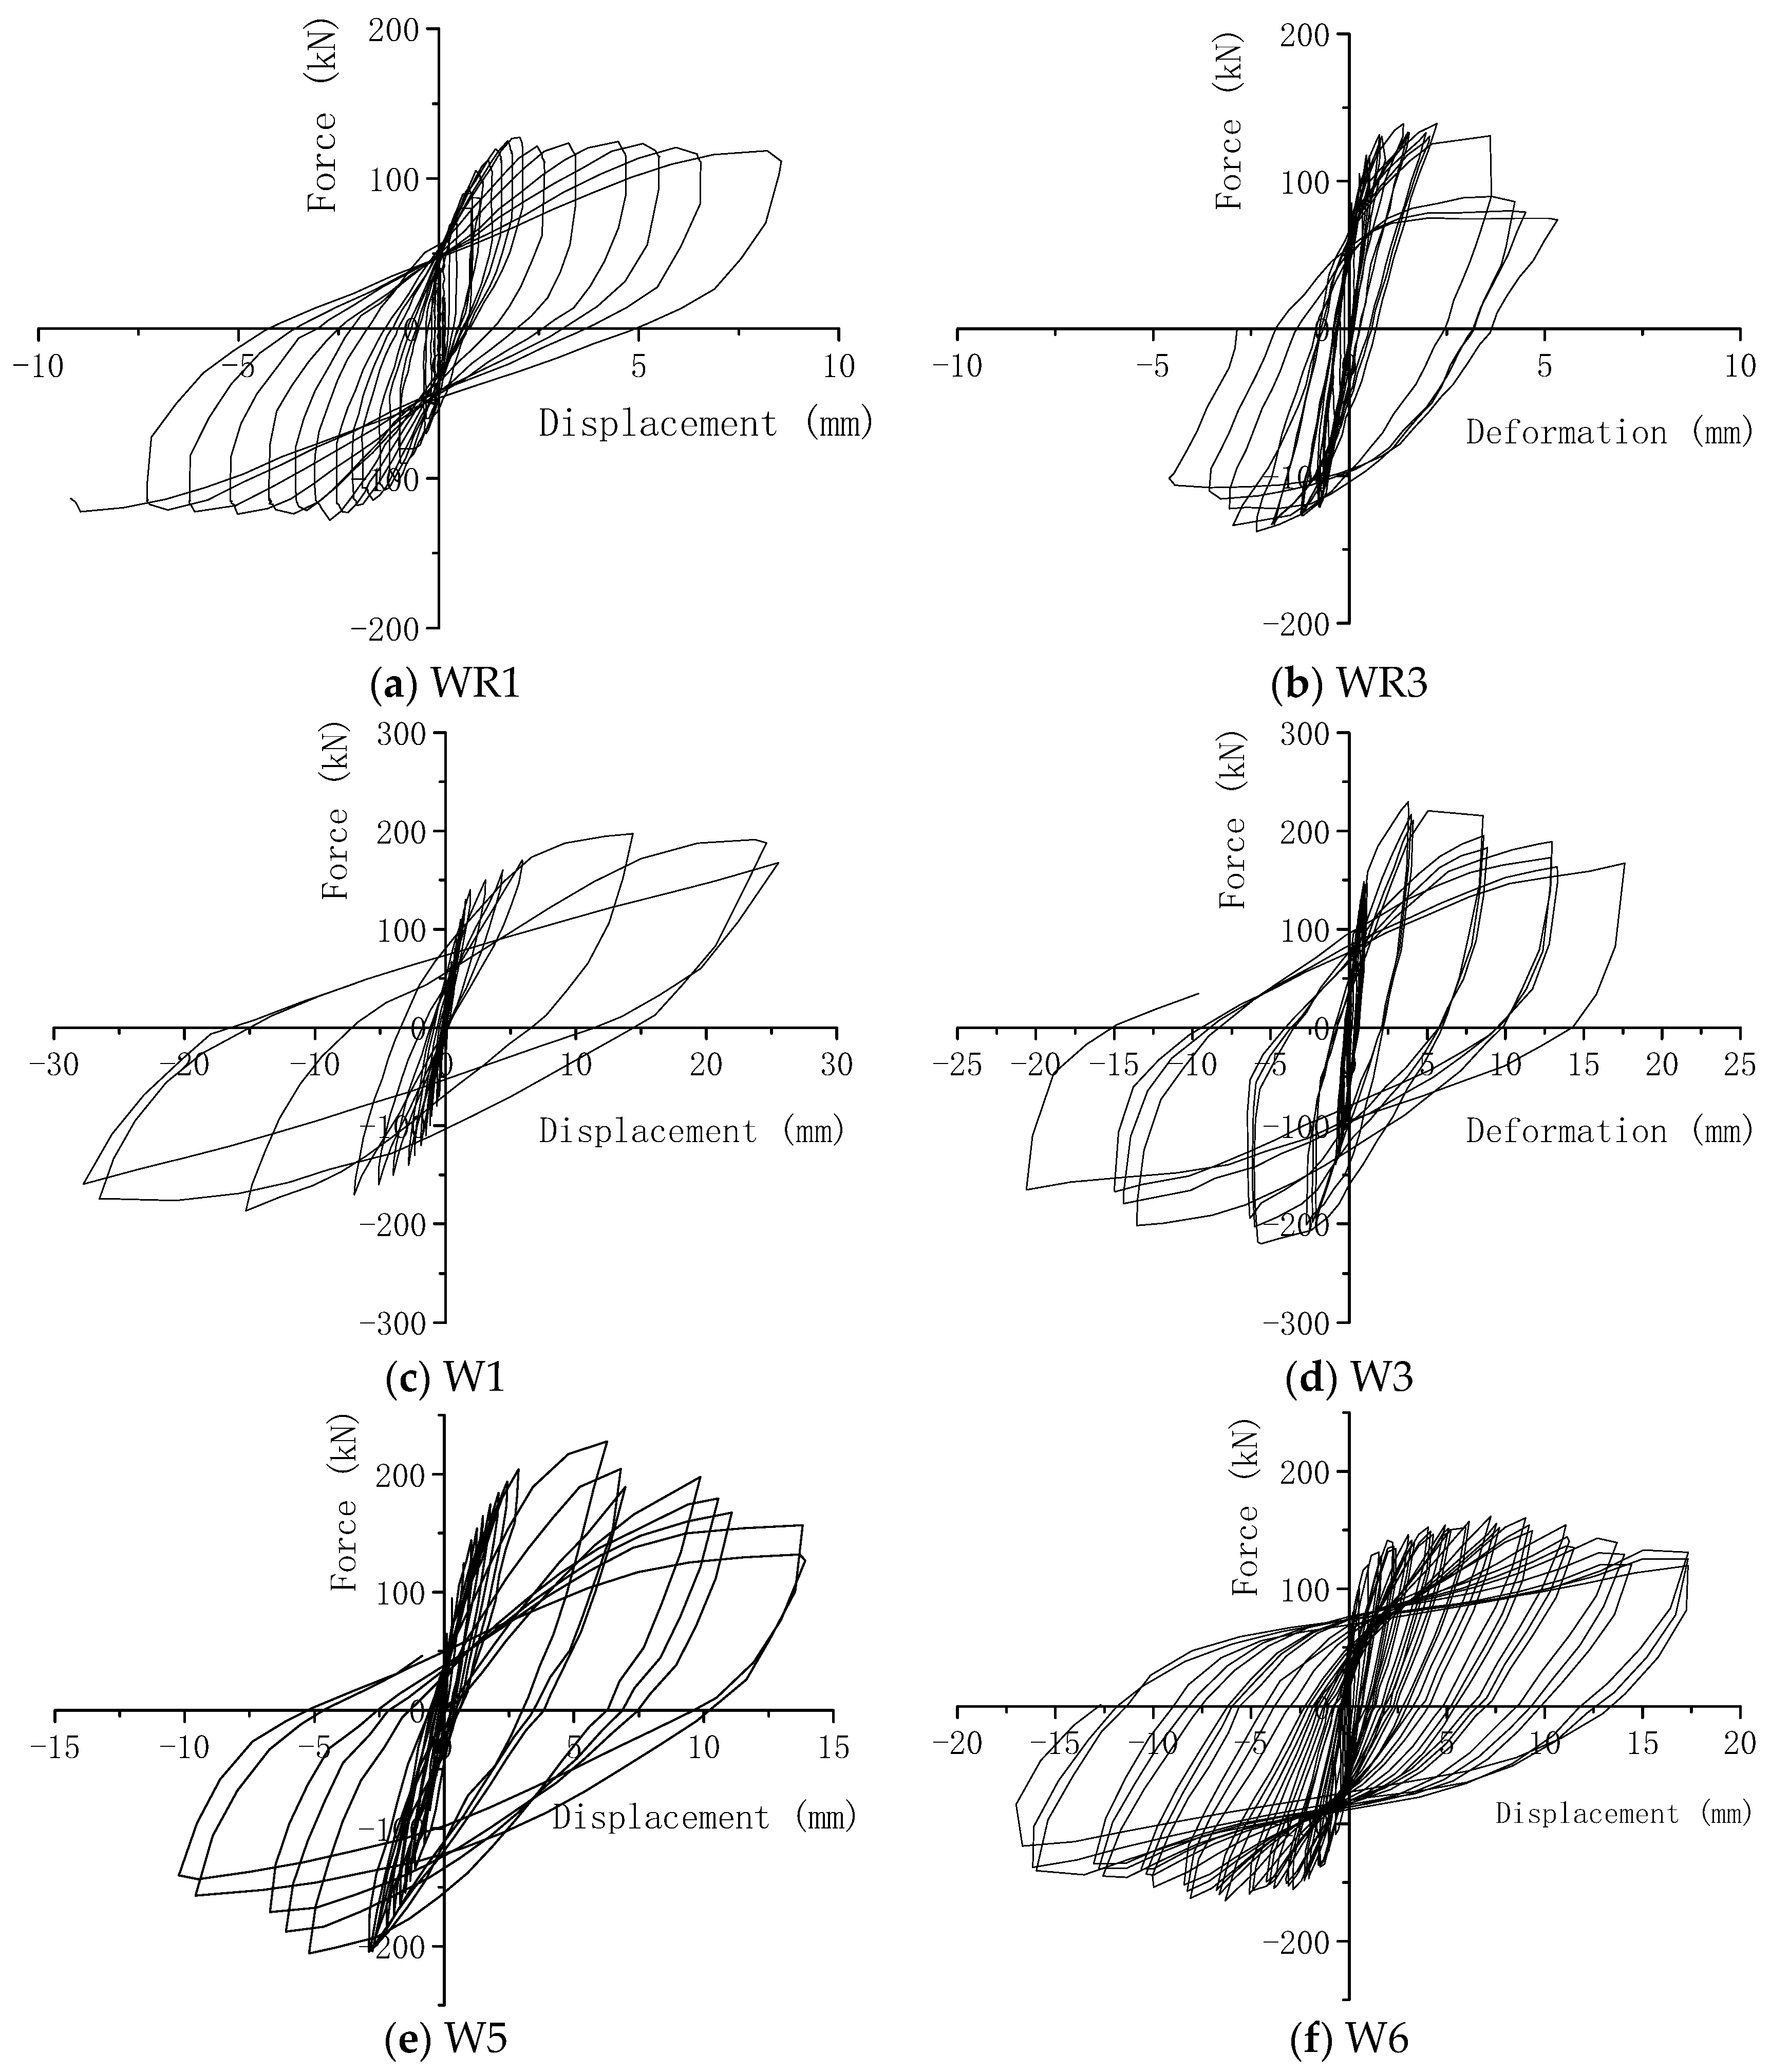
Figure 10.
The skeleton curves of specimens.
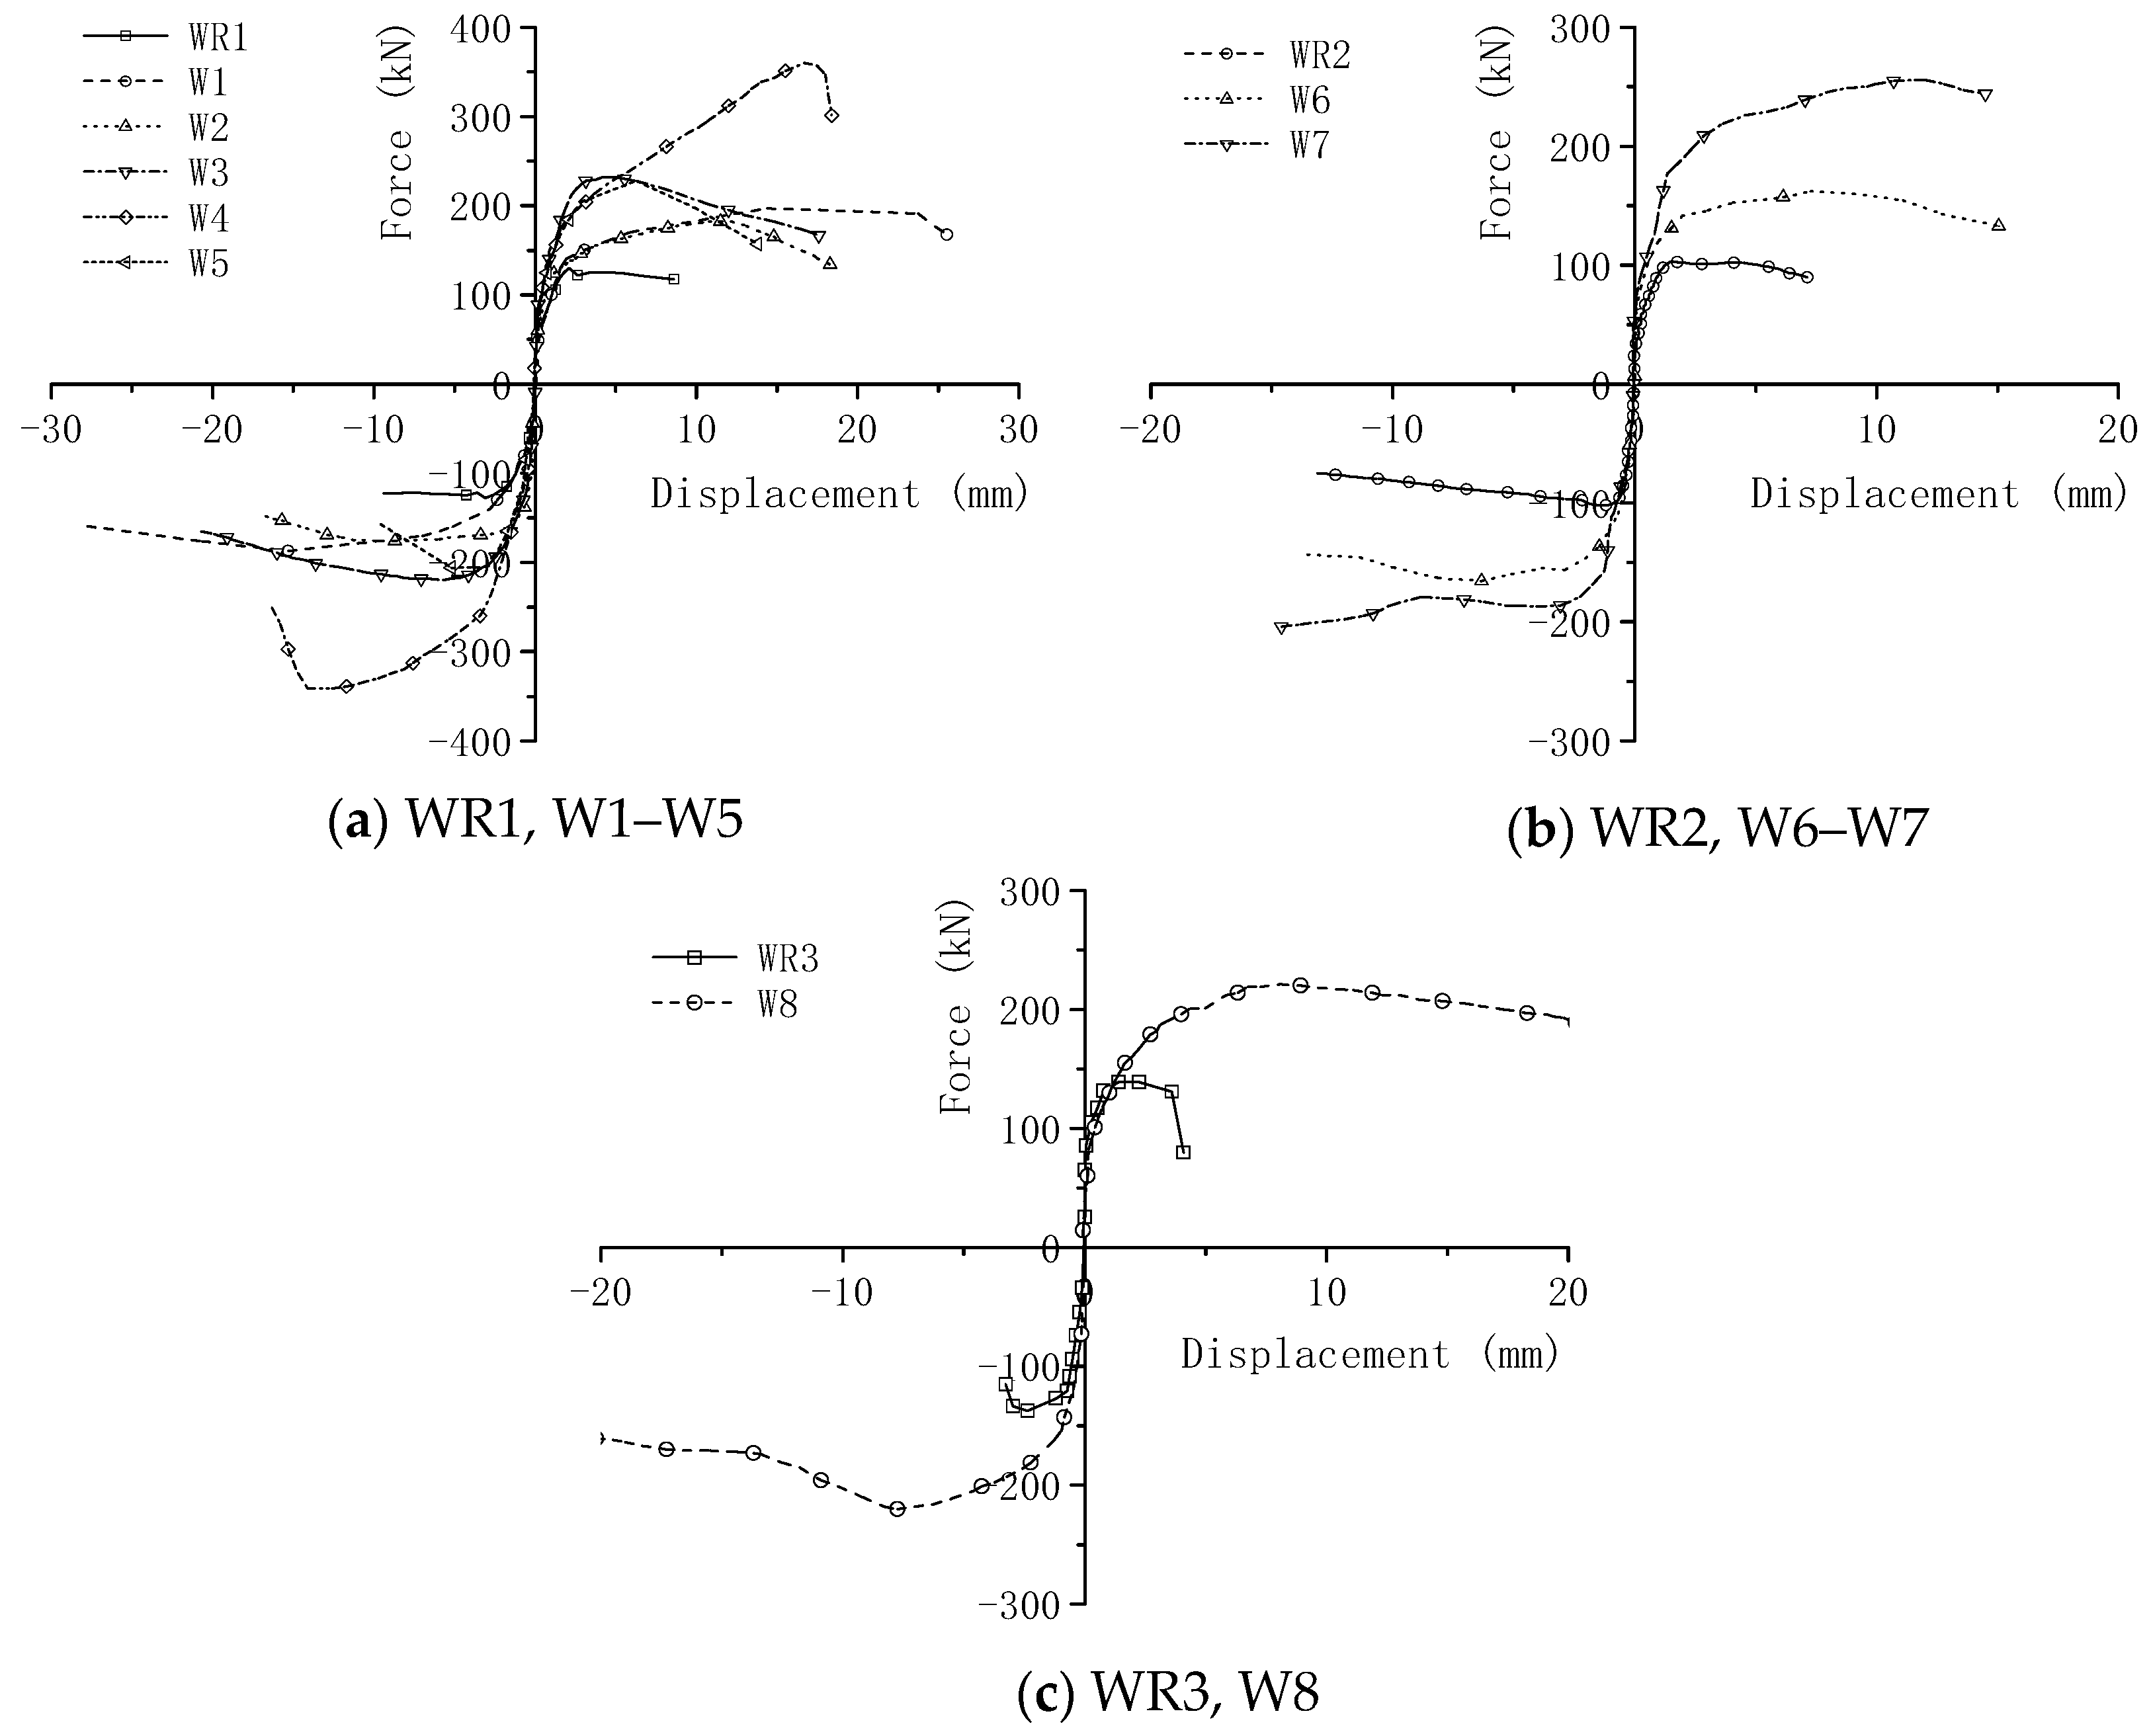
Figure 11.
Stiffness degradation curves.


Table 1.
The strengthening details of the specimens.
| Specimen | Mortar Grade | Strip Thickness (mm) | Diameter of Steel Bars (mm) | Vertical Stress Level (MPa) | Reinforcement Types | |
|---|---|---|---|---|---|---|
| Masonry | Strip | |||||
| WR1 | M1 | — | — | — | 0.516 | — |
| WR2 | M2.5 | — | — | — | 0.21 | — |
| WR3 | M10 | — | — | — | 0.4 | — |
| W1 | M1 | M2.5 | 40 | 8 | 0.516 | Double-faced |
| W2 | M1 | M2.5 | 40 | 10 | 0.516 | Single-faced |
| W3 | M1 | M2.5 | 60 | 10 | 0.516 | Double-faced |
| W4 | M2.5 | M5 | 60 | 12 | 0.516 | Double-faced |
| W5 | M2.5 | M5 | 60 | 12 | 0.516 | Single-faced |
| W6 | M2.5 | M10 | 40 | 6 | 0.21 | Double-faced |
| W7 | M2.5 | M10 | 40 | 10 | 0.4 | Double-faced |
| W8 | M10 | M10 | 40 | 10 | 0.4 | Double-faced |
Table 2.
Material strengths.
| Sample | Type | Compressive Strength | Yield Strength |
|---|---|---|---|
| Brick | MU10 | 9.11 | — |
| Mortar | M1 | 0.92 | — |
| M2.5 | 2.47 | — | |
| M5 | 7.33 | — | |
| M10 | 10.97 | — | |
| Bars | D6 | — | 483 |
| D8 | — | 505 | |
| D10 | — | 512 | |
| D12 | — | 445 |
Table 3.
Test results: load and stress.
| Specimen | Cracking Load/kN | Peak Load/kN | Tension Stress | Ref. wall | Cracking Load Improvement | Peak Load Improvement |
|---|---|---|---|---|---|---|
| WR1 | 98.7 | 128.9 | WR2 | -0.7% | 26.9% | |
| WR2 | 99.4 | 101.6 | — | — | — | |
| WR3 | 133.0 | 138.4 | — | — | — | |
| W1 | 140.2 | 192.1 | 130.8 | WR1 | 42.0% | 49.0% |
| W2 | 129.2 | 178.5 | 190.6 | WR1 | 31.0% | 38.5% |
| W3 | 139.5 | 224.9 | 133.4 | W2 | 8.0% | 26.0% |
| W4 | 189.3 | 348.9 | 187.2 | W5 | 18.6% | 60.8% |
| W5 | 159.6 | 217.0 | 133.8 | — | — | — |
| W6 | 119.4 | 167.6 | 345.4 | WR2 | 20.1% | 65.0% |
| W7 | 173.1 | 230.1 | 273.2 | W8 | −1.9% | 5.1% |
| W8 | 176.5 | 218.9 | 168.4 | WR3 | 32.7% | 58.2% |
Table 4.
Ductility coefficient and stiffness coefficient.
| Specimen | Δcr /mm | Δu /mm | μ | K0 /(kN/mm) | Kcr /(kN/mm) | Ku /(kN/mm) | βcr | βu |
|---|---|---|---|---|---|---|---|---|
| WR1 | 1.13 | 2.61 | 2.30 | 166.50 | 87.12 | 49.49 | 0.52 | 0.30 |
| WR2 | 1.02 | 1.63 | 1.59 | 150.30 | 97.22 | 62.53 | 0.65 | 0.42 |
| WR3 | 1.30 | 2.31 | 1.78 | 182.78 | 102.70 | 52.26 | 0.56 | 0.29 |
| W1 | 2.34 | 14.85 | 6.34 | 145.75 | 60.04 | 12.98 | 0.41 | 0.09 |
| W2 | 1.04 | 11.12 | 10.75 | 167.77 | 124.85 | 16.05 | 0.74 | 0.10 |
| W3 | 0.89 | 4.70 | 5.28 | 160.86 | 156.71 | 66.27 | 0.97 | 0.41 |
| W4 | 2.14 | 15.78 | 7.39 | 192.31 | 88.64 | 22.12 | 0.46 | 0.12 |
| W5 | 1.53 | 5.58 | 3.65 | 163.92 | 104.43 | 48.49 | 0.64 | 0.30 |
| W6 | 0.82 | 6.90 | 8.29 | 186.63 | 143.42 | 24.30 | 0.77 | 0.13 |
| W7 | 1.59 | 13.33 | 8.40 | 199.00 | 137.52 | 19.76 | 0.69 | 0.10 |
| W8 | 2.33 | 8.56 | 3.68 | 281.50 | 75.90 | 25.59 | 0.27 | 0.09 |
© 2019 by the authors. Licensee MDPI, Basel, Switzerland. This article is an open access article distributed under the terms and conditions of the Creative Commons Attribution (CC BY) license (http://creativecommons.org/licenses/by/4.0/).
Share and Cite
MDPI and ACS Style
Dong, K.; Sui, Z.-a.; Jiang, J.; Zhou, X. Experimental Study on Seismic Behavior of Masonry Walls Strengthened by Reinforced Mortar Cross Strips. Sustainability 2019, 11, 4866. https://doi.org/10.3390/su11184866
AMA Style
Dong K, Sui Z-a, Jiang J, Zhou X. Experimental Study on Seismic Behavior of Masonry Walls Strengthened by Reinforced Mortar Cross Strips. Sustainability. 2019; 11(18):4866. https://doi.org/10.3390/su11184866
Chicago/Turabian StyleDong, Kun, Zheng-ang Sui, Jitong Jiang, and Xianxiang Zhou. 2019. "Experimental Study on Seismic Behavior of Masonry Walls Strengthened by Reinforced Mortar Cross Strips" Sustainability 11, no. 18: 4866. https://doi.org/10.3390/su11184866
Note that from the first issue of 2016, this journal uses article numbers instead of page numbers. See further details here.