Article

Corporate Social Responsibility, Corporate Governance and Business Performance: Limits and Challenges Imposed by the Implementation of Directive 2013/34/EU in Romania

by
Cristina Raluca Gh. Popescu
1,2,3,4
1
Faculty of Economics and Business Administration, University of Craiova, 200396 Craiova, Dolj, Romania
2
Faculty of Economics, The Bucharest University of Economic Studies, 010374 Bucharest, Romania
3
Faculty of Business and Administration, Department of Economic and Administrative Sciences, University of Bucharest, 030018 Bucharest, Romania
4
The Department of Natural and Technological Hazards, National Institute of Research and Development for Environmental Protection (I.N.C.D.P.M.), 060031 Bucharest, Romania
Sustainability 2019, 11(19), 5146; https://doi.org/10.3390/su11195146
Submission received: 7 August 2019 / Revised: 4 September 2019 / Accepted: 13 September 2019 / Published: 20 September 2019

Abstract

:
In order to identify the factors that have influenced the Romanian companies’ level of compliance required by the Directive 2013/34/EU with respect to publishing, alongside the annual financial statements for 2017, a report containing non-financial information regarding environmental, social, and personal aspects, and business ethics, the following steps were taken in our groundbreaking study: firstly, we analyzed whether there are statistical associations between the level of compliance and the legal forms of organization, the forms of ownership of capital, the branch of activity, the number of employees, the turnover, and the company location; secondly, we evaluated the meaning and intensity of these associations with the help of non-parametric correlation coefficients; thirdly, we identified and presented the economic and social causes of the results obtained; and fourthly, we proposed measures that can contribute to increasing the degree of compliance. What is more, this rigorous scientific work highlights the need to enhance corporate governance and corporate social responsibility in order to create an appropriate balance between sustainability, competitiveness, productivity, and businesses’ financial and non-financial performance, while taking into consideration the benefits brought by the tangible value of businesses (such as, cash flow and earnings) as well as the intangible value of businesses (such as, brand, customer experience, intellectual capital, organizational culture and reputation).

1. Introduction

These days, for the great majority of people living in and promoting a highly ethical and socially conscious business environment represents a must. Under these circumstances, renowned specialists all around the world call attention, on the one hand, to corporate governance (CG)—one of the most prominent collections of mechanisms and principles by which entities are controlled and managed, and, on the other hand, to corporate social responsibility (CSR)—one of the most striking topics associated with building inclusive and robust socially responsible business models and strategies. In the same manner, reputed political and governmental figures keen on enhancing global diversity, equity and inclusion, place a premium on the programs that prioritize the inclusion and expansion of CG and CSR codes, guidelines, principles, regulations and rules at a globalized level.
A problem that is often debated nowadays is that of CG and CSR influences on competitiveness, productivity and financial and non-financial performance, which prompted us to investigate the implications of Directive 2013/34/EU of the European Parliament and of the Council of 26 June 2013 on the annual financial statements, consolidated financial statements and related reports of certain types of undertakings, amending Directive 2006/43/EC of the European Parliament and of the Council and repealing Council Directives 78/660/EEC and 83/349/EEC [1].
The implementation of the Directive 2013/34/EU in Romania was achieved by Order no. 1938/2016 from 17 August 2016 on the modification and completion of some accounting regulations [2], which requested, as based on the economic-financial data from 2017, reported in 2018, the Administrators’ Reports for public-interest entities that, on the date on the balance sheet, they had an average number of over 500 employees and included a non-financial statement containing at least information on environmental, social and personnel issues, respecting human rights, combating corruption and giving bribes. In our study [3] we calculated the overall extended degree of compliance at the level of Romania of 62.60% and presented the distribution of the level of this indicator at regional and structural level (by owner—capital structure, by legal form, by nature of activity, by number of employees, by organizational structure and management and by turnover). The analysis of its distributions at regional and structural level confirms the dependence of the compliance indicator but also of other performance indicators on: company size [4,5,6]; capital structure [7,8,9,10]; turnover [11,12,13,14,15]; organizational and management structure [16,17,18,19,20,21,22,23].
Through the current study, we will extend the previous research, in order to determine the factors that can influence the size of the degree of compliance and to identify the main measures that will contribute to its growth. Given that the available data are for a single year, and the main data analyzed represent a dichotomous classification (1-“reported”, 2-“not reported”), the statistical and econometric techniques that can be used, although they are limited [24], prove to be conclusive.
This research enriches the current debate on the Directive and highlights new possibilities for empirical research, by extending the evaluation of the relationships between variables with the help of nonparametric correlation coefficients, and, in addition, making an important contribution to enriching the literature in two ways.
First, most of the studies focused on the level or quality of the compliance level through the limited analysis of either the listed companies [25,26,27], or the largest ones in the top 50 [28], or only on specific branches of e-credit [29] or oil and gas producers [28]. The present study carries out a unitary and comprehensive analysis of the economy of a country.
Second, most of the studies were conducted in economically developed European countries [29,30,31]. In other emerging or developing countries, many organizational, cultural or legislative factors may influence and may have different perspectives and expectations regarding social and environmental protection issues [32,33,34,35,36,37,38]. In the approach taken, the focus is on Romania, which has experienced the biggest economic dynamics in Europe in recent years, a country that is trying to find its way in the complex process of European integration.
The remaining of the study was organized as follows: Section 2 presents the literature review and the research hypotheses; Section 3 explains the methodology; Section 4 presents the results and, finally, Section 5 presents the conclusion.

2. Review of the Specialized Literature and Research Hypotheses

In the history of economics, even though the countries’ business background, environment, management and strategies tend to vary dramatically from one moment to another—especially on the medium or long run, when addressing and targeting both domestic and international economic growth it seems that advancing sustainability became a key issue along with the focus on improving the countries’ business, economic, education, fiscal, health, market and social conditions [39,40,41,42,43,44,45,46]. Thus, in the new “modern” global economy, environmental protection plays an important role in the daily lives of individuals, managers, professionals, organizations, societies, countries, country leaders, politicians and governments, since its main focuses concern, on the one hand, the conservation of the planet’s natural resources as well as existing and endangered habitat, and, on the other hand, the reparation and restoration of the already degraded, damaged and altered natural surroundings [47]. In the light of the general framework previously emphasized, both avoiding resistance to change and adapting to the needs of all Earth’s living species (biodiversity), became, in our opinion, crucial for organizations’ worldwide, in their struggle to embrace properly all the ethical and integrity rules, regulations, policies and standards in business [48].
What is more, both social responsibility (SR) and corporate social responsibility (CSR)—referred to by specialists as major constituents of ethical (business) theories, came to distinguish themselves lately as important components in promoting a strong balance in the climate system as a whole, by playing key roles in sustainability maintenance, ensuring: (a) a healthy and transparent business environment, imposed by the need to encourage the existence of blooming, vigorous and robust societies; (b) a competitive, yet responsible and challenging business management; and (c) accountability in seeking, instilling and obtaining business performance for organizations all around the globe [49,50,51,52,53,54]. It should be noted that investigating SR is a continuing concern within the ethical theories, since SR highlights the fact that all individuals’ actions must be fair and bring specific benefits to our society, thus all people being accountable for their activities as well as responsible for creating the most desired equilibrium between competitiveness, sustainable development, economic growth, prosperity, “green” profits and performance, longevity for the current and upcoming generations and environment [55,56,57,58]. In the same time, it should be pointed out that businesses themselves have created and developed their own concept and system of SR, which was especially tailored to the organizational needs, requirements and environment, being known in the specialty literature as CSR [59,60,61].
In March 2000, the European Council in Lisbon made “a special appeal to companies’ corporate sense of social responsibility regarding best practices on lifelong learning, work organization, equal opportunities, social inclusion and sustainable development”, stressing, in this particular manner, the fact that all the European Union’s organizations are oriented on macroeconomic stability, positive strategies capable to combine successfully competitiveness and social cohesion, showing an increased interest in the well-being of individuals and the protection of the environment in the same time [62].
Starting with 2001, the concept of CSR became a major area of interest for the European Commission members, in their continuous struggle to infuse and to support both ethics and integrity at the business levels, which meant that CSR has been suggestively defined at that time as “a concept whereby companies integrate social and environmental concerns in their business operations and in their interaction with their stakeholders on a voluntary basis” [58] (p. 7). Additionally, starting from that moment on, numerous questions have been raised by researchers and specialists about the significance, role and implications of CSR in the knowledge-based economy, since “being socially responsible means not only fulfilling legal expectations, but also going beyond compliance and investing “more” into human capital, the environment and the relations with stakeholders” [58] (p. 8). In continuation, one of the most significant statements addressing the defining aspects centered on the debates on CSR argues that “the experience with investment in environmentally responsible technologies and business practice suggests that going beyond legal compliance can contribute to a company’s competitiveness”, which implies that “going beyond basic legal obligations in the social area, e.g. training, working conditions, management-employee relations, can also have a direct impact on productivity”, facilitating, in this way, entities’ ability of “managing change” and “reconciling social development with improved competitiveness” [58] (p. 8). However, despite its expected efficacy and success at all levels – namely, in audit, accounting, economics, economic and financial analysis, finance, information and technology, management, marketing, CSR “should nevertheless not be seen as a substitute to regulation or legislation concerning social rights or environmental standards, including the development of new appropriate legislation” [58] (p. 8). Also, along with these precious specifications, “in countries where such regulations do not exist, efforts should focus on putting the proper regulatory or legislative framework in place in order to define a level playing field on the basis of which socially responsible practices can be developed” [58] (p. 8).
The elaborated, inclusive and integrated purposes of CSR have been the subject of intense debate when re-launching the Lisbon Strategy in 2005, which prompted the European Commission to bring into discussion the fact that CSR “can play a key role in contributing to sustainable development while enhancing Europe’s innovative potential and competitiveness” [63] (p. 4), especially in a critical moment in which the entire community strongly promotes “improving welfare and living conditions in a sustainable way for present and future generations” [63] (p. 26).
One major theoretical as well as practical issue that has dominated the economic field for many years, concerns the impact of European Union’s policies on competitiveness. In the context in which globalization has induced serious changes and shifts in businesses structure and dynamics and also based on the argument that “openness in terms of trade or foreign direct investment (FDI) benefits the economy”, specialists around the globe found themselves in the position of searching for new indicators and fresh methods capable to shed a new light on economic productivity and economic performance [64] (p. 5). In addition, having in mind that the benefits that CSR brings into the business world “cannot be overestimated, not least since one lesson from the current financial crisis is that socially responsible entrepreneurs and CEOs are of utmost importance for the wellbeing of our societies”, extensive research has been carried out on the characteristics, effects, functions, importance and role of CSR, providing substantial evidence that “CSR has a positive impact on firms’ competitiveness”, as follows: “An overview of the effects of CSR on six different determinants of competiveness at firm level—cost structure, human resources, customer perspective, innovation, risk and reputation management, and financial performance—shows that it can have a positive impact on competitiveness” [64] (p. 9).
Nonetheless, when carefully and thoroughly examining the improvements brought by promoting CSR in the business environment, the following decisive results were obtained:
  • First of all, “the strongest evidence of a positive impact of CSR on competitiveness appears to be in the cases of human resources, risk and reputation management and innovation”, which pinpoints the fact that CSR encourages diversity, mutual acceptance and tolerance, respect for nature, a balanced business environment, human labor and human rights, correctness and transparency at the places of work, and constructive innovations keen on addressing and supporting today’s societal problems [64] (p. 9).
  • Second of all, “the reputation of a company in terms of CSR becomes increasingly important for the chances to be successful in recruiting staff on highly competitive labor markets”, which leads to the powerful belief that “CSR is an essential component of risk and reputation management for many companies, and becomes increasingly important as enterprises are exposed to greater public scrutiny” [64] (p. 9).
  • Third of all, “for an increasing number of enterprises in a growing number of industries, CSR is becoming a competitive necessity” as well as “a competitive differentiator”, standing at the very core of innovative, forward-looking, ground-breaking and original business strategies, which determines, in turn, the emergence of new business values [64] (p. 9).
On top of that, the Commission of the European Communities has proven, on a continuous basis, a great interest in establishing and displaying the links that exist between CSR and competitiveness, for the simple reason that “the concept of competitiveness can be applied at different levels, from the firm (micro) level, to the sectorial, regional and national (macro) level”, on the one hand expressing “a sustained rise in the standards of living”, when addressing the macroeconomic level, and, on the other hand, referring “to the performance of a given industry in a given country” and the “capacity to grow, to innovate and to produce more and higher-quality goods and services, and to keep or gain market shares in international and domestic markets”, when focusing on the macroeconomic level [65] (p. 137). Apart from this, since the changes experienced by our society over the past twenty years remain unprecedented, there is a tremendous interest in accurately measuring competitiveness. The paramount desire and acute need to measure competitiveness at an entity’s level has driven specialists to discover specific tools capable to illustrate the organization’s results over certain periods of time, taking into account, for instance, the “indicators of financial performance, such as the development of sales, profits, and costs, as well as stock performance”, or the firm’s capacity to innovate, to create new products and novel services while compared with the previous ones [65] (p. 137). Besides, the Commission of the European Communities comes to augment the implications derived from the relationship between CSR and competitiveness, expanding the characteristics, importance, role and functions of CSR both in the social and business environment, first of all, by launching the idea that “CSR is the integration of social and environmental concerns within business operations”, which “means that CSR is not just philanthropy”, and, second of all, by stating the fact that “CSR is not so much about what enterprises do with their profit, but how they make that profit” [65] (p. 137). Also, the Commission of the European Communities comes to examine the connection between CSR and “stakeholders such as trade unions, public authorities, nongovernmental organizations, and business representative organizations”, revealing the inestimable value of dialogue and the greatness of partnership as prominent features [65] (p. 137). Alternatively, the Commission of the European Communities comes to stress the interesting and thought-provoking view that CSR is a voluntary action for organizations, thus “CSR relates to what enterprises can do in the social and environmental fields over and above what they are required to do by law”, bringing as significant argument the fact that CSR can be categorized in four major areas, namely: workplace CSR, marketplace CSR, environment-related CSR and community-related CSR [65] (p. 137).
However, due to the fast growing need of investors to have access “to reliable and comparable information”, in order for these economic agents “to take full account of social and environmental issues”, the European Union’s organizations are seriously taking into consideration finding and promoting solutions capable to accommodate investors’ belief “that company disclosure of social and environmental performance should be standardized and perhaps made obligatory” [65] (p. 137). As a result, the European Union’s organizations are genuinely committed to improving communication and metrics in the domain of non-financial performance [65] (p. 150). Thus, the European Alliance for CSR was launched in 2006 in order to protect the core values of our society on the road of ensuring a sustainable market economy as well as future competitiveness [66], and, in like manner, to build “a framework of metrics and strategies for the management and communication of key areas of nonfinancial performance, highlighting the link with financial performance” [65] (p. 150). In the same time, in an economic, social and environmental context that requires, on the one matter, increase of transparency in the activity of private and public companies, and, on the other matter, relentless efforts to disclose the results obtained by using key financial and non-financial performance indicators, both the United Nations Environment Programme (UNEP) - Finance Initiative and the Enhanced Analytics Initiative (EAI) have also made substantial attempts to promote biodiversity, ecosystems’ equilibrium and a sustainable business environment.
Incidentally, granting the fact that financial indicators alone are insufficient in order to detect the organizations’ strong and weak points [67,68], the specialists assume “that companies which do not systematically analyze their intellectual capital have an insufficient understanding of what really drives their value creation” [65] (p. 150). Hence, notwithstanding the forgoing context, we must not forget that balancing and encouraging transparency on non-financial indicators includes the entities’ “need to protect strategic information from competitors”, which might prove to be a very difficult mission for them on the long run, since the non-financial metrics refer to, for example, brand preferences, competitiveness, customer experience, customer influence, customer satisfaction, customer retention, customer value, efficiency measures, employee productivity rate, innovation, market share, reputation, and so on and so forth [65] (p. 150). Moreover, it should be underlined that the Organization for Economic Cooperation and Development (OECD) is a leading international institution that avidly and strongly promotes the initiative of disclosing and presenting entities’ non-financial components within the business reports, with a particular focus on managing and reporting of intellectual capital at the companies’ level, even though intangible assets include far more elements than the CSR-related issues [69,70,71,72,73,74], and despite the fact that, “as a result of existing limitations to recognize intangible assets on company’s balance sheets, disclosure has gravitated towards the narrative format” [75] (p. 12). Furthermore, intellectual capital has a growing importance in valuing a company, especially in the knowledge-based economy and the knowledge-based organizations, where scientists have come to describe intellectual capital as the entities’ most significant asset [76,77,78,79], taking into account several issues, namely:
  • There have been a number of studies involving intellectual capital that have reported that its components, importance, influences, and role on the financial and non-financial performance of organizations are notable, especially when addressing the case of knowledge-based economy and knowledge-based organizations, where human, structural (organizational), relational (customer) capital capabilities are highly praised [76,77,78]. What is more, a major problem with this kind of influences derived from intellectual capital’s involvement in the entities’ evaluation procedures is that it is highly difficult and, in some cases, even impossible to correctly measure the precise extent of intellectual’s capital contribution to the performance of companies [3,10,76,77,78,79].
  • Lack of appropriate, comprising and sufficiently comprehensive methods capable of measuring intangible assets, in general, and intellectual capital, in particular, have existed for many years [45,46]. Despite the relevance, significance and value of intellectual capital at the level of corporations, its looks like intellectual capital’s assessment suffers from major drawbacks: first of all, the ways of enhancing performance in the knowledge-based economy through the aid of intellectual capital depend from one entity to another and are subject to the entities’ managerial business processes, which makes the results uncertain and, to a certain extent, very risky; and, second of all, there are no unanimous methods of evaluating intellectual capital of organizations, since the literature on this subject openly promotes that evaluating intellectual capital and its influence on companies’ performance depend on numerous characteristics and factors that should be analyzed in each and every particular situation depending on the specifics of entities taken under consideration [3,10,48,76,77,78,79]. Likewise, questions have been raised about intellectual capital’s valuation in corporations also due to the fact that this intangible asset comprises complex forms, such as, for instance: in some cases, employees’ skills, competences, education and training, or, in other cases, know-how, or, in some situations, the entities’ relationships with suppliers and clients, or even, in certain situations, intellectual property or the information imbedded in the organizational operations, processes and structures [3,10,48,76,77,78,79].
  • A number of researchers have reported that business entities rely on the power and benefits brought by the organizations’ intellectual capital, singling out, in their studies, the idea that intellectual capital enables knowledge creation, accentuating, in their scientific works, the fact that intellectual capital represents the foundation of firms’ knowledge, and, also, underlining, in their papers, the importance and the role of intellectual capital in enhancing firms’ value [80,81].
  • Previous studies have reported that the concept of “intellectual capital” may be successfully linked, on the one matter, with the way in which organizations develop their business strategies, and, on the other matter, with the appropriate indicators that offer an insight of the organizations’ business processes, efficiency, efficacy, management, production, productivity and performance [82,83].
  • Several attempts have been made so far by specialists to pinpoint the conceptual roots of intellectual capital, in order to evaluate and measure organizations’ knowledge and discover to what extent intellectual capital influences the organizations’ business processes, efficiency, efficacy, management, production, productivity and performance [80,81,82,83,84,85,86,87,88,89].
  • Along with the global economic growth, however, there is increasing concern over inclusive, robust, and sustainable business development opportunities supported by intellectual capital’s influences over the present and future performances of organizations, which have also a serious effect on both auditing and accounting principles, rules and regulations that come to address the role of intangible assets [3,10,48,76,77,78,79,80,81,82,83,84,85,86,87,88,89].
A number of key issues have become apparent while being constantly concerned with improving the overall approach to the annual financial statements and consolidated financial statements, the CG administrative principles and regulations programs, the measures on generating economic growth in a sustainable way, and the solutions on creating new jobs and encouraging entrepreneurship, which eventually determined the European Commission to seek for a modern and improved understanding of CSR, in like manner, presenting a new definition of CSR as “the responsibility of enterprises for their impacts on society” [90] (p. 6). What the European Commission was mainly concerned with here was the process of integrating consumers, environmental, ethical, human rights, and social concerns into the companies’ business operations, procedures and processes, with the aid of CSR principles as well as with the help of stakeholders’ inputs, while targeting the maximization of “the creation of shared value for their owners/shareholders and for their other stakeholders and society at large” and the careful identification, beforehand prevention and timely mitigation of “their possible adverse impacts” [90] (p. 6).
Nevertheless, for numerous years already, a consistent number of relevant studies in the field have seriously and systematically focused on addressing the importance of Romanian organizations’ adaptation to the European requirements and directives bearing in mind the importance of aligning entities’ accounting and auditing procedures to the international standards [12,13,38,43,44,45,46]. Unfortunately, so far research on the subject of Romanian organizations’ adaptation to the European requirements and directives has been mostly restricted to limited comparisons, since the process of aligning the Romanian entities’ accounting and auditing procedures to the international standards takes time and also the access to relevant data or consistent information is rather difficult in some situations. However, considering the above issues that dealt with aspects related to CG and CSR, it looks that the Romanian business environment also needs, on the one hand, examples of good practices in terms of good governance and social responsibility actions, and, on the other hand, constructive models of European requirements and directives’ implementation in the European Union entities.
The adoption of Directive 2014/95/EU amending Directive 2013/34/EU and subsequent guidelines—namely, the Guidelines on non-financial reporting EU Guidelines 2017/C215/01(EUG), represent an important step that unitarily regulates at European level the increase of transparency in the activity of large companies, of public interest by their obligation to prepare, together with the key financial performance indicators, a non-financial statement containing information on environmental, social and personnel issues, respect for human rights, fighting corruption and bribery. The importance of the transposition of this Directive into national laws, the mechanisms and effects of its implementation in different European countries, have trained many specialists who have analyzed this process from multiple points of view.
In Spain [25] the authors examine the impact of the implementation of the Directive by analyzing the non-financial information published by the listed companies in 2018 and note that: “the level of regulatory compliance produced is associated with the business sector in which the company operates” and that “the highest rates of disclosure of non-financial information corresponds to companies that provide this information in the sustainability report”.
Recent evidence suggests that, despite the fact that German companies must provide information to stakeholders using a wide range of methods following strict accounting rules and securities laws, numerous aspects specific to businesses operations as well as substantial details with regard to businesses conduct are not yet covered or are not sufficiently covered in order to address present expectations [26]. What is more, according to the German company law, the management of the organizations may inform the stakeholders either voluntarily or on request [26]. In the same time, however, even though the German Corporate Governance Code (GCGC) provides detailed provisions on disclosure, in particular with the intention to ensure transparency on reporting and auditing, according to the German company law it has been pointed out that shareholders’ rights of information are much more restricted in comparison with the stakeholders’ rights [26].
In the literature on good business practices, good governance, CG, CSR, financial and non-financial performance, and sustainability, the importance of Directive 2014/95/EU has been subject to considerable debate, since specialists have acknowledged the importance of addressing in a more responsible manner corporate accountability [27]. In this manner, large organizations are required to report, on the one hand, on their social, environmental and human rights impacts and, on the other hand, to emphasize the risks of the activities that they are conducting for third parties [27]. In addition, it should be stressed that, even though the significance of the Directive 2014/95/EU was greatly acknowledged in Germany, and its importance was highly praised by German representatives, the final text of this Directive was received, in the end, with some resistance by the German business sector, in general, and with uneasiness and worry by Germany’s Mittelstand or medium-size enterprise sector, in particular [27].
What is more, the study [28] evaluates the qualitative contribution of European regulations by analyzing the oil and natural gas sectors considered as sectors in which the voluntary disclosure of social and environmental aspects has reached the highest quality level. The results of the study are tinted according to the different comparisons made [28]. However, the qualitative contribution of European regulations is highlighted even in these sectors of activity [28]. Besides all these aspects, the scientific paper [28] indicates the need to understand various perceptions of providing mandatory non-financial information in the cases addressed by Directive 2014/95/EU and required by the rules stated in Directive 2014/95/EU, while aiming to obtain an increased sustainability disclosure of information, and also in the elaborated context characterized by numerous concerns towards “sustainability information such as environmental, social, and employee information, human rights, and anti-corruption and bribery matters, and the disclosure of diversity policies for board members” [28].
Thus, this recent study [29] is dedicated to assessing the impact of social and environmental reporting on consumers’ social decisions. The level of compliance of the information disclosed in the Spanish e-credit market is also analyzed and, additionally, whether the information disclosed is sufficient to substantiate the consumers’ decision [29]. The main conclusion is that “non-financial information disclosure in the Spanish e-credit market is not sufficient to make informed decisions” [29]. The study tries to identify the main factors that can influence the completeness of the information disclosed [29].
According to [30], a key question arises when addressing the need to provide sustainable information in order to support transparency and non-financial information disclosure, namely: “Do industrial companies respond to the guiding principles of the Integrated Reporting framework?” In this matter, [30] represents “a preliminary study on the first companies joined to the initiative”, naturally derived from the need to create a common framework called Integrated Reporting (IR), which targets enhancing transparency in the companies’ business models, focuses on displaying the organization’s true value (with the inclusion of both tangible and intangible assets) and encourages finding the right solutions capable to handle risk without compromising the future of the next generations or our chance to live in a sustainable environment.
In the same time, it is analyzed [31] the level of compliance of the content of the non-financial reports of the Italian companies obliged to implement the Directive and it is verified whether its implementation will bring a qualitative increase of information, compared to the voluntary reporting previously made. The authors’ conclusions are that “this study shows that there is still an important information gap to fill even among large entities, with the exception of multinational companies” [31].
In continuation, it should be highlighted that in [91] the authors offer an alternative disclosure model based on stewardship theory that changes managers’ behavior and builds trust.
Concerns regarding the identification of the factors that may influence the disclosure and the quality of the disclosure of non-financial information are also found in the research, namely: for example, the study [92] highlights the role of employees and management; in continuation, the scientific work [93] shows the mutual influences between the employees and the attitude of the entities to report and adopt a responsible social and environmental attitude; likewise, this work [94] fills a research gap to examine the indirect relationship between employees’ perceptions of external and internal CSR and work engagement.
Apart from the elements illustrated in the lines above, it should be emphasized that CSR is a highly sensible subject and rather difficult to fully address currently since it takes into consideration a number of significant attributes, refers to numerous characteristics, and also faces the influence of numerous factors. In the same time, it should be stated that the companies’ value stand under the influence of the way in which these entities have the power to address, among others, social and environmental concerns. However, due to the instability in the economic and financial sector, one may notice that organizations worldwide should start relying more on their intangible assets rather than on their on their tangible ones. In the lines below, we have turned our attention to intellectual capital’s role and impact on the companies’ value, describing the results obtained by previous findings in literature [95], we have pointed out that social responsibility and financial risk need to be closely analyzed, and thoroughly and consistently taken into consideration [96], and we have underlined that corporate risk disclosure and CG should be on the agenda of all modern and knowledge-based business enterprises [97].
Little is known about intellectual capital’s influences on the companies’ value, and, additionally, it is not yet clear what components falling in the category of intangible assets have the power of determining the organizations’ financial and non-financial performance on the short, medium or long term. The paper [95] seeks to remedy these problems by analyzing “intellectual capital performance and profitability by extending evidence from Pakistan”, aiming to examine, on the one matter, “intellectual capital’s performance on the profitability of Pakistani financial institutions”, and, on the other matter, the way in which “corporate governance, bank specific, industry specific, and country specific indicators effect Pakistani banks’ profitability”. The finding of this scientific work are regarded to be extremely useful not solely for researchers and academics, but also for practitioners, policy makers and managerial boards of directors, in particular, due to the fact that, “three value added intellectual coefficient (VAIC) components, capital employed efficiency (CEE), and human capital efficiency (HCE) are found to have a significantly positive and structural capital efficiency (SCE) is found to have a significantly negative impact on bank profitability” [95]. However, the study’s results underline the fact that there was encountered “a negative impact on profitability of factors like board size, board meetings, credit risk, industry concentration and economic growth”, which offers scientists future research arguments to analyze intellectual capital’s impact and influences on entities’ performance in other similar cases [95].
Several studies have produced estimates of financial risk disclosure, and in the same time, have addressed the specificities of financial attributes among publicly traded corporations. Among them a recent work pinpoints successfully and in a rigorously addressed way the “financial risk disclosure and financial attributes among publicly traded manufacturing companies”, concentrating on “a set of 30 disclosure identifiers through content analysis of the annual reports of 48 manufacturing companies over a six-year period (2010–2015) in Bangladesh” and stressing the fact that entities’ size, financial performance, and auditor type are all “positively and significantly associated with the level of financial risk disclosure” [96].
Nevertheless, specialists [97] strongly believe that CG and risk management should stay at the very core of the priorities belonging to every entity in this world, and in particular, in the new economy—concerned with best business models and practices, sustainability, human resources’ continuous development, intellectual capital’s power increase over entities future financial and non-financial performance. Under these given circumstances, the work [97] closely analyzes “the relationships between corporate governance mechanisms and risk disclosure behavior using a sample of Canadian publicly-traded companies (TSX 230)”, while reaching an interesting and highly intriguing conclusion, namely “that Canadian public companies are more likely to disclose risk management information over and above the mandatory risk disclosures, if they are larger in size and if their boards of directors have more independent members”.
CSR reporting decreases the information gap between stakeholders and the firm [98] and can improve its reputation [99]. Despite the benefits of CSR and even if non-financial information plays an important role in building an economically sustainable entity, companies will continue to focus on financial results to the detriment of environmental protection or social responsibility if the legislation allows them [100].
In accordance with the aspects presented and the preliminary conclusions, in order to identify the main factors that influence the compliance level of the entities obliged to implement the Directive we will verify the following hypotheses:
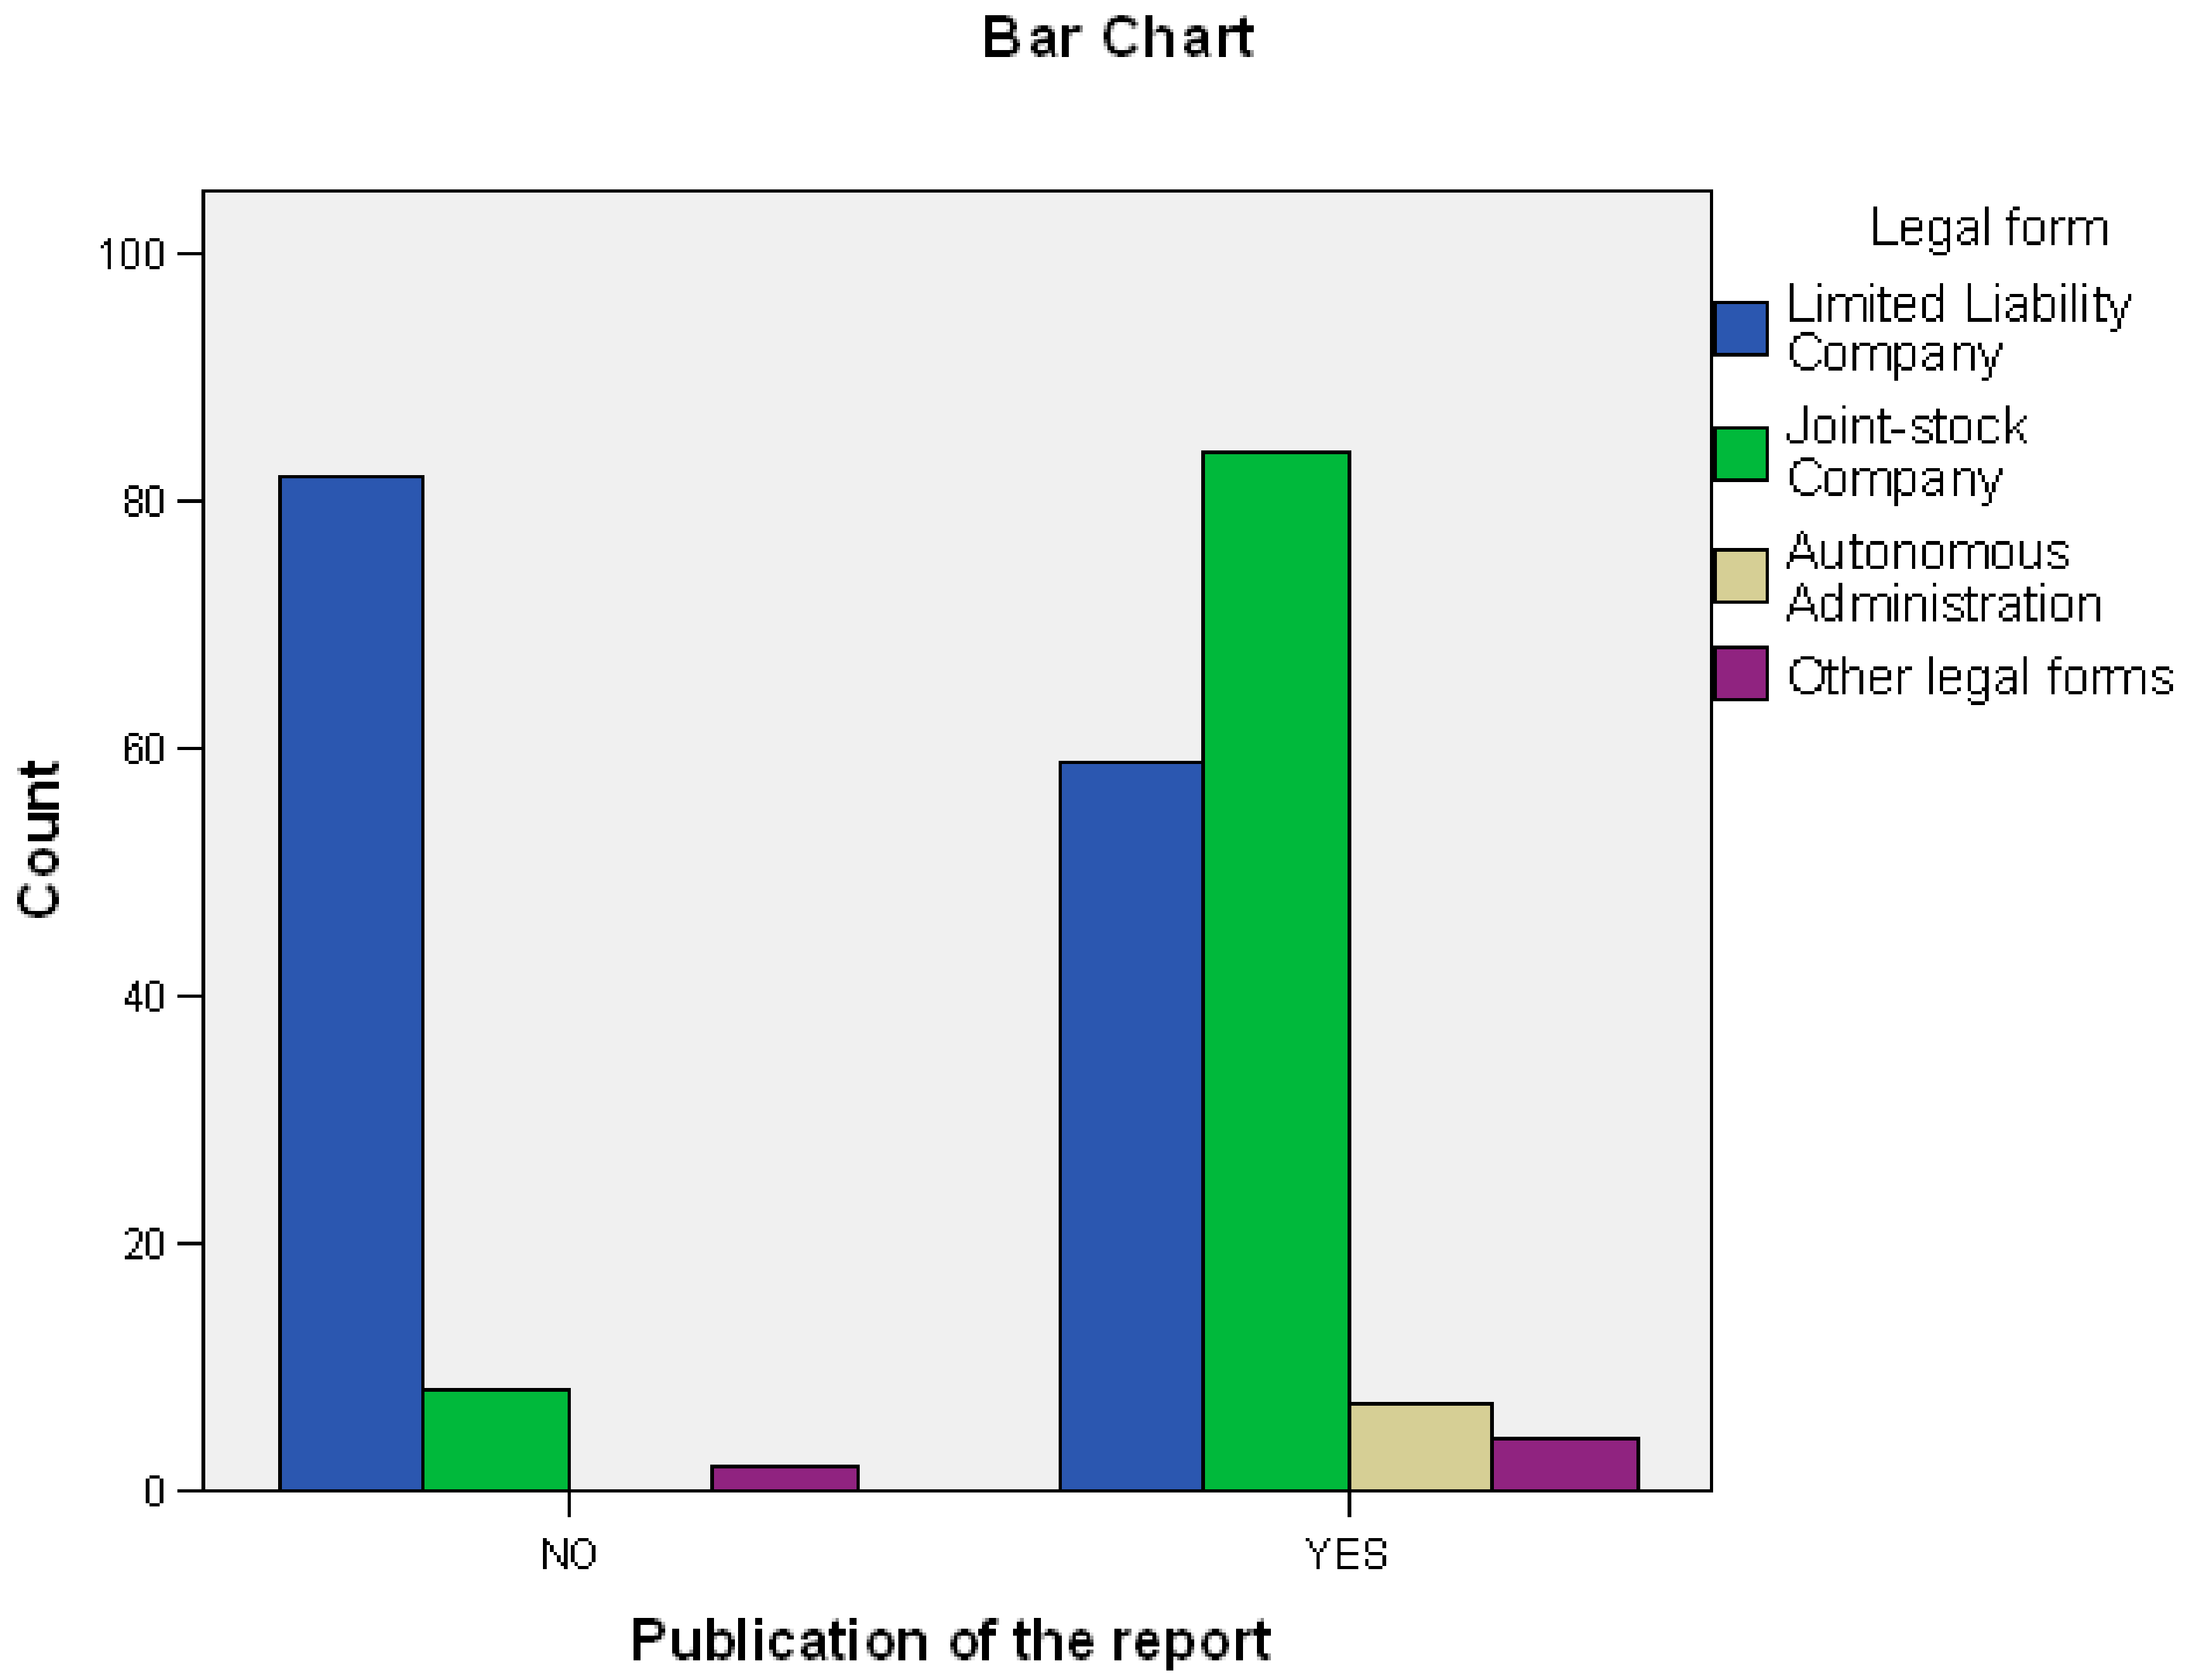
Hypothesis (H1). 
There is a relationship between the non-financial disclosure in the Romanian companies and the legal forms of organization.
Hypothesis (H2). 
There is a relationship between the non-financial disclosure in the Romanian companies and forms of ownership of capital.
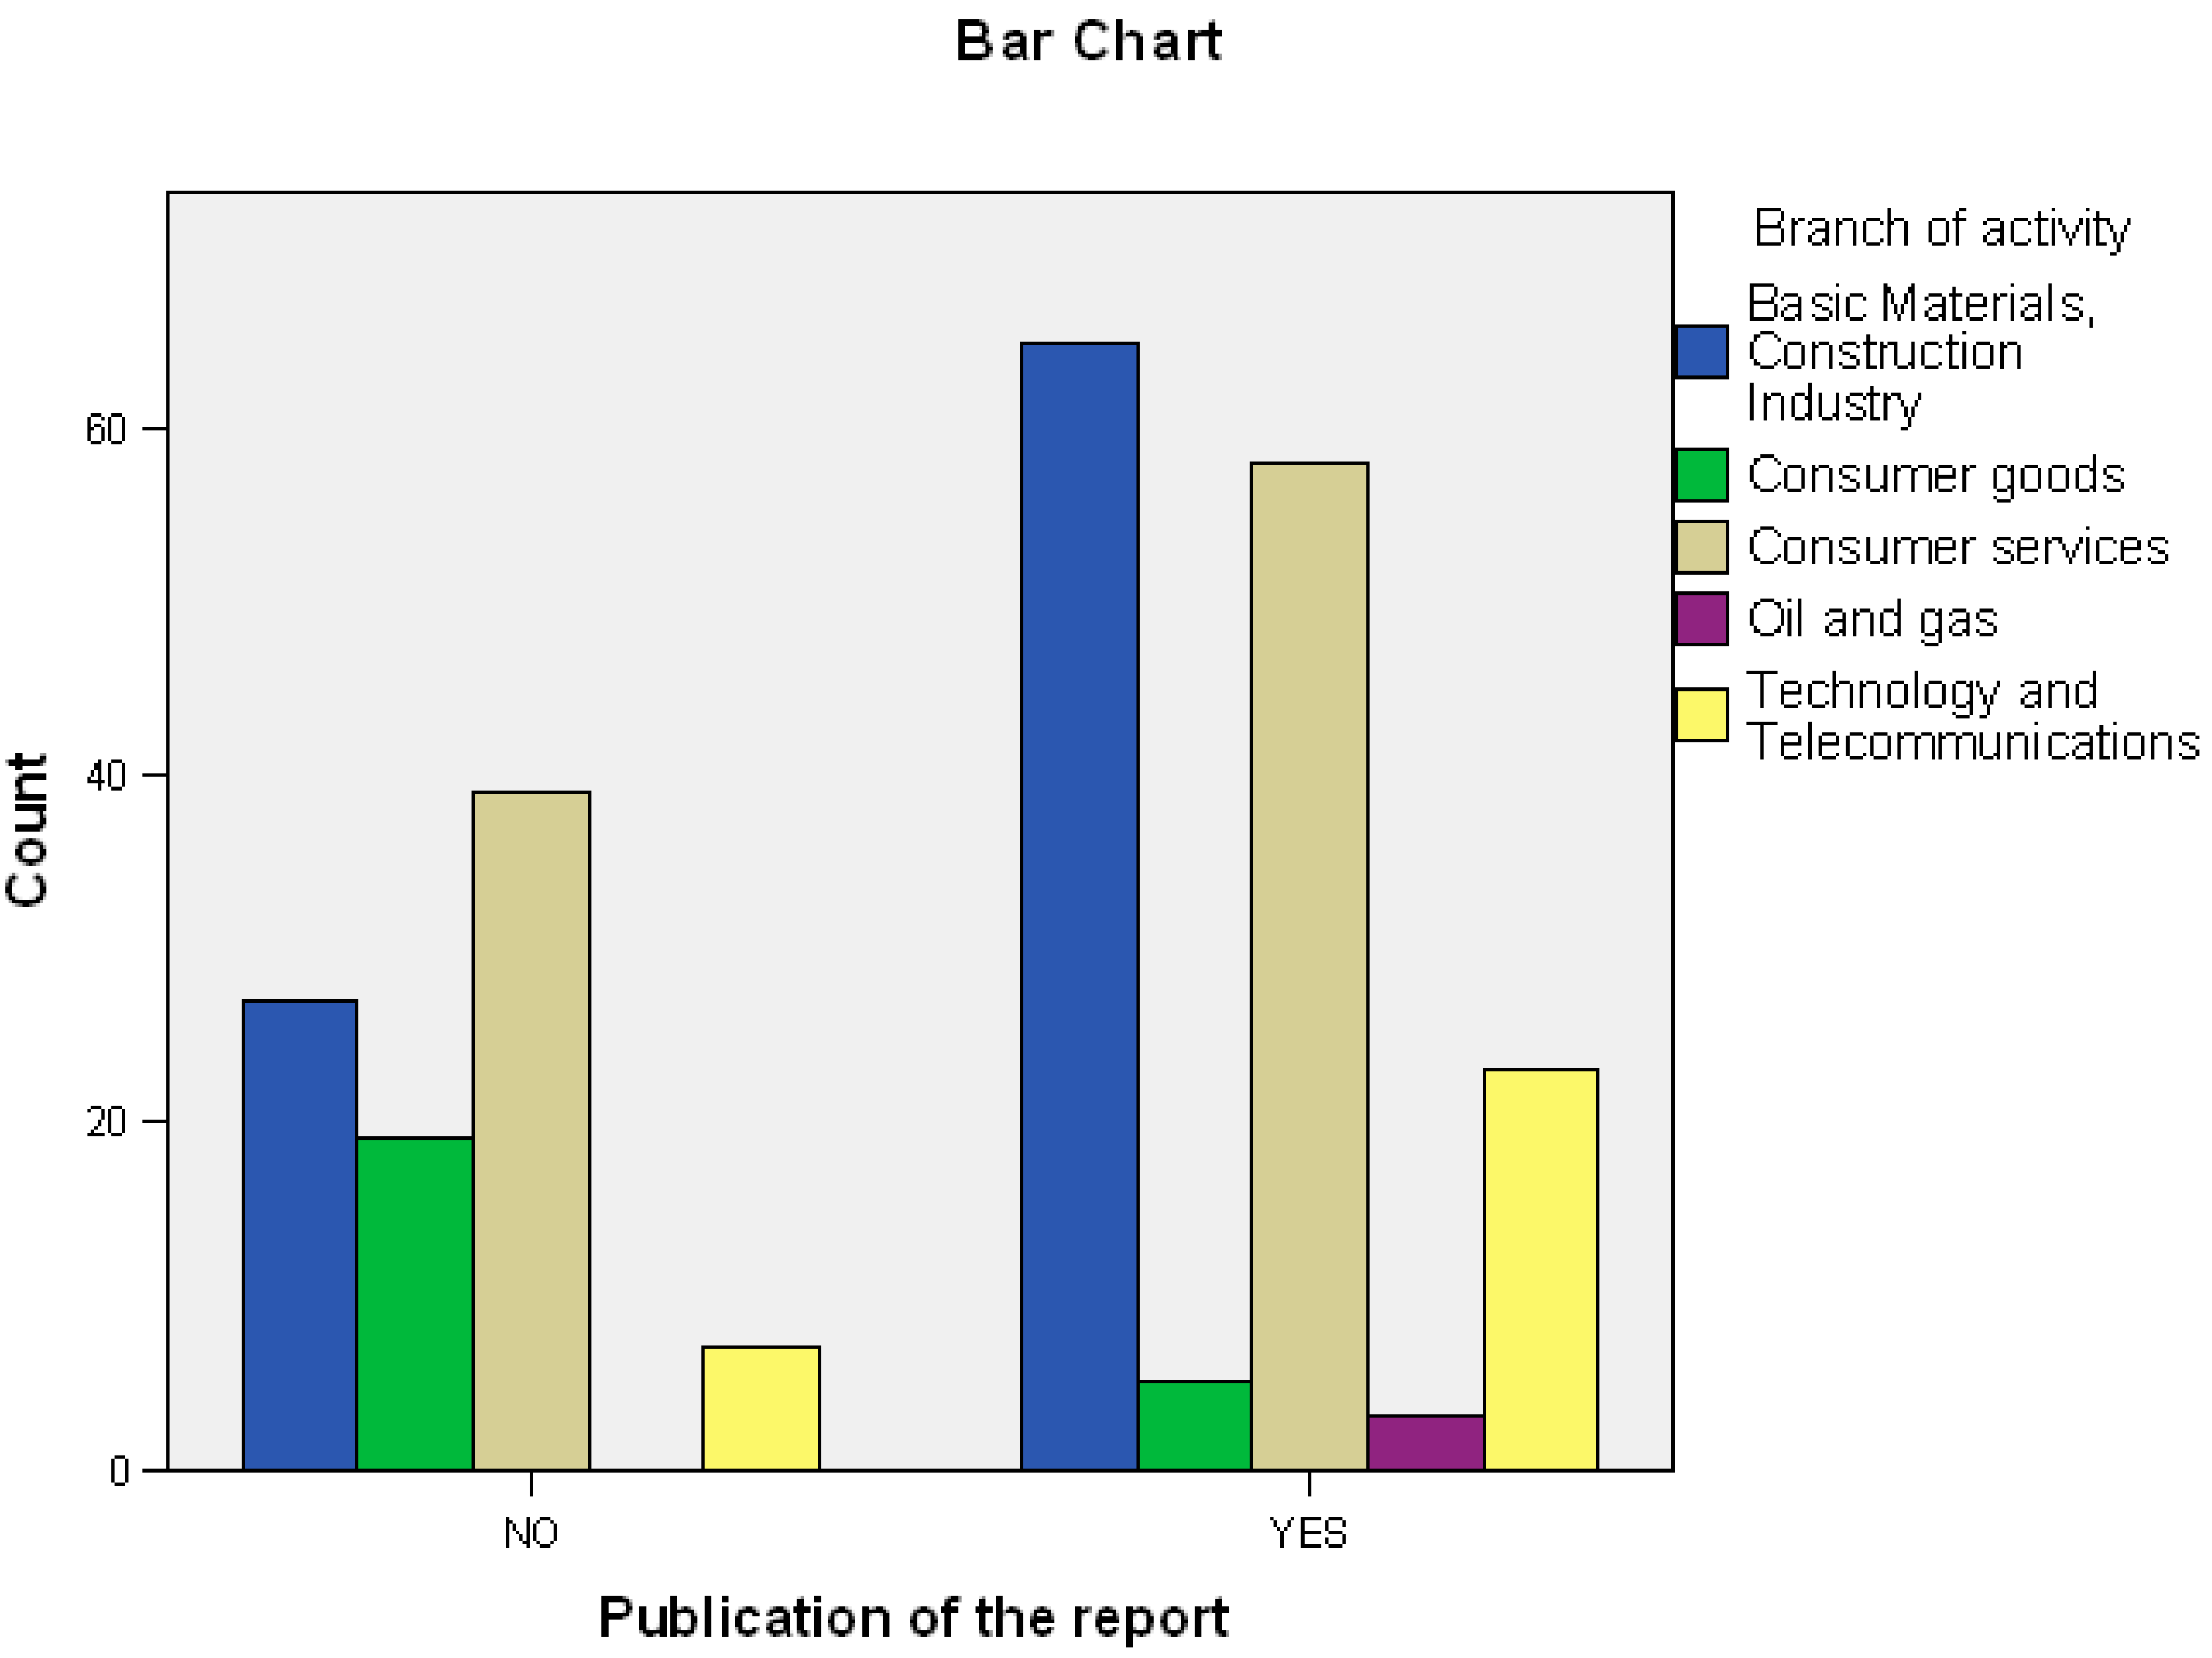
Hypothesis (H3). 
There is a relationship between the non-financial disclosure in the Romanian companies and branch of activity.
Hypothesis (H4). 
There is a relationship between the non-financial disclosure in the Romanian companies and the number of employees.
Hypothesis (H5). 
There is a relationship between the non-financial disclosure in the Romanian companies and turnover.
Hypothesis (H6). 
There is a relationship between the non-financial disclosure in the Romanian companies and the company location.
The alternative hypotheses (H1, H2, H3, H4, H5 and H6) suppose that there is a statistical association between the explained variable (non-financial disclosure) and each one of the different explanatory variables (form of organization, form of ownership of capital, branch of activity, number of employees, turnover, and company location).
The assumptions under analysis are closely related to the object of our study—Corporate Social Responsibility, Corporate Governance and Business Performance: Limits and Challenges Imposed by the Implementation of Directive 2013/34/EU in Romania—with the mention that the implementation of this Directive has been transposed into the Romanian legislation by the Order no. 1938/2016 of August 17, 2016 on the modification and completion of accounting regulations [2]. According to this regulation, the requirements of this Directive must be applied to “entities of public interest which, at the balance sheet date, exceed the criterion of having an average number of 500 employees during the financial year”. In the Romanian legislation [101], the public interest entities include: “the companies whose securities are admitted to trading on regulated market”; “credit institutions”; “insurance, reinsurance and reinsurance companies”; “non-banking financial institutions”; “national companies / companies”; “companies with full or majority state capital”; and “autonomous authorities”. The first four hypotheses are strictly related to the legislative requirements regarding the necessity of implementing the Directive, trying to answer the question “To what extent, the qualification criteria, can influence the degree of compliance”? Hypotheses 5 and 6 are related to the spirit of the Directive on social and environmental impact, as a result of bankruptcy or environmental deterioration. Moreover, these criteria have been identified in other studies presented in the literature. In should also be stated that the most detailed selection and analysis of these factors was determined by our previous exploratory study, which was the basis for extending and deepening the current research [3].

3. Research Methodology

3.1. Research Sample

As mentioned above, our research is based on the data and results of the previous study [3]. In this particular case, we are now developing and shading the process of analyzing and interpreting the initial results in order to identify the factors that can influence the compliance level of the Directive’s implementation, including the objective of determining the meaning and intensity of this influence.
In this matter, we will use the same representative sample of 246 entities selected from the complete list of the 680 entities identified and given to The CSR Report [102], obliged to apply the Directive and to report the non-financial information related to 2017 in 2018.
The statistical sample, used in our studies, was determined and selected according to the statistical requirements [103], for the 95% confidence coefficient, a maximum admissible error of +/− 5% and for a population of 680 members.

3.2. Correlation and Partial Correlation

Because “causality” is usually too complex to be highlighted in the economic and social sciences, the concern is directed to the analysis of the “association” between phenomena and variables. Although not as rigorous, the association of phenomena can be highlighted by measuring their concomitant evolution, regardless of the nature of the cause that produces this co-variation.
The concept of correlation measures the degree of simultaneous variation between two variables, considered without any connection to other variables and is based on the conception of Francis Galton and Karl Pearson. It has as a precursor the covariance coefficient that is dependent on the units of measure of the variables. The Pearson correlation coefficient (r) is based on a linear association model between variables and can take values between +1 (positive, direct, perfect correlation) and −1 (negative, inverse, perfect correlation). For these reasons, the absence of a sufficiently large or significant value does not express with certainty the absence of a link between the variables but, possibly, the existence of a different type of concomitant variation than the linear one.
From the point of view of statistical reasoning in the studies based on the correlation coefficient we do not have an “independent” variable, both variables being considered “dependent”. The economic-social phenomena are subject to multiple inter-conditions and the external effects of other variables can contribute to the change of the bivariate correlation coefficient. In order to isolate the effects of other variables that can influence the bivariate correlation, the statistics propose as solution, the use of the partial correlation coefficient, which allows us to calculate the correlation between two variables with the constant maintenance of the external influence from one or more variables.
The values and the way of interpreting the partial correlation coefficient are similar to the bivariate correlation coefficient. The interpretation of the correlation coefficient takes into account two aspects: significance and size. The interpretation of the value of the correlation coefficient that is below the significance threshold (the alpha level), fixed before the analysis of the calculations, will not be considered, regardless of the value of r. The significance threshold with the value initially set by Fisher, the parent of modern statistics, at 0.05, it refers to the probability of obtaining the data collected provided that the null hypothesis is true [104]. In other words, the p-value of 0.05 represents the level accepted by the scientific community of rejecting or not rejecting the null hypothesis, without supporting the degree of truth of a hypothesis, as it is often mistakenly considered [105]. Obviously, the higher the value of the correlation coefficient, the more it expresses a stronger association between the concomitant variations between the two variables. Over time, such valuation scales have been proposed. The best known are those proposed by Jacob Cohen in [106] and Hopkins in [107].
The nature of the data in which the variables are quantified, their field of definition and the multitude of their possible values, are the key elements that enhance or restrict the statistical reasoning in the calculation of the statistical indicators suitable for studying the association, their co-variation.
In our case, the main analyzes are made on nominal variables. In this situation, necessarily but not enough, we have to calculate the contingency coefficient χ2 (chi square). “This coefficient is non-directional and dimensional [108]”. The contingency coefficient is sensitive to the size of the sample and measures the degree of contingency of the two variables. It only reveals if there is an association between the variables, but without giving us information about the meaning and intensity of this association. In order to eliminate these disadvantages, we will calculate other coefficients derived from χ2, namely the association coefficient φ (phi), the coefficient V Cramer, the contingency coefficient (cc) and others. Moreover, these coefficients are depending on the nature of the values of the analyzed variables and the desired accuracy. In the case of associating a nominal variable with a dichotomous variable, with another nominal variable, with an ordinal variable or with a scalar variable, if it is grouped into classes, we will also calculate the coefficient of association λ (lambda) Goodman and Kruskal. “In practice, this coefficient refers to the amount of knowledge contained in one variable, which can cover information from the other variable” [108]. It is a non-directional coefficient, with values between 0 and 1. Approaches to zero show that the information contained in one variable cannot predict the other variable, the variables having nothing in common, and the approximations of 1 are significant for the degree of prediction of the evolution of one variable, based on the information contained in the other variable. The analysis of the significance of this coefficient is done on the basis of statistics z adopting a pessimistic or optimistic attitude depending on the additional elements held [109].

3.3. The Endogeneity Problem

The problem of endogeneity in econometrics arises when the explanatory variables and the error term are correlated in the regression model and generate biased or inconsistent estimates.
Li [110] rightly believes that the problem of endogeneity is a sensitive obstacle to being able to understand the true relationships between the different aspects of empirical studies, because causal and associative relationships are complicated and are not easily intuited, explained and econometricly modeled. Therefore, a careful analysis of the issues related to endogeneity, supports the need for the subsequent use of remedies to alleviate the problem of endogeneity to a certain degree, and proposes numerous solutions. The solutions proposed by Li and other remedies present in the literature are intended for regression models and are usually applicable when we have sufficient data over a certain period of time. An interesting challenge related to endogeneity appears in the case of correlations for data related only to a certain time point. The solutions proposed by the specialized literature include, on the one hand, the distinction between “statistical significance” and, on the other hand, the “practical relevance” of the correlation coefficient value and the confidence limits for it. Obviously, the quality of the research results is dependent on the validity and fidelity of the results.

4. Results and Findings

In order to reach the research objectives, the values of the indicator χ2 (chi square) were determined for the sizes specific to the analyzed variables, to verify whether or not there are associations and, according to the needs, other derived indicators that allow the analysis of the meaning and intensity of the association. The results are shown in two sections: Summary Statistics and Quantitative analysis. Also, it should be added that we used for the calculation process the programs for statistics and data science SPSS 14.0 and Excel. What is more, SPSS Statistics is a software package used for interactive or batched statistical analysis, and, in our study, we used the version of the year 2007: SPSS 14.0.

4.1. Summary Statistics

In order to verify the six hypotheses, the associations between “Publication of the report” and the variables specific to each hypothesis were analyzed. According to the specialized literature and those presented previously for the nonparametric variables, the mean and standard deviation are not relevant, which is why in Table 1 below we summarized the studies performed, the sample size and any missing values.
The results confirm that the sample is representative and no data are missing.

4.2. Quantitative Analysis

The quantitative analyses show the results according to the hypotheses.

4.2.1. Association with the Legal Form (H1)

As presented in the information in Table 2, it can be seen that of the 246 entities analyzed over: 57.31% are limited liability companies; 37.39% are joint stock companies; 2.84% are autonomous kings and the rest over 2.43% other legal forms. The value of the χ2 indicator of 62,548 mentioned in Table 3 calculated at a significance threshold of less than 0.001, expresses the existence of an association between the level of compliance of the entities and their legal form.
The intensity and meaning of this association are reflected in Table 4 and Table 5.
The value of the Phi and Cramer’s V indicators of 0.504 but also of the Contingency Coefficient indicator of 0.450—calculated at a significance threshold lower than 0.001, expresses a significant and strong association. So H1 is accepted. In addition, if we analyze the graph in Figure 1 we find that the autonomous regions have the highest level of 100% compliance, while the limited liability companies of only 41.84%.

4.2.2. Association with the Form of Ownership (H2)

According to the information in Table 6, it is found that for the 246 entities analyzed over: 34.95% have private Romanian capital; 14.63% have majority state capital; 46.74% have foreign capital; 2.03 have mixed Romanian and foreign capital, but without the participation of the state, and the rest over 1.62% are entities with mixed capital in which the Romanian state also participates. The value of the χ2 indicator of 29.643 mentioned in Table 7 calculated at a significance threshold of less than 0.001, expresses the existence of an association between the level of conformity of the entities and the form of ownership.
The intensity and meaning of this association are reflected in Table 8 and Table 9.
The value of the Phi and Cramer’s V indicators of 0.347 and of the Contingency Coefficient indicator of 0.328—calculated at a significance threshold lower than 0.001, expresses a significant and strong association. H2 is accepted.
When analyzing the graph in Figure 2, we find that the companies with majority state capital and the mixed ones with foreign and state capital have the highest level of compliance 100%, while the companies with Romanian capital have the lowest level of compliance only of 51.16%. The evaluation of these last results, on the one hand, confirms the bureaucratic character of state-owned entities and the concerns of entities with foreign capital for implementing and respecting certain procedures as well as the concern of foreign investors to associate with professionals.

4.2.3. Association with the Branch of Activity (H3)

In accordance with the information presented in Table 10, it is found that out of the 246 entities analyzed over: 37.39% activate in the branches Basic materials and constructions; 9.75% are producers of consumer goods; 39.43% are providers of consumer services; 1.21% work in oil and gas, and over 12.19% work in the fields of technology and telecommunications. The value of indicator χ2 of 25,085 mentioned in Table 11, calculated at a significance threshold lower than 0.001, expresses the existence of an association between the level of compliance of the entities and their branch of activity.
The intensity and meaning of this association are reflected in Table 12 and Table 13.
The value of the Phi and Cramer’s V indicators of 0.319 and the Contingency Coefficient indicator of 0.304–calculated at a significance threshold lower than 0.001, expresses a significant association. So H3 is accepted. In addition, if we analyze the graph in Figure 3 we find that the oil and gas branch has the highest level of 100% compliance, and for the producing branch of consumer goods the compliance is only 20.83%.

4.2.4. Association with the Number of Employees, Systematized by Size Groups (H4)

In accordance with the information presented in Table 14, it is found that the variable number of employees, continuous scale size, has been systematized into 8 size groups. These were designed in accordance with Sturges’ relationship [111]. Of the 246 entities analyzed over 85.77% are distributed in the first two groups. The value of the indicator χ2 presented in Table 15 is calculated at a significance threshold greater than 0.05, as hypothesis H4 is rejected.
Although there is no significant association between the number of employees and the degree of compliance, the analysis of the graph in Figure 4 shows that the level of compliance has a tendency to increase as the number of employees’ increases. However, the weight of these groups is insignificant.

4.2.5. Association with Turnover, Systematized by Size Groups (in millions of EUR—H5)

According to the information presented in Table 16, it is found that the variable turnover, continuous scale size, has been systematized into 8 size groups. These were designed in accordance with Sturges’ relationship [111]. Of the 246 entities analyzed over 86.58% are distributed in the first two size groups. The value of indicator χ2 presented in Table 17 is calculated at a significance threshold of 0.087 with slightly greater than 0.05, as hypothesis H5 is rejected.
Although there is no significant association between the turnover and the degree of compliance in the analysis of the graph in Figure 5, it is found that the level of compliance has a certain tendency to increase, as the turnover increases. However, this trend is not conclusive and evens the size of the Eta indicator of only 0.115 calculated in Table 18, reflects the low level of a possible association.

4.2.6. Association with the Location, Systematized by Development Areas (H6)

According to the information presented in Table 19, it is noted that the 246 entities are relatively evenly distributed over the development areas, with a certain tendency of concentration in the Bucharest – Ilfov region. However, the value of the indicator χ2 presented in Table 20 is calculated at a significance threshold with much greater than 0.05, as hypothesis H6 is rejected.

5. Conclusions

The research carried out allowed the identification of the factors that contributed to the determination of the degree of compliance calculated on the basis of information disclosed to the public directly or through the regulatory or supervisory bodies, or of the parent companies of 62.60%, based on the statistical association between the degree of compliance and the potential causes related to the size, location or organizational structure of the companies.
Following the analyzes, it was found that there is a strong association between the level of compliance with the legal form, highlighted by the value of the indicator χ2 of 62,548 calculated at a significance threshold of less than 0.001. The lowest level of compliance is held by the limited liability companies of only 41.84% while the autonomous authorities have reported 100%. The intensity of the association at medium level is significant and strong, being reflected by the value of the Phi and Cramer’s V indicators of 0.504 and the Contingency Coefficient indicator of 0.450 – calculated at a significance threshold below 0.001. The significant difference between the lowest and the highest value of the compliance level of 58.16% is explained mainly by the specific cultural and legislative traditions. The autonomous national companies were established on the basis of the old state-owned companies resulting from the privatization and are strongly regulated. In contrast to the autonomous companies, the limited liability companies represent the most dynamic segment in the economy, with a very flexible organizational and management structure and without too many legislative constitution and functioning. In order to increase the degree of compliance in the spirit of the Directive, it would be necessary to disclose non-financial information to the public not together with the financial statements to the regulatory and control bodies.
An edifying association exists with the form of ownership where a level of compliance of 100% is observed in the companies where the state is mostly characterized by a bureaucratic heavy apparatus and where the regulation and the procedures of the activity are very severe. A high level of compliance of over 58.26% exists in entities with foreign capital, as a rule they are required to have specific procedures related to the culture of the countries of origin of the parent entities or the entrepreneurial culture of the investors. The meaning and intensity of the association is reflected by the value of the Phi and Cramer’s V indicators of 0.347 and the Contingency Coefficient indicator of 0.328—calculated at a significance threshold lower than 0.001, which expresses a significant and strong association.
The confirmation of hypothesis H3, the association with the branch of activity, is supported by the value of the Phi and Cramer’s V indicators of 0.319 and of the Contingency Coefficient indicator of 0.304—calculated at a significance threshold lower than 0.001 which reflects a significant association. We find that this association is not without great contrasts. The oil and gas branch has the highest level of compliance 100%, and for the producing branch of consumer goods the compliance is only 20.83%. Obviously, this difference of over 79.17% is justified mainly by the pressure exerted by the public opinion and the ecological associations on the energy sectors of oil and gas considered directly and indirectly as more pollutants. In addition, the generic activity of producer of consumer goods is sufficiently vague and can save time the more severe filters of the environmental permits specific to the polluted activities.
Although the calculated indicators do not confirm an edifying association with the number of employees, the turnover or the location of the companies can be a useful conclusion for increasing the level of compliance. The need for this new reporting requirement to be better publicized and more rigorously regulated in accordance with the spirit of the European Directive, to make public non-financial information with major social or environmental impact.
The nature of the data, usually nominal data, required the use of nonparametric statistical indicators. These, despite some inherent limitations, allowed highlighting associations and building correlations, through an adequate use and interpretation of the results.
This paper has argued that CG, CSR, and business financial and non-financial performance should represent major objectives set by corporations in the context in which the market and the regulatory environment are strongly focused these days on the social as well as the sustainable aspects and practices of entities worldwide.
In this investigation, it seems that CG plays an important part in the complex and integrated processes of monitoring the activities, decisions, methods, techniques, policies and strategies used by companies in order to align their actions and to straighten their visions to the stakeholders’ desires, interests, requirements and views.
Our findings suggest that CG is a highly praised collection of connections, methods, principles, rules and techniques that should be seriously taken into consideration, and thoroughly and carefully addressed by all entities, due to its precise purpose of facilitating the organizations’ business processes control and business processes management, by: (a) firstly, enhancing accountability, disclosure, transparency, integrity and ethical business behavior; (b) secondly, ensuring equitable treatment for shareholders and stakeholders; (c) thirdly, facilitating the companies’ board members independence while making responsible decisions, showing commitment, independence, and respect for CSR principles, ethics and integrity values, social responsibility requirements, and management performance.
In general, therefore, it seems that CG and CSR come to substantially support compliance and responsibility in organizations, correct management practices and processes, financial transparency, good business practices, good governance, independent audit activities, information disclosure, transparent accounting procedures and communication, in order to ensure businesses financial and non-financial performance on the long run.
An implication of these is the possibility that in a knowledge-based economy, in time, the intangible assets (namely, for example, bonds, cash, equipment, inventory, land, machinery, stocks) will come to occupy a more important role in generating competitive advantages and increasing productivity and performance for businesses, while compared to the tangible assets (such as, for instance, brand equity, goodwill, intellectual capital, intellectual property), especially when addressing the organizations’ growth objectives.
In 2018, the first results of the implementation of Directive 2013/34/EU were reported and analyzed. From the results of the current study and from the analysis of the specialized literature, it is obvious that it is premature to be able to draw a conclusion regarding the synergy of the effect of the implementation of this Directive. There is a tendency to improve the quality of non-financial reporting. Perhaps more emphasis should be placed on the need for public and free access to this information, possibly introduced in the respective regulations as a mandatory requirement.

Funding

This research received no specific grant from any funding agency in the public, commercial, or not-for-profit sectors.

Conflicts of Interest

The authors declare no conflict of interest.

References

  1. Directive 2013/34/EU of the European Parliament and of the Council of 26 June 2013 on the annual financial statements, consolidated financial statements and related reports of certain types of undertakings, amending Directive 2006/43/EC of the European Parliament and of the Council and repealing Council Directives 78/660/EEC and 83/349/EEC. 2013. Available online: https://eur-lex. europa.eu/legal-content/EN/TXT/?uri=celex%3A32013L0034 (accessed on 4 May 2019).
  2. Ordin nr. 1938/2016 din 17 august 2016 privind modificarea şi completarea unor reglementări contabile, Monitorul oficial nr. 680 din 2 septembrie 2016. Available online: https://static.anaf.ro/static/10/Anaf/legislatie/ OMFP_1938_2016.pdf (accessed on 4 May 2019). (In Romanian).
  3. Popescu, C.R.G.; Banța, V.C. Performance Evaluation of the Implementation of the 2013/34/EU Directive in Romania on the Basis of Corporate Social Responsibility Reports. Sustainability 2019, 11, 2531. [Google Scholar] [CrossRef]
  4. Beck, T.; Demirgüç-Kunt, A.S.L.I.; Maksimovic, V. Financial and legal constraints to growth: Does firm size matter? J. Financ. 2005, 60, 137–177. [Google Scholar] [CrossRef]
  5. Cabral, L.M.; Mata, J. On the evolution of the firm size distribution: Facts and theory. Am. Econ. Rev. 2003, 1075–1090. [Google Scholar] [CrossRef]
  6. Popescu, G.N.; Popescu, V.A.; Popescu, C.R.G. Chapter title: Corporate Governance in Romania: Theories, Practices and Future Perspectives. In Corporate Governance and Corporate Social Responsibility: Emerging Markets Focus; Boubaker, S., Nguyen, D.K., Eds.; World Scientific Publishing House: Singapore, 2015; pp. 375–401. ISBN 978-981-4520-37-9. [Google Scholar]
  7. Frank, M.Z.; Goyal, V.K. Testing the pecking order theory of capital structure. J. Financ. Econ. 2003, 67, 217–248. [Google Scholar] [CrossRef]
  8. Rajan, R.G.; Zingales, L. What do we know about capital structure? Some evidence from international data. J. Finance 1995, 50, 1421–1460. [Google Scholar] [CrossRef]
  9. Frank, M.Z.; Goyal, V.K. Capital structure decisions: Which factors are reliably important? Financ. Manag. 2009, 38, 1–37. [Google Scholar] [CrossRef]
  10. Popescu, C.R.G. Addressing Intellectual Capital in the Context of Integrated Strategy and Performance: Emphasizing the Role of Companies’ Unique Value Creation Mechanism, While Targeting Better Organizational Reporting in Romania: The Case of Green Marketing and Green Marketing Strategies. J. Market. Res. Case Stud. 2019. [Google Scholar] [CrossRef]
  11. Moeller, S.B.; Schlingemann, F.P.; Stulz, R.M. Firm size and the gains from acquisitions. J. Financ. Econ. 2004, 73, 201–228. [Google Scholar] [CrossRef]
  12. Popescu, G.N. Procedurile controlului intern şi auditul financiar; Editura Gestiunea: Bucureşti, Romania, 1997. (In Romanian) [Google Scholar]
  13. Popescu, G.N.; Popescu, V.A. Impozitul pe venit şi contabilitatea în partidă simplă; Editura Gestiunea: Bucureşti, Romania, 2000. (In Romanian) [Google Scholar]
  14. Sebestova, J.; Rylková, Ž.; Krejčí, P.; Lejková, M. New Trends in Management: Regional and Cross-border Perspectives; London Scientific: London, UK, 2018; ISBN 978-0-9954618-4-0. [Google Scholar] [CrossRef]
  15. Sebestova, J.; Krejčí, P. Social innovation ties: A dilemma of product and employee orientation. Pol. J. Manag. Stud. 2018, 17, 123–133. [Google Scholar]
  16. Brickley, J.A.; Coles, J.L.; Jarrell, G. Leadership structure: Separating the CEO and chairman of the board. J. Corp. Financ. 1997, 3, 189–220. [Google Scholar] [CrossRef]
  17. Core, J.E.; Holthausen, R.W.; Larcker, D.F. Corporate governance, chief executive officer compensation, and firm performance. J. Financ. Econ. 1999, 51, 371–406. [Google Scholar] [CrossRef]
  18. Bennedsen, M.; Nielsen, K.; Perez-Gonzalez, F.; Wolfenzon, D. Inside the family firm: The role of families in succession decisions and performance. Q. J. Econ. 2007, 122, 647–691. [Google Scholar] [CrossRef]
  19. Boone, A.L.; Field, L.C.; Karpoff, J.L.; Raheja, C.G. The Determinants of Corporate Board Size and Composition: An Empirical Analysis. J. Financ. Econ. 2007, 85, 66–101. [Google Scholar] [CrossRef]
  20. Demstez, H.; Lehn, K. The structure of corporate ownership: Causes and consequences. J. Polit. Econ. 1985, 93, 1155–1177. [Google Scholar] [CrossRef]
  21. Li, Z.F. Mutual Monitoring and Corporate Governance. J. Bank. Financ. Forthcom. 2014, 45, 255–269. [Google Scholar] [CrossRef]
  22. Verma, R.; Chowdhry, D.G. The Green Era: Influencing Positive Behavior Change Is Possible. VSRD Int. J. Tech. Tech. Res. 2019, 9, 37–38. Available online: http://www.vsrdjournals.com/docs/JAGRAN_INSTITUTE_OF_MANAGEMENT_VSRDIJBMR_ April_2019_Special_Issue.pdf (accessed on 4 May 2019).
  23. Verma, R.; Chowdhry, D.G. The Green Era: Indians have Increased Knowledge, Decreased Confusion and a Tempering of Individual Expectations. VSRD Int. J. Tech. Tech. 2018, 9, 132–133. Available online: http://www.vsrdjournals.com/docs/JAGRAN_ INSTITUTE_OF_MANAGEMENT_VSRDTNTR_February_2018_Special_Issue.pdf (accessed on 4 May 2019).
  24. Opariuc-Dan, C. Statistică aplicată în științele socio-umane. Noţiuni de bază—Statistici univariate. 2009, pp. 22–23. Available online: https://www.researchgate.net/profile/Cristian_Opariuc-Dan/publication/ 215691876_Applied_statistics_in_Socio-human_sciences_-_Beginnings_Univariate_statistics/links/0fcfd5006d9921d6f1000000/Applied-statistics-in-Socio-human-sciences-Beginnings-Univariate-statistics.pdf (accessed on 4 May 2019). (In Romanian).
  25. Sierra-Garcia, L.; Garcia-Benau, M.A.; Bollas-Araya, H.M. Empirical Analysis of Non-Financial Reporting by Spanish Companies. Adm. Sci. 2018, 8, 29. [Google Scholar] [CrossRef]
  26. Saenger, I. Disclosure and Auditing of Corporate Social Responsibility Standards: The Impact of Directive 2014/95/EU on the German Companies Act and the German Corporate Governance Code. In Corporate Governance Codes for the 21st Century; Du Plessis, J., Low, C., Eds.; Springer International Publishing: Springer, Cham, Switzerland, 2017. [Google Scholar] [CrossRef]
  27. Kinderman, D.P. The Struggle over the EU Non-Financial Disclosure Directive. WSI-Mitteilungen 2015, 8, 613–621. Available online: https://ssrn.com/abstract=2614983 (accessed on 4 May 2019).
  28. Carini, C.; Rocca, L.; Veneziani, M.; Teodori, C. Ex-Ante Impact Assessment of Sustainability Information–The Directive 2014/95. Sustainability 2018, 10, 560. [Google Scholar] [CrossRef]
  29. Herrador-Alcaide, T.; Hernández-Solís, M. Empirical Study Regarding Non-Financial Disclosure for Social Conscious Consumption in the Spanish E-Credit Market. Sustainability 2019, 11, 866. [Google Scholar] [CrossRef]
  30. Ruiz-Lozano, M.; Tirado-Valencia, P. Do industrial companies respond to the guiding principles of the Integrated Reporting framework? A preliminary study on the first companies joined to the initiative. Revista de Contabilidad 2016, 19, 252–260. [Google Scholar] [CrossRef] [Green Version]
  31. Venturelli, A.; Caputo, F.; Cosma, S.; Leopizzi, R.; Pizzi, S. Directive 2014/95/EU: Are Italian Companies Already Compliant? Sustainability 2017, 9, 1385. [Google Scholar] [CrossRef]
  32. Popescu, C.R.G.; Popescu, V.A.; Popescu, G.N. The entrepreneur’s role in the performance growth of the financial audit activity in Romania. Amfiteatru Econ. 2014, 17, 232–251. Available online: http://www.amfiteatrueconomic.ro/temp/Article_2382.pdf (accessed on 4 May 2019).
  33. Popescu, C.R.G.; Popescu, G.N.; Popescu, V.A. Assessment of the State of Implementation of Excellence Model Common Assessment Framework (CAF) 2013 by the National Institutes of Research—Development—Innovation in Romania. Amfiteatru Econ. 2017, 19, 41–60. Available online: http://www.amfiteatrueconomic.ro/temp/Articol_2593.pdf (accessed on 4 May 2019).
  34. Sebestova, J.; Krejčí, P.; Šiška, P. “Be or Not to Be”: A Dilemma of Business Policy Support on a Regional Level. Cent. Eur. Bus. Rev. 2018, 7, 3–13. [Google Scholar] [CrossRef]
  35. Popescu, C.R.G.; Popescu, G.N. Risks of cyber attacks on financial audit activity. Audit Financ. 2018, 16, 140–147. [Google Scholar] [CrossRef] [PubMed]
  36. Chowdhry, D.G.; Verma, R.; Mathur, M. The Evolution of Business in the Cyber-Age: Digital Transformation, Threats, and Security, 1st ed.; Apple Academic Press: Palm Bay, FL, USA, 2019; ISBN 9781771888103—CAT# K421815. [Google Scholar]
  37. Naidoo, V.; Verma, R. Green Marketing as a Positive Driver toward Business Sustainability; IGI Global: Hershey, PA, USA, 2019. [Google Scholar] [CrossRef]
  38. Popescu, V.A.; Popescu, G.N. Manualul inspectorului de salarii; Editura Gestiunea: Bucureşti, Romania, 2002. (In Romanian) [Google Scholar]
  39. Popescu, G.N.; Popescu, V.A.; Popescu, C.R.G. The Relations, Differences and Controversies between “Economic Growth”, “Economic Development” and “Sustainable Development”—The Case of Romania; Editura C.H. Beck: Bucharest, Romania, 2016. (In Romanian) [Google Scholar]
  40. Popescu, V.A.; Popescu, C.R.G.; Popescu, G.N. Societatea bazată pe cunoaştere: trecut, prezent şi viitor; Editura Mustang: Bucharest, Romania, 2011. (In Romanian) [Google Scholar]
  41. European Commission. Communication from the Commission to the European Parliament, the Council, the European Economic and Social Committee and the Committee of the Regions. Upgrading the Single Market: more opportunities for people and business. 2015. Available online: https://eur-lex.europa.eu/legal-content/EN/TXT/?uri=CELEX:52015DC0550 (accessed on 4 May 2019).
  42. European Commission. Commission Staff Working Document: A Single Market Strategy for Europe—Analysis and Evidence. Accompanying the Document: Upgrading the Single Market: More Opportunities for People and Business. 2015. Available online: https://eur-lex.europa.eu/legal-content/EN/TXT/?uri=CELEX%3A52015SC0202 (accessed on 4 May 2019).
  43. Popescu, G.N. Activitatea grupului de lucru: Răspunsuri profesioniste pentru auditorii financiari. Audit Financ. 2003, 3, 16–20. Available online: http://www.revista.cafr.ro/Revista-Audit-Financiar--Sumar (accessed on 4 May 2019). (In Romanian).
  44. Popescu, G.N.; Popescu, V.A. Manualul consultantului fiscal pentru impozitul pe venit şi contabilitatea în partidă simplă; Editura Gestiunea: Bucharest, Romania, 2002. (In Romanian) [Google Scholar]
  45. Popescu, G.N.; Popescu, V.A. Contabilitatea simplificată, armonizată cu directivele europene şi fiscalitatea societăţilor comerciale; Editura Gestiunea: Bucharest, Romania, 2000. (In Romanian) [Google Scholar]
  46. Popescu, G.N.; Popescu, V.A. Contabilitatea în partidă simplă; Editura Gestiunea: Bucharest, Romania, 2005. (In Romanian) [Google Scholar]
  47. Popescu, C.R.G. Teaching and Learning the Discipline “European Business Environment”: Proposal for an Interactive Approach; Editura C.H. Beck: Bucharest, Romania, 2016. [Google Scholar]
  48. Popescu, C.R.G. Analyzing the impact of Green Marketing Strategies on the Financial and Non-Financial Performance of Organizations—The Intellectual Capital Factor. In Green Marketing as a Positive Driver toward Business Sustainability; Naidoo, V., Verma, R., Eds.; IGI Global: Hershey, PA, USA, 2019; pp. 186–218. Available online: https://www.igi-global.com/chapter/analyzing-the-impact-of-green-marketing-strategies-on-the-financial-and-non-financial-performance-of-organizations/232654 (accessed on 4 May 2019).
  49. European Commission. A Deeper and Fairer Single Market—Factsheet. 2019. Available online: http://ec.europa.eu/DocsRoom/documents/13446/attachments/1/translations (accessed on 4 May 2019).
  50. European Commission. Commission Action Plan on Financing Sustainable Growth. 2018. Available online: https://ec.europa.eu/info/publications/180308-action-plan-sustainable-growth_en (accessed on 4 May 2019).
  51. Popescu, C.R.G. Contributions Regarding the Study and Evaluation of Interdependencies Between Key Factors in Increasing the Competitiveness; Editura Mustang: Bucharest, Romania, 2016. [Google Scholar]
  52. Popescu, C.R.G. Competitivitate în Complexitatea Noii Economii: Studiu de caz pe Situaţia Economică la Nivel Naţional şi Global; Editura Mustang: Bucharest, Romania, 2011. (In Romanian) [Google Scholar]
  53. Popescu, G.N.; Popescu, V.A. A. A Few Procedures Regarding the Audit and Control of Transferring Old Data Into a New Accountancy Information System. Knowledge, information and communication (Section: Information Systems Audit); In Proceedings of the 3rd International Conference Accounting and Management Information Systems AMIS 2008, Bucharest, Romania, 19–20 June 2008. The Bucharest University of Economic Studies, Romania, 2008; published in Revista Contabilitate şi Informatică de Gestiune Supliment. pp. 30–41. Available online: http://online-cig.ase.ro/jcig/DetNo.aspx?JAMIS=Supp/2008 (accessed on 4 May 2019).
  54. Popescu, G.N.; Popescu, V.A. Modelul francez de audit, sursă de inspiraţie. Audit financiar 2006, 2, 34–38. Available online: http://www.revista.cafr.ro/Revista-Audit-Financiar--Sumar (accessed on 4 May 2019). (In Romanian).
  55. European Commission. Corporate Social Responsibility & Responsible Business Conduct. 2019. Available online: https://ec.europa.eu/growth/industry/corporate-social-responsibility_en (accessed on 4 May 2019).
  56. Popescu, C.R.G. Competitivitatea în Noua Economie Globală: Să Învăţăm din Criza Actuală; Editura Mustang: Bucharest, Romania, 2011. (In Romanian) [Google Scholar]
  57. Popescu, V.A.; Popescu, C.R.G.; Popescu, G.N. Globalizarea din Perspectiva Crizei Mondiale; Editura Mustang: Bucharest, Romania, 2011. (In Romanian) [Google Scholar]
  58. Commission of the European Communities. Green Paper: Promoting a European framework for Corporate Social Responsibility. 2001. Available online: https://ec.europa.eu/transparency/regdoc/rep/ 1/2001/EN/1-2001-366-EN-1-0.Pdf (accessed on 4 May 2019).
  59. Commission Staff Working Document. A Single Market Strategy for Europe—Analysis and Evidence Accompanying the Document Upgrading the Single Market: More Opportunities for People and Business. 2015. Available online: https://eur-lex.europa.eu/legal-content/EN/TXT/?uri=CELEX% 3A52015SC0202 (accessed on 4 May 2019).
  60. European Commission. Commission Legislative Proposals on Sustainable Finance. 2018. Available online: https://ec.europa.eu/info/publications/180524-proposal-sustainable-finance_en (accessed on 4 May 2019).
  61. European Commission. Strengthening Banking Capacity to Support the Wider Economy: Capital Markets Union Action Plan: Overview of Progress Achieved and Next Steps. 2017. Available online: https://ec.europa.eu/info/business-economy-euro/growth-and-investment/capital-markets-union/capital-markets-union-action-plan/strengthening-banking-capacity-support-wider-economy_en (accessed on 4 May 2019).
  62. European Parliament. Lisbon European Council 23 and 24 March 2000: Presidency Conclusions. 2000. Available online: http://www.europarl.europa.eu/summits/lis1_en.htm (accessed on 4 May 2019).
  63. Commission of the European Communities. Communication to the Spring European Council: Working together for Growth and Jobs. A New Start for the Lisbon Strategy. 2005. Available online: https://eur-lex.europa.eu/LexUriServ/LexUriServ.do?uri=COM:2005:0024:FIN:EN:PDF (accessed on 4 May 2019).
  64. Commission of the European Communities. Communication from the Commission on the European Competitiveness Report 2008. 2008. Available online: https://eurlex.europa.eu/LexUriServ/LexUriServ.do?uri=COM:2008:0774:FIN:en:PDF (accessed on 4 May 2019).
  65. Commission of the European Communities. Commission Staff Working Document Accompanying Document to the Communication from the Commission on the European Competitiveness Report 2008. 2008. Available online: http://csdle.lex.unict.it/Archive/LW/Data%20reports%20and%20studies/Reports%20and%20%20communication%20from%20EU%20Commission/20130508-112829_sec-2853_2008_enpdf.pdf (accessed on 4 May 2019).
  66. European Commission. Launch of “European Alliance for Corporate Social Responsibility”. 2006. Available online: https://europa.eu/rapid/press-release_IP-06-358_en.htm (accessed on 4 May 2019).
  67. Deloitte. The Dark: What boards and executives don’t know about the health of their businesses; Deloitte: New York, NY, USA, 2004. [Google Scholar]
  68. Deloitte. The Dark II: What many boards and executives STILL don’t know about the health of their businesses; Deloitte: New York, NY, USA, 2007. [Google Scholar]
  69. OECD. OECD Symposium on Measuring and Reporting of Intellectual Capital: There is no Accounting for Intellectual Capital in Australia: A Review of Annual Reporting Practices and the Internal Measurement of Intangibles. 1999. Available online: https://www.oecd.org/sti/ind/ 1947783.pdf (accessed on 4 May 2019).
  70. OECD. Measuring and Reporting Intellectual Capital: Experience, Issues, and Prospects. 1999. Available online: http://www.oecd.org/sti/ind/2750309.pdf (accessed on 4 May 2019).
  71. OECD. Creating Value from Intellectual Assets: Meeting of the OECD Council at Ministerial Level. 2006. Available online: https://www.oecd.org/sti/inno/36701575.pdf (accessed on 4 May 2019).
  72. OECD. Intellectual Assets and Value Creation: Implications for Corporate Reporting. 2006. Available online: https://www.oecd.org/corporate/ca/corporategovernanceprinciples/37811196.pdf (accessed on 4 May 2019).
  73. OECD. Intellectual Assets and Value Creation: Synthesis Report. 2008. Available online: https://www.oecd.org/science/inno/40637101.pdf (accessed on 4 May 2019).
  74. OECD. New Sources of Growth: Knowledge-Based Capital. Key Analysis and Policy Conclusions. 2013. Available online: https://www.oecd.org/mcm/C-MIN (accessed on 4 May 2019).
  75. OECD. Corporate Reporting of Intangible Assets: A Progress Report. 2012. Available online: https://www.oecd.org/daf/ca/Intangible%20Assets.pdf (accessed on 4 May 2019).
  76. Popescu, C.R.G. Intellectual capital evaluation and measuring effectiveness—A Case Study on Romania’s Experience in terms of performance and excellence. INTED2019 Proceedings (Session: “E-content Management and Development”), Proceedings of the 13th annual International Technology, Education and Development Conference (INTED), Valencia, Spain, 11–13 March 2019. pp. 1042–1052. Available online: https://iated.org/inted/publications (accessed on 4 May 2019).
  77. Popescu, C.R.G. “Intellectual Capital”: Major Role, Key Importance and Decisive Influences on Organizations’ Performance. J. Hum. Res. Manag. Res. 2019. [CrossRef]
  78. Popescu, C.R.G. “Intellectual Capital”—Role, Importance, Components and Influences on the Performance of Organizations—A Theoretical Approach. In Education Excellence and Innovation Management through Vision 2020: From Regional Development Sustainability to Global Economic Growth, Proceedings of the 32nd International Business Information Management Association Conference, Seville, Spain, 15–16 November 2018; Soliman, K.S., Ed.; International Business Information Management Association (IBIMA): USA, 2018; pp. 7045–7059. [Google Scholar]
  79. Popescu, C.R.G.; Popescu, G.N. Methods of Evaluating “Intellectual capital” of an Organization and Ways of Enhancing Performance in the Knowledge-based Economy—A Synthetically Approach. In Education Excellence and Innovation Management through Vision 2020: From Regional Development Sustainability to Global Economic Growth, Proceedings of the 32nd International Business Information Management Association Conference, Seville, Spain, 15–16 November 2018; Khalid, S.S., Ed.; International Business Information Management Association (IBIMA): USA, 2018; pp. 7060–7074. [Google Scholar]
  80. Sveiby, K.E. The Intangible Assets Monitor. J. Hum. Res. Cost. Acc. 1997, 2, 73–97. [Google Scholar] [CrossRef]
  81. Stewart, T.A. Intellectual Capital: The New Wealth of Organizations; Doubleday/Currency: New York, NY, USA, 1997. [Google Scholar]
  82. Roos, J.; Roos, G.; Dragonetti, N.; Edvinsson, L. Intellectual Capital: Navigating in the New Business Landscape; Macmillan Publications: London, UK, 1997. [Google Scholar]
  83. Pike, S.; Roos, G. An introduction to intellectual capital. Works Inst. J. 2000, 42, 21–27. [Google Scholar]
  84. Schuler, R.S.; MacMillan, I.C. Gaining Competitive Advantage through Human Resource Management Practices. In Human Resource Management; John Wiley & Sons, Inc.: Hoboken, NJ, USA, 1984; Volume 23, pp. 241–255. [Google Scholar]
  85. Serenko, A.; Bontis, N. Investigating the current state and impact of the intellectual capital academic discipline. J. Intell. Cap. 2013, 14, 476–500. [Google Scholar] [CrossRef] [Green Version]
  86. Peters, R.H.; Taylor, L.A. Intangible capital and the investment-q relation. J. Financ. Econ. 2017, 123, 251–272. [Google Scholar] [CrossRef]
  87. Takeuchi, H.; Nonaka, I. The New Product Development Game. Harv. Bus. Rev. 1986, 285–305. [Google Scholar]
  88. Lev, B. Intangibles Management, Measurement, and Reporting; Brookings Institution Press: Washington, DC, USA, 2001. [Google Scholar]
  89. Edvinson, L.; Malone, M. Intellectual Capital: Realising your Company’s True Value by Finding Its’ Hidden Brainpower; Harper Collins: New York, NY, USA, 1997. [Google Scholar]
  90. European Commission. Communication from the Commission to the European Parliament, the Council, the European Economic and Social Committee and The Committee of the Regions: A renewed EU strategy 2011-14 for Corporate Social Responsibility. 2011. Available online: https://eur-lex.europa.eu/legal-content/EN/TXT/PDF/?uri=CELEX:52011DC0681&from=EN (accessed on 4 May 2019).
  91. Dumay, J.; La Torre, M.; Farneti, F. Developing trust through stewardship: Implications for intellectual capital, integrated reporting, and the EU Directive 2014/95/EU. J. Intell. Cap. 2019, 20, 11–39. [Google Scholar] [CrossRef]
  92. Zhang, Q.; Liu, Y. Employees’ Environmental Protection and Charitable Donation and Ethical Leadership: An Empirical Study. Int. J. Environ. Res. Public Health 2019, 16, 2282. [Google Scholar] [CrossRef] [PubMed]
  93. Kim, B.-J.; Nurunnabi, M.; Kim, T.-H.; Jung, S.-Y. The Influence of Corporate Social Responsibility on Organizational Commitment: The Sequential Mediating Effect of Meaningfulness of Work and Perceived Organizational Support. Sustainability 2018, 10, 2208. [Google Scholar] [CrossRef]
  94. Jia, Y.; Yan, J.; Liu, T.; Huang, J. How Does Internal and External CSR Affect Employees’ Work Engagement? Exploring Multiple Mediation Mechanisms and Boundary Conditions. Int. J. Environ. Res. Public Health 2019, 16, 2476. [Google Scholar] [CrossRef]
  95. Haris, M.; Yao, H.; Tariq, G.; Malik, A.; Javaid, H.M. Intellectual Capital Performance and Profitability of Banks: Evidence from Pakistan. J. Risk Financ. Manag. 2019, 12, 56. [Google Scholar] [CrossRef]
  96. Dey, R.K.; Hossain, S.Z.; Rezaee, Z. Financial Risk Disclosure and Financial Attributes among Publicly Traded Manufacturing Companies: Evidence from Bangladesh. J. Risk Financ. Manag. 2018, 11, 50. [Google Scholar] [CrossRef]
  97. Lajili, K. Corporate Risk Disclosure and Corporate Governance. J. Risk Financ. Manag. 2009, 2, 94–117. [Google Scholar] [CrossRef]
  98. Dhaliwal, D.S.; Li, O.Z.; Tsang, A.; Yang, Y.G. Voluntary nonfinancial disclosure and the cost of equity capital: The initiation of corporate social responsibility reporting. Acc. Rev. 2011, 86, 59–100. [Google Scholar] [CrossRef]
  99. Hooghiemstra, R. Corporate communication and impression management–new perspectives why companies engage in corporate social reporting. J. Bus. Ethics 2000, 27, 55–68. [Google Scholar] [CrossRef]
  100. Li, Q.; Luo, W.; Wang, Y.; Wu, L. Firm performance, corporate ownership, and corporate social responsibility disclosure in China. Bus. Ethics Eur. Rev. 2013, 22, 159–173. [Google Scholar] [CrossRef]
  101. Parlamentul României. Legea nr. 162/2017 din 6 iulie 2017 Privind Auditul Statutar al Situaţiilor Financiare Anuale şi al Situaţiilor Financiare Anuale Consolidate şi de Modificare a Unor acte Normative, Monitorul oficial nr. 548 din 12 Iulie; Parlamentul României: Bucharest, Romania, 2017. (In Romanian) [Google Scholar]
  102. The CSR Report: Cele 680 de companii din Romania obligate sa raporteze nonfinanciar. Available online: www.slideshare.net/TheCSRReport/cele-680-de-companii-din-romania-obligate-sa-raporteze-nonfinanciar (accessed on 4 May 2019).
  103. Chelcea, S. Metodologia Cercetării Sociologice: Metode Cantitative și Calitative; Editura Economică: Bucureşti, Romania, 2001. (In Romanian) [Google Scholar]
  104. Fisher, R.A. Statistical methods and scientific induction. J. R. Stat. Soc. Ser. B 1955, 17, 69–78. [Google Scholar] [CrossRef]
  105. Gallistel, C.R. The Organization of Learning; MIT Press: Cambridge, MA, USA, 1990. [Google Scholar]
  106. Gigerenzer, G. The bounded rationality of probabilistic mental models. In Rationality: Psychological and philosophical perspectives; Manktelow, K.I., Over, D.E., Eds.; Routledge: London, UK, 1993; pp. 284–313. [Google Scholar]
  107. Cohen, J. Statistical Power Analysis for the Behavioral Sciences, 2nd ed.; Lawrence Erlbaum: New Jersey, NJ, USA, 1988. [Google Scholar]
  108. Hopkins, W.G. A New View of Statistics. Internet Society for Sport Science. 2000. Available online: http://www.sportsci.org/resource/stats/ (accessed on 4 May 2019).
  109. Opariuc-Dan, C. Statistică aplicată în ştiinţele socio-umane. Analiza relațiilor și a diferențelor dintre variabile. 2011. Available online: https://www.scribd.com/document/168883602/Statistica-Aplicata -in-Stiintele-Socio-umane-Volume-2-Romanian (accessed on 4 May 2019). (In Romanian).
  110. Li, F. Endogeneity in CEO power: A survey and experiment. Investig. Anal. J. 2016, 45, 149–162. [Google Scholar] [CrossRef]
  111. Sturges, H.A. The Choice of a Class Interval. J. Am. Stat. Assoc. 1926, 21, 65–66. [Google Scholar] [CrossRef]
Figure 1. Distribution of the degree of compliance by legal form. Source: Own development from SPSS 14.0.
Sustainability 11 05146 g001
Figure 2. Distribution of the degree of compliance by legal form. Source: Own development from SPSS 14.0.
Sustainability 11 05146 g002
Figure 3. Distribution of the degree of compliance by activity branches. Source: Own development from SPSS 14.0.
Sustainability 11 05146 g003
Figure 4. Distribution of the degree of compliance by groups of employees. Source: Own development from SPSS 14.0.
Sustainability 11 05146 g004
Figure 5. Distribution of the degree of compliance by groups of turnover. Source: Own development from SPSS 14.0.
Sustainability 11 05146 g005
Table 1. Descriptive Statistics of associations 1.
AssociationsCases
ValidMissingTotal
Publication of the report * Legal form246100.0%00.0%246100.0%
Publication of report * Form of ownership246100.0%00.0%246100.0%
Publication of the report * Branch of activity246100.0%00.0%246100.0%
Publication of report * Number of employees246100.0%00.0%246100.0%
Publication of the report * Turnover groups246100.0%00.0%246100.0%
Publication of the report * Location (Development Areas)246100.0%00.0%246100.0%
1 The sign “*”is generated by SPSS and has the role of separating the variables subject to processing (namely, analysis, association, and so on, as the case may be). Source: Own development from SPSS 14.0.
Table 2. Publication of the report * Legal form Crosstabulation 1.
Legal formTotal
Limited Liability CompanyJoint-stock CompanyAutonomous AdministrationOther Legal Forms
Publication of the reportNOCount8280292
% within Publication of the report89.1%8.7%0.0%2.2%100.0%
% within Legal form58.2%8.7%0.0%33.3%37.4%
% of Total33.3%3.3%0.0%0.8%37.4%
YESCount598474154
% within Publication of the report38.3%54.5%4.5%2.6%100.0%
% within Legal form41.8%91.3%100.0%66.7%62.6%
% of Total24.0%34.1%2.8%1.6%62.6%
TotalCount1419276246
% within Publication of the report57.3%37.4%2.8%2.4%100.0%
% within Legal form100.0%100.0%100.0%100.0%100.0%
% of Total57.3%37.4%2.8%2.4%100.0%
1 The sign “*”is generated by SPSS and has the role of separating the variables subject to processing (namely, analysis, association, and so on, as the case may be). Source: Own development from SPSS 14.0.
Table 3. Chi-Square Tests (H1).
ValuedfAsymp. Sig. (2-sided)
Pearson Chi-Square62.54830.000
Likelihood Ratio71.53530.000
Linear-by-Linear Association39.98810.000
N of Valid Cases246
Source: Own development from SPSS 14.0.
Table 4. Directional Measures (H1).
ValueAsymp. Std. ErrorApprox. T(b)Approx. Sig.
Nominal by NominalLambdaSymmetric0.2440.0932.4220.015
Publication of the report Dependent0.2500.1121.9520.051
Legal form Dependent0.2380.0992.1090.035
Goodman and Kruskal tauPublication of the report Dependent0.2540.047 0.000
Legal form Dependent0.2080.041 0.000
Source: Own development from SPSS 14.0.
Table 5. Symmetric Measures (H1).
ValueApprox. Sig.
Nominal by NominalPhi0.5040.000
Cramer’s V0.5040.000
Contingency Coefficient0.4500.000
N of Valid Cases246
Source: Own development from SPSS 14.0.
Table 6. Publication of the report * Owner Crosstabulation 1.
Form of ownershipTotal
Romanian Capital Without the Romanian StateThe Romanian State is the Majority OwnerForeign CapitalForeign and Romanian Capital without the Romanian StateForeign Capital and the Romanian State
Publication of the reportNOCount420482092
% within Publication of the report45.7%0.0%52.2%2.2%0.0%100.0%
% within Form of ownership48.8%0.0%41.7%40.0%0.0%37.4%
% of Total17.1%0.0%19.5%.8%0.0%37.4%
YESCount44366734154
% within Publication of the report28.6%23.4%43.5%1.9%2.6%100.0%
% within Form of ownership51.2%100.0%58.3%60.0%100.0%62.6%
% of Total17.9%14.6%27.2%1.2%1.6%62.6%
TotalCount863611554246
% within Publication of the report35.0%14.6%46.7%2.0%1.6%100.0%
% within Form of ownership100.0%100.0%100.0%100.0%100.0%100.0%
% of Total35.0%14.6%46.7%2.0%1.6%100.0%
1 The sign “*”is generated by SPSS and has the role of separating the variables subject to processing (namely, analysis, association, and so on, as the case may be). Source: Own development from SPSS 14.0.
Table 7. Chi-Square Tests (H2).
ValuedfAsymp. Sig. (2-sided)
Pearson Chi-Square29.64340.000
Likelihood Ratio43.05740.000
Linear-by-Linear Association1.42110.233
N of Valid Cases246
Source: Own development from SPSS 14.0.
Table 8. Directional Measures (H2).
ValueAsymp. Std. ErrorApprox. TApprox. Sig.
Nominal by NominalLambdaSymmetric0.0000.000
Publication of the report Dependent0.0000.000
Form of ownership Dependent0.0000.000
Goodman and Kruskal tauPublication of the report Dependent0.1200.017 0.000
Form of ownership Dependent0.0340.009 0.000
Source: Own development from SPSS 14.0.
Table 9. Symmetric Measures (H2).
ValueApprox. Sig.
Nominal by NominalPhi0.3470.000
Cramer’s V0.3470.000
Contingency Coefficient0.3280.000
N of Valid Cases246
Source: Own development from SPSS 14.0.
Table 10. Publication of the report * Legal form Crosstabulation 1.
Branch of ActivityTotal
Basic Materials, Construction IndustryConsumer GoodsConsumer ServicesOil and gasTechnology and Telecommunications
Publication of the reportNOCount2719390792
% within Publication of the report29.3%20.7%42.4%0.0%7.6%100.0%
% within Branch of activity29.3%79.2%40.2%0.0%23.3%37.4%
% of Total11.0%7.7%15.9%0.0%2.8%37.4%
YESCount65558323154
% within Publication of the report42.2%3.2%37.7%1.9%14.9%100.0%
% within Branch of activity70.7%20.8%59.8%100.0%76.7%62.6%
% of Total26.4%2.0%23.6%1.2%9.3%62.6%
TotalCount922497330246
% within Publication of the report37.4%9.8%39.4%1.2%12.2%100.0%
% within Branch of activity100.0%100.0%100.0%100.0%100.0%100.0%
% of Total37.4%9.8%39.4%1.2%12.2%100.0%
1 The sign “*”is generated by SPSS and has the role of separating the variables subject to processing (namely, analysis, association, and so on, as the case may be). Source: Own development from SPSS 14.0.
Table 11. Chi-Square Tests (H3).
ValuedfAsymp. Sig. (2-sided)
Pearson Chi-Square25.08540.000
Likelihood Ratio25.98440.000
Linear-by-Linear Association0.22610.635
N of Valid Cases246
Source: Own development from SPSS 14.0.
Table 12. Directional Measures (H3).
ValueAsymp. Std. ErrorApprox. TApprox. Sig.
Nominal by NominalLambdaSymmetric0.0870.0481.7430.081
Publication of the report Dependent0.1520.0492.9060.004
Branch of activity Dependent0.0470.0730.6320.528
Goodman and Kruskal tauPublication of the report Dependent0.1020.034 0.000
Branch of activity Dependent0.0190.009 0.001
Source: Own development from SPSS 14.0.
Table 13. Symmetric Measures (H3).
ValueApprox. Sig.
Nominal by NominalPhi0.3190.000
Cramer’s V0.3190.000
Contingency Coefficient0.3040.000
N of Valid Cases246
Source: Own development from SPSS 14.0.
Table 14. Publication of report * Number of employees (grouped into groups) 1.
The number of employees, systematized by size groupsTotal
Up to 11031103-22062207-33093310-44124413-55155516-66186619-7721Over 7721
Publication of the reportNOCount671840100292
% within Publication of the report72.8%19.6%4.3%0.0%1.1%0.0%0.0%2.2%100.0%
% within The number of employees, systematized by size groups42.7%33.3%26.7%0.0%25.0%0.0%0.0%33.3%37.4%
% of Total27.2%7.3%1.6%0.0%0.4%0.0%0.0%0.8%37.4%
YESCount90361163314154
% within Publication of the report58.4%23.4%7.1%3.9%1.9%1.9%0.6%2.6%100.0%
% within The number of employees, systematized by size groups57.3%66.7%73.3%100.0%75.0%100.0%100.0%66.7%62.6%
% of Total36.6%14.6%4.5%2.4%1.2%1.2%.4%1.6%62.6%
TotalCount157541564316246
% within Publication of the report63.8%22.0%6.1%2.4%1.6%1.2%0.4%2.4%100.0%
% within The number of employees, systematized by size groups100.0%100.0%100.0%100.0%100.0%100.0%100.0%100.0%100.0%
% of Total63.8%22.0%6.1%2.4%1.6%1.2%.4%2.4%100.0%
1 The sign “*”is generated by SPSS and has the role of separating the variables subject to processing (namely, analysis, association, and so on, as the case may be). Source: Own development from SPSS 14.0.
Table 15. Chi-Square Tests (H4).
ValuedfAsymp. Sig. (2-sided)
Pearson Chi-Square9.265(a)70.234
Likelihood Ratio12.68870.080
Linear-by-Linear Association4.73910.029
N of Valid Cases246
Source: Own development from SPSS 14.0.
Table 16. Publication of the report * Turnover (grouped by system) 1.
Turnover GroupsTotal
Up to 117 Million Euros118-233234-350351-467468-584585-700701-817Over 817 Million Euros
Publication of the reportNOCount78621021292
% within Publication of the report84.8%6.5%2.2%1.1%0.0%2.2%1.1%2.2%100.0%
% within Turnover groups42.6%20.0%25.0%14.3%0.0%66.7%50.0%20.0%37.4%
% of Total31.7%2.4%0.8%0.4%0.0%0.8%0.4%0.8%37.4%
YESCount10524663118154
% within Publication of the report68.2%15.6%3.9%3.9%1.9%0.6%0.6%5.2%100.0%
% within Turnover groups57.4%80.0%75.0%85.7%100.0%33.3%50.0%80.0%62.6%
% of Total42.7%9.8%2.4%2.4%1.2%0.4%0.4%3.3%62.6%
TotalCount183308733210246
% within Publication of the report74.4%12.2%3.3%2.8%1.2%1.2%0.8%4.1%100.0%
% within Turnover groups100.0%100.0%100.0%100.0%100.0%100.0%100.0%100.0%100.0%
% of Total74.4%12.2%3.3%2.8%1.2%1.2%0.8%4.1%100.0%
1 The sign “*”is generated by SPSS and has the role of separating the variables subject to processing (namely, analysis, association, and so on, as the case may be). Source: Own development from SPSS 14.0.
Table 17. Chi-Square Tests (H5).
ValuedfAsymp. Sig. (2-sided)
Pearson Chi-Square12.453(a)70.087
Likelihood Ratio14.17670.048
Linear-by-Linear Association3.23910.072
N of Valid Cases246
Source: Own development from SPSS 14.0.
Table 18. Directional Measures (H5).
ValueAsymp. Std. ErrorApprox. T(b)Approx. Sig.
Nominal by NominalLambdaSymmetric0.0060.0140.4470.655
Publication of the report Dependent0.0110.0240.4470.655
Turnover groups Dependent0.0000.000
Goodman and Kruskal tauPublication of the report Dependent0.0510.023 0.088
Turnover groups Dependent0.0210.012 0.000
Source: Own development from SPSS 14.0.
Table 19. Publication of the report * Location (systematized by development areas) 1.
Location (Development Areas)Total
nesesmsvvnvcB IL
Publication of the reportNOCount6494149153192
% within Publication of the report6.5%4.3%9.8%4.3%15.2%9.8%16.3%33.7%100.0%
% within Location (Development Areas)31.6%30.8%42.9%28.6%53.8%36.0%40.5%34.1%37.4%
% of Total2.4%1.6%3.7%1.6%5.7%3.7%6.1%12.6%37.4%
YESCount139121012162260154
% within Publication of the report8.4%5.8%7.8%6.5%7.8%10.4%14.3%39.0%100.0%
% within Location (Development Areas)68.4%69.2%57.1%71.4%46.2%64.0%59.5%65.9%62.6%
% of Total5.3%3.7%4.9%4.1%4.9%6.5%8.9%24.4%62.6%
TotalCount1913211426253791246
% within Publication of the report7.7%5.3%8.5%5.7%10.6%10.2%15.0%37.0%100.0%
% within Location (Development Areas)100.0%100.0%100.0%100.0%100.0%100.0%100.0%100.0%100.0%
% of Total7.7%5.3%8.5%5.7%10.6%10.2%15.0%37.0%100.0%
1 The sign “*”is generated by SPSS and has the role of separating the variables subject to processing (namely, analysis, association, and so on, as the case may be). Source: Own development from SPSS 14.0.
Table 20. Chi-Square Tests (H6).
ValuedfAsymp. Sig. (2-sided)
Pearson Chi-Square4.86570.676
Likelihood Ratio4.78370.686
Linear-by-Linear Association0.00410.948
N of Valid Cases246
Source: Own development from SPSS 14.0.

