Sustainability Assessment of Combined Cooling, Heating, and Power Systems under Carbon Emission Regulations

Glorious Sun School of Business and Management, Donghua University, Shanghai 200051, China
*
Author to whom correspondence should be addressed.
Sustainability 2019, 11(21), 5917; https://doi.org/10.3390/su11215917
Submission received: 18 September 2019
/
Revised: 21 October 2019
/
Accepted: 23 October 2019
/
Published: 24 October 2019
(This article belongs to the Special Issue Developing Multi-Energy Systems: Technologies, Methods and Models)
Abstract
:The combined cooling, heating, and power (CCHP) system, which is a sustainable distributed energy system, has attracted increasing attention due to the associated economic, environmental, and energy benefits. Currently, the enforcement of carbon emission regulations has become an increasingly concerning issue globally. In this paper, a multi-objective optimization model is established to evaluate the CCHP system under two different carbon emission regulation policies in terms of economic benefit, environmental sustainability, and energy advantage. A nonlinear programming optimization model is formulated and solved by using the particle swarm optimization (PSO) algorithm. The results from the case studies demonstrate that when considering carbon tax regulation, the cost savings of the optimal CCHP system strategy were on average 10.0%, 9.1%, 17.0%, 22.1%, and 20.9% for the office, supermarket, hotel, school, and hospital in China, respectively, compared with the conventional energy supply system. On the other hand, when considering carbon trading regulation, the optimal CCHP system strategy can lead to a 10.0%, 8.9%, 16.8%, 21.6%, and 20.5% cost-saving for the five different building categories, respectively. Furthermore, the optimal CCHP system strategy for the five buildings, i.e., an average of 39.6% carbon dioxide emission (CDE) reduction and 26.5% primary energy consumption (PEC) saving, can be achieved under carbon emission regulations.
1. Introduction
With the rise of industry and population in the world, it is estimated that the global energy demand will increase by 37% from 2013 to 2035 [1]. Statistically, about 70% of the generated electricity was produced by burning fossil fuels from conventional power plants in 2012 [2]. As a result, worldwide greenhouse gas (GHG) emissions have been increasing, and global warming is becoming a serious threat to future generations [3]. In recent years, the combined cooling, heating, and power (CCHP) system as a sustainable distributed energy system has gained considerable popularity compared to conventional power systems for energy supply, due to several advantages, e.g., higher overall energy efficiency, lower pollution emissions, lower cost, resource sustainability, and flexible adaption for the ratio of electricity to heating [4,5].
The single performance (e.g., economic, environmental criteria) of CCHP systems can be improved by optimal configurations and operation strategies [6,7,8,9]. For example, Ahn et al. [10] focused on performance analysis for CCHP systems based on different time period operational costs and payback periods by considering various local climates, power generation equipment sizes, and utility tariff structures. Since carbon dioxide emission is related to global warming, He et al. [11] proposed a low-carbon cost optimization model considering the constraints of electric and natural gas characters to reduce CO2 emission. Zhang et al. [12] explored the exergetic and exergoeconomic assessment of the CCHP system firing biogas and natural gas coupled with a ground source heat pump (GSHP) under different ratios of gas mass and key parameters (i.e., fuel prices, service life, biomass, and natural gas cost).
Actually, the different performances of CCHP systems are related to each other. To study the tradeoff among various criteria, a comprehensive evaluation of the CCHP system could be established to achieve system energy efficiency [13,14,15]. Feng et al. [16] compared the two CCHP systems under three operation strategies with the objectives of the energy-saving rate, CO2 emission reduction, and operation cost reduction. Wang et al. [17] described the 4E (e.g., energy, exergy, exergoeconomic, and environmental) criteria investigating the performance of a CCHP gas turbine system assisted by solar. Wang et al. [18] studied the energy dispatch optimization problem of a solar-driven CCHP system and formulated a multi-objective model with average useful output and total heat transfer area as performance criteria. When uncertainties are considered, He et al. [19] developed a novel interval multi-objective decision-making method based on sustainability performance to rank the alternative CCHP systems. In addition, Hu and Cho [20] presented a stochastic model to optimize the CCHP system to minimize cost, CO2 emission, and primary energy consumption, and then the CCHP system operation strategy for office buildings in different cities were analyzed in the case study. However, the influences of government policies on the multi-objective assessment of CCHP systems are less characterized and analyzed.
In addition, policy is one of the key aspects impacting the performances of the CCHP system, such as the feed-in tariff policy and carbon emission regulations. In particular, carbon emission regulations (e.g., carbon tax policy, carbon trading mechanism, and carbon offset policy) cannot be neglected because government-related policies have been developing rapidly. For example, a carbon trading market for national electricity sectors was established in China in 2017 [21]. The impacts of different carbon regulatory policies have been studied in various optimization problems, such as the biodiesel supply chains manage problem [22], production configuration problem [23], and green supply chain design problem [24].
Currently, studies regarding the effect of carbon emission regulations on the optimal CCHP system based on economic performance have emerged. In current literature, most studies are carried out to optimize and evaluate CCHP systems considering only one kind of carbon emission policy [25,26,27,28]. For instance, considering the carbon tax policy, Zeng et al. [27] proposed a novel off-design optimization model to study CCHP coupled with the GSHP system while annual primary energy saving ratio (PESR), carbon dioxide emission reduction ratio (CDERR), and cost-saving ratio (COSR) were adopted as a comprehensive optimization objective. Li et al. [28] focused on the effects of carbon trading and feed-in electricity tariff policies on the criteria of the CCHP system, based on economic, energy, and environmental aspects. Then, residential buildings were used to illustrate the efficiency of the model under five operation strategies. Therefore, it is of great importance to incorporate both carbon tax and carbon trading mechanisms into the CCHP system optimization problem.
To the best of authors’ knowledge, few studies have investigated the impacts of different carbon emission regulations and building categories on the multi-objective assessment of the CCHP system. To fill this gap in the literature, the economic benefit, environmental sustainability, and energy advantage of the CCHP system for different building categories considering different carbon emission regulations are studied. To achieve this goal, a nonlinear programming (NLP) model is established to optimize the CCHP system operating problem. The particle swarm optimization (PSO) algorithm is adopted to solve the NLP model. The potential benefits regarding COSR, CDERR, and PESR for the CCHP system compared to the separate system are tested. In the case studies, the economic, environmental, and energy performances of the optimal CCHP system are evaluated under carbon tax and carbon trading regulations for five different commercial building categories (i.e., office, supermarket, hotel, school, and hospital) in Shanghai, China.
The proposed research has three major contributions, as follows:
- (1).
- A multi-objective optimization model is presented to evaluate the CCHP system under carbon tax and carbon trading regulations.
- (2).
- The PSO algorithm is applied to solve the proposed NLP model with the purpose of fast convergence speed and high solving efficiency.
- (3).
- The economic benefits, environmental sustainability, and energy advantage of the CCHP system based on COSR, CDERR, and PESR are analyzed and compared for the different building categories.
2. Problem Description
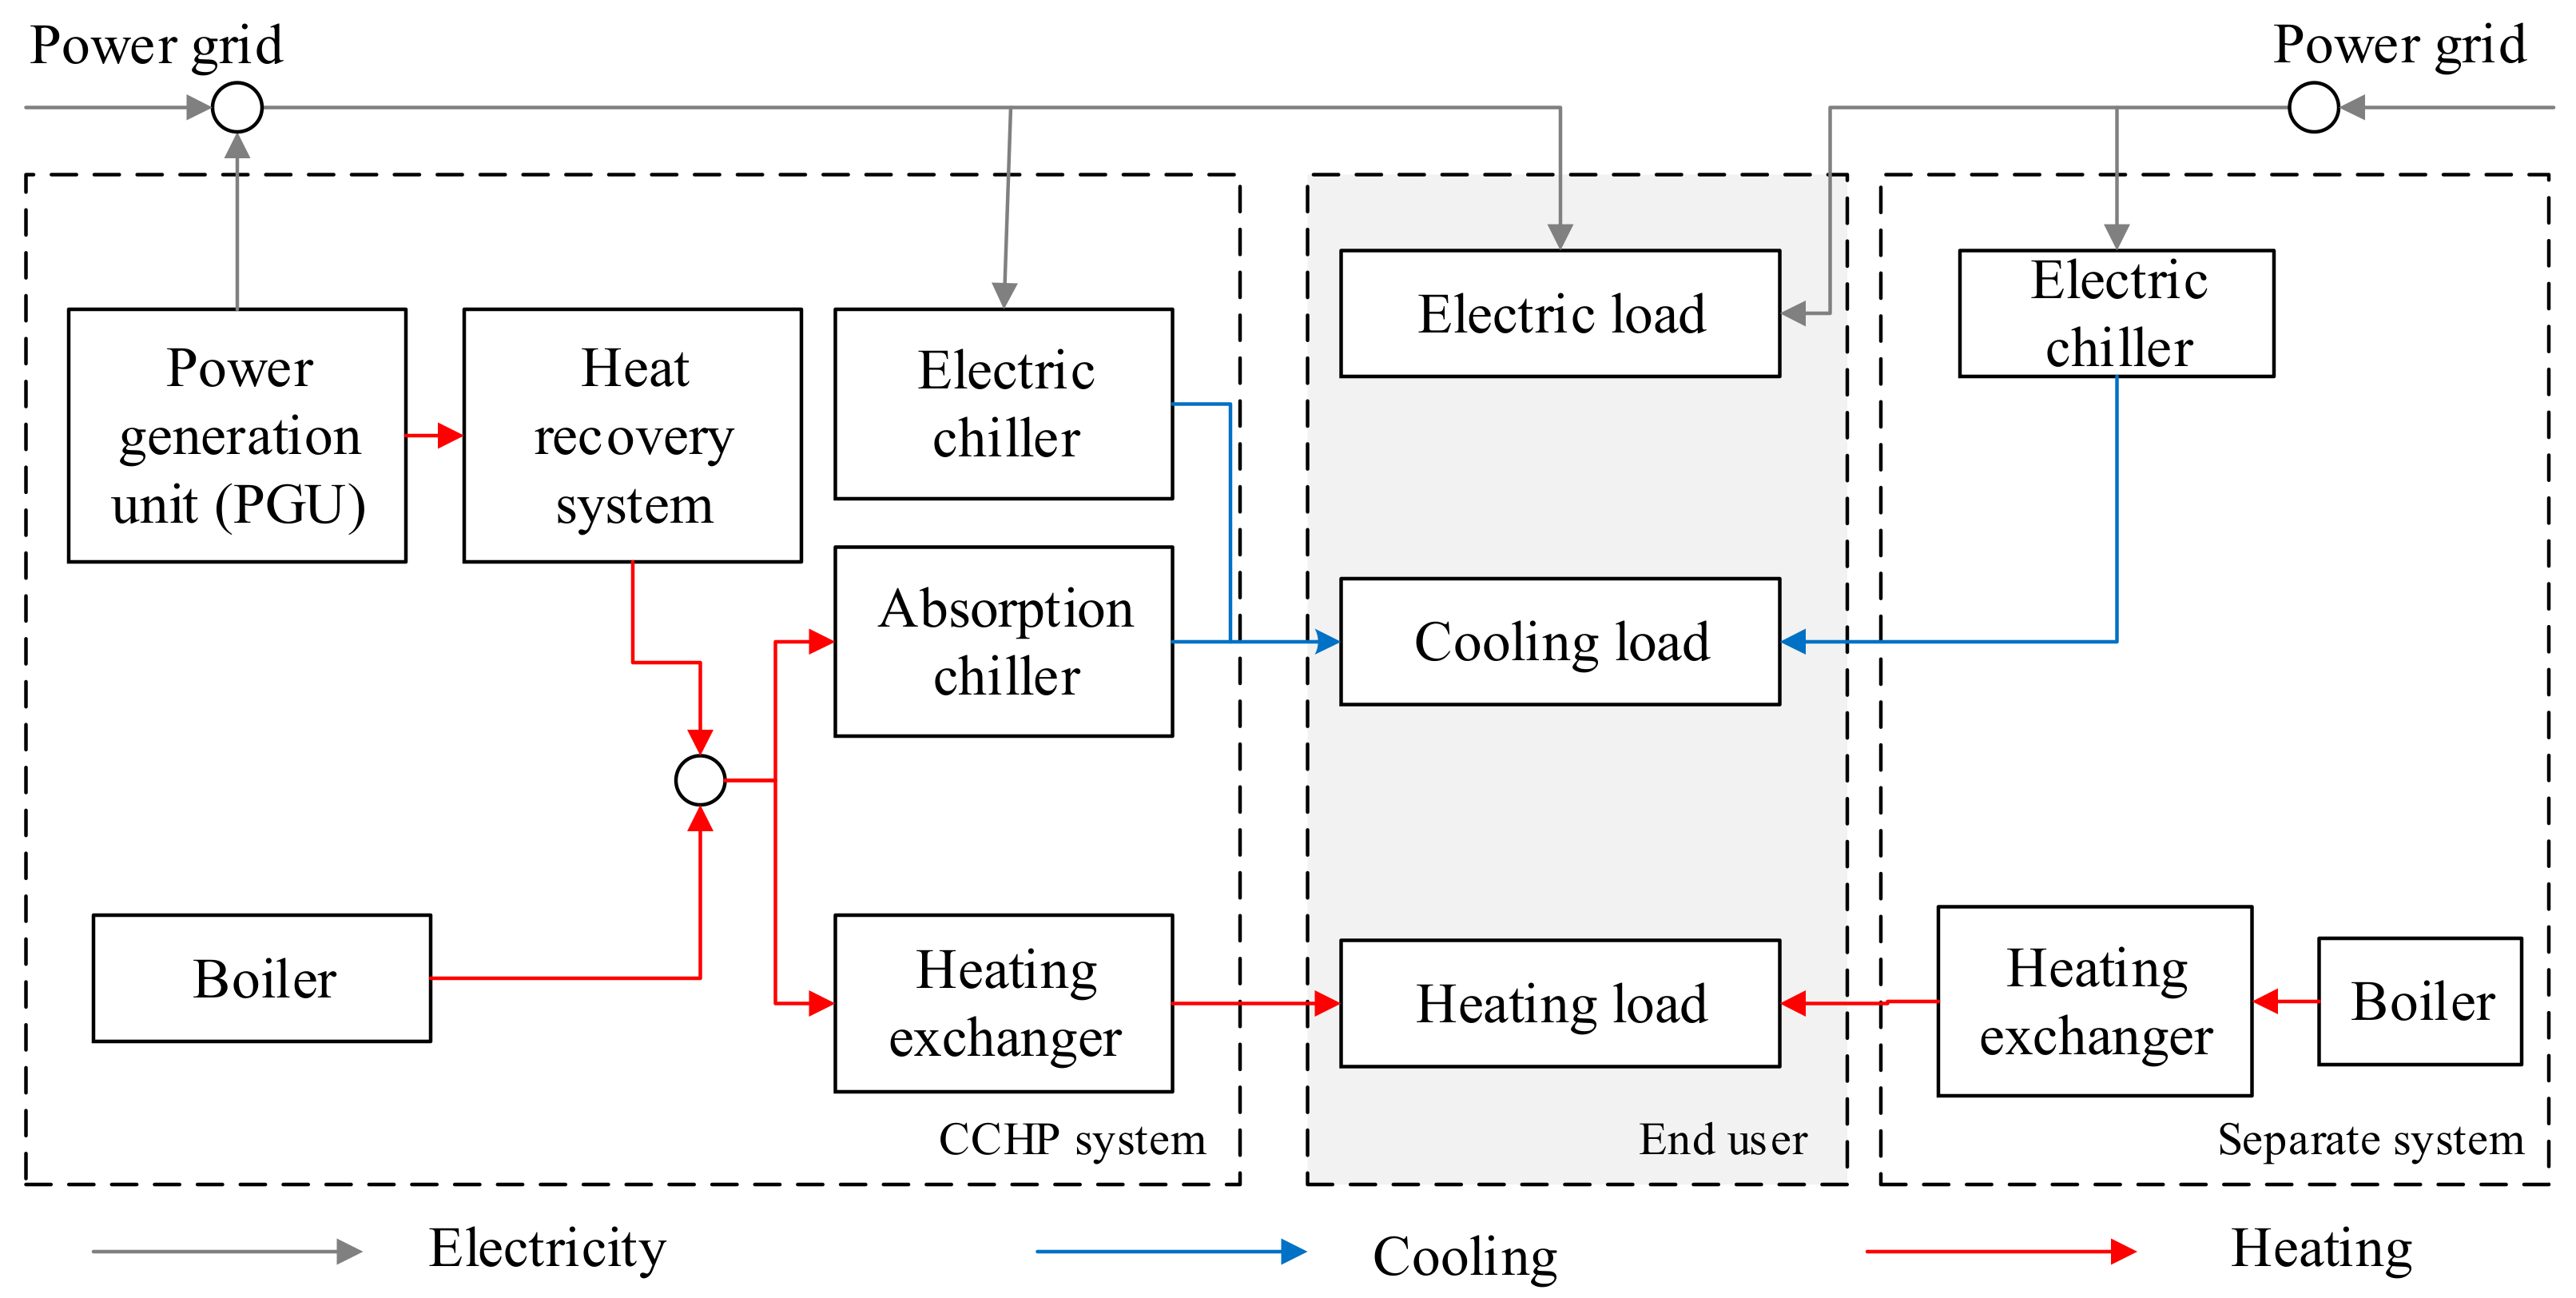
Figure 1 displays a schematic of the typical CCHP system. The PGU (power generation unit) supplies the electricity by firing natural gas to the end-user and generates waste heat energy recovered by the heat recovery system to the heating exchanger and absorption chiller. In addition, the end-user electricity demand also can be satisfied from the power grid. The end-user cooling demand can be provided through the electric chiller and absorption chiller. The end-user heating demand (e.g., space water heating, hot water) can be satisfied by the heating exchanger. The auxiliary boiler is used to offer the remaining heat when the heat recovery system cannot afford end-user thermal load. To investigate the performance advantages of the CCHP system, a separate system is presented and is also shown in Figure 1. In the separate system, the electricity, cooling, and thermal loads are satisfied by the conventional power grid, electric chiller, and boiler, respectively.
According to Kang et al. [25] and Li et al. [28], the correlation between the heat and electricity of PGU is assumed to be linear, and the detailed state of the CCHP system is shown in Figure 2. The horizontal coordinate represents the electric energy from PGU firing fuel in the CCHP system, and the vertical coordinate denotes the recovered heating. The solid red line represents the numerical relation between recovered heat and electricity from the PGU. The PGU operates following this red line. The heating and electricity demands of end-users are always changing. Thus, there is a mismatch between energy supply and demand. Therefore, energy dispatch optimization is important, and it is valuable to achieve an optimal operation strategy.
In Figure 2, the PGU will not work when the electricity demand of the end-user is zero; otherwise, the heat and electricity are presented in the following ways: Region (1) shows that the electricity demand and heating load of the end-user can be satisfied from the local power grid and boiler, respectively. For example, the PGU will operate at point A′ instead of point A. Region (2) signifies the heat from the recovered PGU and electricity from the PGU as well as the power grid, such as the PGU will operate at point B′ rather than point B. In Region (3), the electricity is from the PGU, and the heat is from the recover heat and boiler. For example, the CCHP system will operate at point C′ instead of point C. Region (4) shows that the PGU works at capacity load. Thus, the rest of the electricity demand can be purchased from the local power grid, and the remaining heating demand can be imported from the boiler. For instance, the PGU operates at a capacity load (point D′) instead of point D.
Figure 1 and Figure 2 demonstrate the structure and energy flow between the CCHP system and the power grid. The objective of this research is to identify the optimal strategy for CCHP systems for end-users considering carbon tax and carbon trading policies based on economic, environmental, and energy performances. In the case studies, five different residential buildings in Shanghai were used to investigate whether the CCHP system can achieve COSR, CDERR, and PESR compared with the separate system. It should be pointed out that the effects of carbon tax and carbon trading regulations on the sustainability assessment are analyzed in the case studies.
3. Mathematical Model
An NLP model was developed to study the energy dispatch optimization problem of the CCHP system by considering economic, environmental, and energy aspects under different carbon emission regulations. According to Afzali and Mahalec [29], a mathematical model was formulated to solve the optimal problem of the CCHP system based on the law of energy conservation. The nomenclatures in the mathematical model are shown in Table 1.
3.1. Constraints
Using these parameters and variables, the NLP model for the CCHP system operation problem was formulated, and the energy balances, consisting of electricity balance, heating balance, and cooling balance, are expressed as Constraints (1)–(12).
As for the electricity balance, Constraint (1) shows that the electricity from PGU firing natural gas equals fuel consumption with natural gas to electricity conversion parameters. Constraint (2) ensures that the sum of electricity from PGU and procured from the power grid can be used to satisfy the electricity demand and electric chiller consumption. Constraint (3) represents that the electricity demand of the end-user must be satisfied.
With regard to the heating/cooling balance, Constraint (4) means that the heating energy from the PGU and boiler in the CCHP system can be delivered to the heat exchanger and absorption chiller. The heating energy is generated from the PGU and boiler, as shown in Constraints (5) and (6). Constraints (7) and (8) describe that the cooling energy from electric chiller and absorption chiller equals the electricity and heating consumption multiplied by the conversion parameters, respectively. Constraint (9) indicates that the cooling generated by the hybrid chiller is provided for the cooling demand of end-user. Constraint (10) shows that the cooling generated by the absorption chiller is assumed to account for fifty percent in total cooling energy. Constraint (11) states that the heating energy generated by the heating exchanger should satisfy the heating demand of the end-user. In addition, Constraint (12) defines the decision variables.
3.2. Carbon Emission Regulations
Carbon tax and carbon trading regulations are enforced in most countries. A carbon tax policy is that a tax is imposed on the amount of total emission based on the CO2 emission tax price. Moreover, according to UN IPCC, the carbon tax price adopted in some developed countries is $20–$100/ton. The carbon trading mechanism, where a carbon trading market is developed, is another widely adopted carbon emission regulation. The government gives the user a certain amount of carbon emission allowances, and the user can purchase or sell parts of the allowance to keep its operation. Ideally, the carbon trading price is flexible according to the market supply and demand relation.
3.3. Objective Functions
3.3.1. Economic Assessment
To measure the economic benefit of the CCHP system over the separate system, COSR, namely the percentage of the reducing (cost) of the CCHP system, in contrast to the separate system, is selected to evaluate the economic performance. As the optimization objective of the CCHP system, maximal COSR is expressed by Formula (13). represents the minimal cost of boiler consumed fuel and power grid purchased electricity in the separate system, which is expressed as Equation (14). In addition, equals to , , representing the cost of the CCHP system operation under no carbon emission regulations, under carbon tax regulation, and under carbon trading regulation, respectively. represents the natural gas price and denotes the electricity price.
In the CCHP system, the cost contains the natural gas cost from PGU and boiler consumption and electricity cost from the power grid. denotes the basic cost of the CCHP system without carbon emission regulations, which can be calculated from Equation (15).
With the carbon tax regulation, in addition to the cost, a carbon tax cost depending on (carbon dioxide emission) and (carbon tax price) is also added to the cost. Hence, can be calculated from Equation (16) and can be obtained from Equation (17). and are the carbon emission conversion factors of natural gas and electricity, respectively.
Considering the carbon trading policy, a carbon trading cost is added to the cost. indicates the government allocating carbon emission allowances for users, and is the trading price. The carbon emission allowances are assigned by the government and different values of are permitted. It signifies that the end-user can sell or purchase carbon allowances to maintain its operation. represents the cost of the CCHP system under carbon trading policy, which can be described as Equation (18).
3.3.2. Environmental Assessment
It is of great importance that fuel is used more efficiently to reduce environmental damage and improve environmental sustainability. Generally, global warming is regarded as an important and key environmental issue which is closely related to CO2. Therefore, in this research, the CDERR is adopted to denote the environmental sustainability index. Referring to the definition of COSR, the amount of CDERR means the environmental benefits accomplished by using the CCHP system over the separate system. Maximal CDERR is regarded as the objective and can be obtained from objective Function (19), to ensure the best environmental sustainability of the CCHP system.
The carbon dioxide emission (CDE) of the CCHP system contains the carbon dioxide from the PGU and boiler firing natural gas, and public power grid burning fossil fuel. denotes the carbon dioxide emission from the power grid, PGU, and boiler fuel consumption in the CCHP system. represents the minimal carbon dioxide emission for burning fuel from the power grid and boiler in the separate system. Hence, and can be calculated via Equations (20) and (21), respectively.
3.3.3. Energy Assessment
To evaluate the energy benefits of the CCHP system, the PESR is chosen as the energy index. Similarly, PESR is introduced as the proportion of the (primary energy consumption) saved in the CCHP system, compared with the separate system. Function (22) is used to calculate the maximal , which is selected as one of the optimization objectives.
is the primary energy consumption from the PGU and boiler firing natural gas, and power grid burning fossil fuel in the CCHP system. represents the lowest primary energy consumption (PEC) from the boiler and power grid burning fuel in the separate system. Furthermore, can be calculated from Equation (23) and can be obtained from Equation (24). and represent the site-to-primary energy conversion factors of fuel and electricity, respectively.
4. Solution Approach
The NLP model is formulated for the multi-objective CCHP optimization problem under different carbon emission regulations. The NLP program is an NP-hard problem and needs heavy computational time. Therefore, the heuristic algorithm can be used to solve the NLP program with higher computational efficiency. As one of the popular heuristic algorithms, the PSO algorithm has obtained much attention. The PSO algorithm proposed by Kennedy and Eberhart can address the limitations of nonlinear and discrete decision variables [30,31]. Furthermore, the PSO algorithm has been broadly applied to solve a large variety of optimization problems owing to its good performance within a reasonable time and fast convergence rate, e.g., green lock scheduling problem [32], irrigation and power production management [33], and transportation network problem [34].
Therefore, the PSO algorithm is applied in this work to search for the near-optimal dispatch strategy for the CCHP system. In the PSO algorithm, each candidate solution of the CCHP operational strategy is considered as a particle in the swarm. The population size is denoted by . Each particle is characterized by a location vector and a velocity vector , and it can move around the searching space over iterations.
A series of numbers is randomly generated for all decision variables from their ranges as the initial solution. The position and velocity can be updated according to the Equations (25)–(27).
Here, and represent and iteration, respectively. are positive learning factors and , are randomly generated from 0 to 1. is the inertia weight and is used to control the convergence behavior of the PSO. and signify the maximal and minimal inertia weight, respectively. is the maximal number of iterations. is the particle’s best solution depending on its experience in the iteration. represents the global best position of the entire swarm according to total swarm’s historical experience in the iteration.
By using the PSO algorithm, the near-optimal strategy for the CCHP system can be obtained. The implementation of the PSO algorithm can be depicted briefly as follows:
- Step 1: Input the parameters of the PSO algorithm, including , , , , , .
- Step 2: Generate initial position and velocity of each particle randomly.
- Step 3: Update the position and velocity .
- Step 4: Calculate the fitness of each particle according to the objective function.
- Step 5: Update iteration number .
- Step 6: Update pbest and gbest .
- Step 7: If , return Step 5; otherwise, proceed with Step 8.
- Step 8: Output the optimal solution.
5. Case Studies
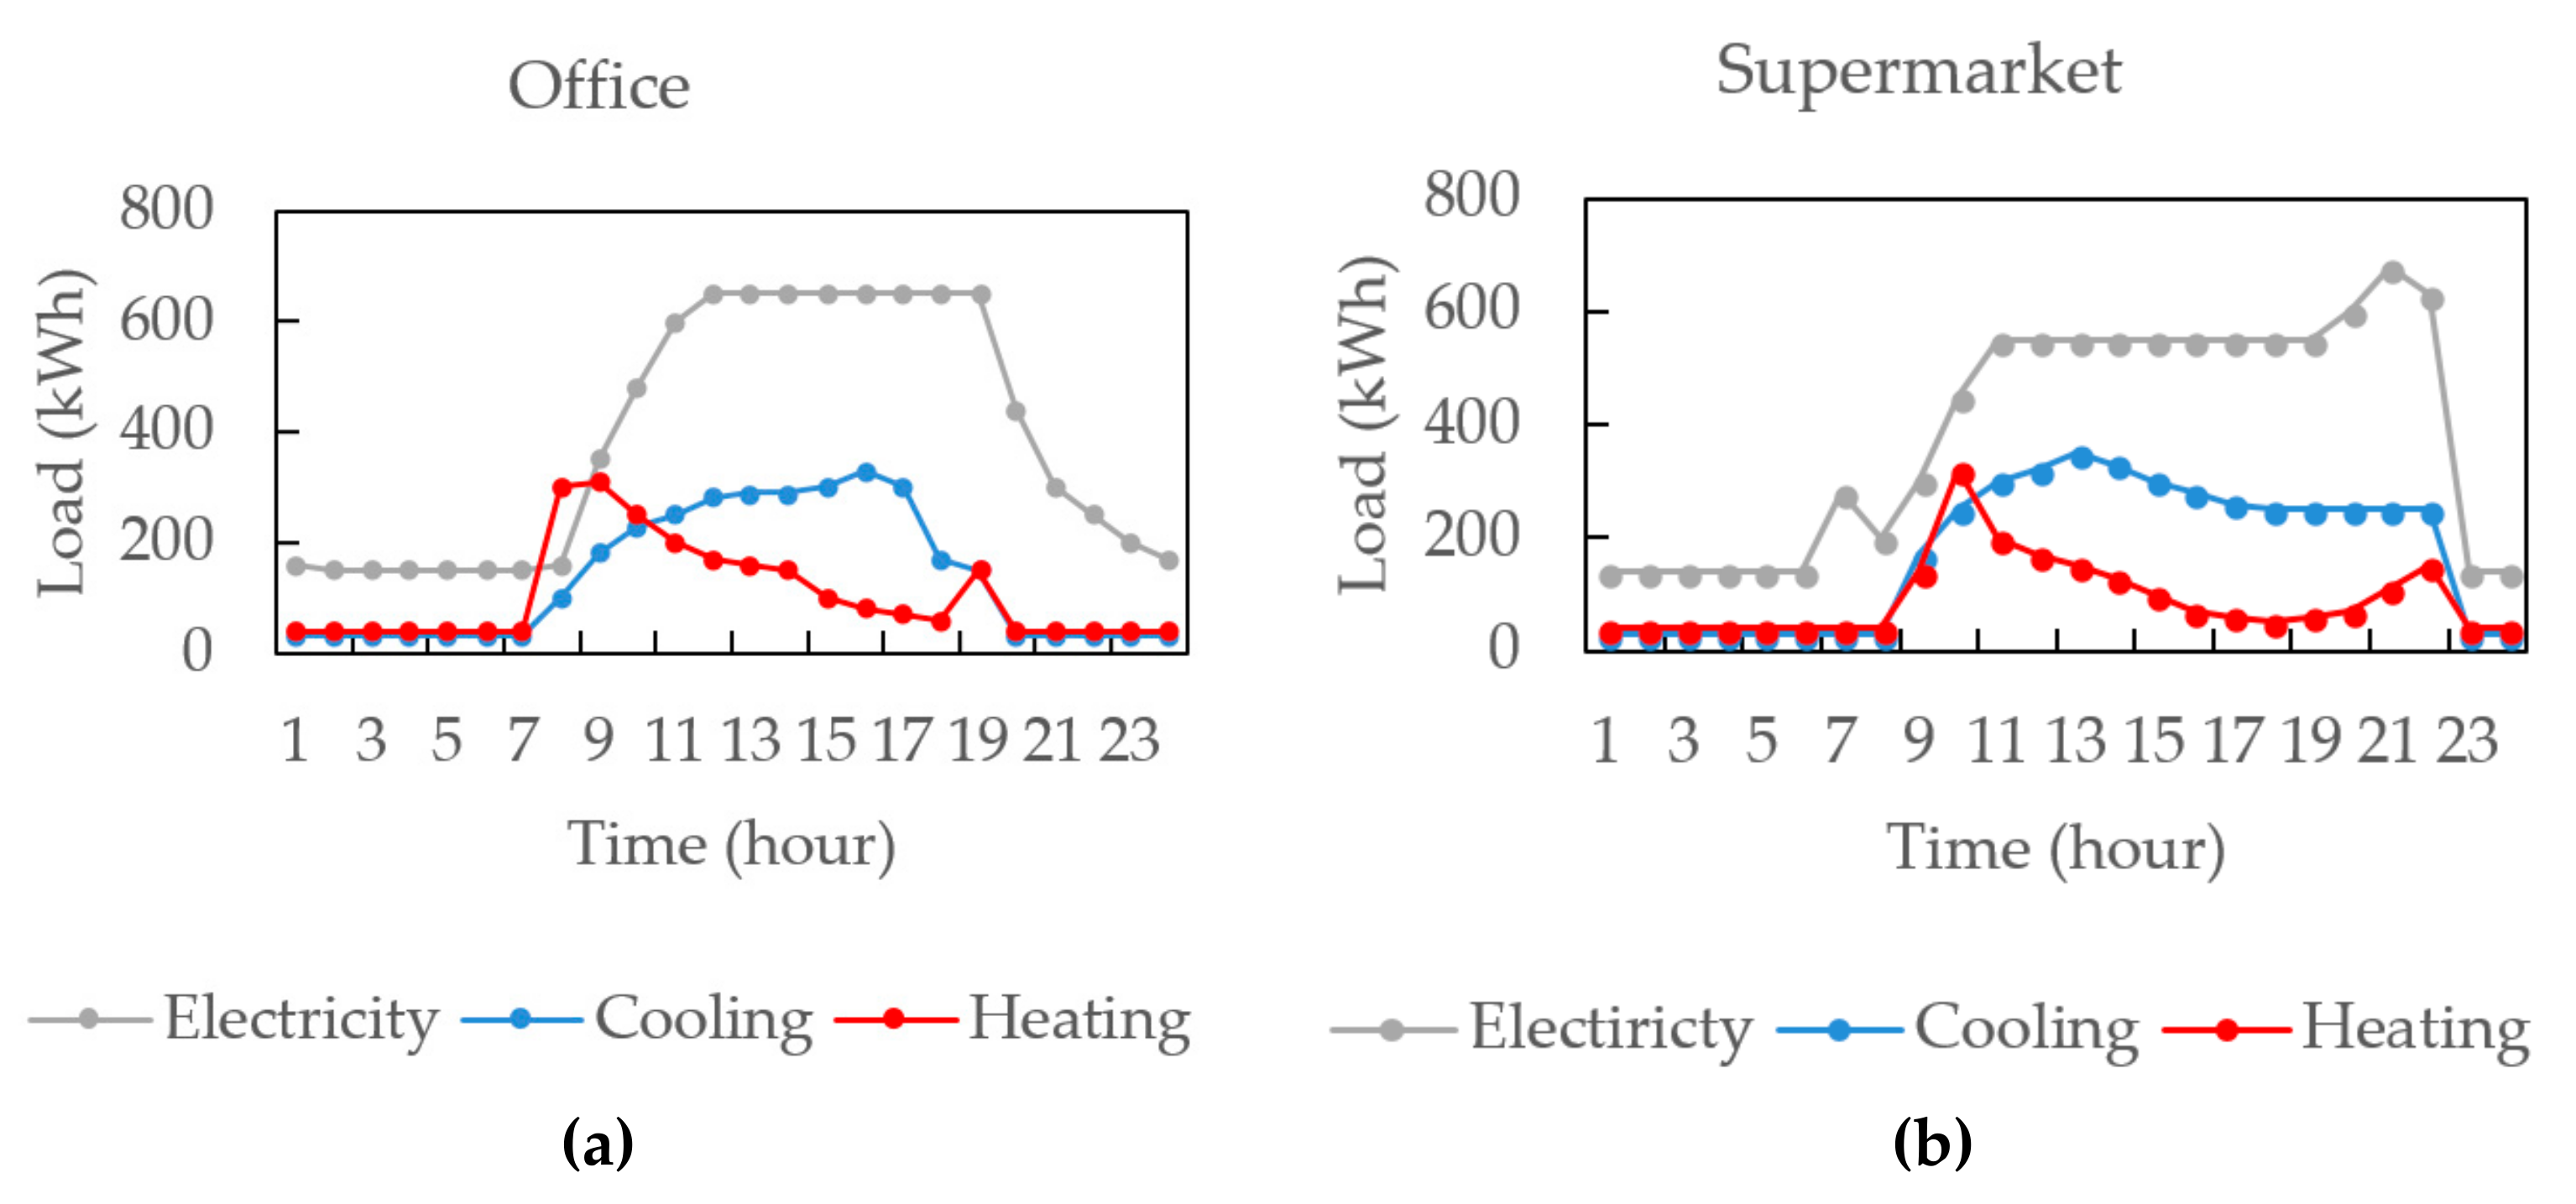
To investigate the sustainability assessment of the CCHP system with economic, environmental, and energy aspects using the formulated NLP model, the five different commercial building categories (i.e., office, supermarket, hotel, school, and hospital) were selected for analysis, which are all located in Shanghai, China. According to Jing et al. [35], the electrical loads during different seasons are similar, while the heating and cooling loads vary dramatically according to building categories. In addition, buildings almost have lower heating demands in the summer season and lower cooling demands in the winter season. Therefore, in the transition seasons, one-day energy demand profiles of the buildings are complex. Owing to space limitation, the economic benefit, environmental sustainability, and energy advantage of adopting CCHP systems for the office, supermarket, hotel, school, and hospital in transition seasons were investigated.
5.1. Pre-Set Parameters
In the CCHP system, input technical parameters have been summarized in Table 2 [36,37]. The commercial electric price and natural gas price of Shanghai are shown in Table 3 [38]. Carbon emission conversion parameters of electricity and fuel in Shanghai and primary energy consumption parameters [39] are also set in Table 3. The system configuration and parameters were considered to be the same for the five commercial buildings. The 24 h electricity, cooling, and heating loads of the office, supermarket, hotel, school, and hospital of Shanghai in a typical transition season are shown in Figure 3 [35]. In addition, the value of parameters in the separate system was the same as the values in the CCHP system.
For the carbon emission regulations, the carbon tax price is comparatively lower in developing countries, such as China [40]. In the case studies, a carbon tax fee varying from $1/ton to $30/ton was adopted in subsequent performance analysis. The carbon trading price was assumed to be constant in a stable trading market [28]. A trading price variation range of $1/ton to $10/ton and carbon emission allowances from the set [0.6, 0.7, 0.8, 0.9, 1.0] were chosen in the subsequent performance analysis.
The optimization problems are solved in MATLAB by using the PSO algorithm, and the optimal schedule for the CCHP system can be obtained. By trying different parameter combinations, 2000 and 200 were selected as a reasonable population size and a maximal number of iterations to balance the optimal strategy and computational cost. The and were assumed as 2; the and were adopted to be 0.9 and 0.4, respectively. The computer used was a laptop with an Intel(R) Core(TM) i5–5200U CPU @ 2.20GHz processor, and a 4GB memory.
5.2. Economic Performance Analysis
5.2.1. No Carbon Emission Regulations
When the carbon emission regulations are not taken into consideration, COSR of the optimal CCHP system over the separate system is shown in Figure 4. The cost savings of the office, supermarket, hotel, school, and hospital were 9.3%, 8.2%, 16.0%, 20.3%, and 19.5% by using the CCHP system, respectively. It is observed that the cost-saving ratio for the school using the CCHP system was higher than other buildings. The reason is that the energy loads of the school are usually larger than other buildings and then can be supplied more by the CCHP system, which leads to further cost-savings obtained.
5.2.2. Analysis of Carbon Tax Regulation
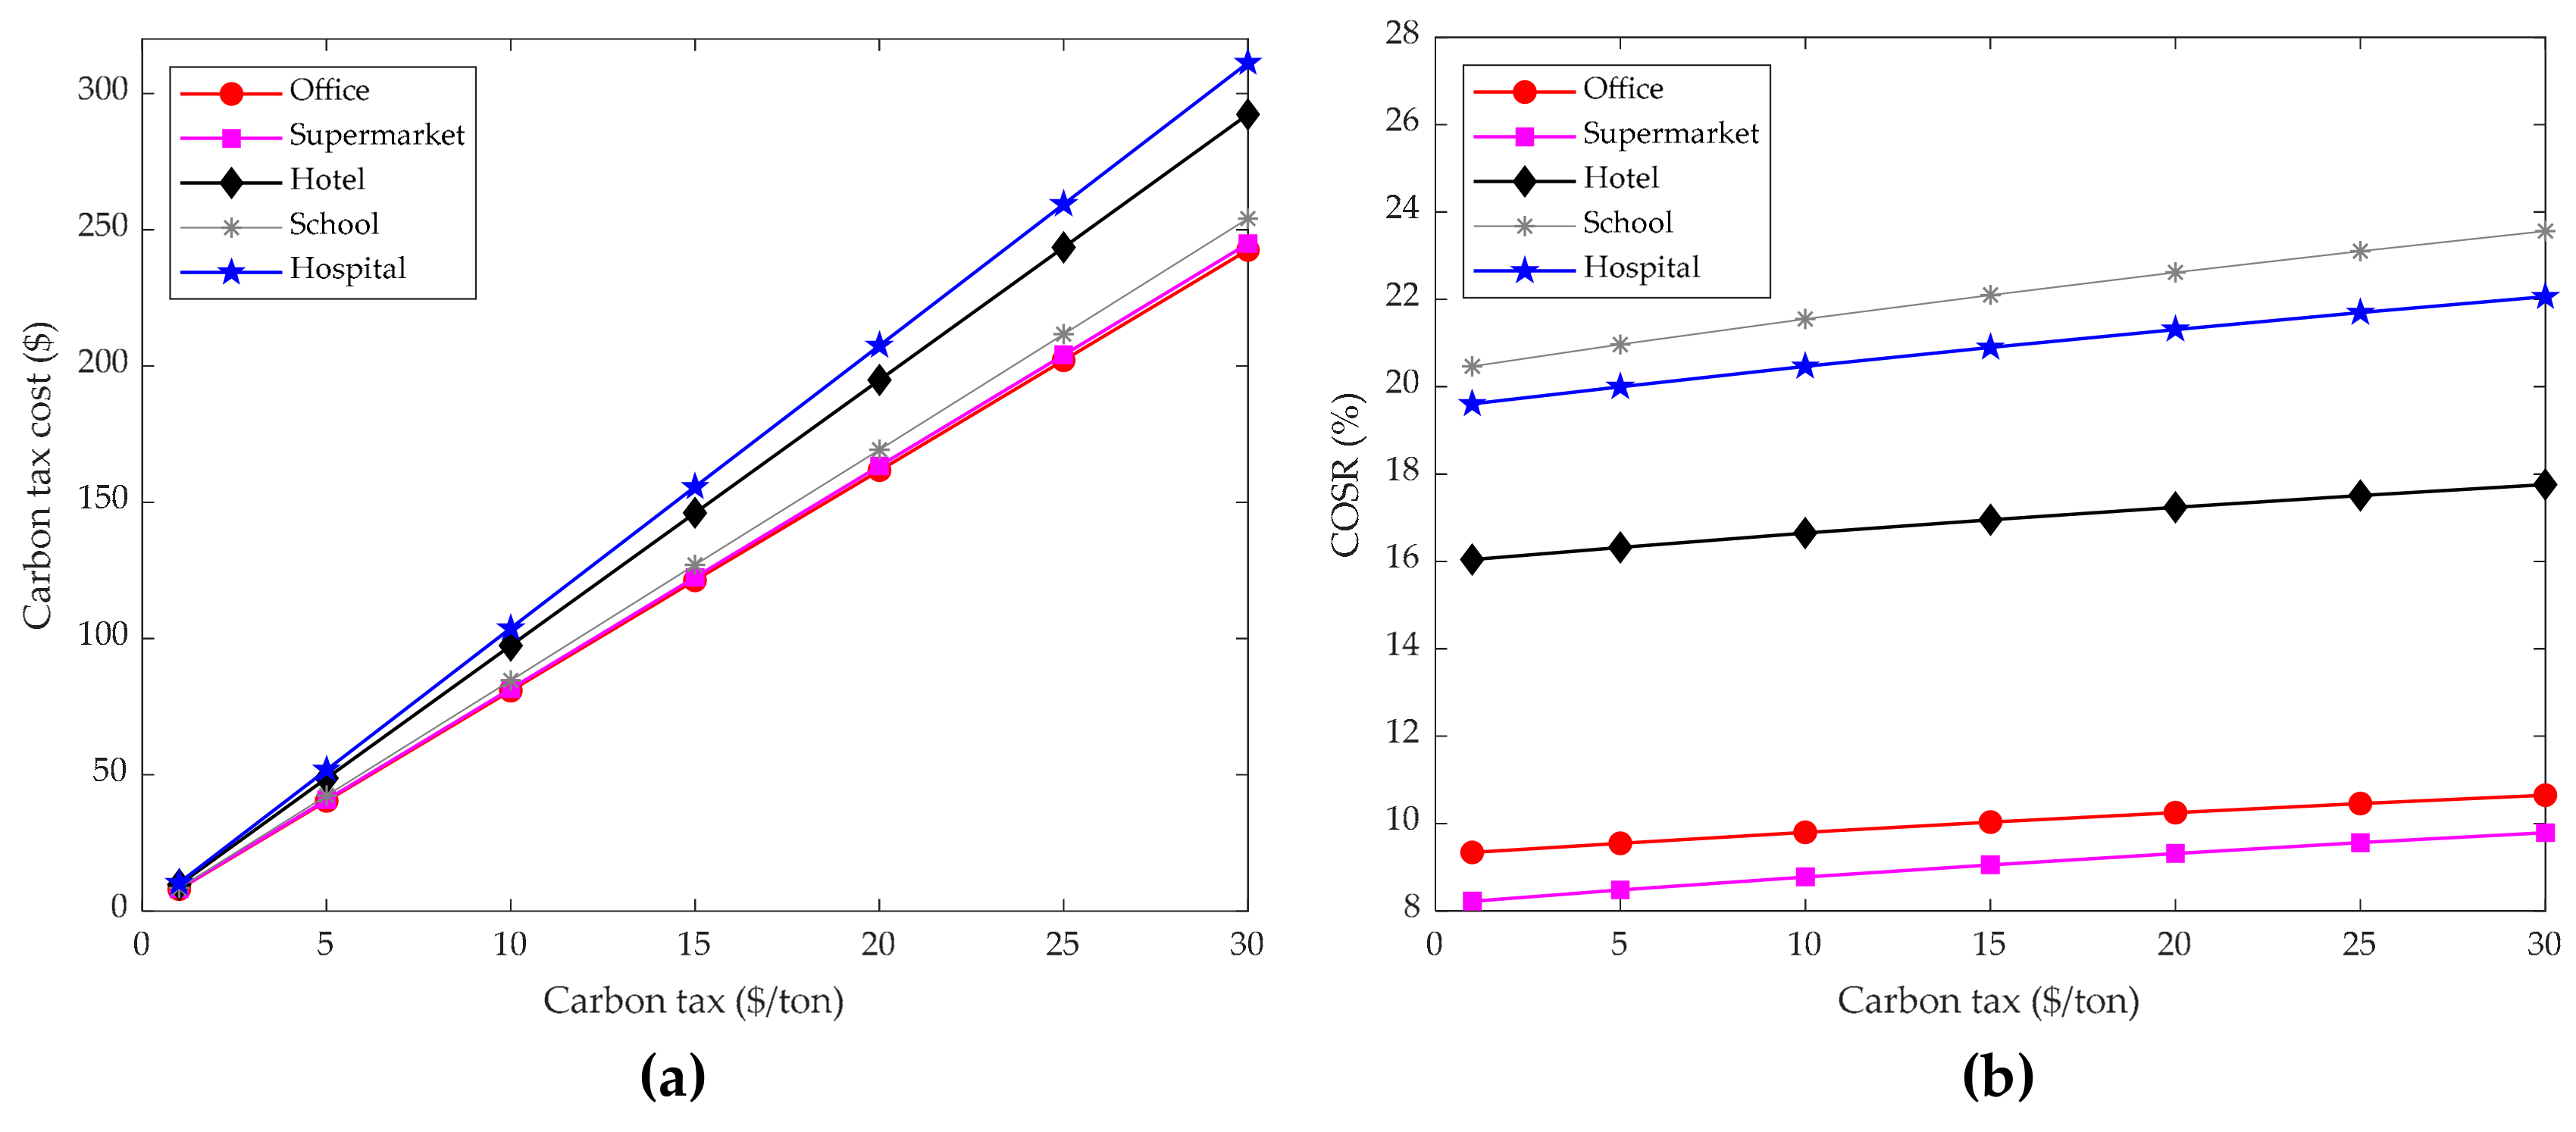
Considering carbon tax regulation, Figure 5 illustrates the influence of different carbon taxes on carbon tax cost and COSR of the CCHP system for the five different commercial buildings in Shanghai when the objective is to maximize COSR. Figure 5a reveals that the carbon tax cost increased linearly with carbon tax per unit changing, and it can be observed that the amount of carbon emission for the optimal decision variables was not impacted by carbon tax ranging from $1/ton to $30/ton. Figure 5b indicates that the COSR of the office, supermarket, hotel, school, and hospital increased when the carbon tax was from $1/ton to $30/ton. Figure 5a,b also show that carbon tax policy had less influence on the office and supermarket because the carbon emissions of the two building categories was less than other buildings.
Furthermore, it can be observed from Figure 5 that the office, supermarket, hotel, school, and hospital could achieve averagely cost savings of 10.0%, 9.1%, 17.0%, 22.1%, and 20.9% by adopting the CCHP system considering carbon tax policy, respectively. Comparing the results in Figure 4 to the ones in Figure 5, it can be observed that the five different building categories using the CCHP system had a higher cost-saving ratio which increased by 0.7%, 0.9%, 1.0%, 1.8%, and 1.4% under the carbon tax policy than the situation without carbon emission regulations, respectively.
5.2.3. Analysis of Carbon Trading Regulation
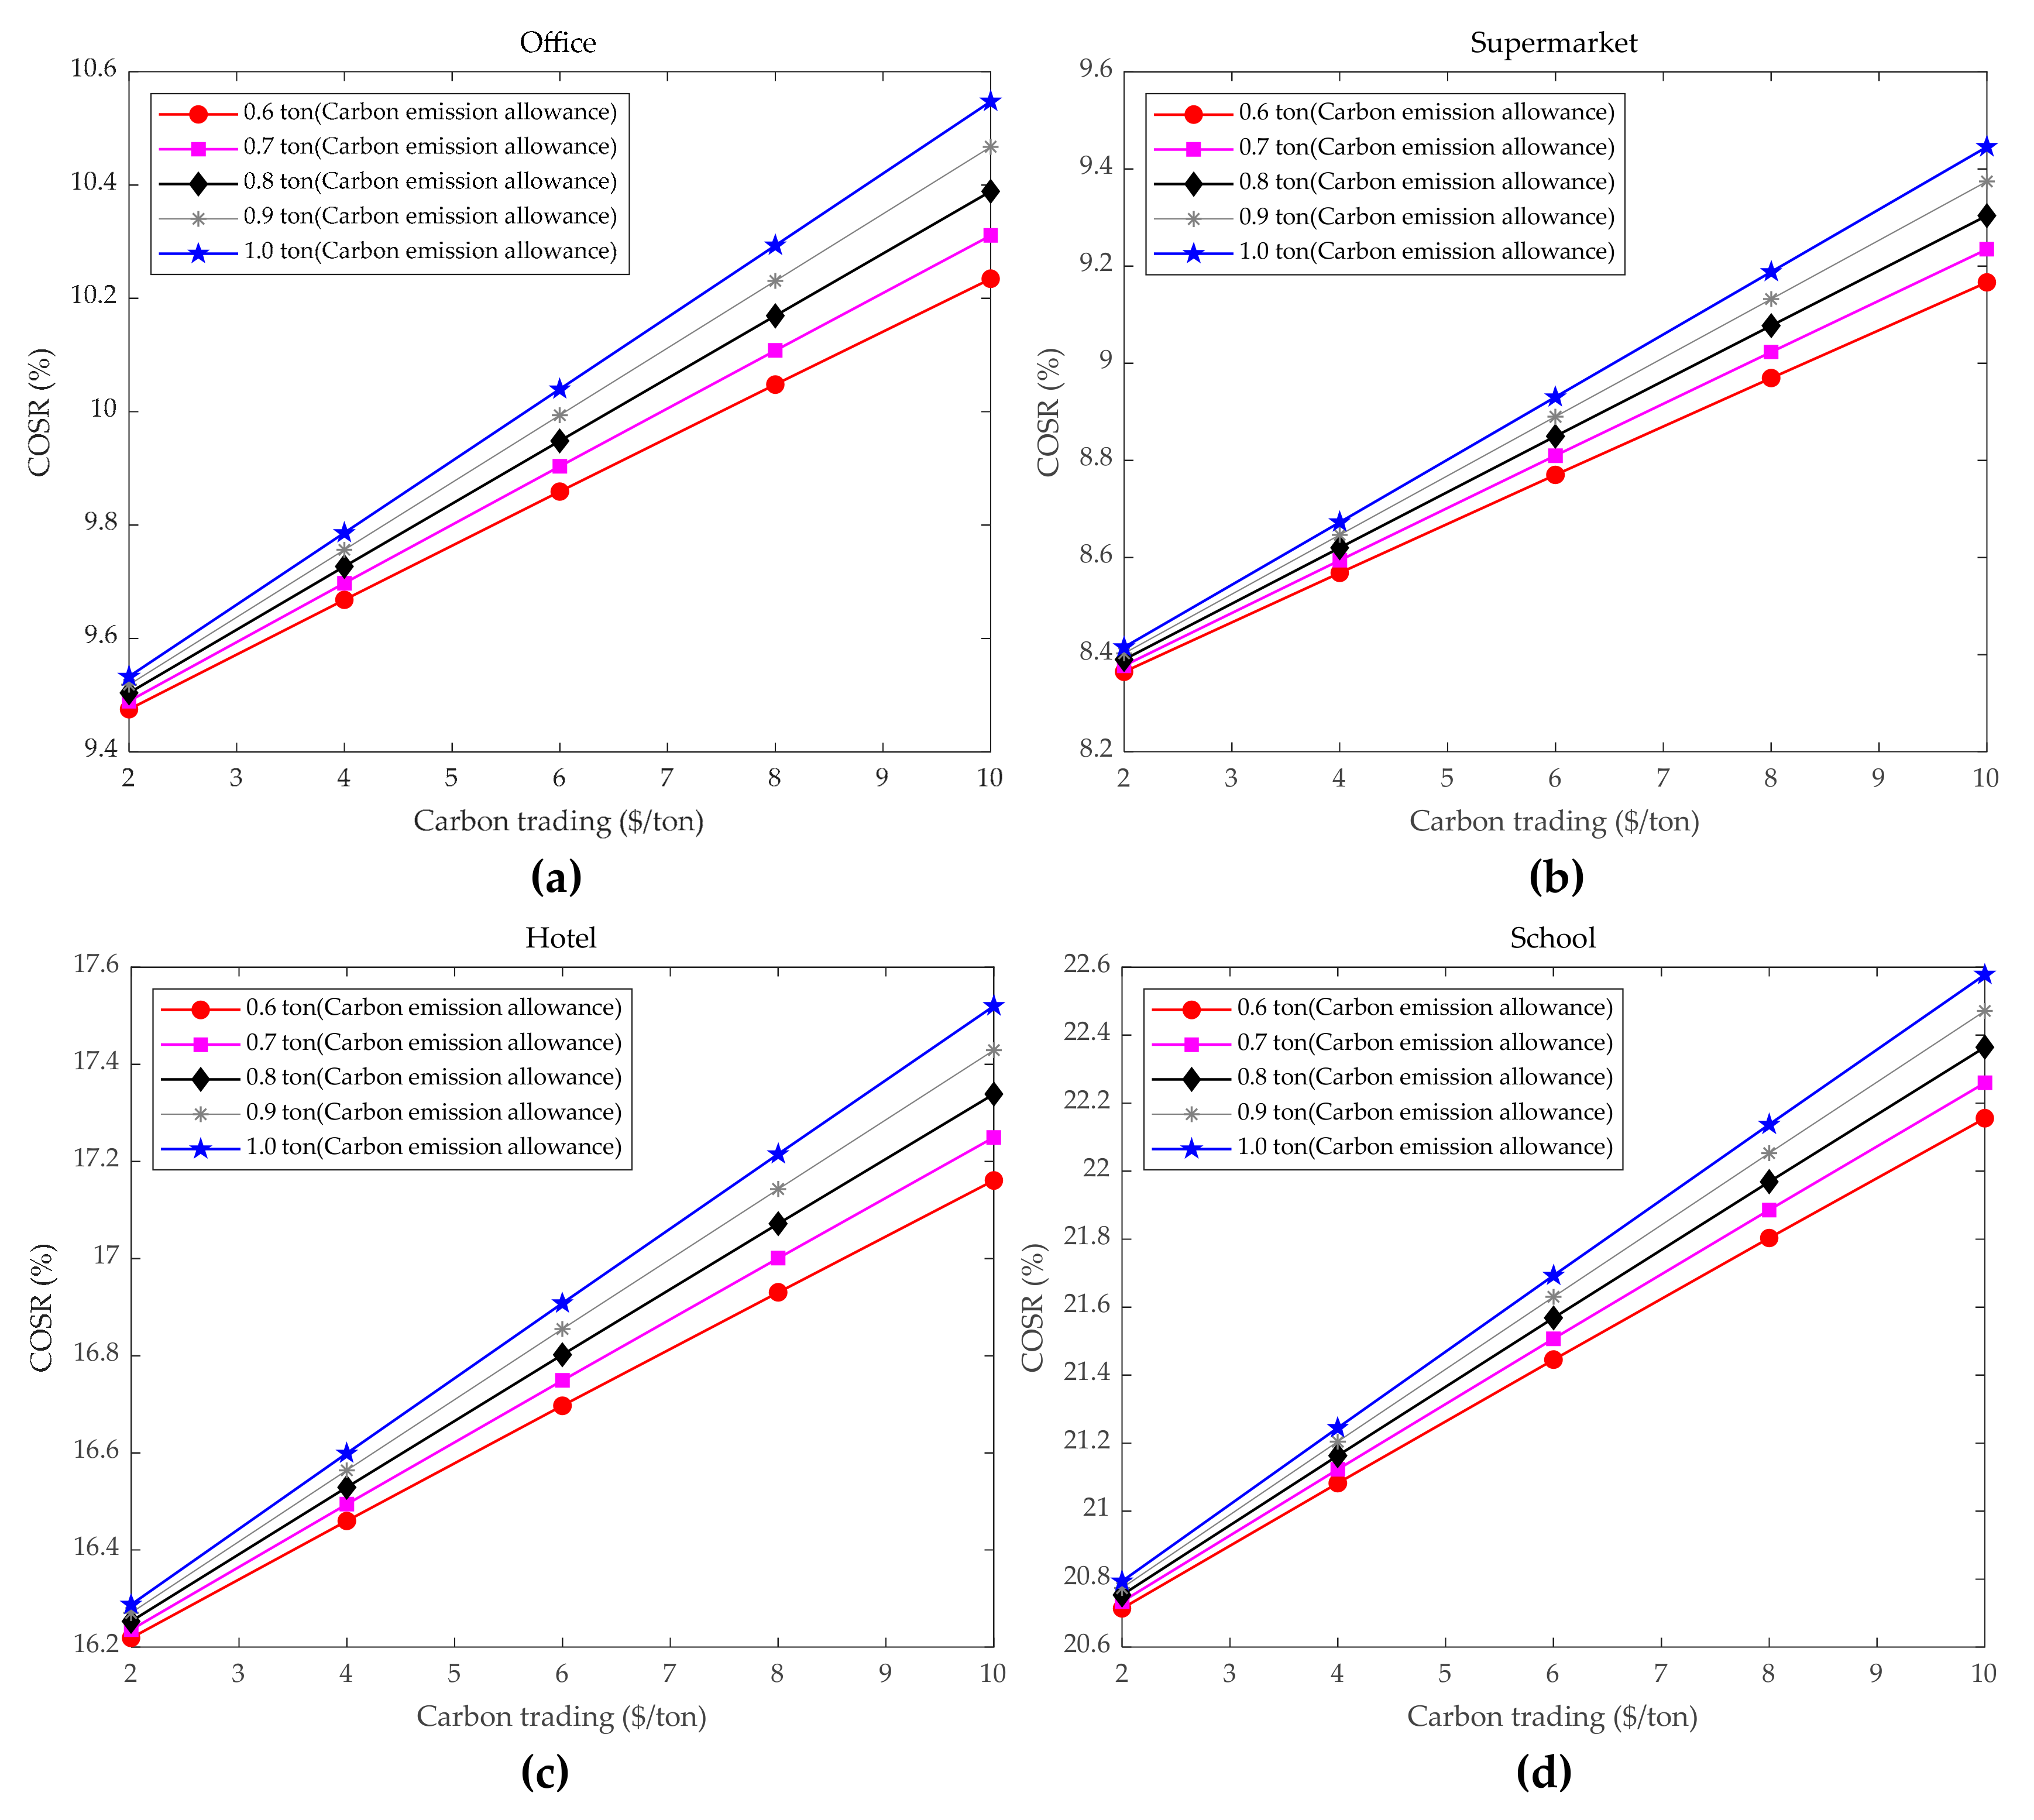
With the guidance of the carbon trading mechanism, the relationships between the COSR of adopting the optimal CCHP system strategy and carbon trading price, as well as carbon emission allowances, are shown in Figure 6. It indicates that the COSR of the five commercial buildings increased with the carbon trading price varying from $2/ton to 10/ton under certain carbon emission allowances. For example, the COSR of CCHP systems for the office increased from 9.5% to 10.2%, with carbon trading price varying from $2/ton to $10/ton with a 0.6-ton carbon emission allowance. In addition, Figure 6 also shows that the COSR of CCHP systems for the five commercial buildings increased by raising the carbon emission allowances from the set [0.6, 0.7, 0.8, 0.9, 1.0] under some carbon trading price. For instance, the COSR of the office increased from 10.2% to 10.6%, with carbon emission allowances varying from 0.6 ton to 1.0 ton with $10/ton carbon trading.
Compared with the separate system, the optimal CCHP system strategy can lead to 10.0%, 8.9%, 16.8%, 21.6%, and 20.5% in cost savings for the office, supermarket, hotel, school, and hospital in Shanghai, respectively, considering carbon trading policy. As shown in Figure 4 and Figure 6, using the CCHP system for the five different buildings appears to be more economically viable considering carbon trading policy than that without carbon emission regulations. Moreover, the cost-saving ratio of the school adopting the optimal CCHP system has increased the largest by 1.3%, considering the carbon trading policy compared to that without carbon emission regulations.
5.3. Environmental Performance Analysis
The carbon emission regulations made no difference to the optimal carbon dioxide emission of the CCHP system for the five different buildings when the objective was to maximize CDERR. The CDE and CDERR of the CCHP system over the separate system are shown in Figure 7. It can be observed that using the CCHP system can achieve 34.4%, 34.3%, 39.4%, 46.1%, and 43.7% carbon dioxide emission reduction for the office, supermarket, hotel, school, and hospital compared to the separate system, respectively. In addition, it demonstrates that school and hospital have more CDERR. To analyze the differences in buildings, it is observed that the energy demands of the school and hospital were higher than in other buildings. As shown in Figure 4, Figure 5, Figure 6 and Figure 7, an average of 15.3% in cost savings and 39.6% carbon dioxide emission reduction can be achieved for the five buildings by using the CCHP system, compared to the separate system. Moreover, the school adopting the optimal CCHP system can obtain more economic and environmental benefits than other buildings.
5.4. Energy Performance Analysis
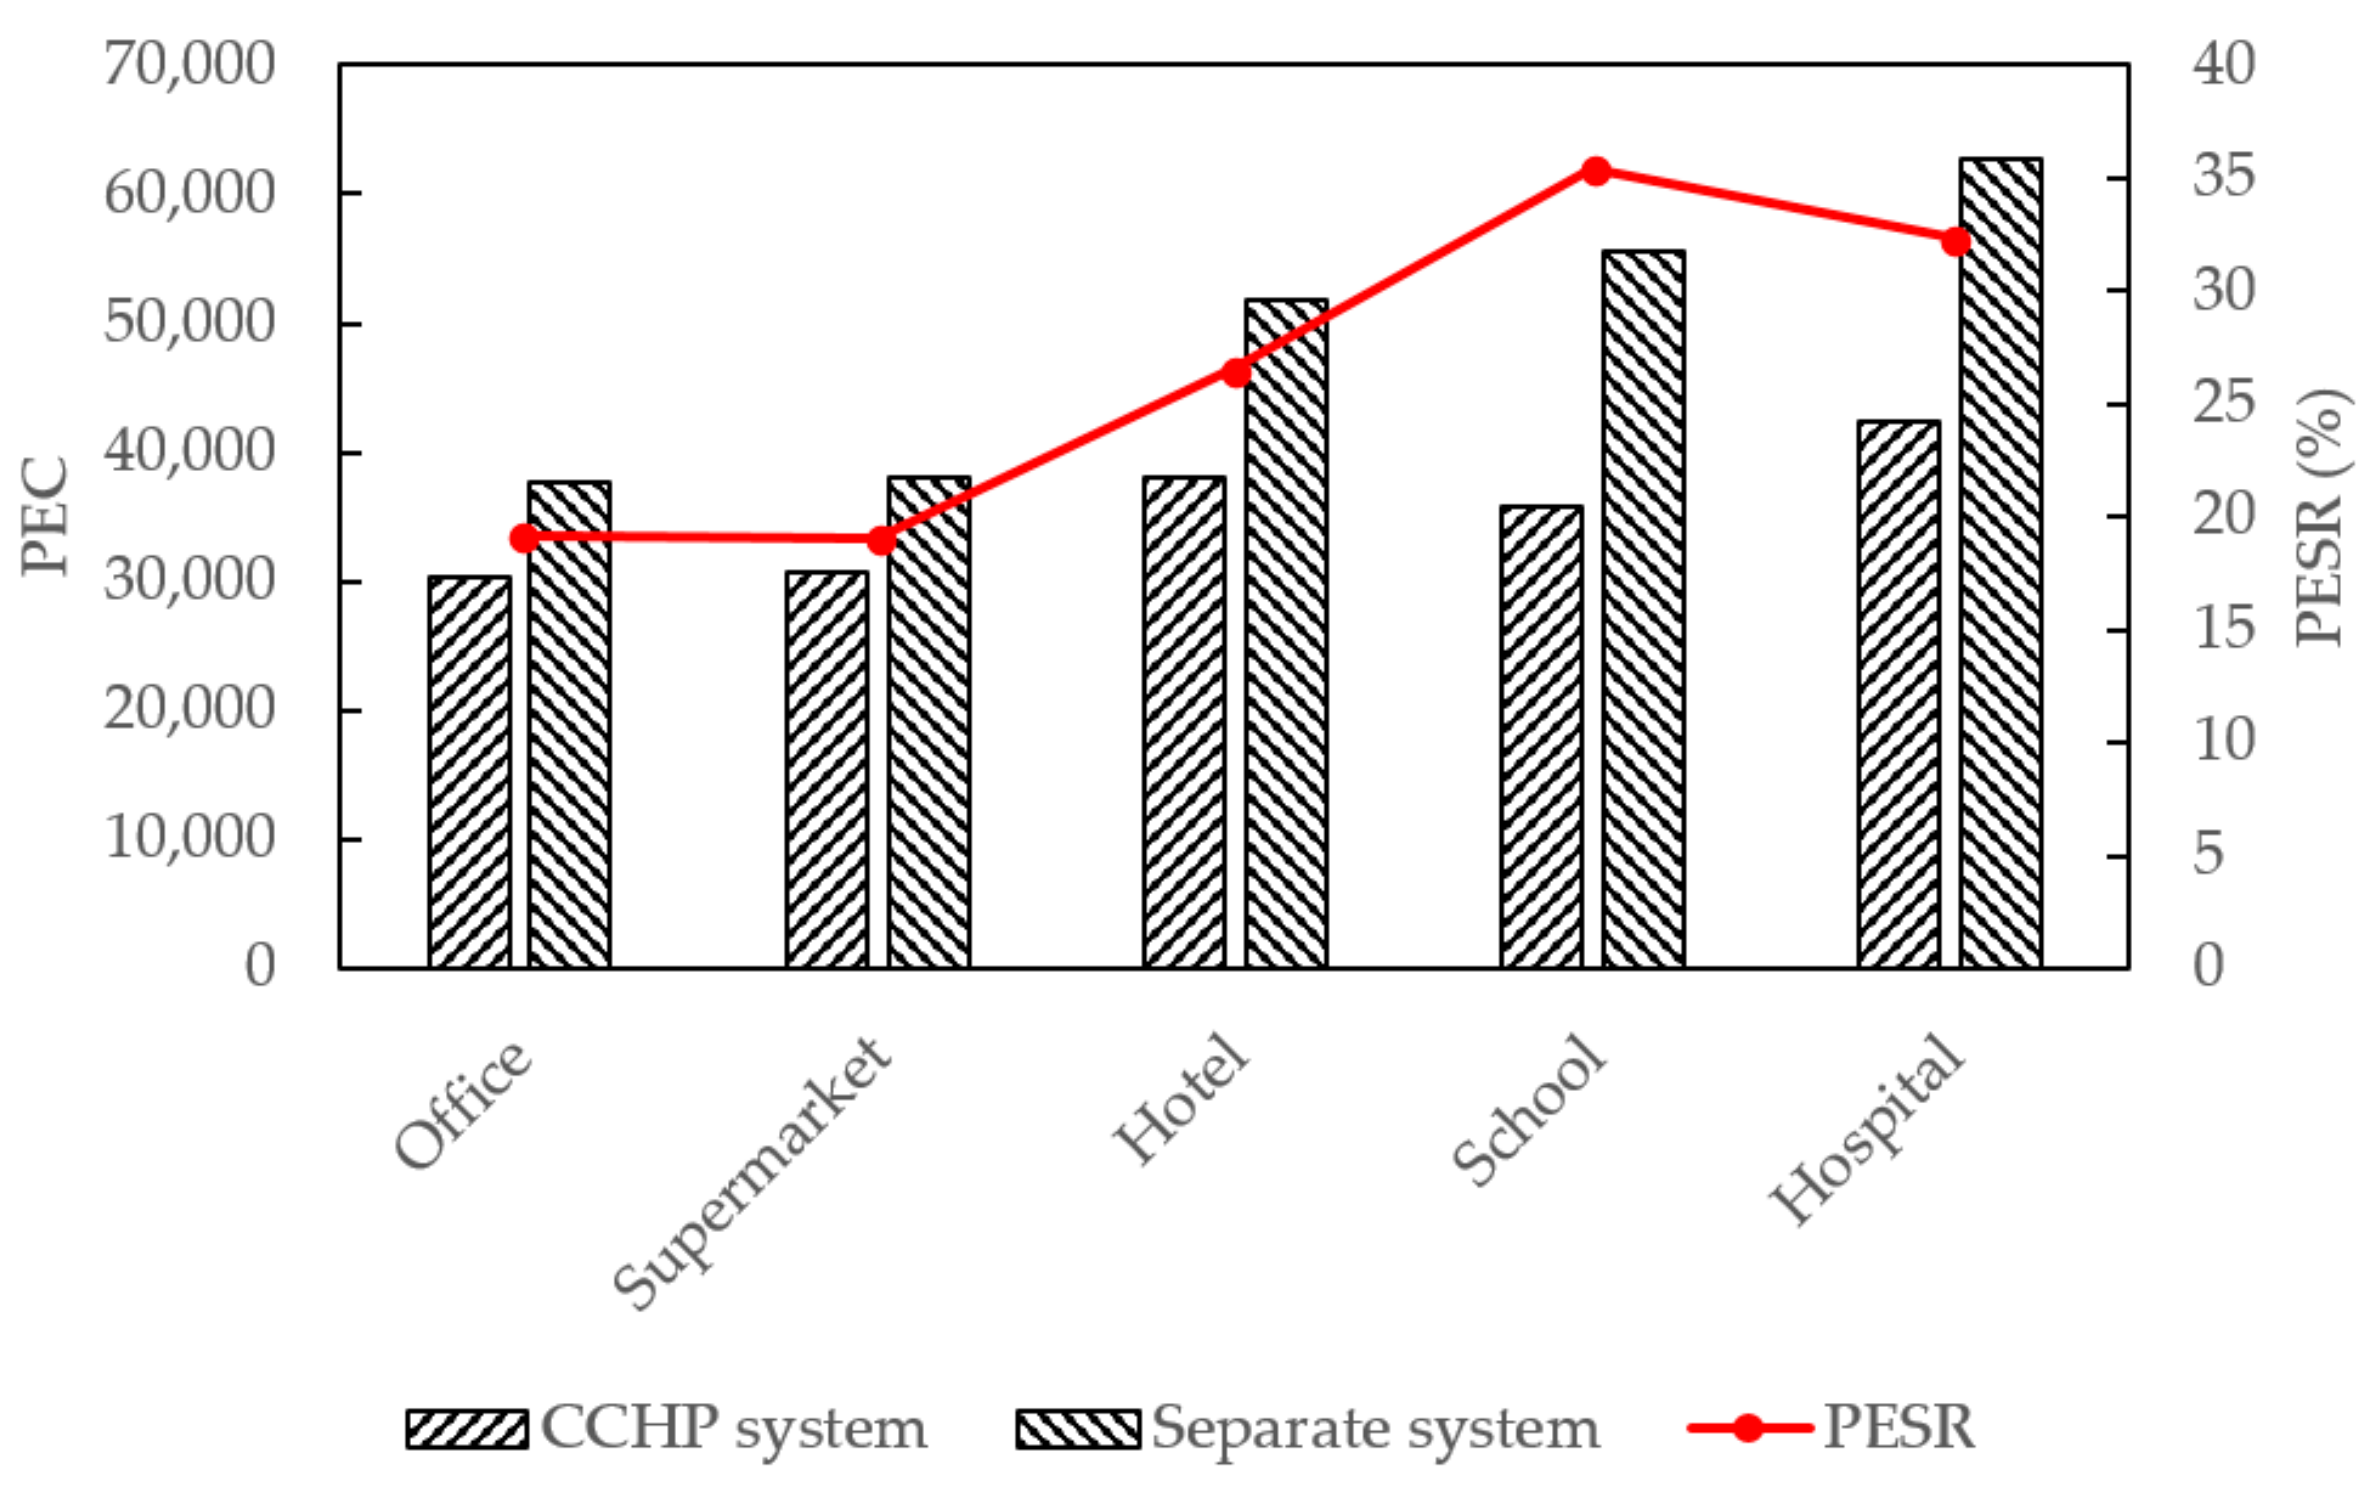
The optimal primary energy consumption of the CCHP system was not affected by the different carbon emission regulations when the goal was to maximize PESR. Figure 8 presents the PEC and PESR of the optimal CCHP system over the separate system, which shows that using the CCHP system can obtain more energy advantage for all five different buildings. The PESR of the office, supermarket, hotel, school, and hospital were 19.2%, 19.1%, 26.6%, 35.4%, and 32.4%, respectively. In addition, the results from Figure 8 show that school and hospital adopting the CCHP system have a higher primary energy saving ratio. Moreover, as shown in Figure 4, Figure 5, Figure 6, Figure 7 and Figure 8, the average for the COSR, CDERR, and PESR for the five building categories was 15.3%, 39.6%, and 26.5% by using optimal CCHP system strategy, respectively, compared to the separate system. Furthermore, compared to other buildings, more economic, environmental, and energy advantages were achieved in the school by adopting the CCHP system due to its high energy loads.
6. Conclusions
In this research, the economic benefit, environmental sustainability, and energy advantage of CCHP systems compared to the conventional energy supply system under different carbon emission regulations were analyzed. Multi-Objective optimization was proposed based on the measures of COSR, CDERR, and PESR. Moreover, the model was solved using the PSO algorithm. The case results showed that the optimal CCHP system strategy can achieve 9.3%, 8.2%, 16.0%, 20.3%, and 19.5% in cost-saving compared to the separate system for the office, supermarket, hotel, school, and hospital without carbon emission regulations, respectively. Considering carbon tax regulation, the COSR is on average 10.0%, 9.1%, 17.0%, 22.1%, and 20.9% for the office, supermarket, hotel, school, and hospital adopting CCHP systems, respectively, compared to the separate system. Furthermore, the optimal CCHP system strategy compared to the separate system can lead to 10.0%, 8.9%, 16.8%, 21.6%, and 20.5% in cost savings for the office, supermarket, hotel, school, and hospital, respectively, considering carbon trading regulation. In addition, the CDERR and PESR of the CCHP system also can be achieved over the separate system and not affected by the carbon tax and carbon trading regulations when the maximal CDERR and maximal PESR are chosen as optimal objectives, respectively. Moreover, the best economic benefit, environmental sustainability, energy advantage of the CCHP system was achieved for the school than other buildings.
In brief, the CCHP system can achieve an economic benefit, environmental sustainability, and energy advantage under carbon tax and carbon trading regulations compared to the conventional energy supply system. In addition, the government could enforce the carbon emission regulations accordingly to improve the cost-saving of CCHP systems compared to the conventional energy supply system.
In the future, this research can be extended to apply a stochastic programming model to assess the sustainability performance (e.g., environmental aspect) of the CCHP system for different building categories under uncertainties when other carbon emission regulations are taken into consideration.
Author Contributions
Conceptualization, X.C.; methodology, X.C.; software, X.C. and D.Y.; validation, X.C.; formal analysis, X.C.; investigation, X.C. and J.L.; resources, D.Y.; data curation, X.C. and J.L.; writing—original draft preparation, X.C.; writing—review and editing, X.C. and D.Y.; visualization, X.C.; supervision, D.Y.; project administration, D.Y.; funding acquisition, D.Y.
Funding
This research was funded by the National Natural Science Foundation of China under Grant No. 71971053, 71832001, the MOE (Ministry of Education in China) Project of Humanities and Social Sciences under Grant No. 18YJA630129, and the Fundamental Research Funds for the Central Universities under Grant No. CUSF-DH-D-2017065.
Acknowledgments
We gratefully acknowledge the anonymous reviewers for their insightful comments on the manuscript.
Conflicts of Interest
The authors declare no conflicts of interest.
References
- Yaghoubi, E.; Xiong, Q.; Doranehgard, M.H.; Yeganeh, M.M.; Shahriari, G.; Bidabadi, M. The effect of different operational parameters on hydrogen rich syngas production from biomass gasification in a dual fluidized bed gasifier. Chem. Eng. Process. Process Intensif. 2018, 126, 210–221. [Google Scholar] [CrossRef]
- Lou, X.; Wang, J.; Dooner, M.; Clarke, J. Overview of current development in electrical energy storage technologies and the application potential in power system operation. Appl. Energy 2015, 137, 511–536. [Google Scholar] [Green Version]
- Revesz, R.L.; Howard, P.H.; Arrow, K.; Goulder, L.H.; Kopp, R.E.; Livermore, M.A.; Oppenheimer, M.; Sterner, T. Global warming: Improve economic models of climate change. Nature 2014, 508, 173–175. [Google Scholar] [CrossRef] [PubMed]
- Wu, D.; Zuo, J.; Liu, Z.; Han, Z.; Zhang, Y.; Wang, Q.; Li, P. Thermodynamic analyses and optimization of a novel CCHP system integrated organic Rankie cycle and solar thermal utilization. Energy Convers. Manag. 2019, 196, 453–466. [Google Scholar] [CrossRef]
- Mahmood, C.; Mohammad, S. Energy, environmental and economic evaluations of a CCHP system driven by Stirling engine with helium and hydrogen as working gases. Energy 2019, 174, 1251–1266. [Google Scholar]
- Hou, Q.; Zhao, H.; Yang, X. Economic performance study of the integrated MR-SOFC-CCHP system. Energy 2019, 166, 236–245. [Google Scholar] [CrossRef]
- Ren, H.B.; Gao, W.J. A MILP model for integrated plan and evaluation of distributed energy systems. Appl. Energy 2010, 87, 1001–1014. [Google Scholar] [CrossRef]
- Mago, P.J.; Smith, A.D. Evaluation of the potential emissions reductions from the use of CHP systems in different commercial buildings. Build. Environ. 2012, 37, 405–416. [Google Scholar] [CrossRef]
- Ahmadi, P.; Dincer, I.; Rosen, M.A. Performance assessment and optimization of a novel integrated multigeneration system for residential buildings. Energy Build. 2013, 67, 568–578. [Google Scholar] [CrossRef]
- Ahn, H.; Freihaut, J.D.; Rim, D. Economic feasibility of combined cooling, heating, and power (CCHP) systems considering electricity standby tariffs. Energy 2019, 169, 420–432. [Google Scholar] [CrossRef]
- He, L.; Lu, Z.; Zhang, J.; Geng, L.; Zhao, H.; Li, X. Low-carbon economic dispatch for electricity and natural gas systems considering carbon capture systems and power-to-gas. Appl. Energy 2018, 224, 357–370. [Google Scholar] [CrossRef]
- Zhang, X.; Zeng, R.; Mu, K.; Liu, X.; Sun, X.; Li, H. Exergetic and exergoeconomic evaluation of co-firing biomass gas with natural gas in CCHP system integrated with ground source heat pump. Energy Convers. Manag. 2019, 180, 622–640. [Google Scholar] [CrossRef]
- Jiang, R.; Yin, H.; Chen, B.; Xu, Y.; Yang, M.; Yang, X. Multi-objective assessment, optimization and application of a grid-connected combined cooling, heating and power system with compressed air energy storage and hybrid refrigeration. Energy Convers. Manag. 2018, 174, 453–464. [Google Scholar] [CrossRef]
- Wang, J.J.; Zhang, C.F.; Jing, Y.Y. Multi-criteria analysis of combined cooling, heating and power systems in different climate zones in China. Appl. Energy 2010, 87, 1247–1259. [Google Scholar]
- Wang, L.; Lu, J.; Wang, W.; Ding, J. Energy, environmental and economic evaluation of the CCHP systems for a remote island in south of China. Appl. Energy 2016, 183, 874–883. [Google Scholar] [CrossRef]
- Feng, L.; Dai, X.; Mo, J.; Shi, L. Performance assessment of CCHP systems with different cooling supply modes and operation strategies. Energy Convers. Manag. 2019, 192, 188–201. [Google Scholar] [CrossRef]
- Wang, J.J.; Lu, Z.; Li, M.; Lion, N.; Li, W. Energy, exergy, exergoeconomic and environmental (4E) analysis of a distributed generation solar-assisted CCHP (combined cooling, heating and power) gas turbine system. Energy 2019, 175, 1246–1258. [Google Scholar] [CrossRef]
- Wang, M.; Wang, J.; Zhao, P.; Dai, Y. Multi-objective optimization of a combined cooling, heating and power system driven by solar energy. Energy Convers. Manag. 2015, 89, 289–297. [Google Scholar] [CrossRef]
- He, C.; Zhang, Q. Combined cooling heating and power systems: Sustainability assessment under uncertainties. Energy 2017, 139, 755–766. [Google Scholar] [CrossRef]
- Hu, M.; Cho, H. A probability constrained multi-objective optimization model for CCHP system operation decision support. Appl. Energy 2014, 116, 230–242. [Google Scholar] [CrossRef]
- Chen, Y.; Sun, Y.; Wang, C. Influencing factors of companies’ behavior for mitigation: A discussion within the context of emission trading scheme. Sustainability 2018, 10, 414. [Google Scholar] [CrossRef]
- Marufuzzaman, M.; Eksioglu, S.D.; Huang, Y. Two-stage stochastic programming supply chain model for biodiesel production via wastewater treatment. Comput. Oper. Res. 2014, 49, 1–17. [Google Scholar] [CrossRef]
- Li, X.; Yang, D.; Hu, M. A scenario-based stochastic programming approach for the product configuration problem under uncertainties and carbon emission regulations. Transp. Res. Part E 2018, 115, 126–146. [Google Scholar] [CrossRef]
- Xu, Z.; Elomri, A.; Pokharel, S.; Mutlu, F. The design of green supply chains under carbon policies: A literature review of quantitative models. Sustainability 2019, 11, 3094. [Google Scholar] [CrossRef]
- Kang, L.; Yang, J.; An, Q.; Deng, S.; Zhao, J.; Wang, H.; Li, Z. Effects of load following operational strategy on CCHP system with an auxiliary and ground source heat pump considering carbon tax and electricity feed in tariff. Appl. Energy 2017, 194, 454–466. [Google Scholar] [CrossRef]
- Chu, X.; Yang, D.; Li, X.; Zhou, R. Evaluation of CCHP system performance based on operational cost considering carbon tax. Energy Procedia 2017, 142, 2930–2935. [Google Scholar] [CrossRef]
- Zeng, R.; Zhang, X.; Deng, Y.; Li, H.; Zhang, G. An off-design model to optimize CCHP-GSHP system considering carbon tax. Energy Convers. Manag. 2019, 189, 105–117. [Google Scholar] [CrossRef]
- Li, L.; Yu, S.; Mu, H.; Li, H. Optimization and evaluation of CCHP systems considering incentive policies under different operation strategies. Energy 2018, 162, 825–840. [Google Scholar] [CrossRef]
- Afzali, S.F.; Mahalec, V. Novel performance curves to determine optimal operation of CCHP systems. Appl. Energy 2018, 226, 1009–1036. [Google Scholar] [CrossRef]
- Kennedy, J.; Eberhart, R. Particle Swarm Optimization. In Proceedings of the IEEE International Conference on Neural Networks, Perth, Australia, 27 November–1 December 1995. [Google Scholar]
- Yang, J.; He, L.; Fu, S. An improved PSO-based charging strategy of electric vehicles in electrical distributed grid. Appl. Energy 2014, 128, 82–92. [Google Scholar] [CrossRef]
- Zhao, X.; Lin, Q.; Yu, H. An improved mathematical model for green lock scheduling problem of the three gorges dam. Sustainability 2019, 11, 2640. [Google Scholar] [CrossRef]
- Yaseen, Z.M.; Ehteram, M.; Hossain, M.S.; Fai, C.M.; Binti Koting, S.; Mohd, N.S.; Jaafar, W.Z.B.; Afan, H.A.; Him, L.S.; Zaini, N.; et al. A novel hybrid evolutionary data-intelligence algorithm for irrigation and power production management: Application to multi-purpose reservoir systems. Sustainability 2019, 11, 1953. [Google Scholar] [CrossRef]
- Liu, D.; Deng, Z.; Sun, Q.; Wang, Y.; Wang, Y.H. Design and freight corridor-fleet size choice in collaborative intermodal transportation network considering economies of scale. Sustainability 2019, 11, 990. [Google Scholar] [CrossRef]
- Jing, R.; Wang, M.; Brandon, N.; Zhao, Y. Multi-criteria evaluation of solid oxide fuel cell based combined cooling heating and power (SOFC-CCHP) applications for public buildings in China. Energy 2017, 141, 273–289. [Google Scholar] [CrossRef]
- Dai, R.; Hu, M.; Yang, D.; Chen, Y. A collaborative operation decision model for distributed building clusters. Energy 2015, 84, 759–773. [Google Scholar] [CrossRef]
- Zhang, T.; Wang, M.; Wang, P.; Gu, J.; Zheng, W.; Dong, Y. Bi-stage stochastic model for optimal capacity and electric cooling ratio of CCHPs—A case study for a hotel. Energy Build. 2019, 194, 113–122. [Google Scholar] [CrossRef]
- Yang, W.; Zhao, Y.; Liso, V.; Brandon, N. Optimal design and operation of a syngas-fuelled SOFC micro-CHP system for residential applications in different climate zones in China. Energy Build. 2014, 80, 613–622. [Google Scholar] [CrossRef] [Green Version]
- Wu, Q.; Ren, H.; Gao, W.; Ren, J. Multi-criteria assessment of building combined heat and power systems located in different climate zones: Japan-China comparison. Energy 2016, 103, 502–512. [Google Scholar] [CrossRef]
- Colella, W.G.; Pilli, S.P. Energy system and thermoeconomic analysis of combined heat and power high temperature proton exchange membrane fuel cell systems for light commercial buildings. J. Fuel Cell Sci. Technol. 2015, 12, 031008. [Google Scholar] [CrossRef]
Figure 1.
Structure of the combined cooling, heating, and power (CCHP) system and separate system for the end-user.
Figure 1.
Structure of the combined cooling, heating, and power (CCHP) system and separate system for the end-user.

Figure 2.
Energy matching map for the CCHP system and the end-user.

Figure 3.
One-day energy demand profiles for five different building categories of Shanghai in the transition season. (a) Office; (b) supermarket; (c) hotel; (d) school; (e) hospital.
Figure 3.
One-day energy demand profiles for five different building categories of Shanghai in the transition season. (a) Office; (b) supermarket; (c) hotel; (d) school; (e) hospital.


Figure 4.
Cost (COST) and cost-saving ratio (COSR) of the CCHP system for five different building categories without carbon emission regulations in the transition season.
Figure 4.
Cost (COST) and cost-saving ratio (COSR) of the CCHP system for five different building categories without carbon emission regulations in the transition season.

Figure 5.
Impacts of various carbon taxes on (a) carbon tax cost; (b) COSR of the CCHP system for five different building categories in the transition season.
Figure 5.
Impacts of various carbon taxes on (a) carbon tax cost; (b) COSR of the CCHP system for five different building categories in the transition season.

Figure 6.
The effect of carbon trading policy on COSR of the CCHP system for five different building categories in the transition season. (a) Office; (b) supermarket; (c) hotel; (d) school; (e) hospital.
Figure 6.
The effect of carbon trading policy on COSR of the CCHP system for five different building categories in the transition season. (a) Office; (b) supermarket; (c) hotel; (d) school; (e) hospital.


Figure 7.
The carbon dioxide emission (CDE) and carbon dioxide emission reduction ratio (CDERR) of the CCHP system for five different building categories compared to the separate system in the transition season.
Figure 7.
The carbon dioxide emission (CDE) and carbon dioxide emission reduction ratio (CDERR) of the CCHP system for five different building categories compared to the separate system in the transition season.

Figure 8.
The primary energy consumption (PEC) and primary energy saving ratio (PESR) of the CCHP system for five different building categories compared to the separate system in the transition season.
Figure 8.
The primary energy consumption (PEC) and primary energy saving ratio (PESR) of the CCHP system for five different building categories compared to the separate system in the transition season.


Table 1.
Nomenclatures in the mathematical model.
| Description | |
|---|---|
| Indices | |
| Index of the slotted interval, | |
| Total time period | |
| Parameters | |
| Natural gas to electricity conversion coefficient of the PGU | |
| Natural gas to electricity conversion parameter of the PGU | |
| Natural gas to heating conversion efficiency for the PGU | |
| Natural gas to heating conversion efficiency of the auxiliary boiler | |
| Thermal efficiency of the heating exchanger | |
| Heating to cooling energy conversion efficacy of the absorption chiller | |
| Electricity to cooling conversion competence of the electric chiller | |
| Electricity demand of the end-user at time | |
| Cooling demand of the end-user at time | |
| Heating load of the end-user at time | |
| Decision variables (at time) | |
| Natural gas quantity of the PGU (kWh) | |
| Natural gas quantity of the auxiliary boiler (kWh) | |
| Electricity from the PGU firing natural gas (kWh) | |
| Electricity procured from the local power grid (kWh) | |
| Electricity supplied to the end-user (kWh) | |
| Electric energy amount by the electric chiller consuming (kWh) | |
| Heating recovered from the PGU (kWh) | |
| Heating generated by the boiler (kWh) | |
| Heating energy consumption of the absorption chiller (kWh) | |
| Heating energy consumption of the heating exchanger (kWh) | |
| Cooling supplied by the absorption chiller (kWh) | |
| Cooling supplied by the electric chiller (kWh) | |
Table 2.
Value of the combined cooling, heating, and power (CCHP) equipment parameter settings.
| Notation | Description | Value |
|---|---|---|
| Electricity to cooling conversion competence of the electric chiller | 3.5 | |
| Heating to cooling energy conversion efficacy of the absorption chiller | 0.7 | |
| Natural gas to electricity conversion coefficient of the PGU | 2.7 | |
| Natural gas to electricity conversion parameter of the PGU | 11.66 | |
| Natural gas to heating conversion efficiency for the PGU | 0.8 | |
| Natural gas to heating conversion efficiency of the auxiliary boiler | 0.85 | |
| Thermal efficiency of the heating exchanger | 0.8 |
Table 3.
The data of the CCHP system for sustainability assessment in Shanghai, China.
| Notation | Description | Value |
|---|---|---|
| Electricity price ($/kWh) | 0.11 | |
| Natural gas price ($/m3) | 0.54 | |
| CO2 conversion factor of electricity (kg/kWh) | 0.22 | |
| CO2 conversion factor of natural gas (kg/kWh) | 0.88 | |
| Site-to-primary energy conversion factor of electricity | 3.336 | |
| Site-to-primary energy conversion factor of natural gas | 1.047 |
Note: 0.54$/m3 = 0.054$/kWh, 1kg = 10−3ton.
© 2019 by the authors. Licensee MDPI, Basel, Switzerland. This article is an open access article distributed under the terms and conditions of the Creative Commons Attribution (CC BY) license (http://creativecommons.org/licenses/by/4.0/).
Share and Cite
MDPI and ACS Style
Chu, X.; Yang, D.; Li, J. Sustainability Assessment of Combined Cooling, Heating, and Power Systems under Carbon Emission Regulations. Sustainability 2019, 11, 5917. https://doi.org/10.3390/su11215917
AMA Style
Chu X, Yang D, Li J. Sustainability Assessment of Combined Cooling, Heating, and Power Systems under Carbon Emission Regulations. Sustainability. 2019; 11(21):5917. https://doi.org/10.3390/su11215917
Chicago/Turabian StyleChu, Xiaolin, Dong Yang, and Jia Li. 2019. "Sustainability Assessment of Combined Cooling, Heating, and Power Systems under Carbon Emission Regulations" Sustainability 11, no. 21: 5917. https://doi.org/10.3390/su11215917
Note that from the first issue of 2016, this journal uses article numbers instead of page numbers. See further details here.