The Construction of a Regional Ecological Security Pattern Based on Circuit Theory

1
School of Architecture and Urban Planning, Nanjing University, Nanjing 210093, China
2
School of Architecture and Urban Planning, Anhui Jianzhu University, Hefei 230022, China
*
Author to whom correspondence should be addressed.
Sustainability 2019, 11(22), 6343; https://doi.org/10.3390/su11226343
Submission received: 4 October 2019
/
Revised: 7 November 2019
/
Accepted: 10 November 2019
/
Published: 12 November 2019
Abstract
:The construction of an ecological security pattern (ESP) is one of the basic methods to protect regional ecological security and enhance people’s well-being. In the case of Anhui province, located in the Yangtze River Delta region of China, regional ecological sources were assessed and recognized in terms of ecosystem services, and regional ESP was then constructed based on circuit theory. Current density was applied to analyze the significance of patches and corridors and recognize sticking points, and thereby strategies were introduced to optimize regional ESP. Results of ecosystem services function assessment showed that there were 47 ecological patches, 107 ecological corridors, 16 pinch points, and six sticking points in the ESP of Anhui province. The watershed of the Yangtze and Huai rivers divides the ESP of the northern and southern Anhui, which has huge landscape spatial heterogeneity. Areas with relatively good ecological resources were basically located between Dabie Mountain area in the west and the low hilly area in the south of Anhui, with mostly woodland and farmland as ecological sources. However, cities in the northern Anhui, also in the north of the watershed of the Yangtze and Huai rivers, face severe situations in terms of environmental protection. This study conducted spatial analyses on ESP with different thresholds and proposed to classify different ESPs according to ecological control. This helps to alleviate the contradiction between economic development and environmental protection, and improve the supply capacity of regional ecosystem services, in order to satisfy the regional demand for ecosystem services. Meanwhile, this study offers more methods to construct regional ESP and introduces targeted measures to improve connectivity, which is of practical guidance for the connectivity and optimization of ecological patterns.
1. Introduction
In recent years, the continuous promotion of urbanization has propelled ecosystems to face huge pressures, even leading to ecological disasters. On the other hand, as people have raised a new demand for the well-being provided by ecosystem services, the contradiction between economic development and environmental protection has been gradually intensified. The ecological security pattern (ESP), as the bridge between ecosystem services and societal development, is currently regarded as a key strategic tool to protect regional ecological security and enhance people’s well-being. The designation of ESP has become an important policy for Chinese governments at all levels to ensure sustainable development of the regional economy, and to coordinate the relationship between ecosystems and economic society. It is regarded as a basic guarantee and important method to realize regional ecological security and is identified as one of the three strategic patterns for national land development and protection.
The formation and development of ESP was derived from the introduction of the land health concept in 1941, in response to the worldwide spread of problems concerning ecosystem health and ecological risks. During the 1980s, the World Commission on Environment and Development (WCED) and the International Institute for Applied Systems Analysis (IIASA) officially mentioned ecological security issues and associated monitoring systems. Guided by Millennium Development Goals, the International Ecological Safety Collaborative Organization (IESCO) initiated by China was founded in 2006. In 2012, the Intergovernmental Science-Policy Platform on Biodiversity and Ecosystem Services (IPBES) hosted by the United Nations Environment Programme (UNEP) was officially established, hoping to serve decision-making of the government with its scientific assessment. All the above indicate that the international community attached great attention to ecosystem services, ecological security and sustainable development concerning people’s well-being. As ecological security is a complicated problem, current research on this topic is basically centered around its general comprehension. That is to say, looking from the perspective of human beings, it refers to compound situations of ecosystem security where environmental conditions and ecosystem services are capable of protecting our life and health from damage, while at the same time economic development and social security are unfettered and unthreatened [1,2].
Thus far, scholars of various research fields have discussed the structure and function of the ecological network [3], as well as its construction and assessment [4,5]. In addition, they have also conducted a great deal of research about biodiversity protection [6,7], natural reserve design [8], optimization and assessment of urban (regional) landscape [9,10], landscape planning and design [11,12], forest management [13], land use planning and assessment [14], and ESP [1,15], etc. The research involving ecological networks and ecological security can be mainly divided into following three types: (1) improving the spatial structure of ecosystem; (2) protecting ecological functions and processes (like the habitat reconstruction of crucial species); (3) coupling ecosystem services (like ecology, entertainment and aesthetics). This study hopes to improve our living conditions and maintain steady economic growth by studying the spatial changes of the ecological environment and resources.
The research on ESP has mainly focused on the construction of reserve systems. Conservation priority areas have been constructed at regional and global levels, through identifying a series of representative ecosystems and classifying them into different types according to the strictness of protection, ranging from the strictest to the sustainably developed [16]. The pattern at early stages was basically aimed at biodiversity preservation. However, along with the development of ecosystem services assessment and the awareness of the impact that socioeconomic issues have on ecological security [17], the research on ESP has gradually shifted towards a coordinated pattern, with a focus on natural ecosystem also coupled with socioeconomics. Under the circumstance of regional ecological problems caused by global changes and the expansion of human activities, the research has mainly focused on ecosystem functions and processes, assessment and synergic relations between biodiversity and ecosystem services [18], ecological preservation and restoration, coupling analysis on natural and socioeconomic systems [19], and policies concerning ecological security [20].
In recent years, some scholars have proposed design principles and methods for regional ESP, expanding the research to the regional scale. They designed, combined and distributed various natural and human factors in the region, generating plans of spatial configuration consisting of points, lines, and planes, with the characteristics of multiple purposes, levels, and types. They hoped to maintain the functional and structural integrality of the ecosystem and seek the balance between socioeconomic demand and ecological security at the macro-level [21]. More than 20 years of development gradually formed the basic paradigm of EPS construction, with the characteristics of “source recognition, resistance surface construction, corridor selection, security pattern identification” [22]. Among them, the recognition of ecological sources can be divided into three modes: (1) directly regard woodland or natural reserve as source [23]; (2) select areas with high natural supplies as source according to analysis on multiple ecological processes or functions [24]; (3) make an assessment based on a multi-angle comprehensive index system including ecological sensitivity, ecological functional significance, and landscape connectivity [25,26]. As for the construction of an ecological resistance surface, the mainstream method is to assign values according to the type of landscape. Some research recently has started to revise resistance surfaces by the data of night light [27] and ecological sensitivity [28]. As for the selection of ecological corridors, the method of minimum cumulative resistance (MCR) has been widely applied [29,30].
This study generalized from the existing research directions in the literature, meanwhile, based on the platform of Circuitspace, it conducted quantitative assessment of the connectivity between ecological patches according to circuit theory to obtain the relocation and diffusion paths of all potential species between ecological patches and their relative importance (according to the value of resistance). Linkage Mapper, a GIS software tool, was applied to recognize the main sticking points of the research area in order to build the thinking for EPS optimization and trends for future development. This study hopes to provide theoretical support for regional ESP optimization and regional management of environment security.
2. Methodology and Data
2.1. Study Area and Data Sources
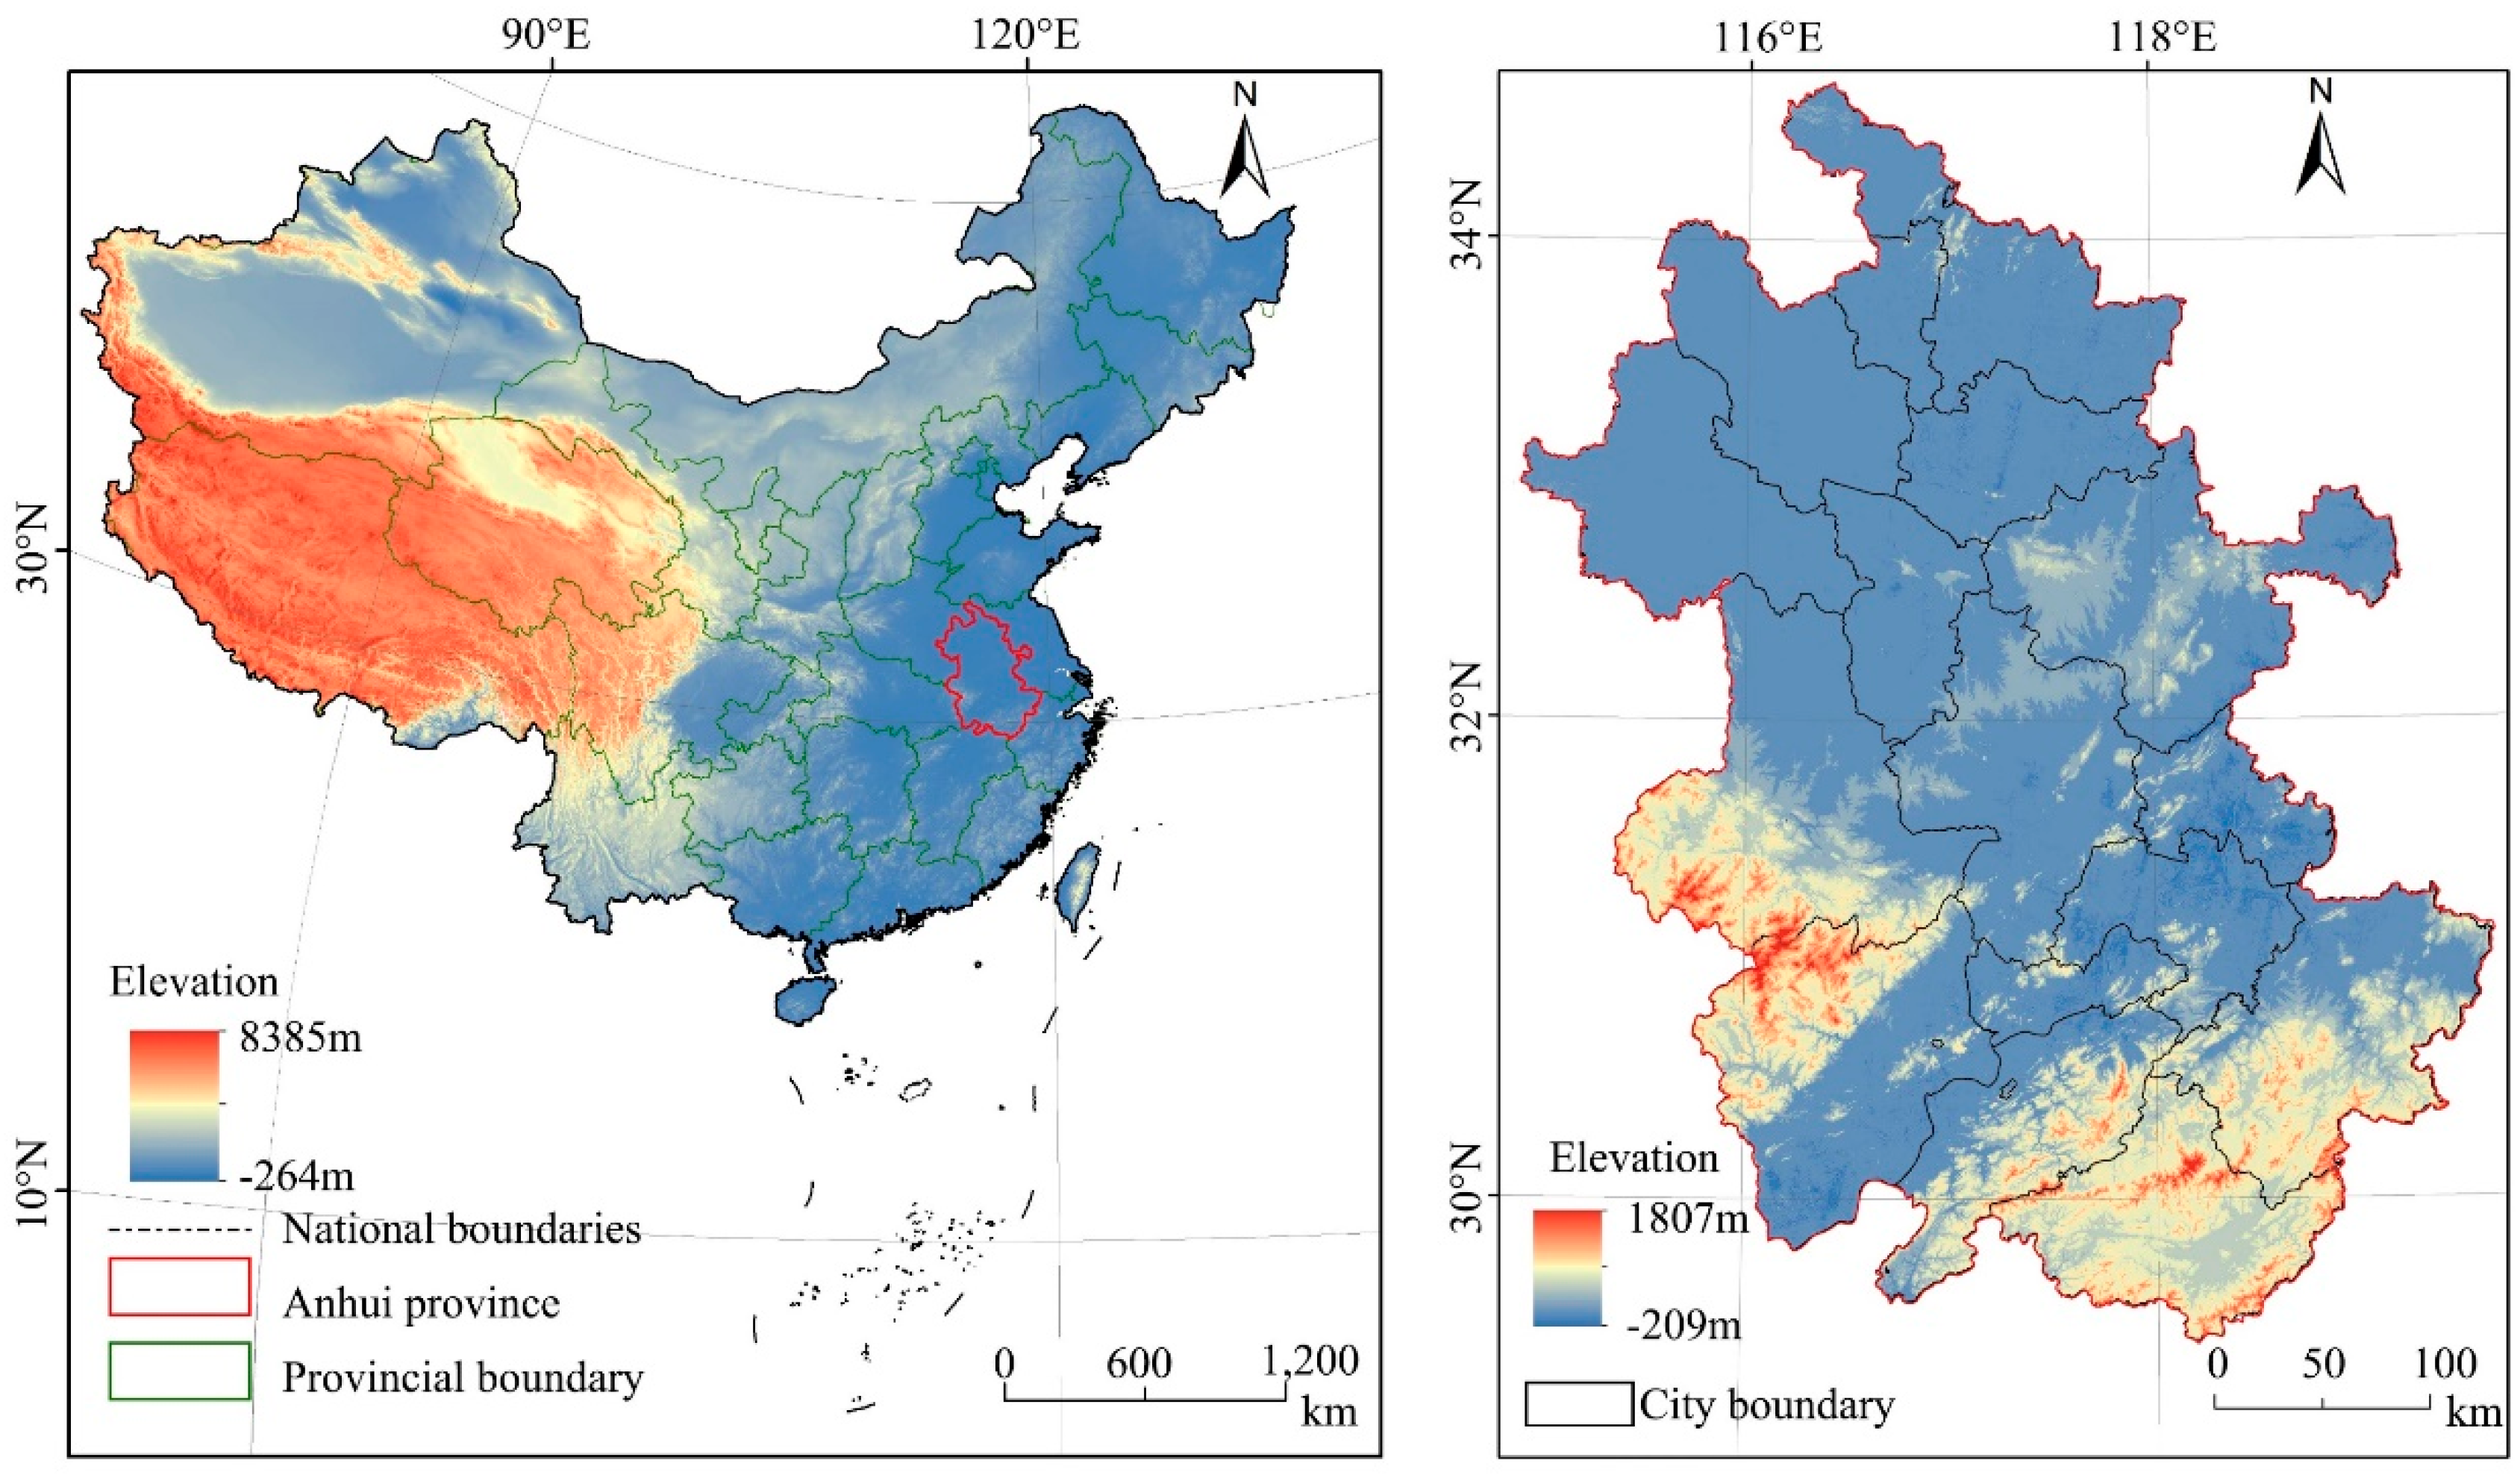
Anhui Province, located in East China (114°54′–119°37′ E, 29°41′–34°38′ N) (Figure 1), is a component of Yangtze River Delta, the most economically vigorous area in China. In 2018, the residential population of Anhui reached 63.23 million, with an economic aggregate of 3 trillion RMB. Its length from south to north is about 570 kilometers, and width from east to west is about 450 kilometers, with an area of 14.01 × 10⁴ km2, accounting for about 1.45% of China’s total area. Most of it is in the area of subtropical monsoon climate. Anhui province spans three basins including Yangtze River, Huai River and Qiantang River, with Qinling Mountains–Huai River Line (the watershed of Yangtze and Huai rivers) included. Therefore, ecological elements like climate, animals and plants are exhibited with distinct vertical and horizonal transitional characteristics. The geography of Anhui, from north to south, can be divided into five types: Wanbei plain, Jianghuai hilly area, Dabie Mountain area, plain along the river, and Wannan mountainous area. Mountainous area, hilly area, and plain account for 30%, 25%, and 45%, respectively, of Anhui’s total area.
The data this research utilized include DEM topographic data of Anhui, a dataset of monthly surface observation values in China (volume of precipitation, average monthly temperature, sunshine duration), the China 1:1 million soil database (soil texture, including constitution of grain size, proportion of organic matters, and electric conductivity), a survey on the change of Anhui’s present land use (36 types of land use, rivers and lakes, roads, etc.), normalized difference vegetation index (NDVI), and net primary productivity (NPP). The data information and their source are listed in Table 1; the processes will be introduced specifically in research methods.
2.2. Research Framework and Methods
Biodiversity is the compound of organisms and environment, including genetic diversity, species diversity, and ecosystem diversity. Ecosystem services are defined as the benefits people gain from nature and are classified according to their specific benefits to individuals or society. Ecosystem services get their name from their direct relation to the ecosystem functions that produce them. Biodiversity is a major driver of ecosystem functions. Some ecosystem services, including water conservation, soil erosion control, and pollination, depend on ecosystem functions controlled by the species inside the ecosystem. In general, biodiversity is the basis of many important ecosystem services. Communities with multiple ecosystem functions and high levels of ecosystem services contain more species contributing to ecosystem stability, productivity, and nutrient supply. The role biodiversity plays in ecosystem services can be identified by its functions at different levels.
Anhui Province is located in the transition zone, with significant differences in climate and topography between the north and south. Therefore, it is difficult to accurately evaluate the level of regional biodiversity by directly analyzing animal and plant species and quantifying distribution regions. In this regard, the article selected the Habitat Quality module in the InVEST model to calculate habitat quality, with considerations on the relationship between local characteristics and biodiversity. The score of habitat quality can represent the richness of biodiversity: regions with higher scores have higher biodiversity.
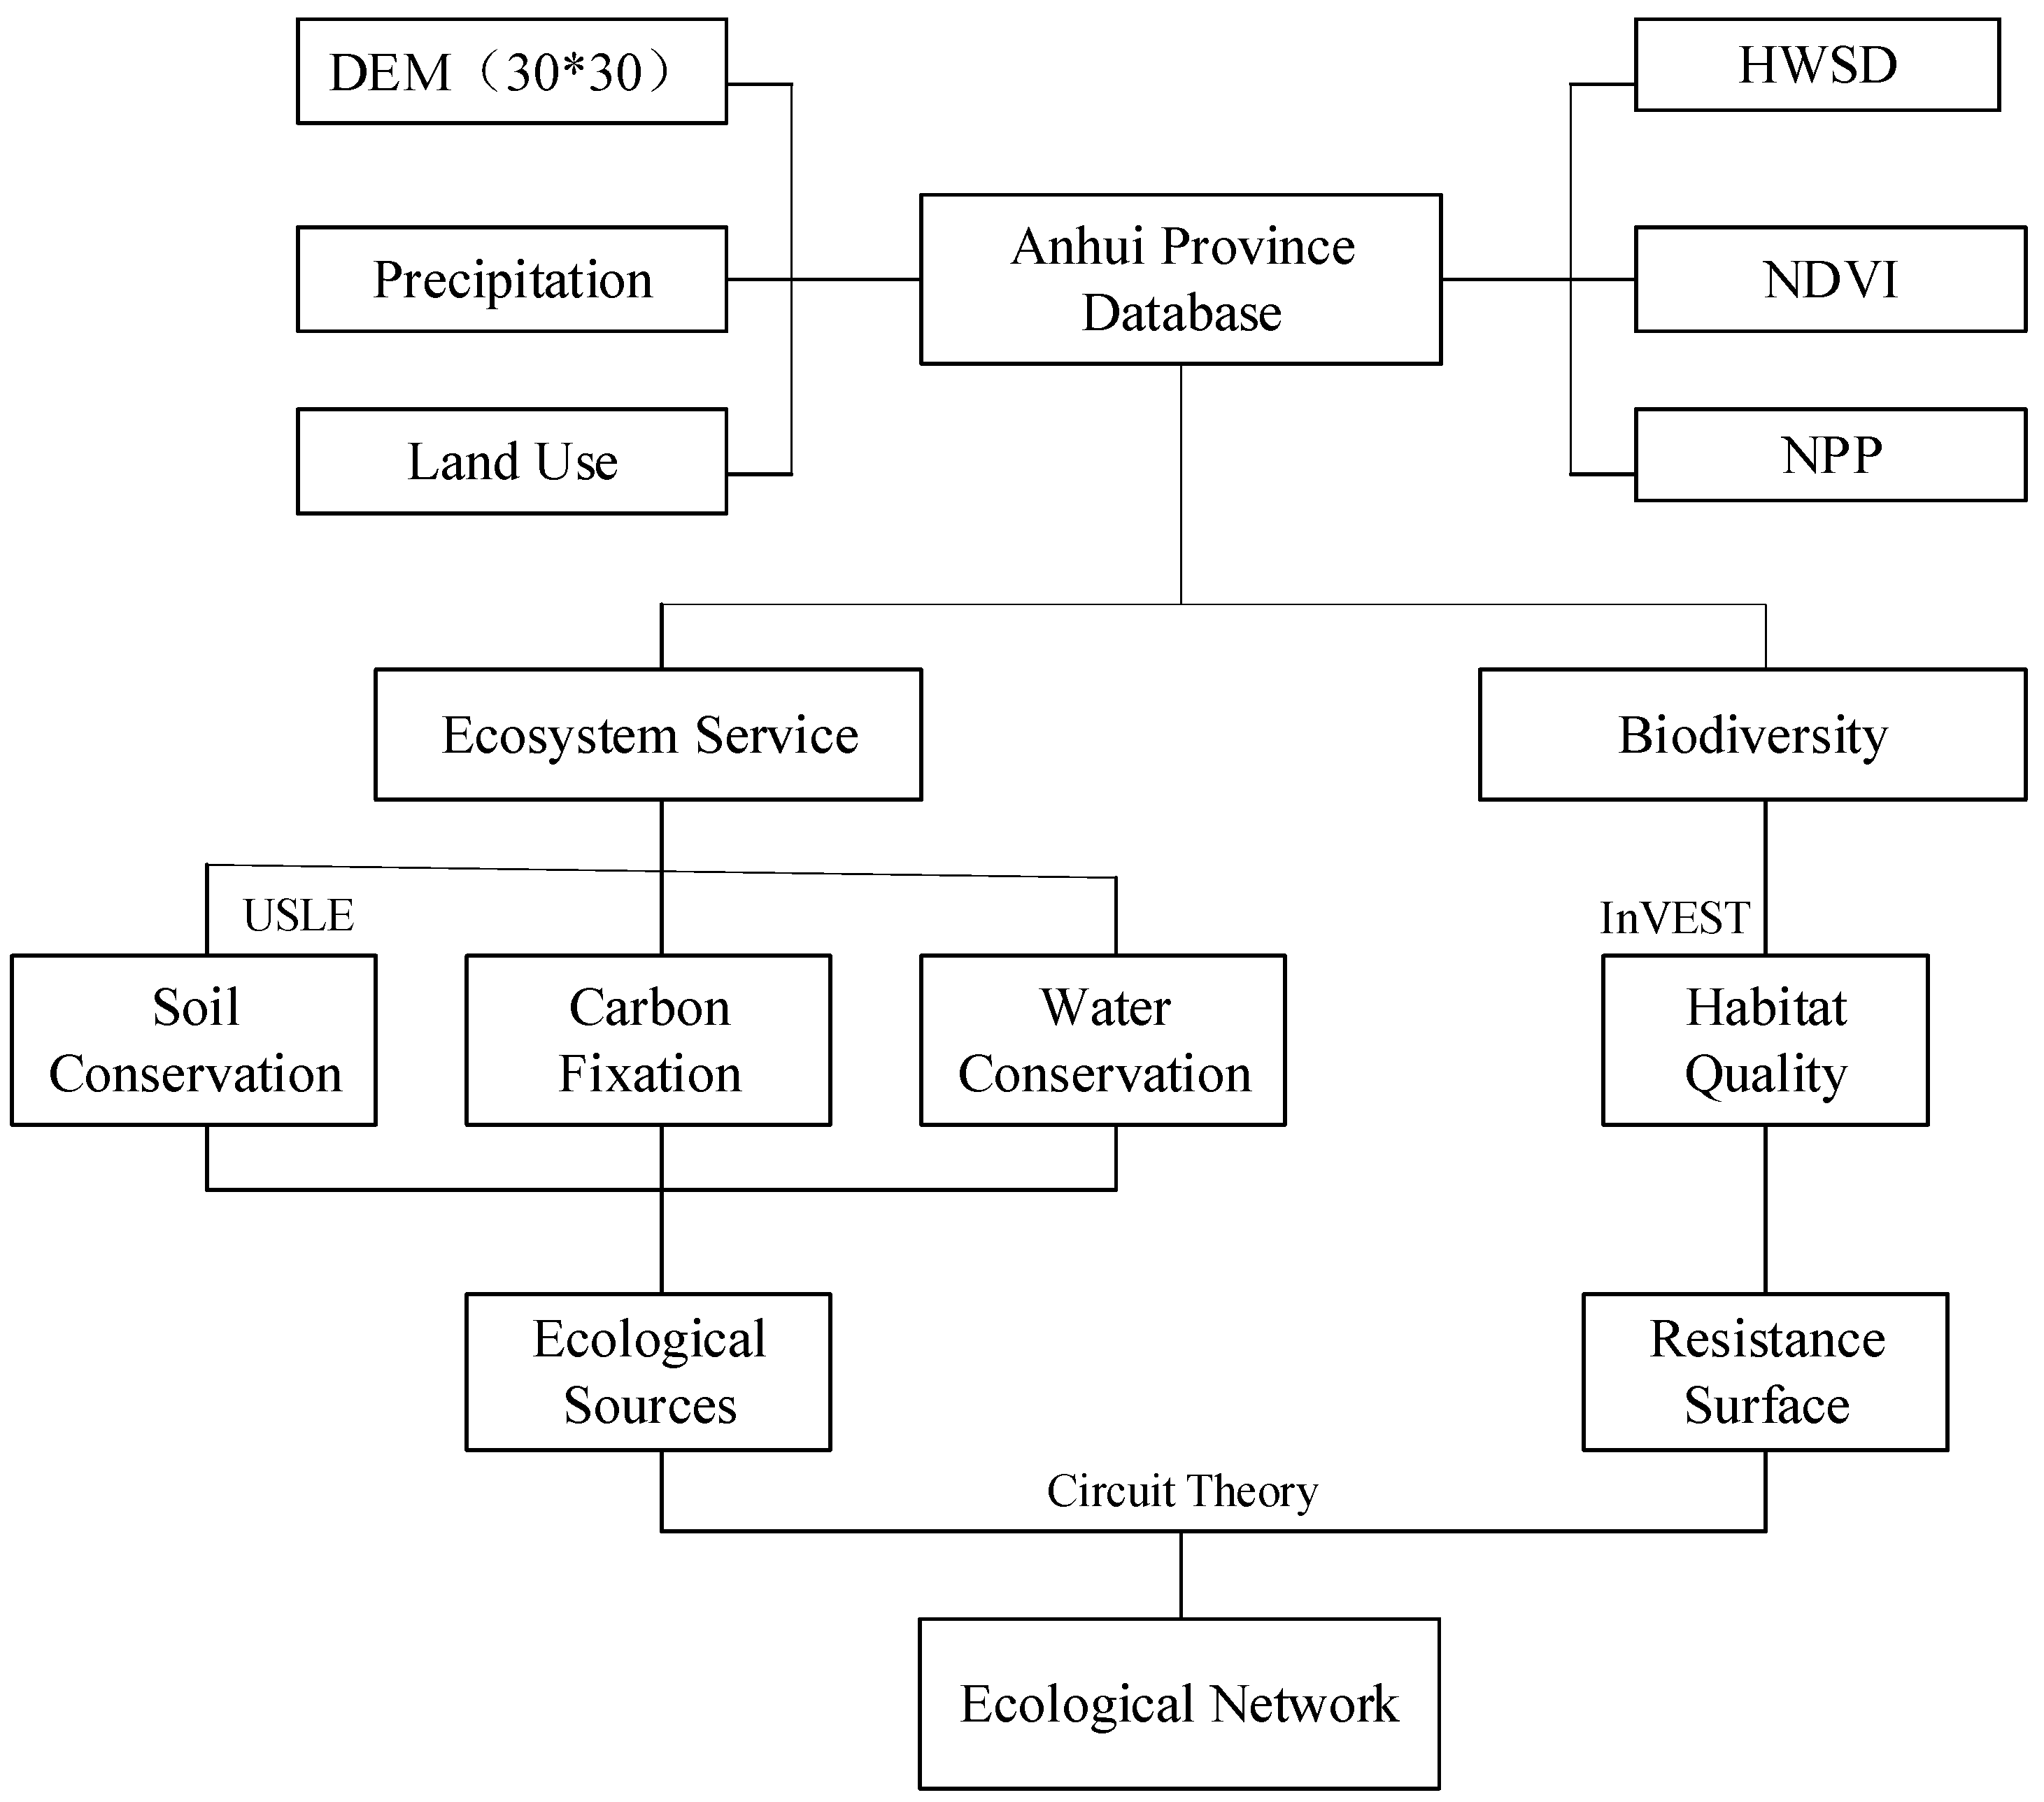
Firstly, this study constructed a database for basic information of Anhui Province. The quantitative assessment was conducted to measure three types of ecosystem services including carbon sequestration, soil conservation, and water conservation. Overlay analysis was then utilized to determine the comprehensive ecosystem services of Anhui Province. In addition, the method of natural breaks was adopted to classify areas with important ecosystem services, which then were regarded as important ecological sources at the provincial level. Secondly, InVEST model was used to quantitatively assess the quality of Anhui’s habitats, and raster calculation was also conducted to obtain the ecological resistance surface at the provincial level. At last, based on the distribution characteristics of ecological sources and the value of ecological resistance, ecological corridors and key nodes were selected under the guidance of circuit theory, and ESP of Anhui Province was thereby constructed. The specific technological framework is shown in Figure 2.
2.2.1. Assessment on Ecosystem Services
1. Carbon Fixation
Carbon fixation is the process in which organisms convert inorganic carbon into organic carbon through photosynthesis. Net primary productivity (NPP) refers to the gross organics accumulated by plants per unit time and area, equal to gross primary productivity minus the rate of energy loss to metabolism and maintenance. In other words, it is the capacity of green plants to sequestrate and convert inorganic carbon into organic carbon. NPP reflects the rate at which energy is stored as biomass by plants or other primary producers and made available to the consumers (including animals and human beings) in the ecosystem. Therefore, NPP can be used to approximately assess the service function of carbon sequestration.
2. Soil Conservation
The revised universal soil loss equation (RUSLE) is applied to demonstrate the significance of soil conservation. The soil conservation amount equals the potential soil erosion amount minus the actual soil erosion amount. The equation is as follows:
According to the equation: A is the modulus of soil loss (t/(hm2·a)); R is the divisor of rainfall erosivity (MJ·mm/(hm2·h·a)); K is the divisor of soil erodibility (t·hm2·h/(MJ·hm2·mm)); LS is the divisor of slope grade and length (no base unit); C is the divisor of vegetational cover and crop management (no base unit); P is the divisor of water and soil conservation measures (no base unit).
3. Water Conservation
The water production module in InVEST mode is an estimation method based on water balance. The amount of water supply, including surface runoff, water content of soil, canopy interception, and water-holding capacity of litter, equals rainfall amount of every raster minus the actual evaporation amount. It is used to simulate the spatial distribution of regional water supply amount. The specific equation is as follows:
According to the equation: Y(xj) is the amount of water supply in grid x of j type of land use; AET(xj) is the annual evaporation amount of in grid x of j type of land use; P(xj) is the annual rainfall amount in grid x of j type of land use; AET(xj)/P(xj) is used to assess the evaporation subareas of water balance.
According to the equation: Drainage_area is the number of rasters in drainage area, with no basic unit; Soil_Depth is the depth of soil (mm); Percent_Slope is the percentage of slope.
According to the equation: Retention is amount of water conservation (mm); Ksat is the hydraulic conductivity of saturated soil (mm/d), calculated by the software SPAW; V is the coefficient of flow velocity; TI is the index of topography (no basic unit) calculated by Equation (3); Yield is the amount of water supply calculated by Equation (2).
2.2.2. The Construction of Ecological Security Mode
4. Ecological Source
Ecological source refers to lands with important ecological service function and relatively high ecological sensitivity. They are normally aggregated in spatial distribution, usually consisting of relatively large natural ecological patches, playing a significant role in maintaining the ecological stability of that area [21,31,32]. The selected ecological source was based on the assessment of comprehensive ecosystem services, choosing two levels of relatively high comprehensive ecosystem services (the extremely and highly important) to be the ecological source of the research area.
5. Resistance Surface
InVEST mode sets habitat quality to be a continuous variable. During assessment, it adequately considers the impact of land use methods and pattern changes on habitat quality. At last, this mode would output a quality score between 0–1, indicating the habitat quality from the worst to best.
According to the general principle and associated research results for biodiversity [33,34,35,36], as well as the specific situations of research area, habitats were divided into three types: construction, mining, and road (three threat factors). Combined with the advice of experts who are familiar with the research area, the maximum of threatening distance, relative weight function, and the type of spatial recession were finally determined accordingly (Table 2). The format of threat factor attribute table in InVEST is .csv, and the associated data in the table were consistent with the layers. Based on the attributes of threat factors, sensitivity value of threat factor was determined (Table 3), with the format of .csv.
6. Ecological Corridor and Security Pattern
An ecological corridor is the area connected by rasters with the least value of accumulated resistance among ecological sources, and the most accessible ecological channel with low resistance among ecological sources, which is crucial to landscape connectivity. This least-expense path can be recognized by the paths of randomly walking electrons according to circuit theory. The selection of ecological corridor is based on circuit theory, calculated by the tool of Linkage Mapper (http://www.circuitscape.org/linkagemapper).
According to circuit theory, electrons randomly walk through the circuit (random walk theory), this study utilized this character to simulate the relocation and diffusion of individual species or gene flows in certain landscape surfaces. Individual species or gene flows were regarded as electrons, and ecological resistance surface was regarded as conductive surface; landscape types that help species relocate and diffuse were assigned with relatively low resistance, and vice versa. The natural patches with relatively good habitat quality were regarded as nodes (similar to the concept of ecological source). During simulation, certain ground nodes inputted current to other nodes. With the help of the determined resistance value of each raster, current density among nodes can be thereby calculated. Its amount demonstrated the probability of species relocating and diffusing alongside a certain path. Because the value of effective resistance in parallel circuits will decrease as the number of circuit path increases, and current will accordingly increase. When the redundancy, width, and connectivity of corridors increase, the resistance of migrated species will decrease, resulting in higher possibility of successful diffusion.
The construction of ESP in this study is based on circuit theory to recognize ecological corridors, finding the relation curve between points with relatively large current in a corridor. When current simulations of all the coupled patches are finished, their values will be combined into voxel-based accumulated current value (current density). This represents the possibility of that voxel being used by migrated species, and straightforwardly demonstrates the whole ecological pattern of the research area.
3. Results and Discussion
3.1. The Spatial Pattern of Ecosystem Services
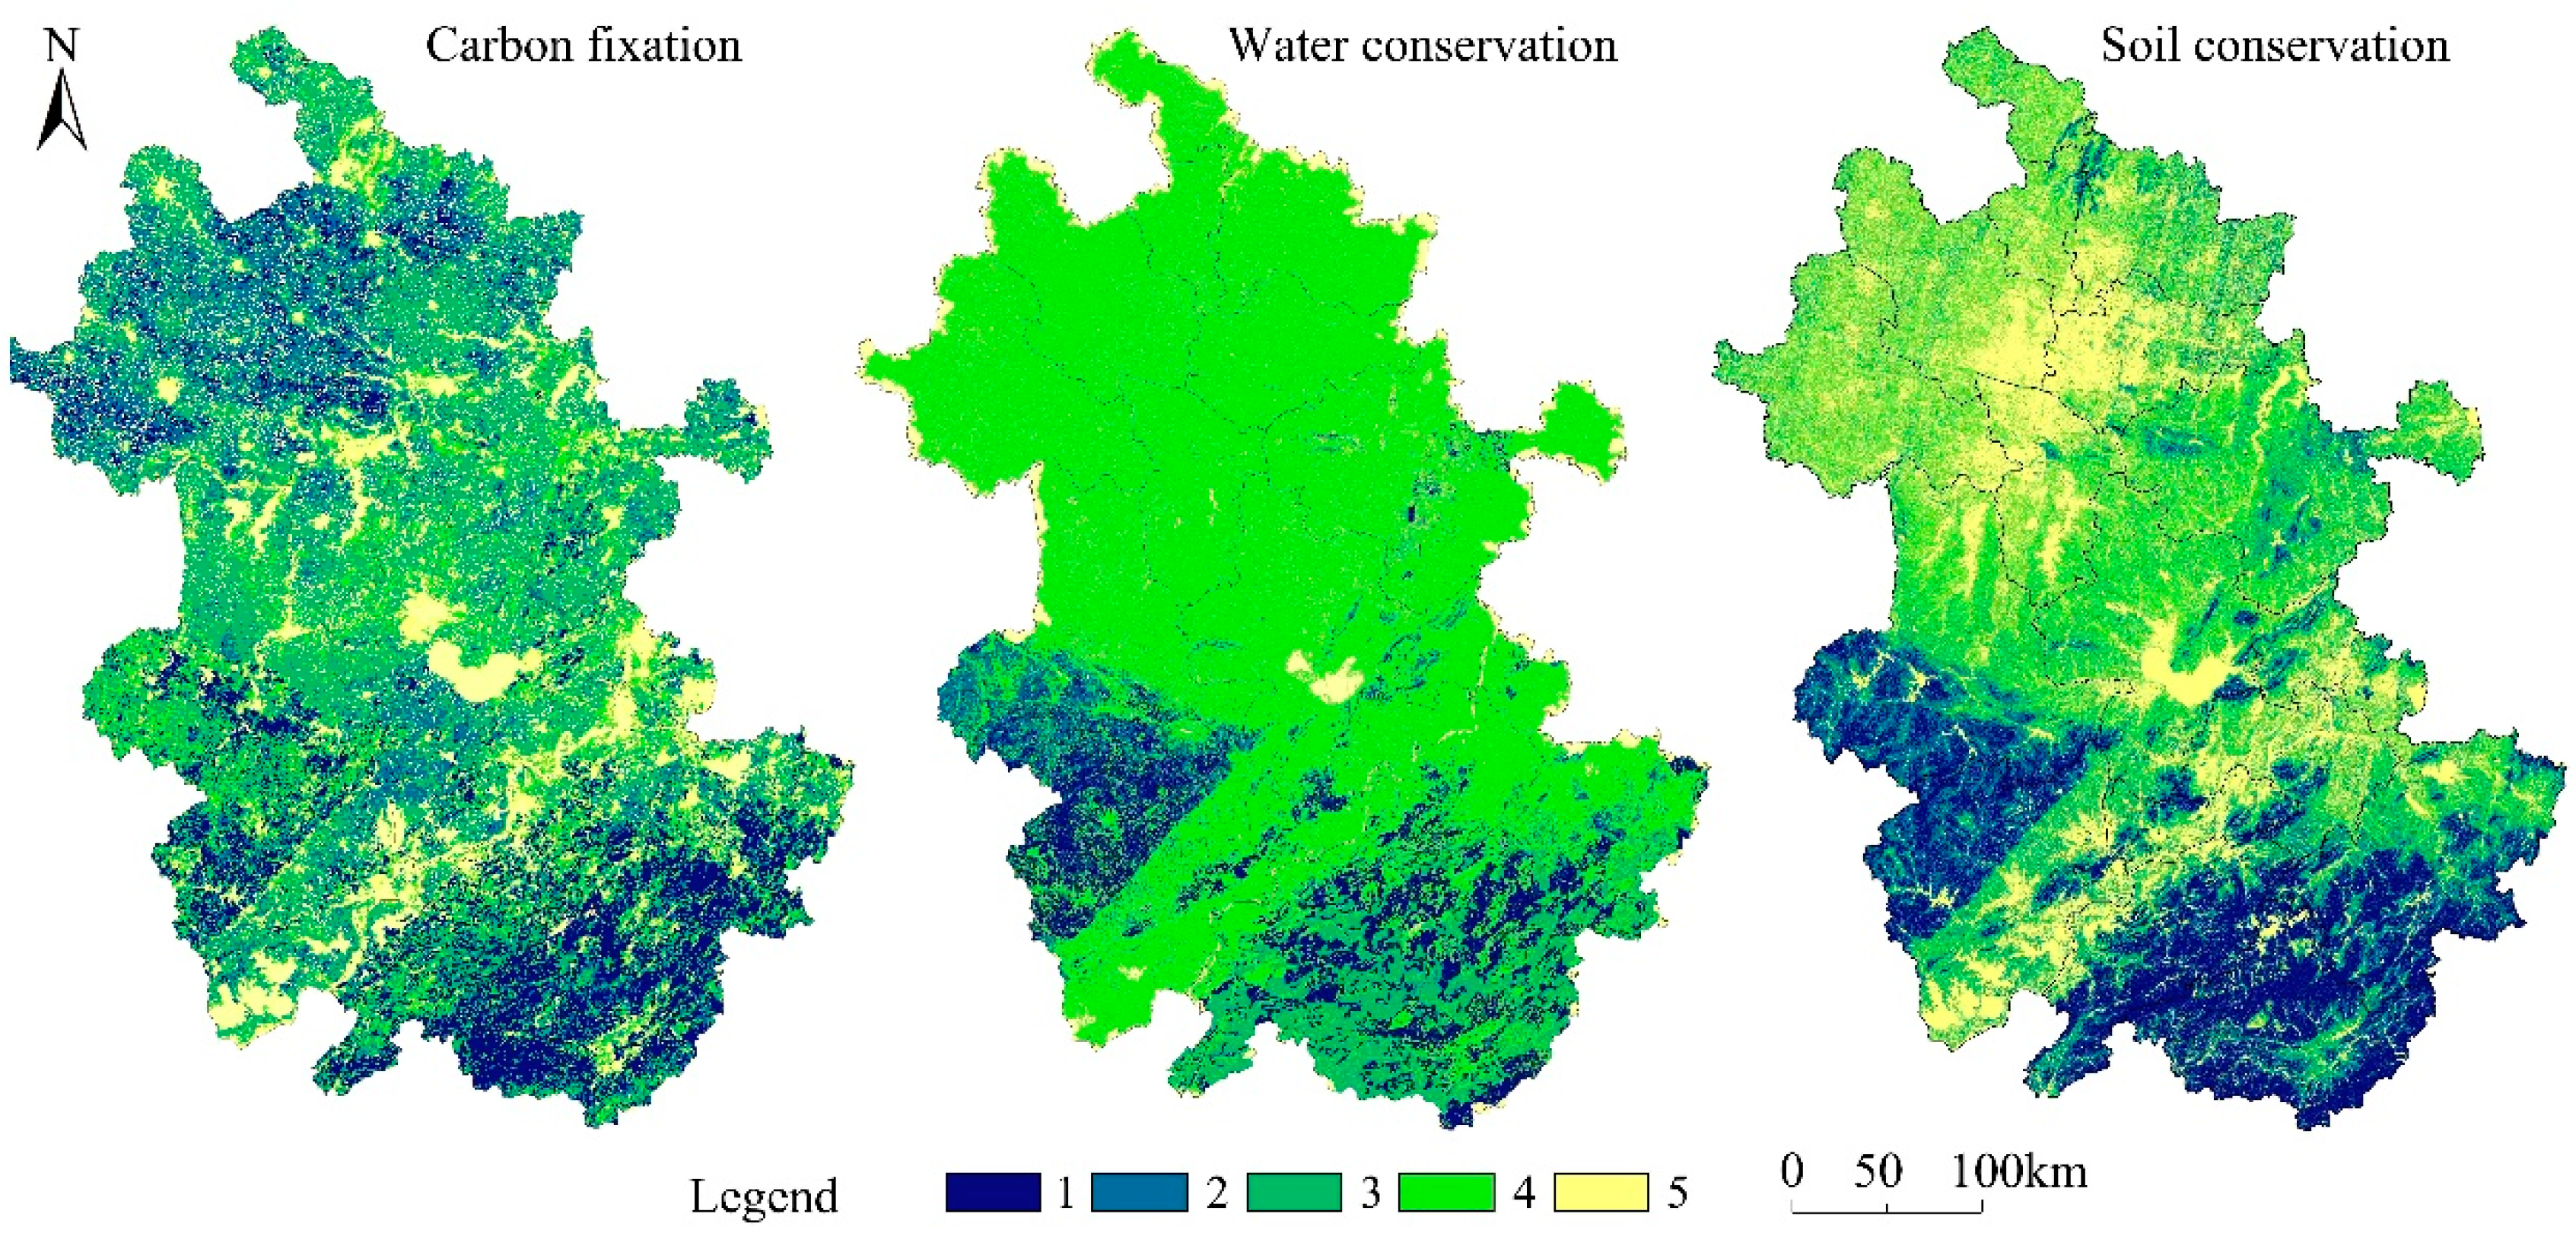
Based on the calculations above, the results of each ecosystem service can be divided into five levels according to natural breaks, ranging from 1 to 5, from high to low (Figure 3). Results showed that carbon sequestration, and water and soil conservation, all exhibited the characteristic of spatial heterogeneity.
Anhui Province has a relatively high capacity of carbon sequestration, and areas with high capacity are basically distributed around the rural area in the north, the low hilly area in the west, and the hilly area in the south. Due to relatively abundant vegetation and low interference from human activities, the peak values of carbon sequestration appeared in the Dabie Mountain area and the hilly area in the south. Traditional farming area in the north exerted a positive impact on carbon sequestration. The total area of levels I and II, the types of the greatest importance, is 41,953.4 km2, accounting for 29.9% of the total area.
The water conservation of the highest level has an area of 13,363 km2, accounting for 9.5% of Anhui’s total area. This area is located in the Yangtze River Basin and Pi River Basin in the west and in the Xinan River Basin in the south, characterized by relatively abundant rainfall controlled by subtropical monsoon. In addition, there are more low hilly areas in the south and west, and many lakes and natural reservoirs are easily formed in intermountain basins with an abundance of vegetation and relatively high capacity for water conservation. The plains in the north have relatively less rainfall than areas in the south of Yangtze River. This area has few rivers, belonging to traditional dry land farming area, with less capacity for water conservation.
Meanwhile, due to various terrain and complicated geography, Anhui is experiencing serious soil erosion. Soil conservation works well in the southern and southwestern parts. The area of the highest level of soil conservation is 19,135 km2, accounting for 13.7% of the research area. Areas with lower capacity for soil conservation are basically concentrated in cities famous for mining and industry alongside the Yangtze River and in areas in the north of Anhui Province, such as Huainan, Bengbu, and Suzhou. The area of this class of soil conservation is 41,007.6 km2, accounting for 29.2% of Anhui’s total area.
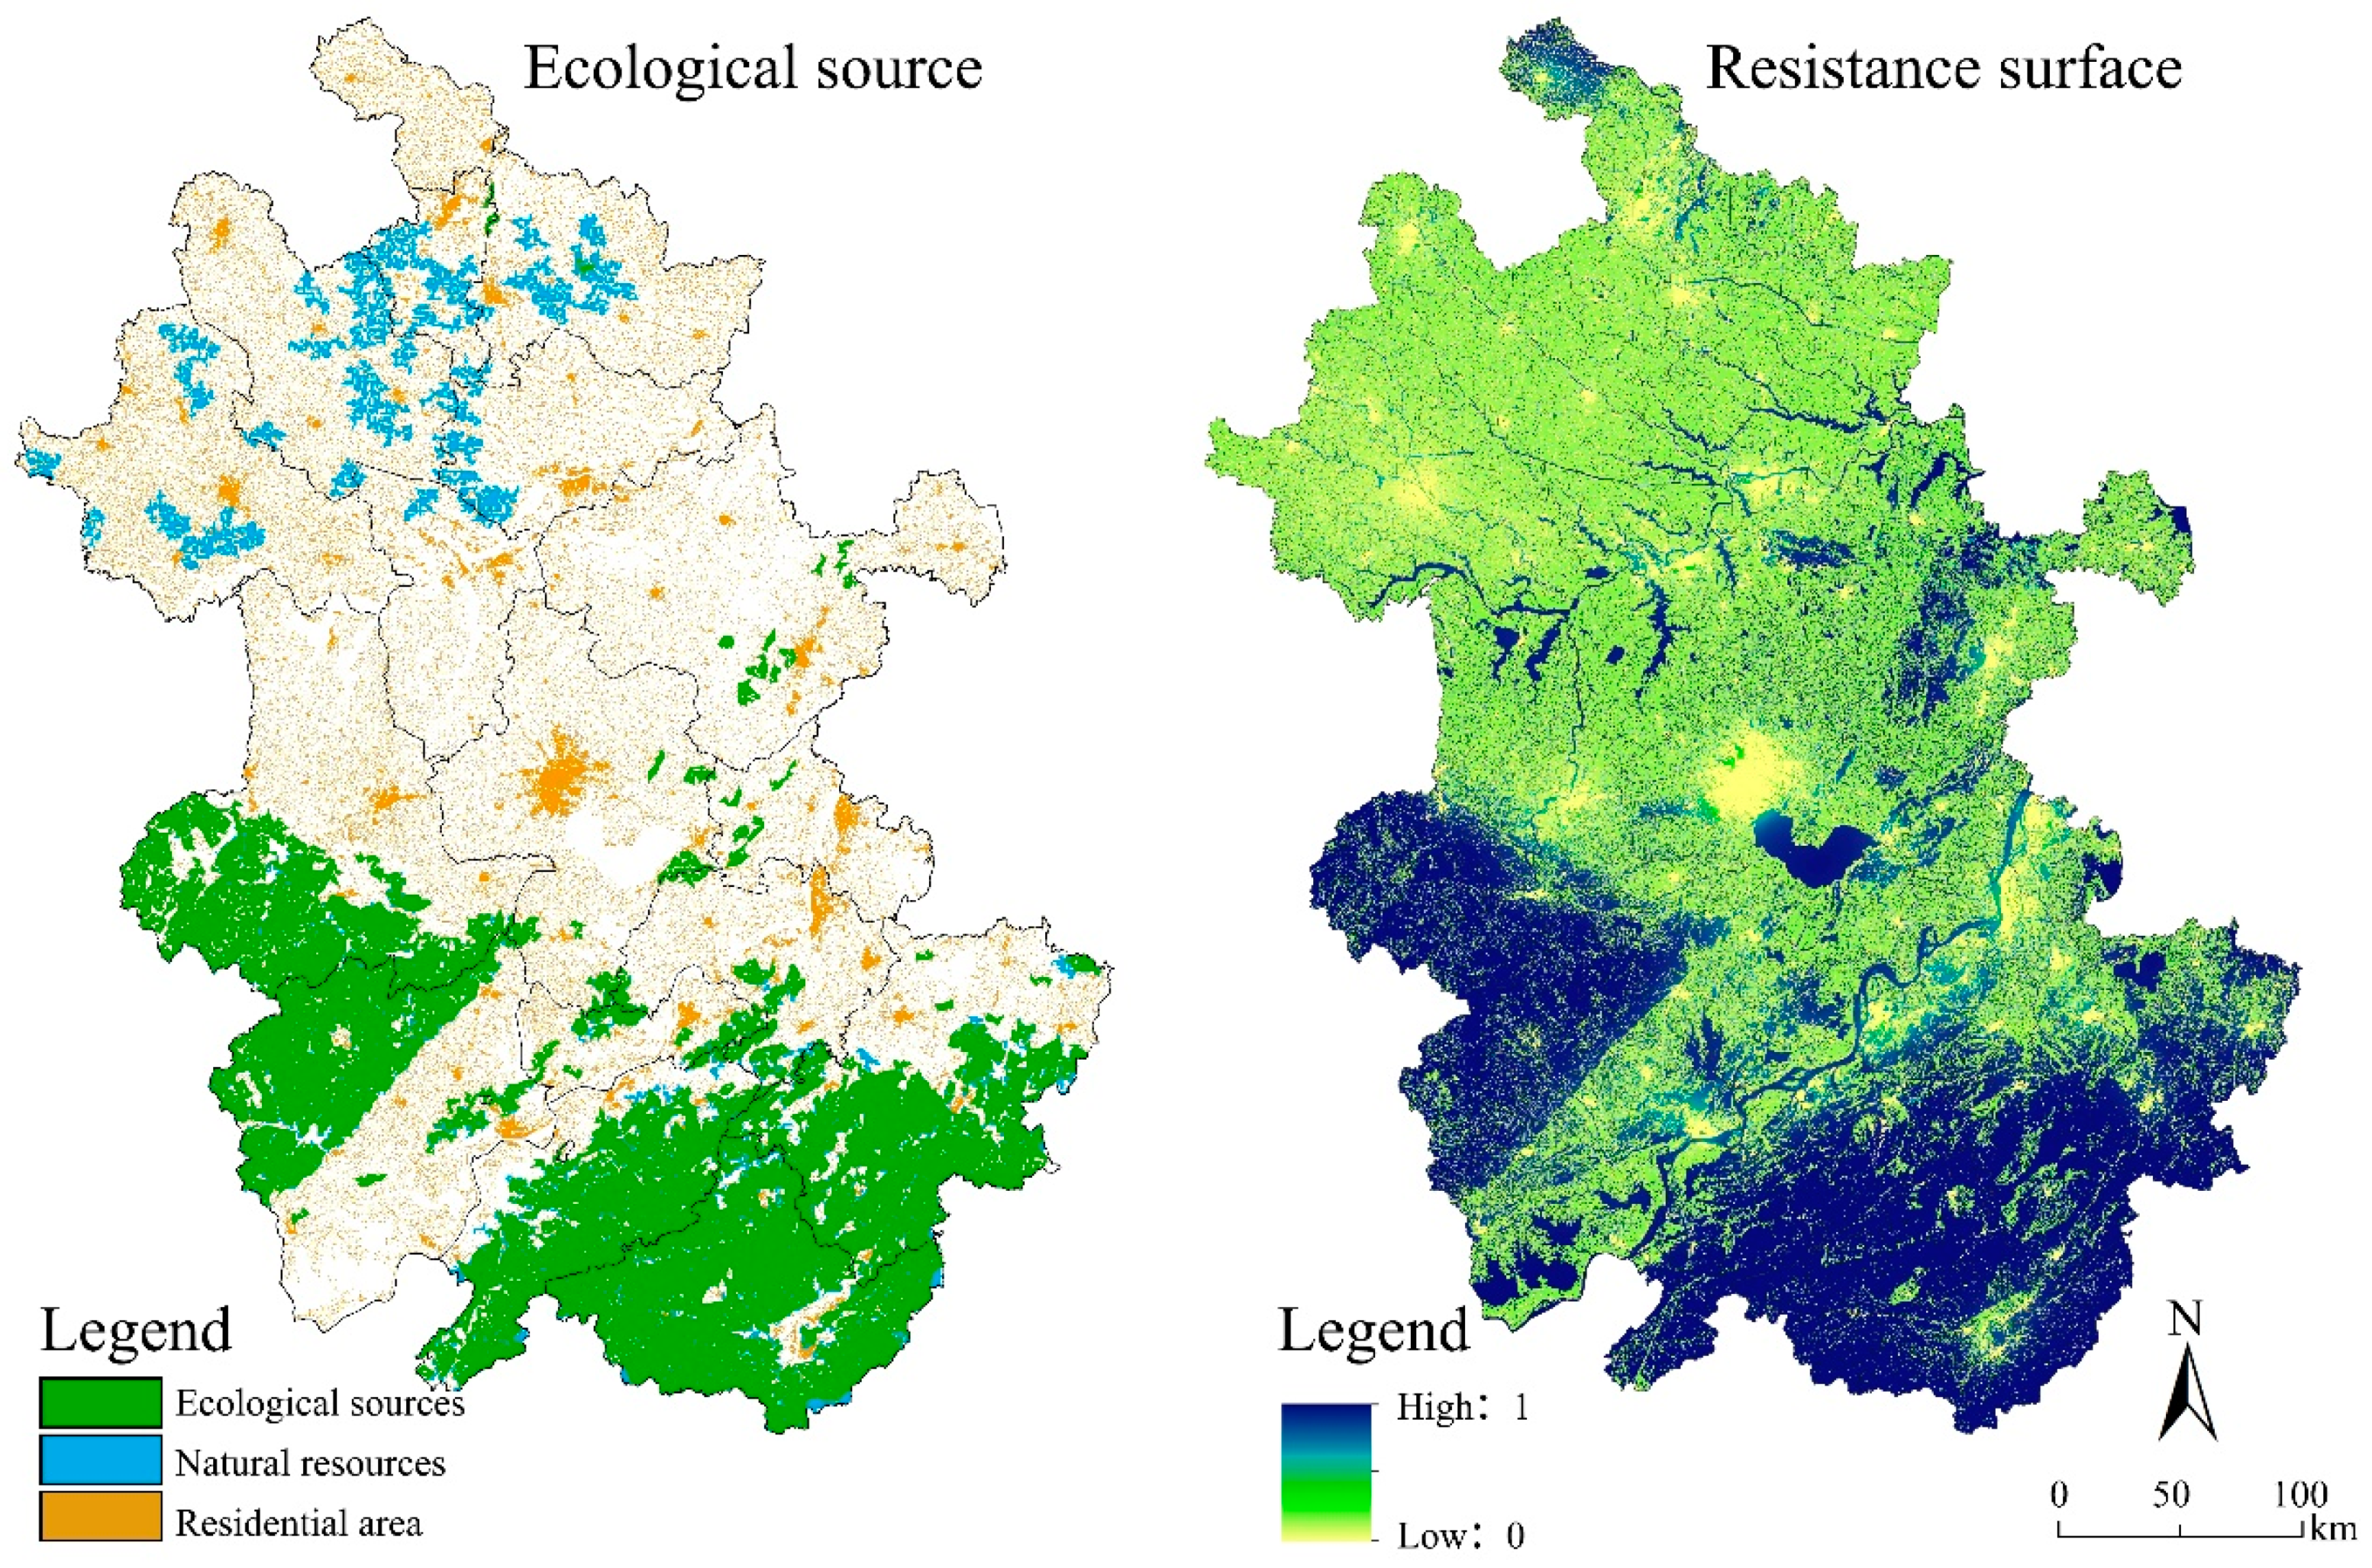
The identification of ecological sources is an important part of ecological security pattern (ESP) construction. When the service level of various ecosystems is above the average level (i.e., equal to or greater than 2), it indicates that the quality of ecological services in these regions is better than that in other regions. Thus, these regions were divided into the main regions of ecosystem services, and then the areas of the three ecosystems services were overlaid to determine natural resources. Further, natural resources were limited within an area of 20 km2, thereby generating ecological source distribution (Figure 4). An ecological source with better regional natural resources is characterized by its warm climate, fertile soil, and low human disturbance. The terrain in the central Anhui is relatively flat, which provides convenient conditions for urban development. Compared with the distribution of residential areas in Figure 4, it can be found that few ecological sources were located within the construction land, indicating that human activities cast a great impact on natural ecosystems. In the process of construction, the original natural ecological system is increasingly disturbed by human production and life, and gradually transformed into artificial or semi-artificial ecological systems. In general, the ecological sources in Anhui Province are basically distributed around the hilly area in the south, the Dabie Mountain area in the west, and the Yangtze River Basin, with a few scattered around the plains in the north. The central regions of Anhui Province, represented by Hefei, the capital of the province, have a generally low level of urban ecological resources. According to administrative offices at the municipal level of Anhui Province, of all the ecological resources, Huangshan has the highest abundance, followed by cities like Chizhou and Liuan, while cities in the center (like Hefei, Chuzhou, Huainan, and Maanshan) and north have relatively few resources. In this study, there were 47 ecological patches of Anhui’s ecological source, with the area of 29,913 km2, accounting for 21.35% of Anhui’s total area, including woodland, grassland, farmland, and wetland. The formation of ecological source is derived from the combination of moist climate, fertile soil, and relatively low human interference. The central regions of Anhui Province are relatively flat, providing convenience for urban development. Because of construction, the original ecosystem is under increasing human interference and is gradually being turned into an artificial or semi-artificial ecosystem.
Circuit theory was applied to construct the ecological security mode, defining the resistance value to be the reciprocal of habitat quality. The better the habitat quality was, the lower resistance value would be. InVEST mode was applied to calculate the habitat quality of Anhui, and the results were exhibited with numbers between 0–1 (Figure 4); with higher values indicating better quality. The average habitat quality of Anhui Province was 0.57. Of all municipal units, Fuyang (0.35) and Haozhou (0.36) were at the lowest levels of quality, while Huangshan (0.91) had the best quality. Accordingly, Fuyang and Haozhou owned the largest values of urban resistance.
3.2. Spatial Characteristics of the Ecological Security Pattern
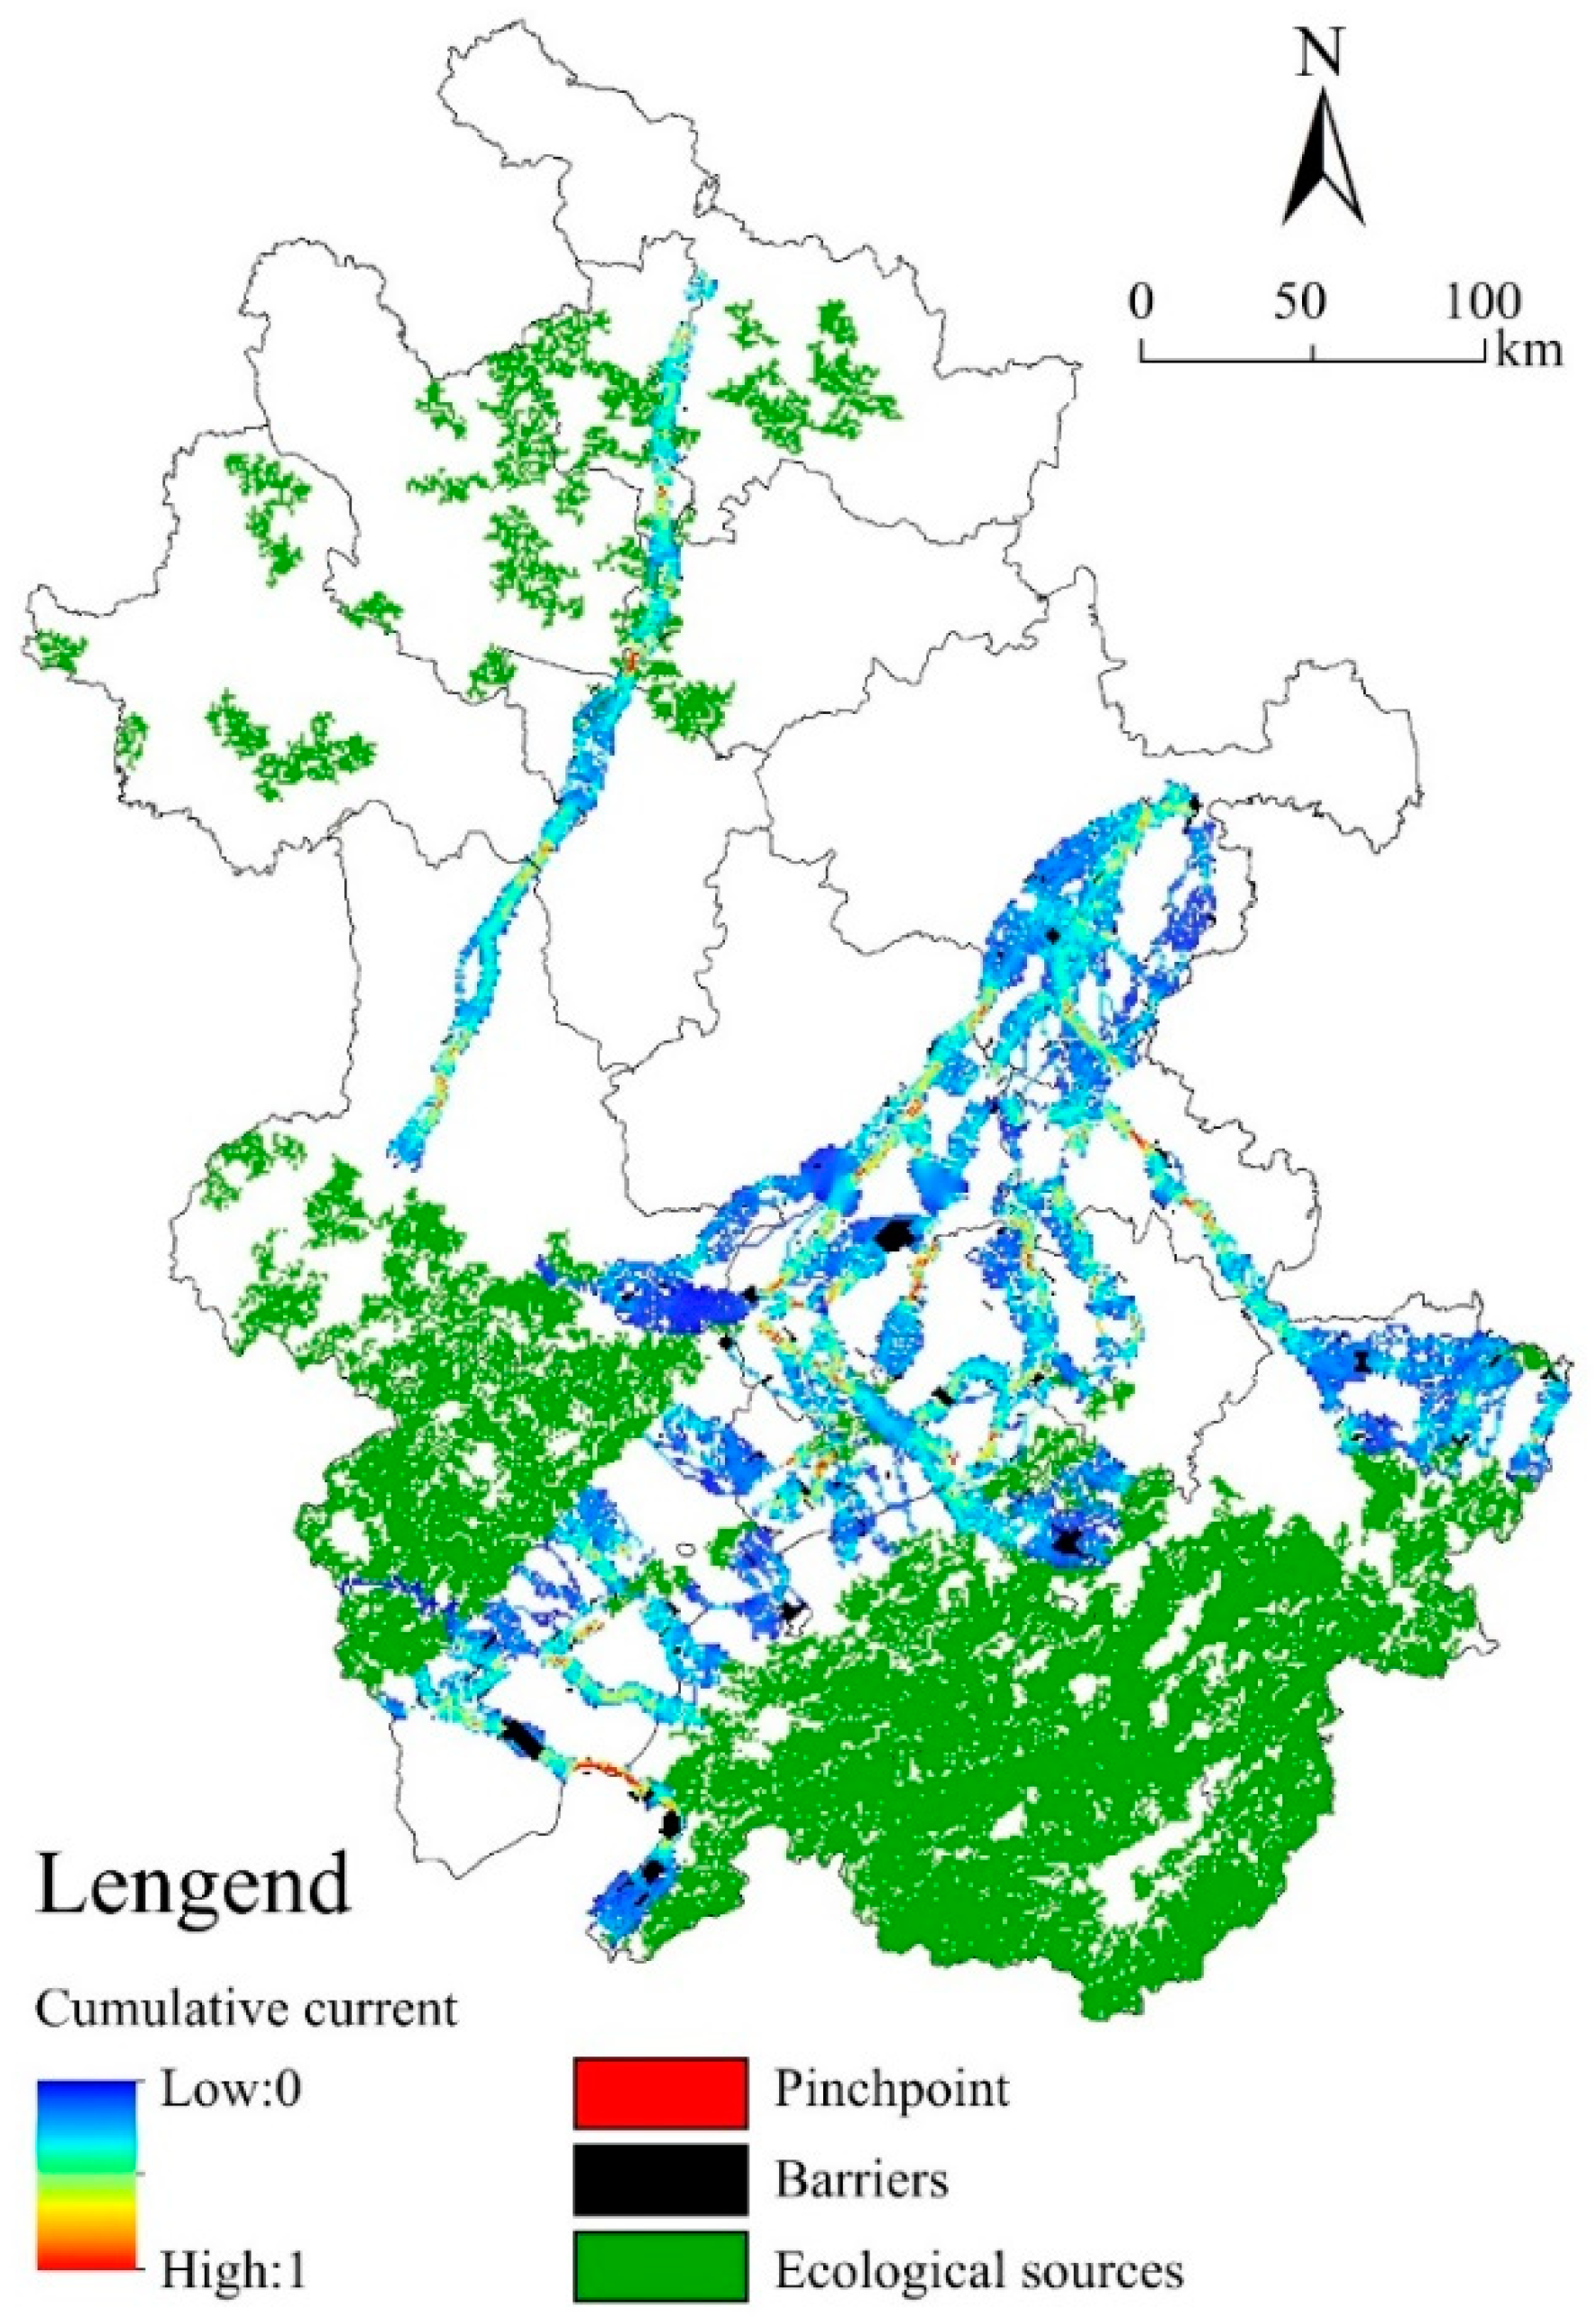
According to the calculation by Linkage Mapper, there were 47 ecological patches, 107 ecological corridors, 16 pinch points, and six sticking points in Anhui Province. There were 72 corridors with a length of over 10 km, 50 with a length of over 20 km, 18 with a length of over 50 km, and six with a length of over 100 km. The longest had a length of 395.5 km (Figure 5). The provincial pattern was mainly connected by several corridors among cities in the west and south of Anhui and alongside the Yangtze River, with relatively small resistance; a relatively small number of corridors existed in the center and north of Anhui. There was only one ecological corridor in the line of Liuan–Huainan–Bengbu–Suzhou, resulting in relatively large resistance of that area. The whole pattern was divided by the watershed of Yangtze and Huai rivers: the southern portion had the best ecology, followed by the northern.
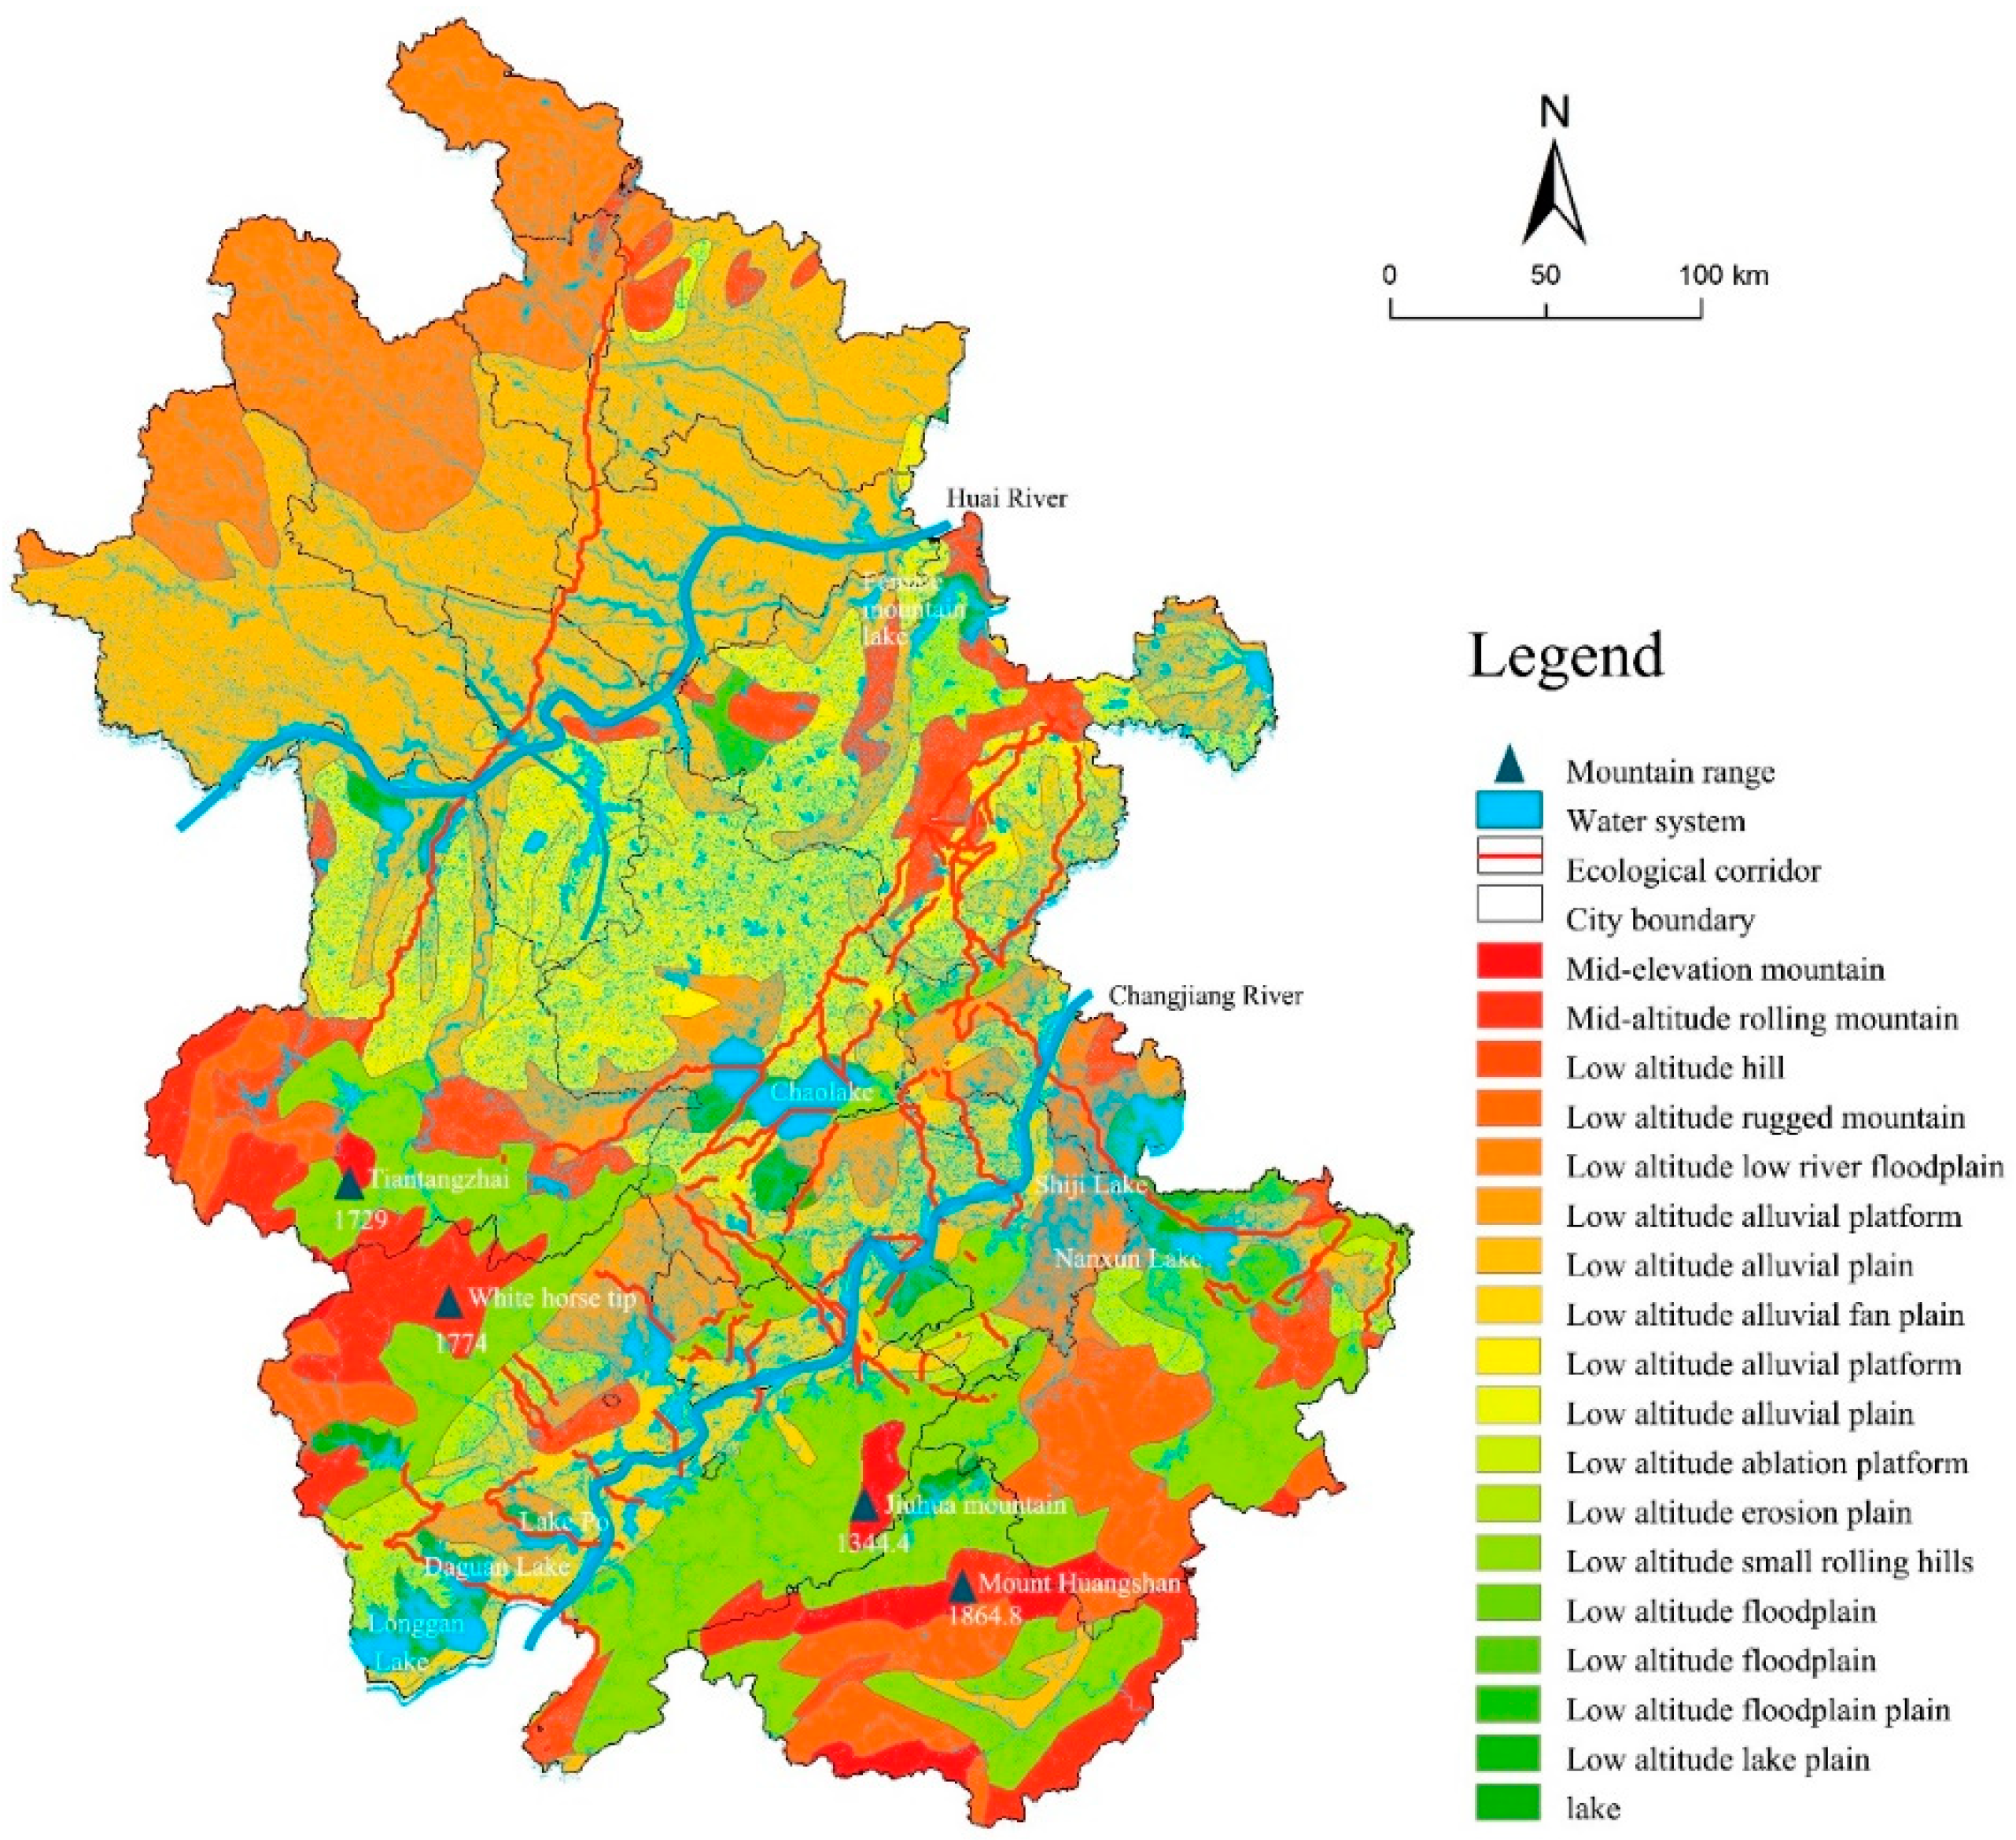
Cities like Huangshan, Chizhou, and Yicheng in the south and Wuhu, Tongling, Maanshan, and Anqing alongside the Yangtze River have abundant urban ecological sources, numerous ecological corridors, a relatively high average current density. This region has a hilly terrain, with diversified geography, including plain, tableland, low hilly area, and hilly area (Figure 6), demonstrating a vertically diversified structure. Huangshan and Jiuhua Mountain are both included, with sophisticated waters, various plants, and extremely low resistance to current in ecological corridors. The resistance to ecological flow basically comes from elevation gap and accordingly formed natural enclosed water. In the process of urban development, the occupation of ecological corridors should be avoided, in order to protect important ecological corridors and patches, specifically erase negative factors for connectivity, and thereby improve the current situation of ecological corridors and their ecosystem services.
The central part of Anhui Province is located in the watershed of Yangtze and Huai rivers, north of which includes cities like Hefei, Huainan, Chuzhou, and Bengbu. The climate north of the watershed is a temperate monsoon climate, and south is a subtropical monsoon climate. A huge difference exists between the north and south in aspects like climate, terrain, geography, and farming habits; this prevents the connection of the two areas. The great ecological service functions of the south can hardly flow to the cities in the central and north part, leaving the north part as an ecologically vulnerable area. This area has a high level of average resistance and relatively few ecological corridors, but the longest ecological corridor of the province is seated here. On the one hand, this area mainly consists of alluvial terraces and plains with low elevation, suitable for massive farming and production. It has a dense population and a wide range of construction land. On the other hand, this area belongs to Huai River Basin. Flooding frequently happened here historically, causing a relatively bad habitat quality. These two aspects caused a relatively quick recession of ecosystem services in the center and north of Anhui Province, characterized by harsh ecological conditions, relatively crucial environmental problems, and conflicts between humans and land. Anhui Province should confront these ecological problems and positively establish policies on ecological control.
4. Discussion
4.1. The Impact of Different Resistance Thresholds on the Ecological Pattern
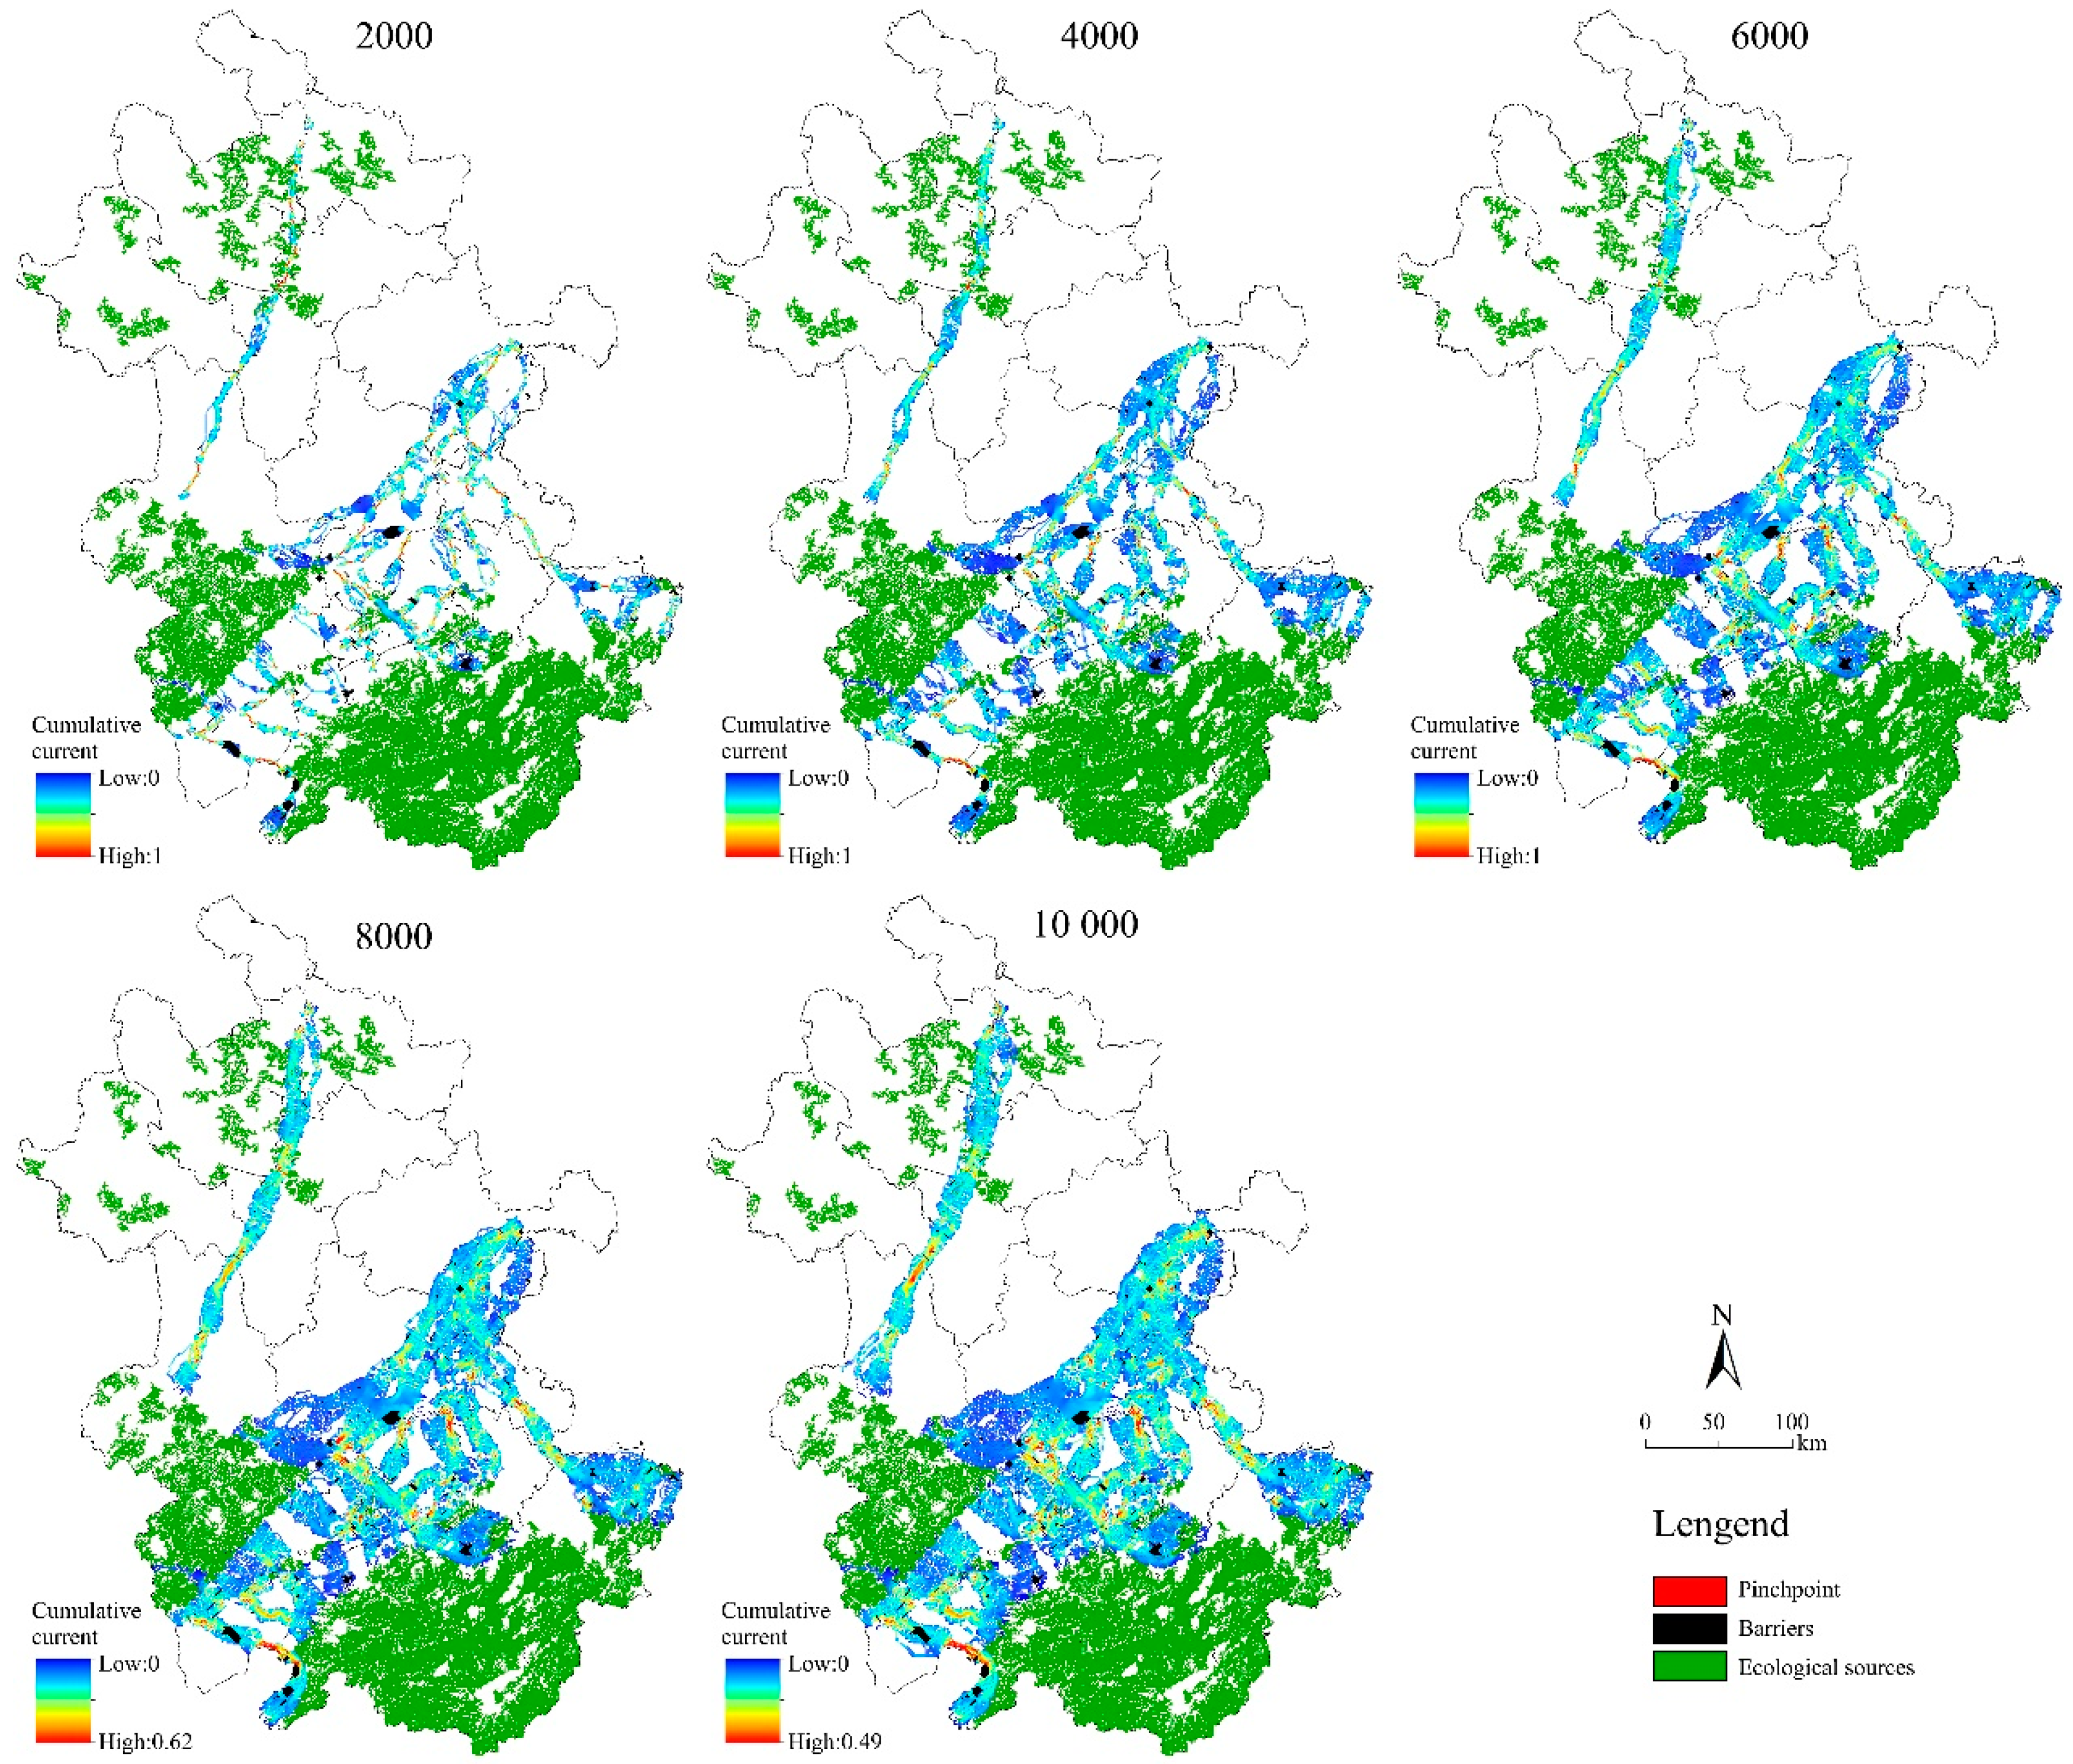
Ecological corridors play an important role in maintaining and restoring ecological patterns. The spatial development of corridor has a close relationship with its ecological function effects. In the application of circuit theory, the range of ecological corridor is determined by the threshold of resistance parameters. As is shown in Figure 7, the range of ecological corridor is determined by the change of resistance value, from 2000 to 10,000, with respective ratio of ESP area of 27.7%, 32.78%, 36.57%, 40.03%, and 42.46%. The area of ecological corridor will increase along with the rise of threshold, but its spatial distribution stays nearly unchanged. In this study, the ratios of ESP area change little with the threshold. Considering factors like urban development and practical economic conditions of Anhui, we selected modes with high threshold to recognize ecological corridor, construct ESP, and adopt more strict but efficient strategies to handle the environmental problems on areas north of the watershed of Yangtze and Huai Rivers.
Based on the selection of ecological corridor by Linkage Mapper, iterative computations were conducted to ground nodes and electricity-input nodes, thereby generating electricity layers. The area consisting of pixels with relatively large accumulated current is pinch point area (the red part), while the contrary is sticking point area (the black part). These two areas are crucial to maintain the connectivity of ecological network.
The rise of threshold increased the flow paths of effective current, and therefore the current of pinch points exhibited a trend of decrease. However, the position of pinch points stayed unchanged, demonstrating that key nodes in ESP have their relatively fixed position. Pinch point areas are mainly located in Yangtze River Basin, with relatively complete system of ecological protection and good landscape connectivity. Sticking points prevent the connectivity of ecological patches. They are the key nodes in the changing process of ecosystem and priority area of ecological protection. As is mentioned above, sticking point areas stayed unchanged despite the increase of threshold, with no trend of transfer or alleviation. Sticking points of relatively high level were mainly located in major waters like Chaohu Lake and certain important lakes in the west and south of Anhui’s province, which blocked the transmission of ecosystem services. The efforts should be exerted on improving sticking point area, enhancing ecosystem services, attempting to construct certain small-scale ecological sources as the base for further development, constructing new corridors between sources, and restoring regional connectivity.
4.2. The Response of Development Policies in Different Ecological Security Patterns
In recent years, Anhui Province has enacted a series of policy documents on ecological protection and environmental improvement (Table 4). The government has made clear regulations and guidelines on aspects like the government’s responsibilities of construction project approval and the market behaviors of ecological protection. It hoped to reduce social burden and release market vitality through the innovation of vertical management. With a focus on the Yangtze River, Huai River and the nature reserves, Reference List of Environmental Emergency Resources was thereby generated. The ecological value was measured, and the compensation mechanism of ecological environmental damage was established. The province was divided into three major categories, namely biodiversity conservation, water conservation, and soil and water conservation, with 16 areas for key protection.
It is important to strengthen measures to protect the ecological environment, address pollution at its source, and focus on the five key areas of governance, namely, urban and rural pollution, agricultural and rural pollution, water source pollution, industrial pollution, and pollution from ships and ports. In addition, a database of experts on ecological and environmental protection led by well-known scholars has been established, aimed at providing professional support in science and technology ecological security and environmental protection. At present, the maintenance and governance of regional ecological security patterns basically focus on problem-solving. The administrative department of Anhui Province hopes to realize this through scientific planning, thorough government approval procedures, rigorous government management and strict development conditions.
At the end of 2018, the urbanization rate of Anhui was 54.7%. Over a period ahead, urbanization is still the theme for Anhui’s future development. The contradiction between land development and ecological protection should be properly treated. It is necessary to classify ecological control, alleviate the conflicts between humans, land and ecological pressure, and improve the supply capacity of regional ecosystem services, in order to satisfy the demand for regional ecosystem services.
Areas in the west and south of Anhui Province with abundant ecosystem services can be divided into ecological conservation areas. The development of these areas should mainly focus on ecological protection, strengthening the protection on animals and plants, and carrying out projects of ecological protection such as returning the grain plots to forestry and closing hillsides to facilitate afforestation. These measures are aimed at increasing forest coverage rate and comprehensively restoring and improving ecosystem services. From the perspective of economic development, this is supposed to sufficiently utilize resource advantages, vigorously develop industries like biology and tourism, and promote the economy on the basis of ecological protection.
Yangtze River Basin in Anhui Province has a relatively good ESP. However, as the center for provincial economic and social development, it is still facing severe environmental pressure. This area should be divided into ecological coordinative areas, mainly focused on alleviating the increasingly severe contradiction between regional economic development and environmental protection and relieving the pressures that human activities place on the ecosystem. This area has a nice base for economic development and technology, and therefore it should be conducted in the future to sufficiently utilize advanced technology, adjust the structure of land use, and improve the efficiency of land use. These methods are mainly devoted to protecting and increasing ecological land and alleviating the increasingly severe contradiction between humans and land.
The vast land in the north of the watershed of Yangtze and Huai rivers in Anhui, due to relatively lagged ecological service functions and a large population, is suffering from the increasingly severe contradiction between economic development and the environment, placing increasing pressure on the ecosystem. This area should be divided into ecological control and restoration areas. This type of area should adopt methods like ecological restoration and supplementation to alleviate the interference of human activities towards the ecosystem, and vigorously curb environmental pollution. Meanwhile, it should improve urban green infrastructure, increasing the green coverage rate in order to restore ecosystem services and improve supply capacity of ecosystem services. In addition, the expansion of constructive land of districts and counties should be strictly controlled in order to fulfill development reduction. Land use should be conducted intensively and economically, in order to improve the efficiency of land use, exploit development potential, and promote sustainable regional development.
4.3. Problems in Ecological Security Pattern Research
The effective construction and maintenance of a regional ecological security pattern is not only conducive to the integrity of ecosystem structure and function, biodiversity protection, and ecosystem services maintenance, but also to human welfare, sustainable development, and ultimately, the realization of regional ecological security. Thanks to the above literature research, the complexity of ecological security, and interdisciplinarity, the existing research involves diversified contents. The construction of ecological security patterns has experienced a change from qualitative description to quantitative analysis, from static evaluation to dynamic evolution and prediction, from rigid conditions to optimal elasticity target, and from conservation plans of multiple types to integration and coordination of the whole systems. The research has shifted its focus from structural optimization, such as forest coverage rate and the proportions of arable land, forestry and animal husbandry, to the spatial pattern effects based on ecological processes, such as biological migration, surface runoff, soil erosion, and carbon cycle. The purpose of the study has gradually shifted from species protection and land use allocation to ecological restoration, fragile areas renovation, and sustainable development at regional and national scales. However, this study lacked the analysis on correlation and comparison of the above aspects, leading to the existence of multiple patterns in different regions and under different research conditions. What is the proper area for ecological sources at different levels? What are the suitable geographical conditions for the circuit theory and other models? Therefore, it is necessary to undertake a systematic analysis, so as to conduct comprehensive analysis and integration, and implement the regulations on management and decision-making of the ecological security pattern.
5. Conclusions
Based on circuit theory, taking Anhui Province as an example, with the constructive analysis on ecological source, ecological corridor, pinch point, sticking point, and the whole ESP, the conclusion generated is as follows:
(1) Based on ecological services and circuit theory, Anhui’s ESP has another method of construction. Anhui’s ESP includes 47 ecological patches, 107 ecological corridors, 16 pinch points, and six sticking points. The whole area of ecological source is 29,913 km2, accounting for 21.35% of Anhui’s total area. The woodland is major type of ecological patch, accounting for 85.9% of the total. Areas in the south of the watershed of Yangtze and Huai rivers have relatively better regional ecological service functions and relatively high connectivity of ecological corridors. Sources are mostly connected by short corridors under 50 km, basically distributed among cities like Huangshan, Chizhou, Xuancheng, Anqing, Liuan, and Tongling, mainly cities belonging to Yangtze River Basin. Despite the increase of current threshold, the ESP between the south and north of Anhui shows less significant response. Areas in the north of Anhui still have ecological service functions, but with blocked connectivity of ecological corridors. It is necessary to provide more targeted measures of ecological control for ecosystem services like biodiversity, water conservation, and forest coverage rate. In addition, pinch point and sticking point areas should be the priority of ecological restoration and reconstruction.
(2) Research on China’s regional ESP construction has been widely carried out, but there are certain problems needing high attention or efficient solutions. These problems should be addressed in future work. For example, the determination of key thresholds, as the basis of regional ESP construction, affects the resulting effectiveness of research on source recognition, corridor width setting, and conservation area division, etc. Though ESP construction can hardly achieve complete scientific control, effectiveness assessment is still the key component of ESP construction and should be paid great attention. Coupling associations among ecological processes should be deeply analyzed in order to realize the effective control and improvement of ecological problems, enhance the effectiveness of ecological protection, and realize the integrated management of mountain, water, woodland, farmland, and lake. These are the pivotal components of ESP construction.
Author Contributions
Conceptualization, J.L. and J.X.; methodology, J.L. and J.C.; software, J.L.; writing—original draft preparation, J.L.; writing—review and editing, J.L. and J.C.
Funding
This research was funded by the National Natural Science Foundation of China, grant number 51678001.
Conflicts of Interest
The authors declare no conflicts of interest.
References
- Nathwani, J.; Lu, X.L.; Wu, C.Y.; Fu, G.; Qin, X.N. Quantifying security and resilience of Chinese coastal urban ecosystems. Sci. Total Environ. 2019, 672, 51–60. [Google Scholar] [CrossRef] [PubMed]
- Mukherjee, J.; Karan, S.; Chakrabarty, M.; Banerjee, A.; Rakshit, N.; Ray, S. An approach towards quantification of ecosystem trophic status and health through ecological network analysis applied in Hooghly-Matla estuarine system, India. Ecol. Indic. 2019, 100, 55–68. [Google Scholar] [CrossRef]
- Li, Y.X.; Wang, X.J.; Tian, X.; Zhang, Y. Understanding the mechanism of urban material metabolism with ecological network analysis: An experimental study of Wuxi, China. Ecol. Model. 2018, 367, 58–67. [Google Scholar] [CrossRef]
- Chi, Y.; Xie, Z.L.; Wang, J. Establishing archipelagic landscape ecological network with full connectivity at dual spatial scales. Ecol. Model. 2019, 399, 54–65. [Google Scholar] [CrossRef]
- Clauzel, C.; Jeliazkov, A.; Mimet, A. Coupling a landscape-based approach and graph theory to maximize multispecific connectivity in bird communities. Landsc. Urban Plan. 2018, 179, 1–16. [Google Scholar] [CrossRef]
- Banerjee, A.; Scharler, U.M.; Fath, B.D.; Ray, S. Temporal variation of keystone species and their impact on system performance in a South African estuarine ecosystem. Ecol. Model. 2017, 363, 207–220. [Google Scholar] [CrossRef]
- Lv, Z.Y.; Yang, J.; Wielstra, B.; Wei, J.; Xu, F.; Si, Y.L. Prioritizing Green Spaces for Biodiversity Conservation in Beijing Based on Habitat Network Connectivity. Sustainability 2019, 11, 2042. [Google Scholar] [CrossRef]
- Manolis, E.N.; Karetsos, G.K.; Poravou, S.A. ka Soil Erosion Risk Assessment in a Catchment Area for Ecological Monitoring of Protected Areas Using Geographic Information System. J. Environ. Prot. Ecol. 2019, 20, 146–155. [Google Scholar]
- Capotorti, G.; Orti, M.M.A.; Copiz, R.; Fusaro, L.; Mollo, B.; Salvatori, E.; Zavattero, L. Biodiversity and ecosystem services in urban green infrastructure planning: A case study from the metropolitan area of Rome (Italy). Urban For. Urban Green. 2019, 37, 87–96. [Google Scholar] [CrossRef]
- Richter, B.; Behnisch, M. Integrated evaluation framework for environmental planning in the context of compact green cities. Ecol. Indic. 2019, 96, 38–53. [Google Scholar] [CrossRef]
- Cunha, N.S.; Magalhaes, M.R. Methodology for mapping the national ecological network to mainland Portugal: A planning tool towards a green infrastructure. Ecol. Indic. 2019, 104, 802–818. [Google Scholar] [CrossRef]
- Pili, S.; Serra, P.; Salvati, L. Landscape and the city: Agro-forest systems, land fragmentation and the ecological network in Rome, Italy. Urban For. Urban Green. 2019, 19, 2485–2495. [Google Scholar] [CrossRef]
- Sarvasova, Z.; Quiroga, S.; Suarez, C.; Ali, T.; Lukmine, D.; Dordevic, I.; Hrib, M. Understanding the drivers for Natura 2000 payments in forests: A Heckman selection analysis. J. Nat. Conserv. 2018, 46, 28–37. [Google Scholar] [CrossRef]
- Tan, L.M.; Arbabi, H.; Li, Q.Q.; Sheng, Y.L.; Tingley, D.D.; Mayfield, M.; Coca, D. Ecological network analysis on intra-city metabolism of functional urban areas in England and Wales. Resour. Conserv. Recycl. 2018, 138, 172–182. [Google Scholar] [CrossRef]
- Shaikh, F.; Qiang, J.; Ying, F. An ecological network analysis of the structure, development and sustainability of China’s natural gas supply system security. Ecol. Indic. 2017, 73, 235–246. [Google Scholar] [CrossRef]
- Li, Y.H.; Ma, Q.W.; Song, Y.; Han, H.Y. Bringing conservation priorities into urban growth simulation: An integrated model and applied case study of Hangzhou, China. Resour. Conserv. Recycl. 2019, 140, 324–337. [Google Scholar] [CrossRef]
- Xiong, J.H.; Tang, J.W. On the coupling harmonic coordination between the land ecological security and the social economic development—A case sampling study of Guangzhou. J. Saf. Environ. 2019, 19, 615–620. [Google Scholar]
- Cheng, F.Y.; Liu, S.L.; Hou, X.Y.; Dong, S.K.; Ana, C.X.X. The effects of urbanization on ecosystem services for biodiversity conservation in southernmost Yunnan Province, Southwest China. J. Geogr. Sci. 2019, 29, 1159–1178. [Google Scholar] [CrossRef]
- Hong, B.T.; Ren, P.; Yuan, Q.Z.; Wang, L. Ecological Function Regionalization in the Upper Yangtze River. J. Ecol. Rural Environ. 2019, 35, 1009–1019. [Google Scholar]
- Lv, L.H.; Zhang, B.L.; Xie, X.S.; Luo, H. China’s Energy Ecological Security Impact Assessment and Policy Recommendations. Res. Environ. Sci. 2018, 31, 1819–1826. [Google Scholar]
- Peng, W.F.; Zhou, J.M. Development of Land Resources in Transitional Zones Based on Ecological Security Pattern: A Case Study in China. Nat. Resour. Res. 2019, 28, 43–60. [Google Scholar] [CrossRef]
- Wang, Y.; He, C.; Liu, R.G.; Wu, H.B.; Cheng, X.Q. Construction of the landscape ecological security pattern for the conservation of birds at Shapotou National Nature Reserve, Ningxia. Acta Ecol. Sin. 2017, 37, 5531–5541. [Google Scholar]
- Wang, G.; Yu, Q.; Yang, D.; Zhang, Q.B.; Yue, D.P.; Liu, J.H. Research on the Construction Method of Hierarchical Ecological Network in Baotou City. Trans. Chin. Soc. Agric. Mach. 2019, 1–16. [Google Scholar] [CrossRef]
- Wu, M.Q.; Hu, M.M.; Wang, T.; Fan, C.; Xia, B.C. Recognition of urban ecological source area based on ecological security pattern and multi-scale landscape connectivity. Acta Ecol. Sin. 2019, 39, 4720–4731. [Google Scholar]
- Karadag, A.A. A Research on Determination of Vulnerable Landscapes in Terms of Groundwater: Duzce Case, Turkey. Fresenius Environ. Bull. 2019, 28, 3231–3241. [Google Scholar]
- Sun, Y.X.; Liu, S.L.; Dong, Y.H.; An, Y.; Shi, F.N.; Dong, S.K.; Liu, G.H. Spatio-temporal evolution scenarios and the coupling analysis of ecosystem services with land use change in China. Sci. Total Environ. 2019, 681, 211–225. [Google Scholar] [CrossRef] [PubMed]
- Wang, Y.Y.; Shen, C.Z.; Jin, X.B.; Bao, G.Y.; Liu, J.; Zhou, Y.K. Developing and optimizing ecological networks based on MSPA and MCR model. Ecol. Sci. 2019, 38, 138–145. [Google Scholar]
- Yuan, Y.H.; Xu, J.G. Research on Landscape Ecological Network Construction of Mountainous Cities. City Plan. Rev. 2015, 39, 105–112. [Google Scholar]
- Zhao, X.Q.; Tan, K.; Yi, Q.; Li, S.N.; Miao, P.P.; Pu, J.W. Construction of ecological security pattern in typical plateau lake basin—A case of the Qilu lake basin. China Environ. Sci. 2019, 39, 768–777. [Google Scholar]
- Huang, X.F.; Wu, C.F.; You, H.Y.; Xiao, W.; Zhong, S.Q. Construction of rural landscape ecological corridor in water network plain area based on MCR Model. Trans. Chin. Soc. Agric. Eng. 2019, 35, 243–251. [Google Scholar]
- Wang, D.; Chen, J.; Zhang, L.; Sun, Z.; Wang, X.; Zhang, X.; Zhang, W. Establishing an ecological security pattern for urban agglomeration, taking ecosystem services and human interference factors into consideration. PeerJ 2019, 7, e7306. [Google Scholar] [CrossRef] [PubMed]
- Vasco, S.; Catry, F.X.; Fernandes, P.M.; Rego, F.C.; Paes, P.; Leónia, N.; Ana, D.C.; Cecília, S.; Bugalho, M.N. Effects of grazing on plant composition, conservation status and ecosystem services of Natura 2000 shrub-grassland habitat types. Biodivers. Conserv. 2019, 28, 1205–1224. [Google Scholar]
- Brunzel, S.; Kellermann, J.; Nachev, M.; Sures, B.; Hering, D. Energy crop production in an urban area: A comparison of habitat types and land use forms targeting economic benefits and impact on species diversity. Urban Ecosyst. 2018, 21, 615–623. [Google Scholar] [CrossRef]
- Rabello, A.M.; Parr, C.L.; Queiroz, A.C.M.; Braga, D.L.; Santiago, G.S.; Ribas, C.R. Habitat attribute similarities reduce impacts of land-use conversion on seed removal. Biotropica 2018, 50, 39–49. [Google Scholar] [CrossRef]
- Halmy, M.W.A. Assessing the impact of anthropogenic activities on the ecological quality of arid Mediterranean ecosystems (case study from the northwestern coast of Egypt). Ecol. Indic. 2019, 101, 992–1003. [Google Scholar] [CrossRef]
- Sallustio, L.; Toni, A.D.; Strollo, A. Assessing habitat quality in relation to the spatial distribution of protected areas in Italy. J. Environ. Manag. 2017, 201, 129–137. [Google Scholar] [CrossRef] [PubMed]
Figure 1.
Research area: the location of Anhui Province in China (left); elevation character of Anhui province (right).
Figure 1.
Research area: the location of Anhui Province in China (left); elevation character of Anhui province (right).

Figure 2.
Research framework.

Figure 3.
Spatial distribution of ecosystem services of Anhui Province (Grade 1 = highest; Grade 5 = lowest).
Figure 3.
Spatial distribution of ecosystem services of Anhui Province (Grade 1 = highest; Grade 5 = lowest).

Figure 4.
The distribution figure of ecological source and resistance surface.

Figure 5.
Spatial distribution figure of Anhui’s ecological security pattern.

Figure 6.
Map of topography and geomorphology in Anhui Province.

Figure 7.
The Range of Ecological Corridors and Changing Trend of Accumulated Current.


Table 1.
The needed data and their sources.
| Name of Data | Data Source |
|---|---|
| DEM topographic data of Anhui Province with 30 m resolution | Geospatial Data Cloud (http://www.gscloud.cn/) |
| Meteorological dataset of monthly surface observation values in China | National Meteorological Information Center (http://data.cma.cn/) |
| China 1:1 million soil database | Harmonized World Soil Database (HWSD) |
| Survey on the change of Anhui’s present land use | Department of Natural Resources (DNR) (http://www.fao.org/soils-portal/soil-survey/soil-maps-and-databases/harmonized-world-soil-database-v12/en) |
| NDVI data between 2009–2018 | Resources and Environment Data Service Center, Chinese Academy of Sciences (http://www.resdc.cn/Default.aspx) |
| NPP data between 2000–2010 |
Table 2.
Threat factor attribute table.
| MAX_DIST | WEIGHT | THREAT | DECAY |
|---|---|---|---|
| 8 | 0.5 | construction | exponential |
| 7 | 0.6 | mining | exponential |
| 5 | 0.3 | road | linear |
Table 3.
Sensitivity of habitat types to threat factors.
| LULC | NAME | HABITAT | L_constrcution | L_mining | L_road |
|---|---|---|---|---|---|
| 1 | forest | 1 | 0.8 | 0.75 | 0.8 |
| 2 | grassland | 0.8 | 0.5 | 0.5 | 0.4 |
| 3 | farmland | 0.4 | 0.5 | 0.4 | 0.35 |
| 4 | construction | 0 | 0 | 0 | 0 |
| 5 | mining | 0 | 0 | 0 | 0 |
| 6 | waters | 1 | 0.6 | 0.5 | 0.6 |
| 7 | road | 0 | 0 | 0 | 0 |
| 8 | other land | 0.1 | 0.3 | 0.3 | 0.3 |
Table 4.
Examples of documents related to ecology in Anhui Province in the past two years.
| Number | Time | Name of Documents |
|---|---|---|
| 1 | September 2019 | Discipline Regulations of Ecological and Environmental Protection Supervision in Anhui Province |
| 2 | September 2019 | Regulations of Environment of Construction Projects in Anhui Province Affecting the Approval Authority |
| 3 | March 2019 | Survey Guidelines (trial) of Environmental Emergency Resources |
| 4 | February 2019 | Opinions on Adhering to Ecological Priority and Green Development and Effectively Strengthening the Management of Nature Reserves |
| 5 | January 2019 | Suggestions on Strengthening the Protection of Aquatic Organisms in the Yangtze River (Anhui) |
| 6 | June 2018 | Ecological Protection Red Lines in Anhui Province |
© 2019 by the authors. Licensee MDPI, Basel, Switzerland. This article is an open access article distributed under the terms and conditions of the Creative Commons Attribution (CC BY) license (http://creativecommons.org/licenses/by/4.0/).
Share and Cite
MDPI and ACS Style
Li, J.; Xu, J.; Chu, J. The Construction of a Regional Ecological Security Pattern Based on Circuit Theory. Sustainability 2019, 11, 6343. https://doi.org/10.3390/su11226343
AMA Style
Li J, Xu J, Chu J. The Construction of a Regional Ecological Security Pattern Based on Circuit Theory. Sustainability. 2019; 11(22):6343. https://doi.org/10.3390/su11226343
Chicago/Turabian StyleLi, Jiulin, Jiangang Xu, and Jinlong Chu. 2019. "The Construction of a Regional Ecological Security Pattern Based on Circuit Theory" Sustainability 11, no. 22: 6343. https://doi.org/10.3390/su11226343
Note that from the first issue of 2016, this journal uses article numbers instead of page numbers. See further details here.