1. Introduction
This study analyzes the effect of a functional classification of government expenditure (FCOGE) on the economic growth of China and Korea, using the quantile regression (QR) model. An economic system is a series of systems that produce and distribute economic resources under the interactive control of the society’s members. As such, the process of solving an economic problem includes a variety of laws, instruments, and social values that define who makes the decisions related to that problem, and how they should be made. In other words, an economic system is a systematic device for the distribution of scarce resources.
An economic system is determined differently depending on the history, culture, and interconnection of the participants in economic activities and government planning. Therefore, the economic system cannot be merely identified as a market economy or a planned economy. Countries the United States, England, and Japan, which are market economies, are not completely free from the influence of government planning. On the contrary, Russia and China, which are planned economies, introduce many elements of the market economy.
Since 1986, China had established early socialism theories and routes under the leadership of Deng Xiaoping, which gradually began to blend the planned economy with a market economy based on socialism. Since the 2008 financial crisis, China’s economic growth rate has shown an unprecedented increase, from the average of % in the mid-2000s to 6.8% in 2016. However, China has also faced the global trend of low growth and aging. Thus, the country entered the
Xinchang Tai era, which is unlike the trend of the “new normal”. As a temporary measure, the Chinese government is continuing to emphasize openness, privatization, and deregulation. As such, the adjustment of the government is becoming increasingly important. The theory of Barro [
1] states that when the main agent of economic activity accumulates real capital, the government puts this into the production process, and prevents the marginal productivity of private capital from falling. If government expenditure increases private productivity, one can expect continued economic growth. In addition, before government expenditure reaches a steady state, it has a positive and maximized effect on growth. If the proportion of government expenditure increases over the steady state, then the economic growth rate will decrease, due to the crowding-out effect. Based on this, the correlation between government expenditure and economic growth can be confirmed by comparing two countries. There may be conflicting results due to differences in the systems between capitalism and socialism. China has been forced to follow the government-led process of economic development, as it has the characteristic of a socialist country. This is similar to the development of the Korean economy in the 1960s, which was strongly controlled in terms of the industry, policies, and education. The economic growth process in Korea is easier to compare with China, as it has the following differences from other countries with capitalist market economic systems.
First, both countries go through a government-led process of economic development. The government of Korea transferred the right of management of state-owned enterprises to the local government in 1978. This action contributed to the improvement of productivity. The average annual economic growth rate was 9.6% from 1978 to 1984.
Korea also promoted rural modernization through the new village movement. It pursued strategies to promote large corporations based on the trickle-down effect. In addition, Korea is divided based on the “varieties of capitalism” (VoC) theory, which distinguishes the capitalism of Hall and Soskice [
2]. They divided the capitalist economic system into three parts, based on the principle of institutional complementation. First, a liberal market economy (LME) has fair competition, contracts, and a hierarchical order. Second, the coordinated market economy (CME) is a strategic collaboration on the basis of an agreement. Unlike LME, it considers a firm as a compromise between the management and the workforce. Third, the Mediterranean market economy (MME) is characterized by a large proportion of agriculture in its industry and strong government intervention through fiscal and monetary policies—for example, France, Italy, and Spain. Therefore, Korea is classified as a Mediterranean market economy (MME). The MME characteristics in Korea are suitable for a country of comparison, as the MME shares the same trend with China, which has undergone a government-led economic development process.
The second commonality is that Korea pursued export-oriented growth strategies. Also, in the initial stage of economic development, the key industry of Korea switched to heavy chemical industry from light industry [
3]. Gradually, Korea has been aiming at export-oriented industrialization. In addition, since 1960, despite the increased intensity of government intervention, that intervention has been effective in economic growth [
4].
One of the main characteristics of China is the shift from a closed economy to an open economy [
5]. China designated Shenzhen, Zhuhai, Shantou, and Xiamen as export-oriented special economic zones in 1980. Subsequent to joining the World Trade Organization in 2001, China’s export ratio to gross domestic product (GDP) increased from 21% to 37% in 2006.
However, the government’s public spending does not always have a positive impact on economic growth, and the question is, what is the productive and unproductive spending of the two systems? In general, productive spending in a free market economy is one that supports the function of the market by facilitating private sector investment and support qualitative growth. However, non-productive spending means that policies and subsidies, implemented for some purpose, flow into a property bubble or finance, creating a macro-prudential crisis. Productive expenditures of a planned economy are those whose costs are all controlled by the central government’s economic development plan. In other words, it is a big government. The most extreme example of unproductive spending, though, is Mao Zedong’s Great Leap Forward Movement. Mistakes in national policy led people to focus on steel production, which soon led to famine.
As such, there are differences in economic growth between the China and Korea, and differences in systems. Our topic is not new, but we will find deep differences in government spending in planned versus free markets, in relation to economic growth, that are of interest to all economists. Both countries have experienced growth through openness, and the role of government has been relatively important. Cultural characteristics are similar because of the same East Asian culture. Therefore, Korea is suitable as a comparison target group.
Considering the above reasons, we can observe the study results through QR. First, we will examine the correlation between FCOGE and economic growth in China and Korea. Second, we can confirm the state of economic development in China and Korea. The composition of this study is as follows. In
Section 2, prior studies in order to review the theoretical backgrounds on government expenditure and economic growth.
Section 3 describes the model and data. In
Section 4, empirical results for China and Korea are provided and analyzed through a comparison between the two countries. Finally,
Section 5 describes conclusion of the study.
2. Literature Review
China is a very unusual case. The economies of the “four tigers” in East Asia, with rapid economic growth, have moved from rural to rural and from low to medium income. However, China is much longer lasting. [
6] This may be a characteristic of China’s economic system. As such, the Chinese government’s spending will be different from that of the general market economy. Government spending in China exists in a centralized form. As the government plans spending according to policy stance, government spending will not help economic growth like in Korea. There are also many studies of the causal relationship between government spending and economic growth [
7,
8,
9], such as Keynes [
10] and Wagner [
11]. However, few studies compare countries with contrasting systems like ours.
Second, there are studies on the correlation between government expenditure and economic growth. Overall, advanced research has shown that the relationship between government expenditure and economic growth has a positive relationship. Saez et al. [
12] use panel regression analysis to study the direction of the impact of government size on economic growth for EU countries for the period 1994–2012. As a result of estimating the order of the general government expenditure scale, a positive relationship was confirmed in Portugal and the United Kingdom. Austria, Finland, Italy, and Sweden, Belgium, France, Greece, Ireland, Luxembourg, Netherlands, and Spain have a negative relationship. It has been revealed that the impact of government expenditure on economic growth can vary depending on the size of the public sector. Hwang and Lee [
13] use a pooled ordinary least squares (OLS), fixed effect, and random effect models to study the size and volatility of the Korean government’s expenditure to influence economic growth. There exists a significant negative relationship between government expenditure size and economic growth, while the impact of government expenditure size on economic fluctuation is statistically insignificant. In addition, the authors confirmed that government expenditure volatility plays a significant role in increasing economic fluctuation. Fölster and Henrekson [
14] use the extreme bounds analysis to find the correlation between government expenditure and growth. The research object was OECD’s 23 high-income countries and, the period was from 1970 to 1995. When government expenditures (including tax) increase 10% in high-income countries, economic growth falls by 0.7–0.8%. However, including low-income countries, the relationship is negative.
The third type of study is on the correlation between FCOGE and economic growth. Research shows that investment expenditure, such as economy, social security, and education have positive effects, while consumer expenditure has negative effects. Piabuo [
15] compares five African countries (Botswana, Rwanda, Zambia, Madagascar, Togo) that have allocated more than 15% of government expenditures on health spending, as well as the eight members of the Central African economic and monetary community (CEMAC: Cameroon, Equatorial Guinea, Garbon, Chad, Central African Republic, and the Democratic Republic of Congo) countries, which did not. The authors used Granger causality and panel data co-integration analysis. Studies show that those living in the five countries mentioned above have a longer lifespan than those living in the CEMAC region. Thus, the recent rapid decline in mortality rates can be explained by an increase in health expenditure. Dao [
16] analyzes the effects of per capita public spending on economic growth, health, and education in 28 developing countries. The ratio of gross physical capital formation in GDP has a positive effect on economic growth. In addition, he claims that developing countries can grow more rapidly if the government increases their spending on health care and education. Dinca et al. [
17] analyzed the relationship between economic growth and public spending in 10 countries in Eastern Europe, using linear multi-regressive analysis with fixed effects and dummy time variables. There is a positive correlation between government expenditure in education, national defense, public order, safety, and economic growth. However, general public service expenditures and national defense expenditures have a negative relationship with economic growth. Education spending and R&D spending during government spending also have a positive impact on economic growth. However, lags exist; educational spending has a very long-term impact, while R&D spending has a shorter impact. [
18] In some studies, the time lag is very important, but since our research is a comparison of systems, we did not consider time lag.
3. Model and Data
QR, as introduced by Koenker and Bassett [
19,
20], has increasingly been a very important empirical tool and is very popular in applied econometrics. Moreover, QR is viewed as an extension of classical OLS of the conditional mean specification. A significant difference between the OLS and QR is merely that the OLS is an estimation based on the conditional mean specification, and QR is an estimation based on the conditional median specification. (*
denote probability.)
In general, any real-valued random variable,
, may be characterized by
Thus, for any
, the conditional
quantile function of
may be defined as the smallest
satisfying
:
where
is the conditional distribution function for a random variable
condition on
, and
is the
th quantile of a random variable
. Thus, the quantile function provides a complete characterization of the random variable,
. Moreover, the quantile function can also be defined as the solution to the following minimization problem: (
argmin denotes to find the value of x that makes
f(x) the minimum.)
where
is a linear check function, and
is the residual for observation “
” and quantile
. A check function
indicates the minimization problem. Thus, if
, then the check function provides
, which is merely
due to a positive residual. If
, then the check function provides
due to a negative residual. We consider a simple case
, which is a median regression. The optimization problem becomes
A median regression is a useful alternative to least squares, where the error distribution follows a normal distribution, but outliers in the data are a problem (Koenker and Hallock, [
21]).
A linear specification for the conditional quantile of a
vector of dependent variable
is
where
is the
vector of independent variables, and
is the
vector of the coefficient associated with the
quantile. In addition, the
vector conditional QR estimator, or least an absolute deviation is
The QR provides estimates of the relationship between the vector of independent variable and an vector of a specified quantile of dependent variable . As the QR does not require a strong distributional assumption, it offers a distributionally robust method of modelling these relationships.
In this study, the ratio of government expenditure by function to government expenditure in Korea from 1970 to 2015 was created by the Bank of Korea. We used the GDPs (real, yearly) of Korea, which were downloaded from OECD data. Unlike other government expenditures, Korea does not follow the Classification of the Functions of Government(COFOG) system; thus, economic expenditure includes fuel and energy, agriculture, forestry, fisheries, hunting, mining, construction, transportation, telecommunications, and other economic projects. The Chinese data used in the study are quarterly data from 2007 to 2016. We downloaded this data from one of China’s financial data analysis company (Wind). As each time series is an unstable time series following I(1), we use the first log difference to ensure stability. Due to the limit of available data, the period cannot be met perfectly. However, in the case of Chinese data, it is consistent with the duration of the Xi Jinping. Korea is a comparative subject, so we think it is possible to do research.
4. Empirical Results
According to Bailey [
22], government spending can be divided into consumption expenditure and investment expenditure. Consumption expenditure leads to an increase in welfare of the private sector, and investment expenditures increases the future production of the private sector. Therefore, the investment expenditures and consumption expenditures used in this study are as follows. Economics, education, and social security expenditures are classified as investment expenditures, while the rest of culture, environment, general public services, culture, and health expenditures are classified as consumption expenditure.
Table 1 shows the estimates of the QR. The interpretation of the quantile estimates is similar to the OLS estimates, and it is more important to observe at the trends of each quantile than to determine the significance of the estimates. Additionally, the estimate of the QR indicates a change in the dependent variable for one unit change of the independent variable at each level of the quantile.
Table 2 shows the QR estimates based on the conditional quantile of China’s economic growth. The deviation of the quantile coefficient is small, at
0.1–0.9. This shows that China’s relationship between economic development and government expenditure appears in a different form from the case of Korea. In particular, the coefficient of general public service expenditure is decreasing as the tau value increases.
Figure 1,
Figure 2,
Figure 3,
Figure 4,
Figure 5,
Figure 6,
Figure 7 and
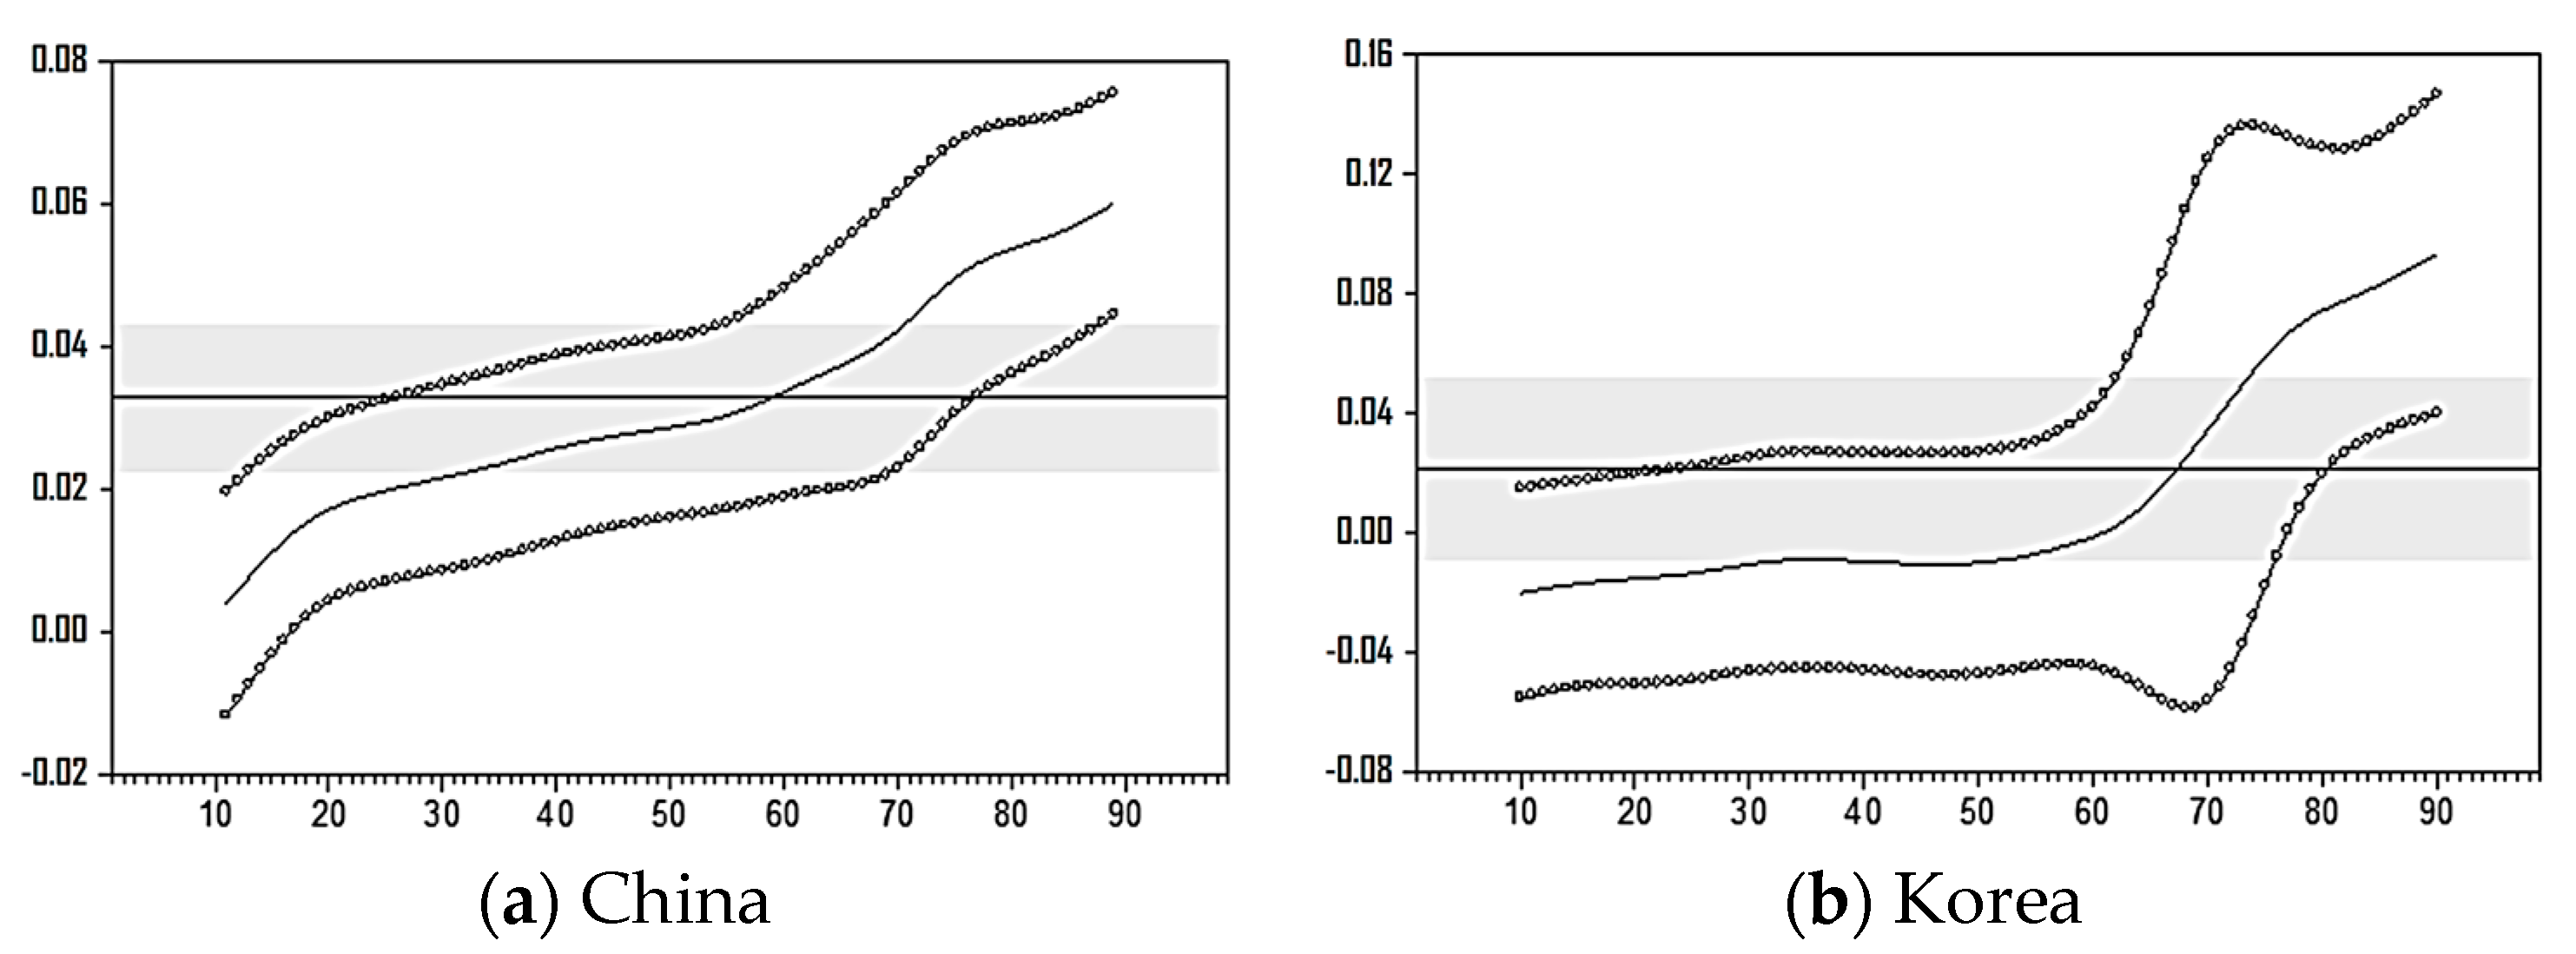
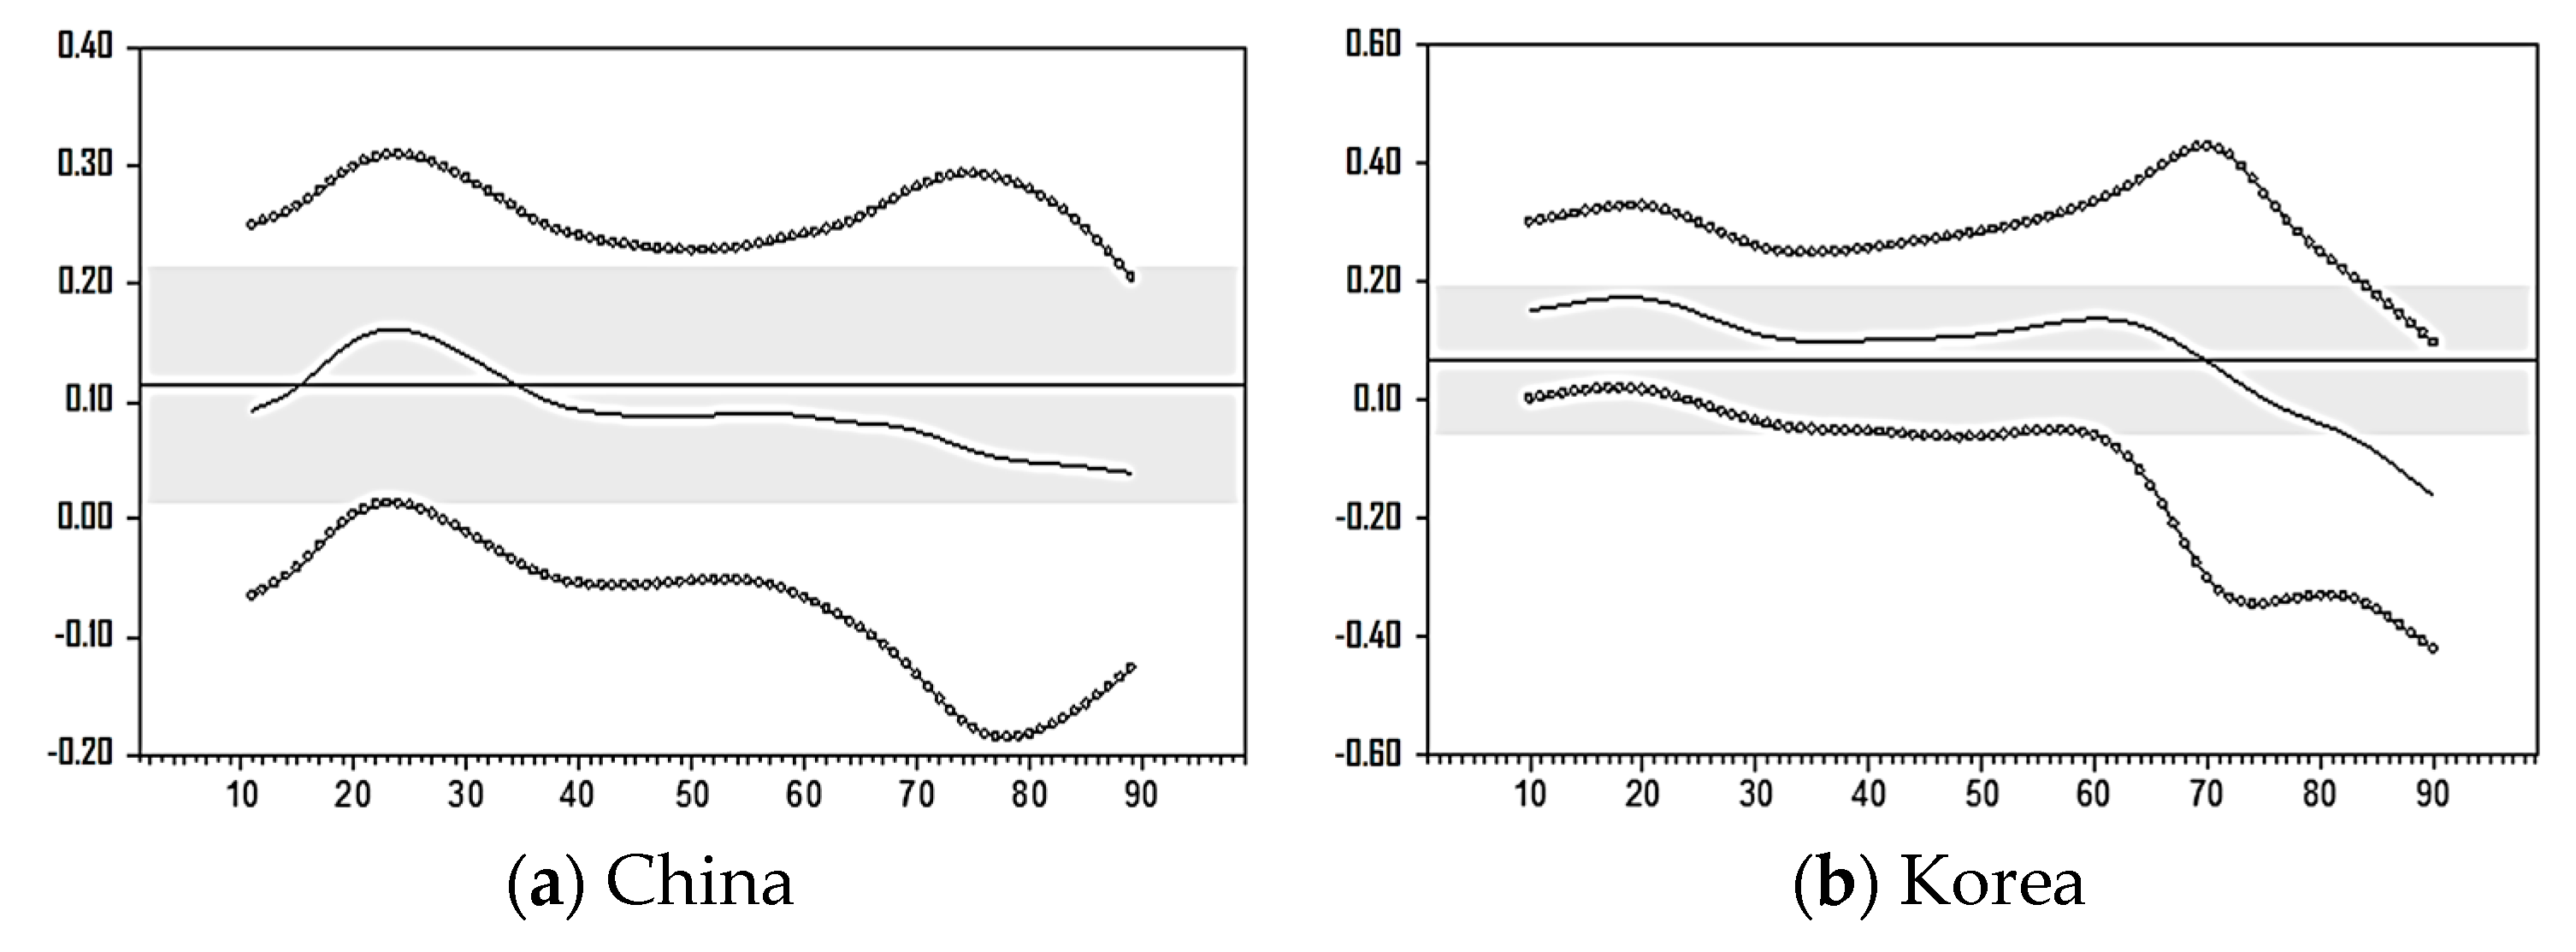
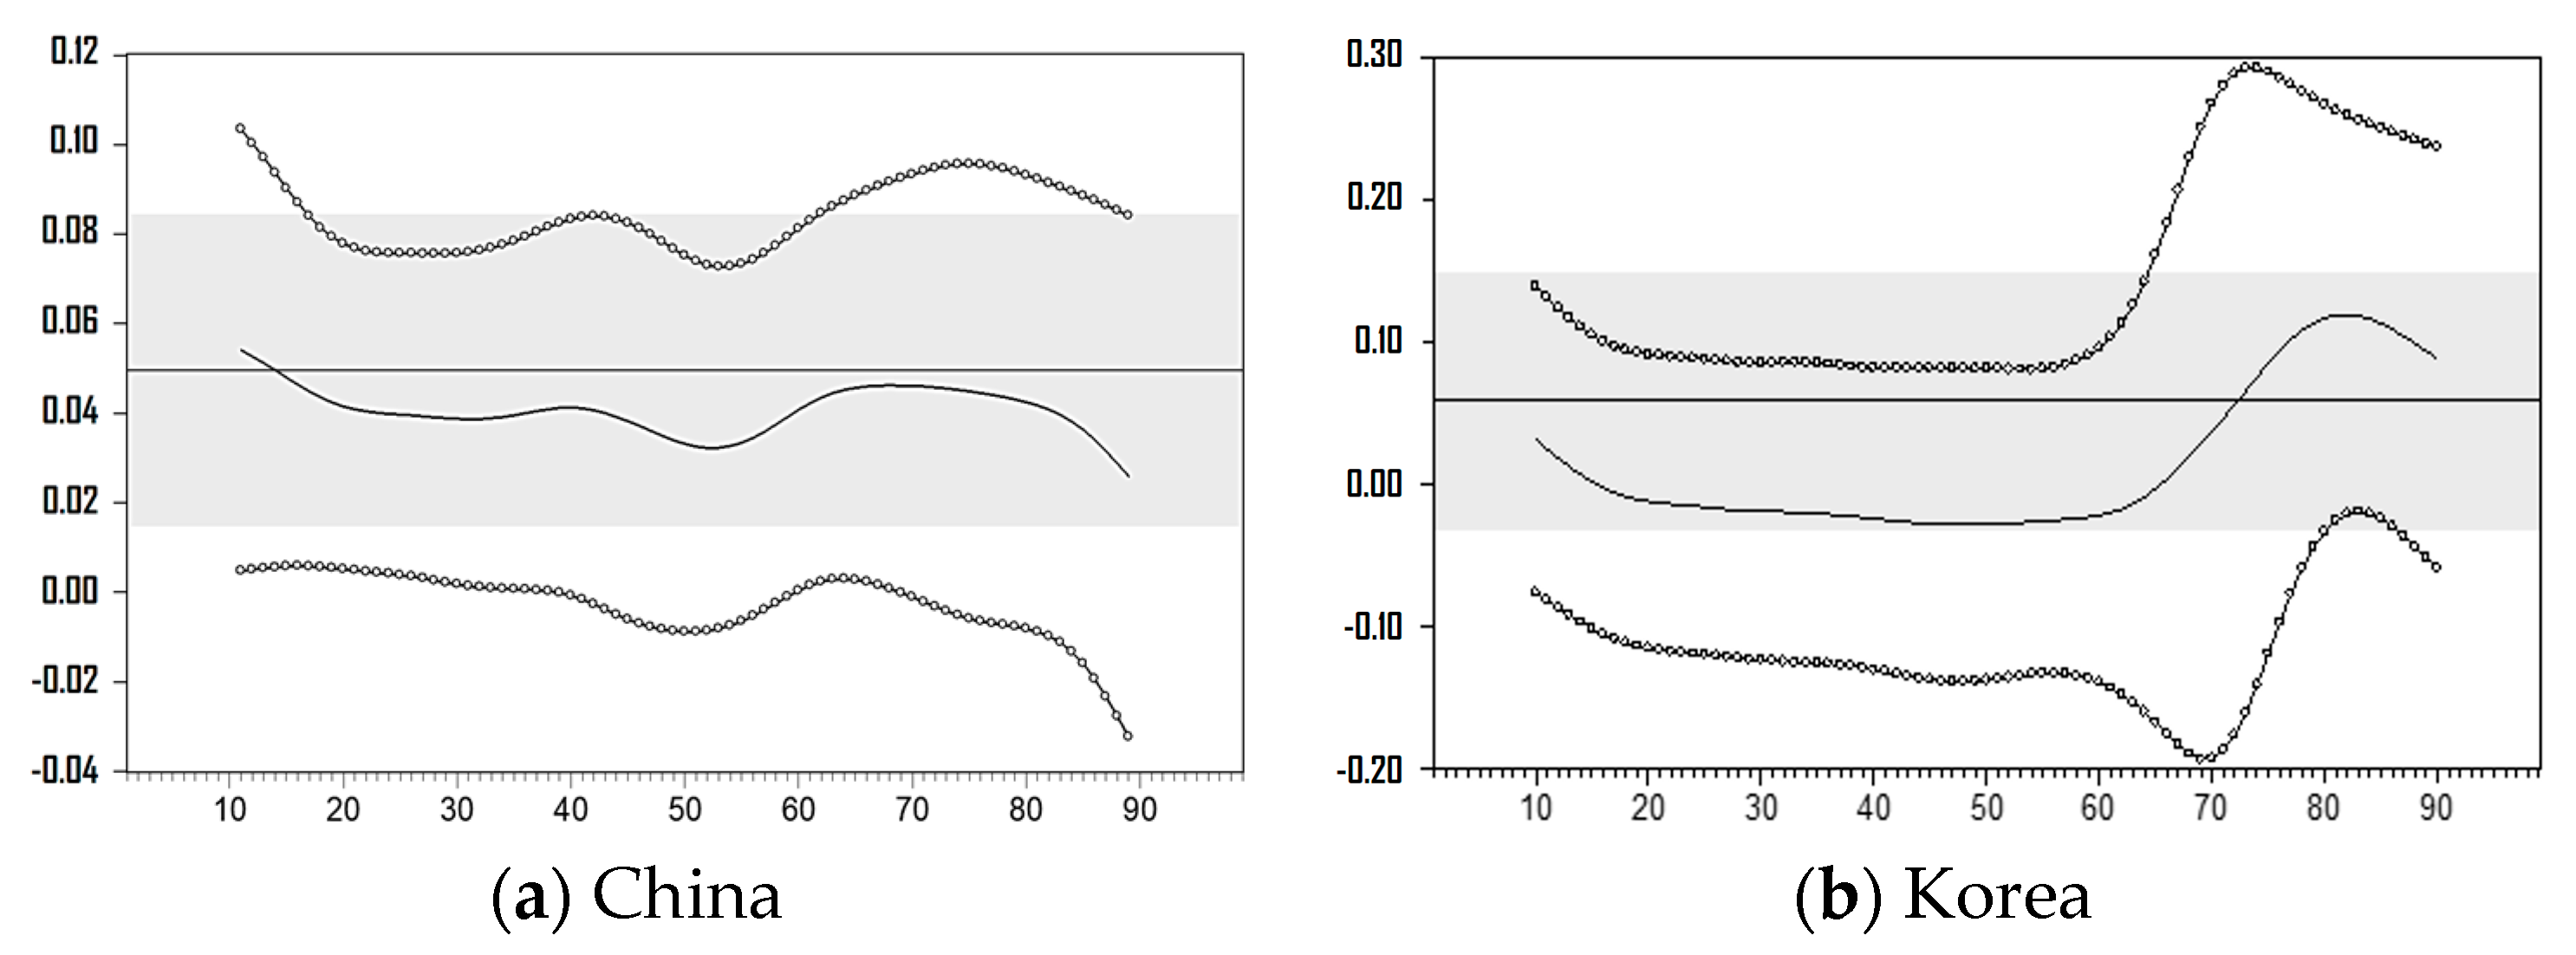
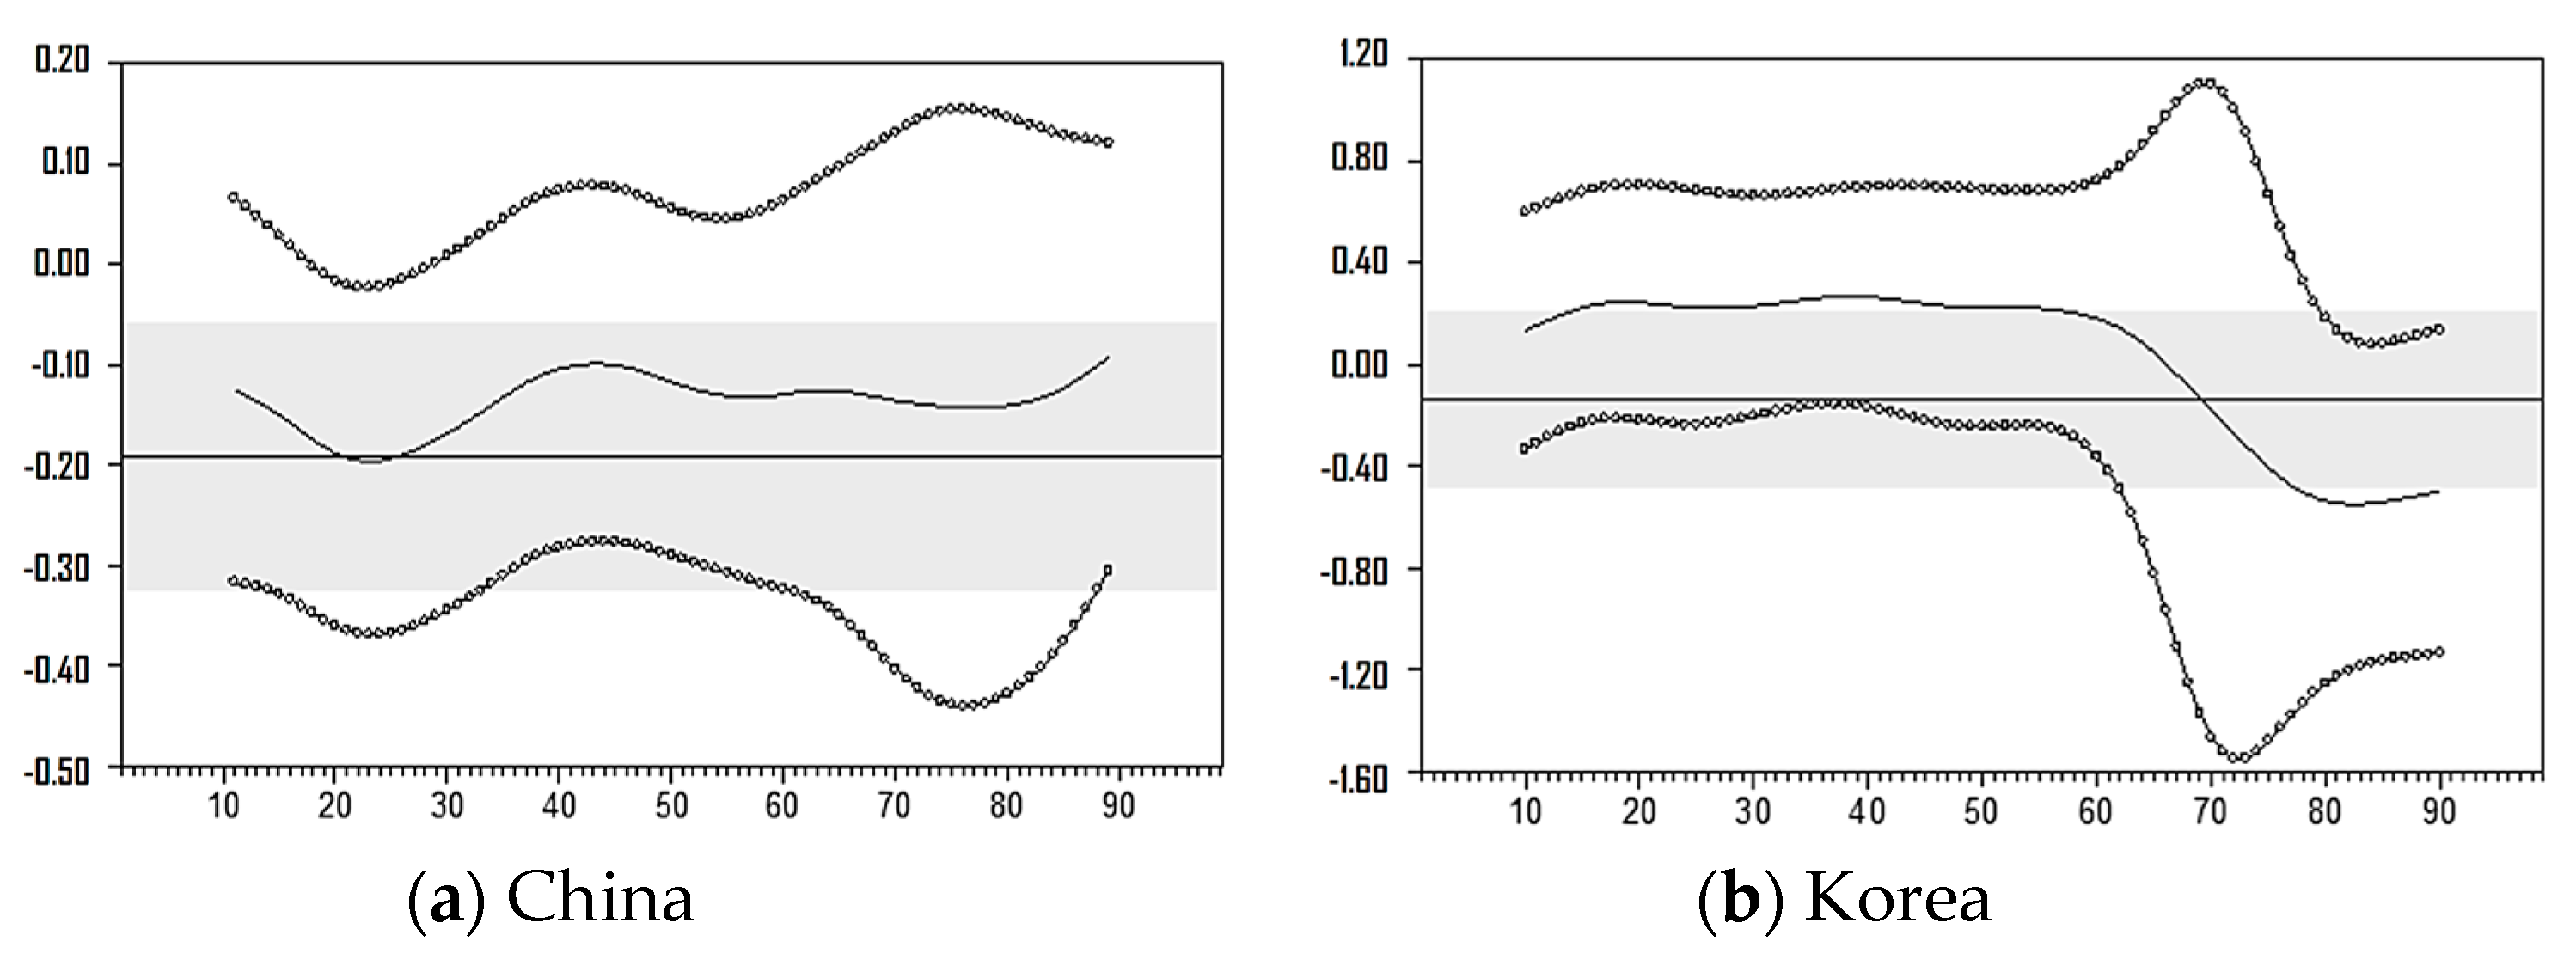
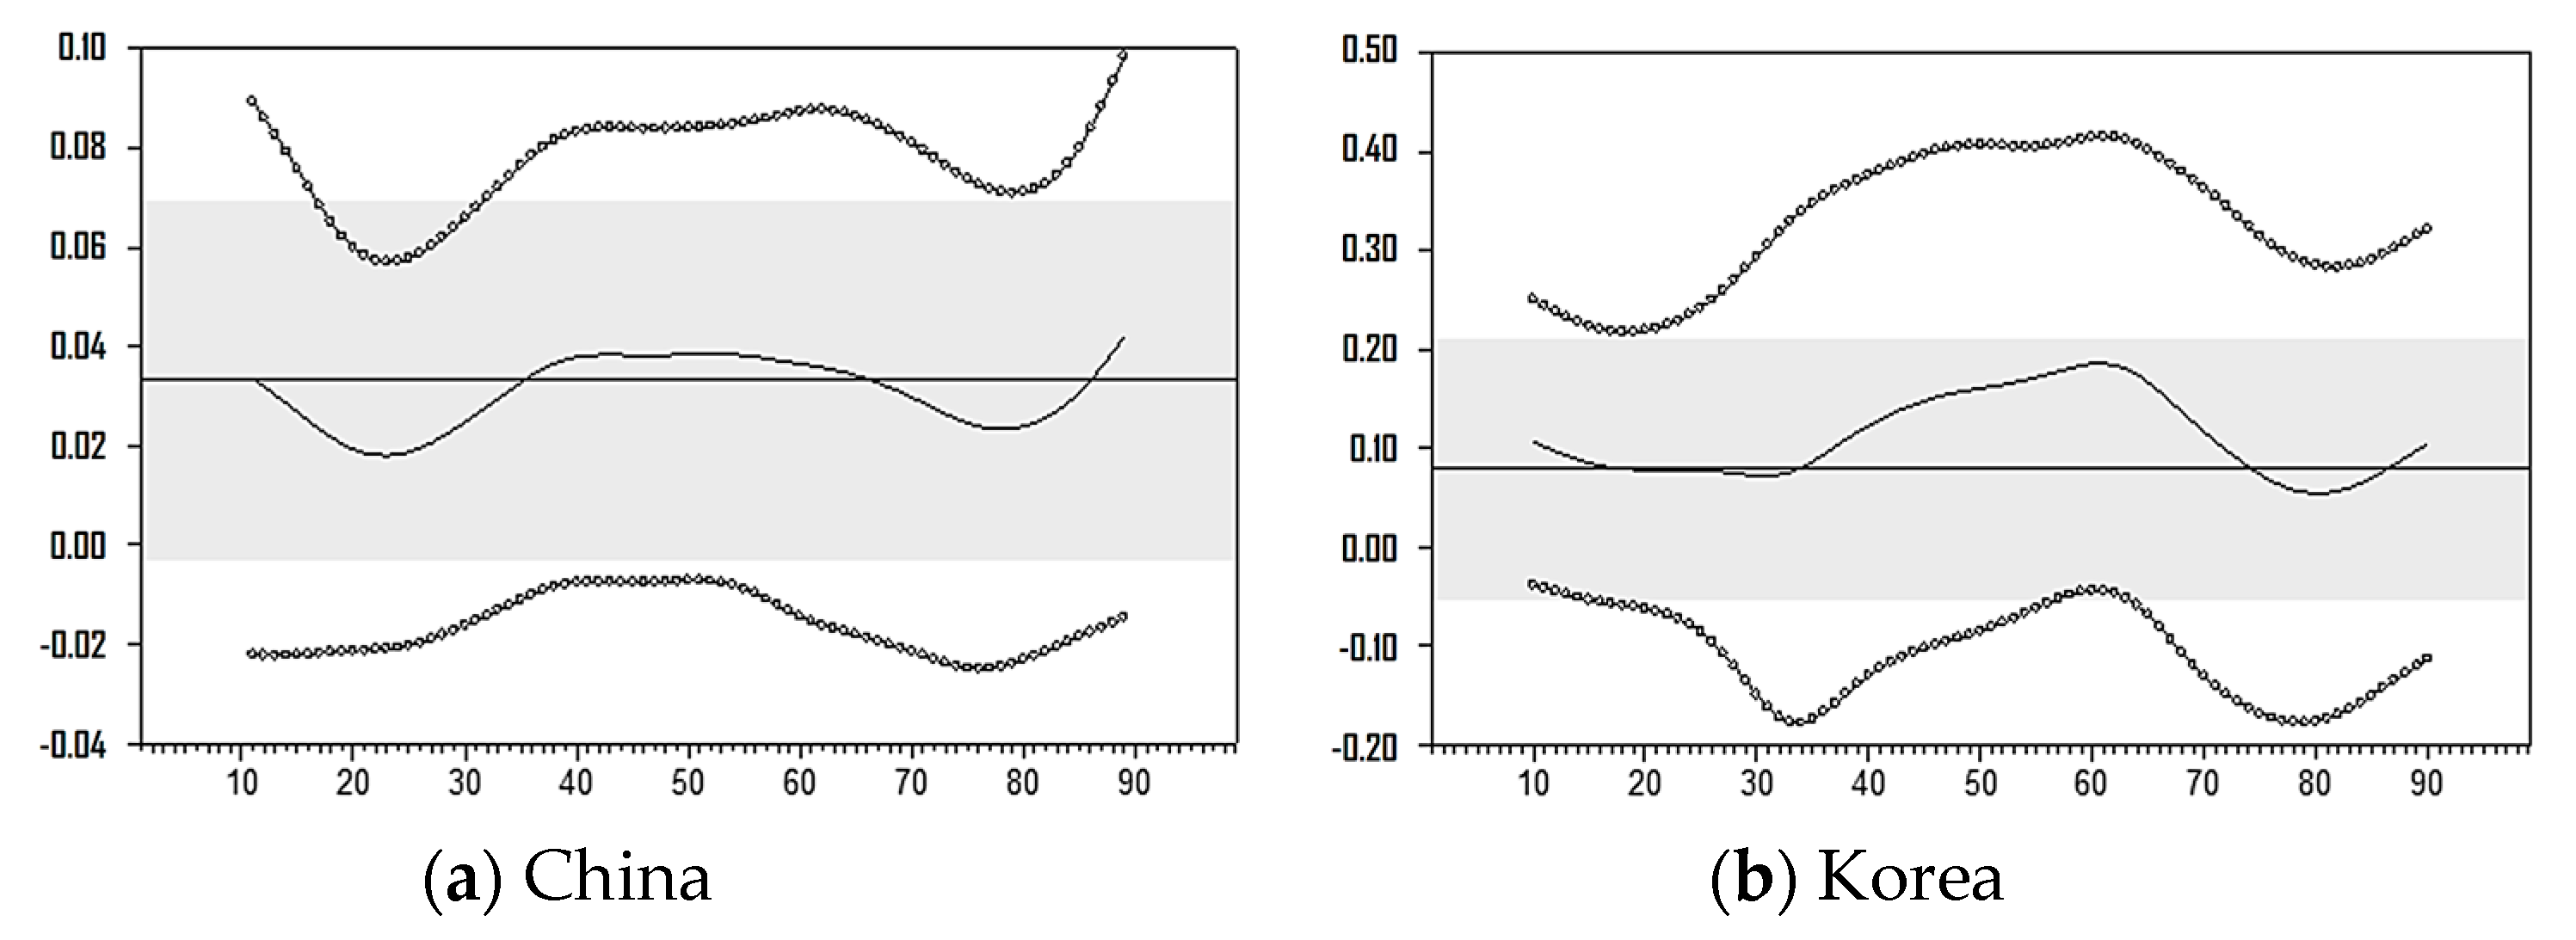
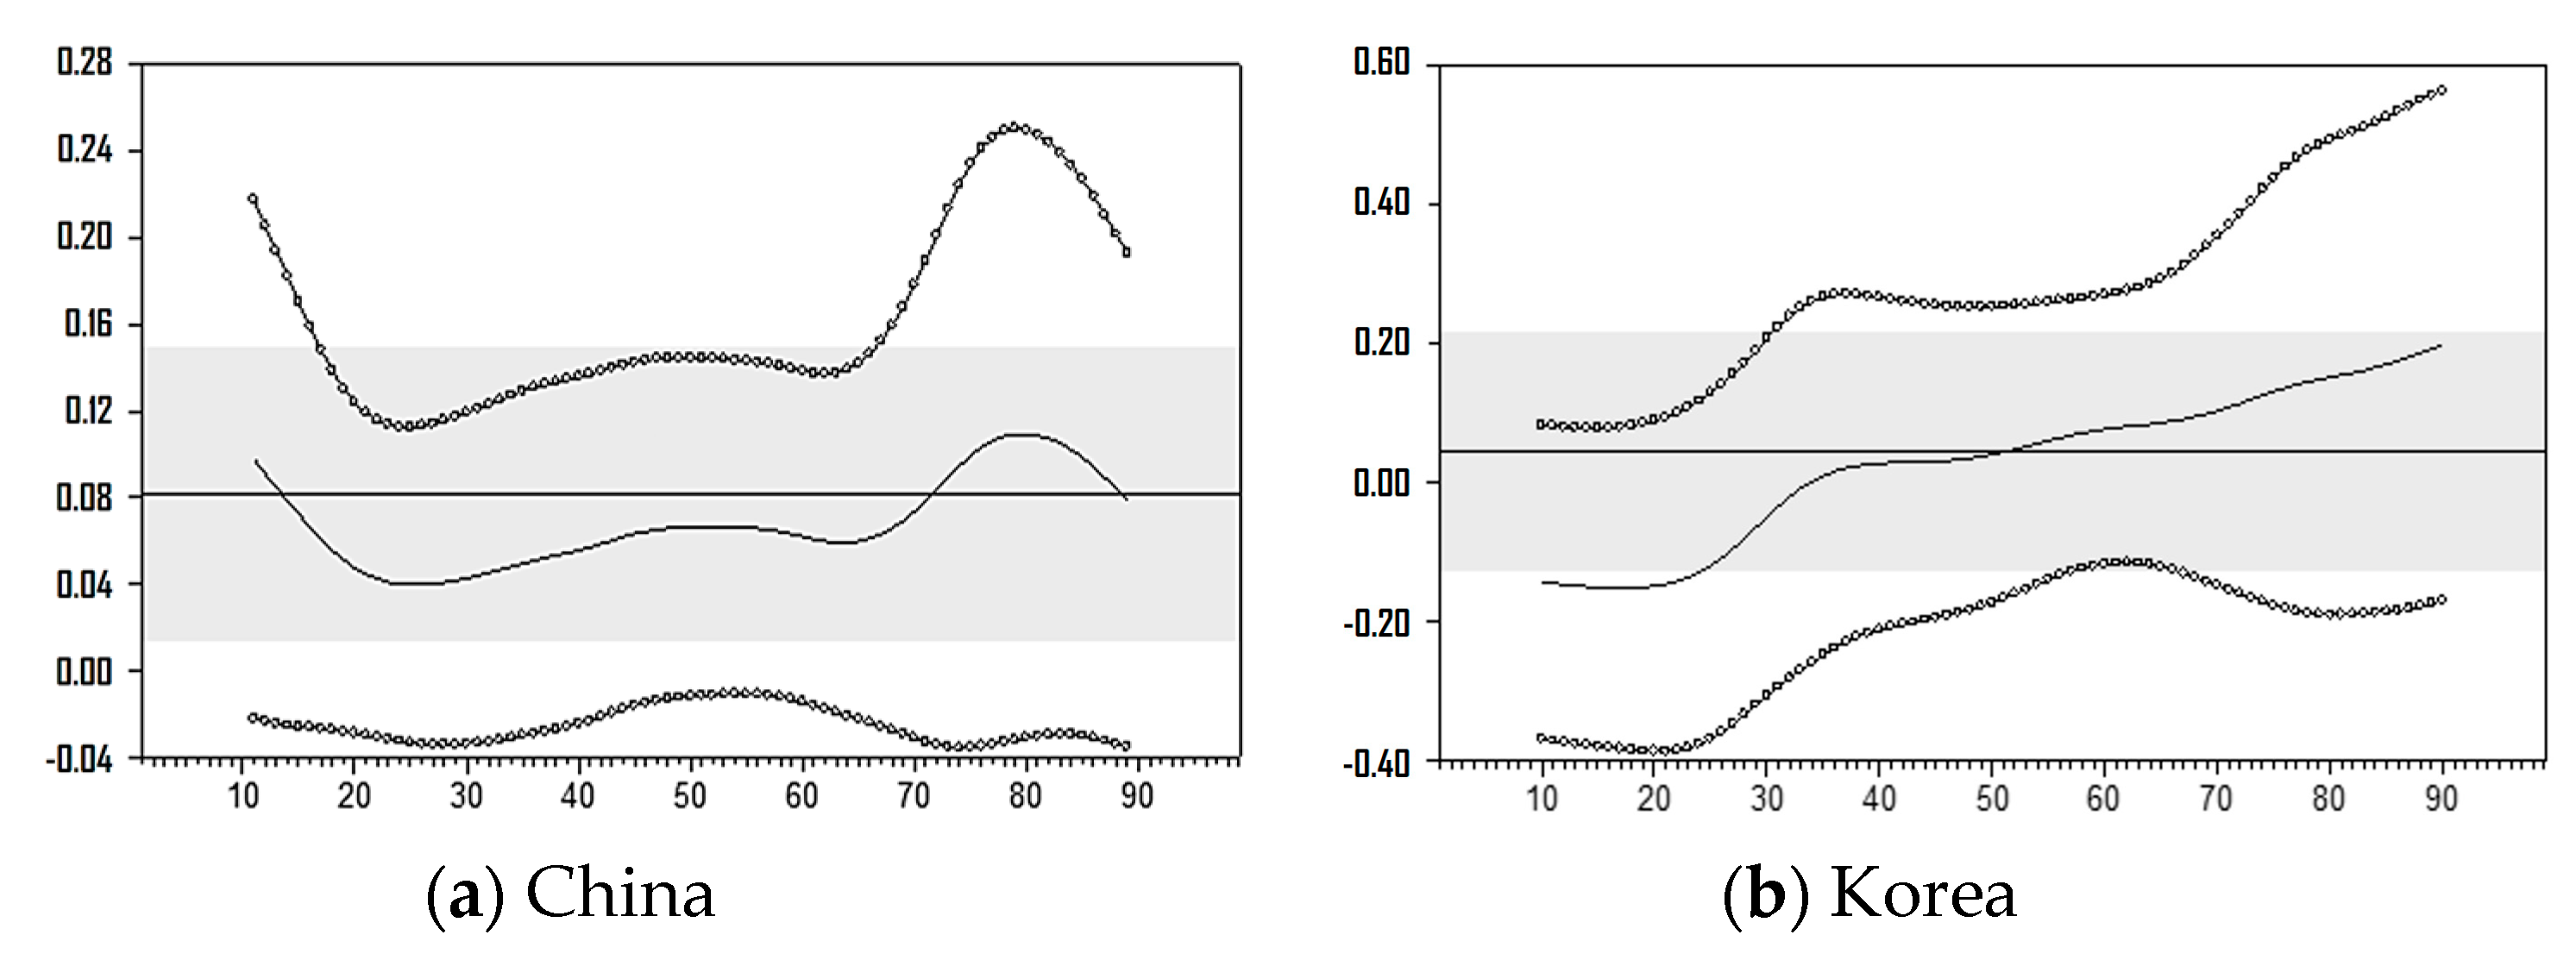
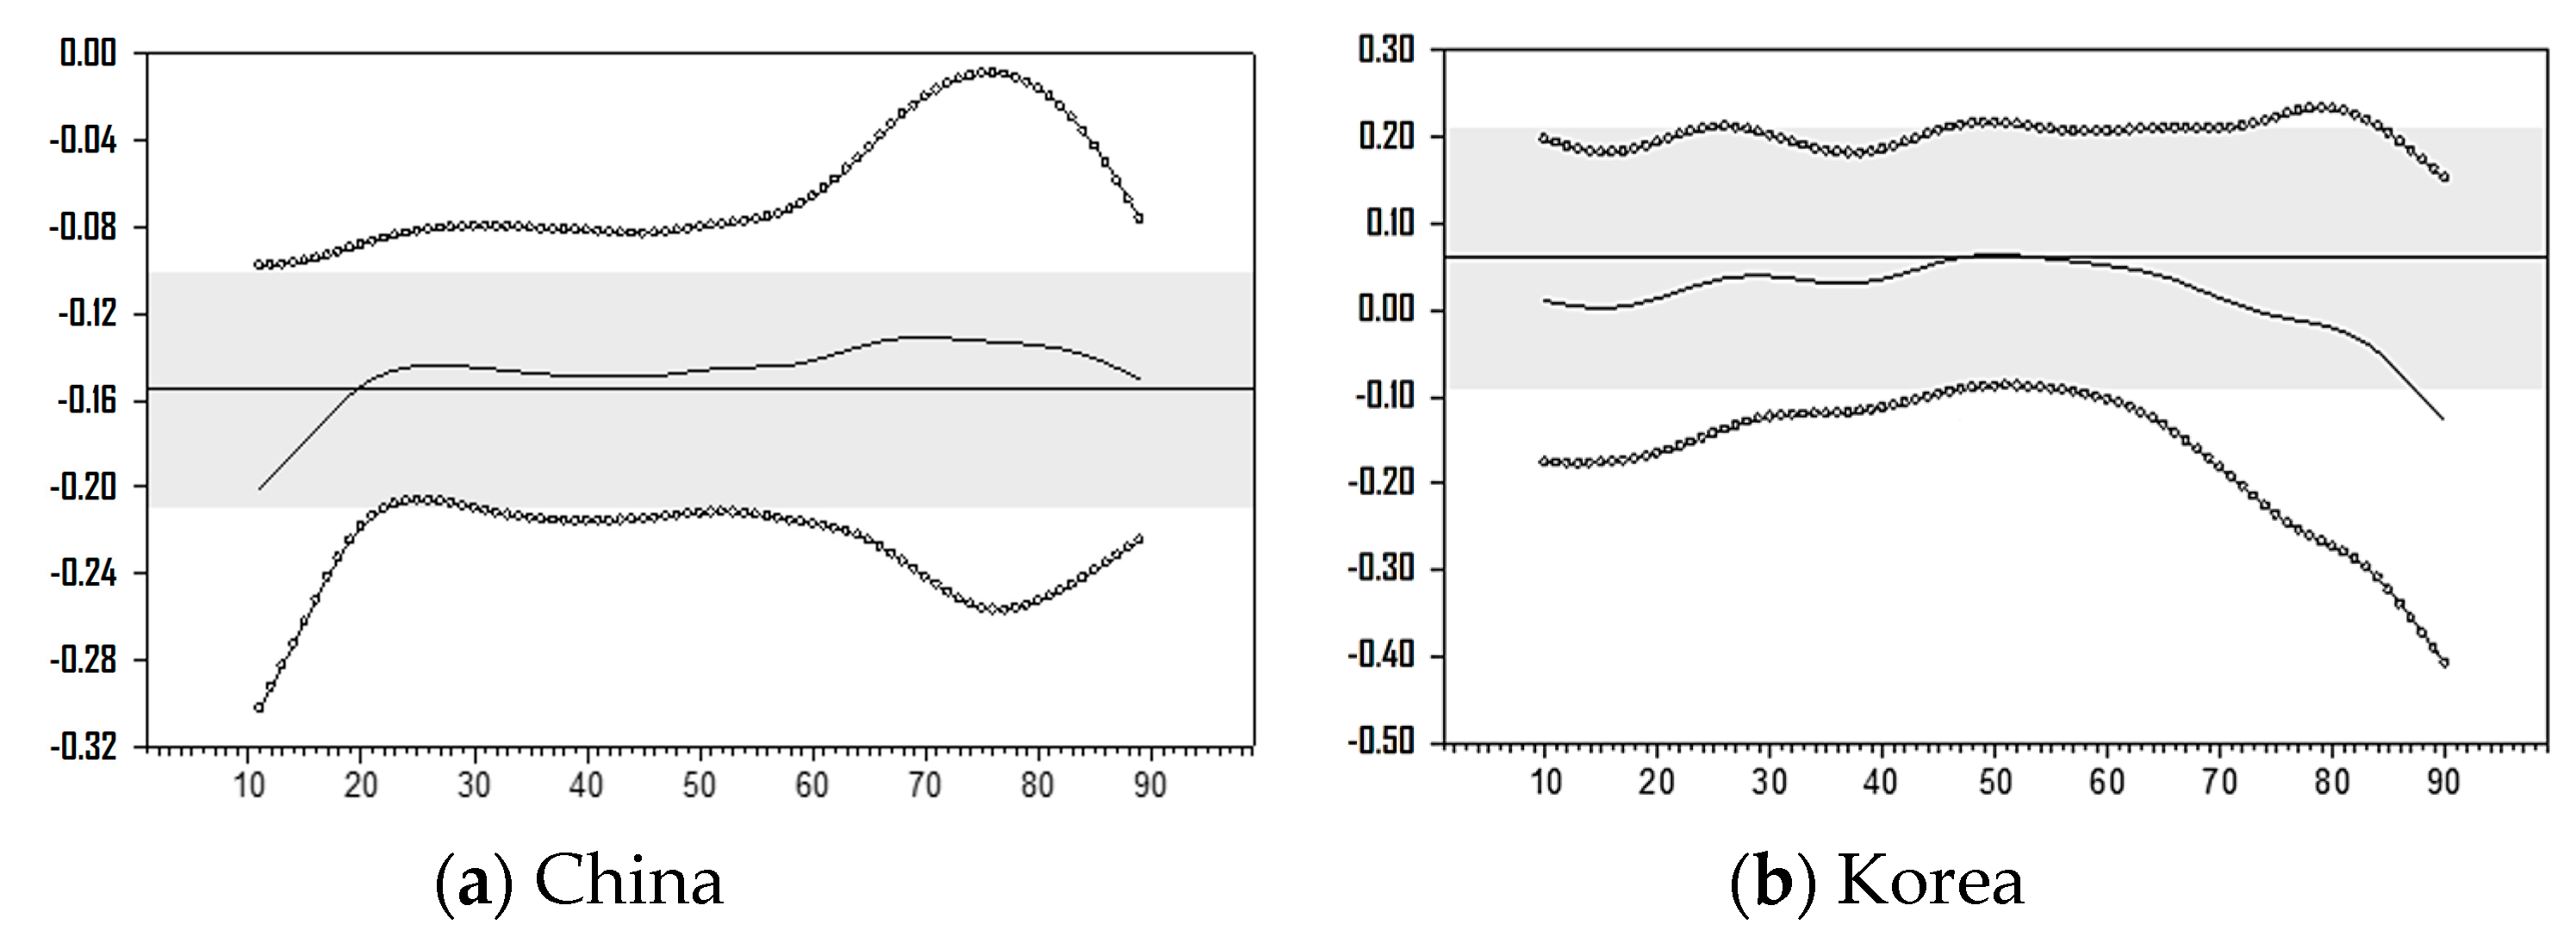
Figure 8 show the smoothing of the graph using a Hodrick–Prescott filler. The left figure is China, and the right shows Korea. The
y-axis represents the quantile coefficients. The horizontal line of the
x-axis is the OLS estimate, and the gray shaded area is the 95% confidence interval for OLS estimates. The central QR line is an estimate of each tau value, and the remaining line represents the 95% confidence interval of the quantile estimate. One of the characteristics is that the confidence intervals are extended at extremely high and low levels of quantile.
In addition, each coefficient can be interpreted, as elasticity as the log value is taken for both the dependent variable and the independent variable. In Korea, culture, social security, and environmental expenditures are generally positive in relation to economic growth, while economic (τ = 0.2–0.6), education (τ = 0.7–0.9), general public service (τ = 0.1–0.2, 0.6), and health expenditures (τ = 0.1–0.3) have a negative effect on economic growth. China has a small coefficient, but its education, general public service, and social security expenditures have a negative relationship. While statistically significant compared to Korea, in China there are relatively uniform effects on economic growth when fiscal spending increases.
With regard to China’s investment expenditures, the economy has a positive relationship, and education and social security have a negative relationship. In the case of economic expenditures, it has been confirmed that China’s have a positive value, due to the “Beijing–Tianjin–Hebei Urban Agglomeration”, the “development of the western region in China”, and the “Yangtze River Economic Zone”. Such projects, related to social overhead capital (SOC), contribute to not only the production activities of enterprises, but also to increasing the quality of life of the general public. The projects contribute to the expansion of exports by increasing the size of the national economy and strengthening the competitiveness of enterprises or products. This increases the welfare level of the people. Of course, the sharp rise in SOC has a negative effect, but the listed national policy projects have a positive effect on economic growth, because they invest in underdeveloped areas. On the other hand, education expenditure is more focused on basic education than higher education. China’s export industry has changed from light industry to capital-intensive industry. Social security expenditure is a solid social security system, due to the nature of the socialist state. Therefore, after the retirement age, the living base is equipped. It pursues universality rather than efficiency. For these reasons, social security has a negative relationship with economic growth.
Korea’s economic spending has a negative value at τ = 0.2–0.6 and a positive value at τ = 0.7. In other words, when the growth of economic expenditure is high, it has great influence on economic growth. Educational and social security expenditures are negatively correlated only in the high quantile. Educational expenditures are caused by higher education in Korea, and social security expenditures are the burden of social security, which has adversely affected the Korean economy due to the rapid aging of the population.
As we analyze government expenditure by function, cultural expenditure is used for the preservation of cultural heritage and traditional arts and culture. In particular, the development of culture and tourism industries can be expected to have positive effects on economic growth. However, the tourism industry in Korea is led by the private sector rather than the public sector. Considering this reason, cultural expenditures of the Korean government cannot have a positive effect on economic growth.
Environmental expenditure is divided into detailed items, such as air pollution, water and sewage, water quality, nature, and waste. China’s quantile coefficient is very small. However, China and Korea have a similar pattern. In the Korean and Chinese graphs, environmental expenditure is a necessary expense for everyday life; thus, excessive spending has a negative impact on economic growth.
When general public service expenditures increase, Korea has a relatively positive relationship compared to China. Due to the nature of socialism, China has a large public sector. This can be explained by the “large department system” implemented in 2008. China has been pushing for large department system reform to consolidate government departments since 2008, and has aimed at improving the efficiency of the government, reducing administrative costs, eliminating managerial loopholes, and completing a rational management system. Thus, an increase in general public service expenditures is not always accompanied by efficiency.
Health expenditures are used for public health work, operation of the disease management headquarters, safety evaluation, and the expansion of public health care. An increase in health spending can lead to an increase in the stability of life and contribute to the increase of individual productivity by reducing the burden of individual treatment expenses. An increase in income enables the demand for healthcare to become more sophisticated and diversified. Furthermore, there are many public hospitals in China. Thus, the country has increased health spending to accompany economic growth. However, public hospitals in China often forget public responsibility and operate on a high-cost, low-effectiveness structure [
23,
24]. There are inconsistency issues in the formulation and implementation of policies due to the diversity of the management structure, which separates ownership and management. This is the reason why the right tail falls on the quantile graph.
In 2011, the percentage of government expenditure by function in Korea was ranked first, second, and third in this order: economy (20.1%), education (15.5%), and health expenditure (15.2%). In the same period, China’s top three categories of government expenditure measured 11.4%, 9.2%, and 8.3% by education, social security, and general public expenditure, respectively. As China and Korea are still in the stage of growth, economic expenditure is higher than other forms of spending. In general, economic, educational, and social security expenditures have a strong redistributive effect. Education and social security spending can help economic growth by mitigating inequalities through the accumulation of human capital and expanding long-term growth potential.
5. Conclusions
After rapid economic growth, Korea choose a growth strategy through trade opening. Since then, the economy has grown together. Since the Asian Financial Crisis in 1997, the Korean government has endeavored to remove the economic peculiarities of Korea, reduce government intervention in the market, and increase the flexibility of the labor market in accordance with the recommendations of the International Monetary Fund (IMF). Therefore, the intervention of the government in Korea was eased more than before. Since government intervention is small, the elasticity of economic growth on government expenditure is high.
China, on the other hand, still maintains a socialist system, and the government has been influential in the market through state-owned enterprises. In addition, government intervention is very active through various tax incentives and subsidies. Under this system, the impact of government expenditure on economic growth has been low. In other words, because the government actively intervenes in the market and provides the factors for economic growth, the government expenditures seem not to have a great influence on economic growth. This can be said to be less elastic economic growth on government expenditure, and seems to be a key characteristic of China, which maintains socialism.
Second, according to Barro’s theory, government expenditures energize economic growth, as they maximize the efficiency of the private sector in the early stage of economic growth. However, when the local maxima is reached, the increase in government expenditures worsens the efficiency of the private sector. In the above analysis, we have confirmed that Korea has a positive and negative correlation between functional government expenditure and economic growth, respectively.
On the other hand, China has a strong correlation in general public service, social security, economic spending, but has a uniform effect on economic growth as fiscal spending increases. The first reason is that China’s President Xi Jinping has set a goal of building a society centered on Xiao Kang. Thus, the Chinese government expenditure can be seen as a consumption expenditure in the short term, but it can be turned into investment expenditure in the long term. Moreover, the current stage of economic growth in China is considered to be the transitional period of shifting from a low-income to high-income country. In other words, during the Xinchang Tai, it appears that China has chosen a model considering growth and distribution simultaneously, rather than selecting a model that is growth-oriented.
It is very important to estimate the impact of system differences. The Beijing convention is a phenomenon that occurs in all developed countries. Welfare expansion may not be an investment for the future. Therefore, government spending must be cautious.


