The Valuation of Grassland Ecosystem Services in Inner Mongolia of China and Its Spatial Differences


1
State Key Laboratory of Earth Surface Processes and Resource Ecology (ESPRE), Beijing Normal University, Beijing 100875, China
2
School of Natural Resources, Faculty of Geographical Science, Beijing Normal University, Beijing 100875, China
*
Author to whom correspondence should be addressed.
Sustainability 2019, 11(24), 7117; https://doi.org/10.3390/su11247117
Submission received: 25 November 2019
/
Revised: 5 December 2019
/
Accepted: 6 December 2019
/
Published: 12 December 2019
(This article belongs to the Special Issue Assessment, Mitigation and Restoration of Ecosystems in a Changing World)
Abstract
:Economic valuation of grassland ecosystem services is important for protecting and restoring grassland ecosystems. This study aims to investigate Chinese netizens’ willingness-to-pay (WTP) for protecting grassland ecosystem services in Inner Mongolia by using the contingent valuation method. The results indicate that 61.55% of respondents expressed a positive WTP. The mean WTP was estimated to be CNY 170.76 (USD 25.11) per person per year. We found that there is a significant spatial difference in respondent’s WTP. Factors such as respondent age, education, household income and concern about grassland protection significantly affected their WTP. Younger, more educated and wealthier respondents have a higher probability of willingness to pay, and those who are concerned about grassland protection present a higher WTP. The regression results also show that distance from the grassland negatively affects the probability and values of people’s WTP. Findings of this research provide useful policy implications for decision-makers involved in grassland protection and management.
1. Introduction
Ecosystem services have been attracting more and more attention because of their important role in promoting human wellbeing [1,2,3]. Grasslands cover around 24% of Earth’s land surface [4] and provide many essential ecosystem services, including climate regulation, sand fixation, prevention of wind damage, biodiversity conservation, water and soil conservation [5,6,7].
Although grassland ecosystems have an important global role, recent studies have shown that 49.2% of grasslands in the world are degrading [8]. The combination of climate change and natural disasters such as sandstorms and droughts has led to this issue, which is aggravated by human activities such as intensive agricultural production and overgrazing [9]. Therefore, grassland ecosystem degradation is a global issue that needs close attention [10].
In order to restore or protect the grassland ecosystem, the government must take measures to increase investment in grassland restoration and protection [8]. To achieve this, the total economic value of grassland ecosystem services must be considered. Only when the true value of these services is fully considered can governments and organizations design and implement more effective policies, focusing on increasing the supply of ecosystem services or reducing the pressure on degraded ecosystems [11]. Therefore, quantifying the true economic values of grassland ecosystem services is necessary and important [12].
The science of ecosystem services valuation has received more and more attention [13]. A few previous studies have been conducted to value ecosystem services. For example, Sutton et al. conducted a study on the loss value of ecosystem services from global land degradation [14]. Nevertheless, ecosystem services are public goods [15]. Many ecosystem services, such as biodiversity conservation and climate regulation, are often not reflected in market values. In the absence of market prices, a typical economic analysis cannot be used to provide a true value of grassland ecosystem services [16].
The contingent valuation method (CVM) has been the most commonly used method for estimating the monetary value of nonmarket goods or services [17]. It establishes a contingent market and uses information based on surveys to directly elicit individuals’ willingness-to-pay (WTP) for specific changes in supply of certain nonmarket goods or services [18]. CVM is considered to be an effective method for providing a true measurement of the total economic value of nonmarket goods or services [19].
The literature on economic valuation of ecosystem services using CVM has been growing. For example, Ingraham and Foster employed the CVM to investigate the value of refuge ecosystem services in the US [20]. Zhang et al. used the CVM to estimate the economic value of forest ecosystem services in Heshui Basin [21]. Pinto et al. applied the contingent valuation technique to estimate the benefits of estuarine ecosystem services in Portugal [22]. However, to the best of our knowledge, there are relatively few studies that use CVM to value grassland ecosystem services [23].
Although many CVM studies have been carried out, most studies were conducted in a single region. In China, due to considerable disparities in environmental endowments, social and economic development conditions, there are substantial regional variations, which may lead to a spatial difference in people’s WTP. However, the research on the spatial differences in people’s WTP is very limited [24].
In order to fill in the above knowledge gap, this study attempted to apply the CVM to explore how Chinese netizens value grassland ecosystem services in Inner Mongolia. Specifically, it aims to: (1) estimate how much Chinese netizens are willing to pay, on average, for protecting grassland ecosystem services in Inner Mongolia; (2) explore the key determinants that influence people’s WTP; and (3) to investigate whether there is a spatial difference in people’s WTP and whether people value grassland ecosystem services more if they occur closer to their living place. The findings of this study can provide useful information and reference for grassland management and conservation in China and other similar regions or countries.
2. Methodology
2.1. Grasslands in Inner Mongolia
Grassland is the largest ecosystem type in China with a total area of 393 million hectares, accounting for 42% of the country’s territory [8]. The grassland in Inner Mongolia is the largest pasture in China, including Khorchin, Xilin Gol, Hulunbeier, Wulanchabu and Erdos (as shown in Figure 1). It provides many important ecosystem services to humans. However, under the combined effect of human activities and climate change, grassland ecosystems in Inner Mongolia have deteriorated significantly over the past three decades [25,26]. From the 1960s to the end of the 1990s, the total area of grasslands decreased dramatically from 88 million hectares to 69 million hectares. The area of degraded grassland accounts for 32% of the total grassland area [27]. Therefore, a large amount of capital, labor and materials are needed to protect and restore the grassland ecosystem in Inner Mongolia. Quantification of the value of grassland ecosystem services is critical to alleviating the loss of ecosystem services in the region [28].
2.2. Questionnaire Survey
The key to collecting CVM data is the questionnaire survey. The questionnaire in this study included three steps, designed with reference to best possible practices [29]. First, based on the literature on valuing grassland ecosystem services and CVM studies, we designed a draft questionnaire. Second, several focus group discussions (FGDs) were organized to review and discuss the draft questionnaire. Some experts on CVM, grassland ecosystems and laypeople were invited and asked to share their opinions and feedback on questions in the questionnaire. Open-ended questions were used to ask participants about their willingness-to-pay or preferences. Based on the feedback from the discussions, the range of people’s WTP was identified and the draft questionnaire was modified. Third, we conducted a pilot study of 200 participants to identify some potential problems on the wording and order of questions in the questionnaire. The questionnaire was modified and improved based on the pre-test survey results to make sure that all questions are accurate and easily understood.
The final questionnaire used contained three sections. The first section was a simple survey on knowledge and awareness on the protection of grassland ecosystem services. Respondents were asked about their knowledge level of grassland ecosystem services. They were also questioned about how they were concerned about grassland ecosystem services and whether it was important to protect grassland ecosystem services in Inner Mongolia or not. Respondents’ consent or disagreement on each specific ecosystem service provided by the grassland was elicited on a five-point Likert scale.
The second section started with a description of the current situation of grassland ecosystems and their services in Inner Mongolia. This was followed by a hypothetical protection program to protect and restore grassland ecosystems and their services in Inner Mongolia. Respondents were told that the protection program was not covered by the government and needed public contributions. Then questions to investigate respondents’ WTP for the protection of grassland ecosystem services in Inner Mongolia were presented. Respondents were first asked if they were willing to contribute to the protection program or not. If a respondent agreed to pay, the payment card format was applied to elicit the respondent’s WTP. Payment card questions have two main advantages. First, they can minimize starting point bias and second, they are realistic and can reduce nonresponse rate [30]. Each respondent was presented with a range of bids in ascending order (CNY20, 50, 100, 200, 500, 800, 1000, >1000) and asked to pick out his/her maximum WTP. The range of bid values was determined based on FGDs and the pilot study. This study included a cheap talk script to minimize the hypothetical bias by thoroughly describing and discussing the propensity of respondents to exaggerate their WTP [31]. In order to encourage respondents to give their true preferences, they were reminded to consider their budgetary constraints and other expenses [32]. After the WTP questions, some debriefing questions followed.
The final section contained some questions to collect the basic socio-economic information about the respondents and their households. The main structure of the survey is shown in Appendix A.
2.3. Data Collection
With the rapid development of the internet, accessing to internet is cheaper and the netizen population has become huge in China [33]. According to the Statistical Report on China’s Internet Development in 2018, the netizen population was 731 million, or approximately 53% of the Chinese population in December 2016, the most recent date of data availability. The data for this study was collected through the online survey, which has some practical advantages over mail, phone and face-to-face interviews. The online survey is a cost-effective means of covering a wide area and population [24] and can help improve the data collection processes and the interactivity of surveys [33].
The main survey was conducted on a questionnaire survey platform managed by a professional survey company, Wenjuxing, in the form of a web link (questionnaire URL: https://www.wjx.cn/m/37309359.aspx) from May to June, 2019. Respondents were randomly drawn from a pool of netizens from 31 provinces of China, without including people in Hong Kong, Macau and Taiwan. Invitation emails were sent to these randomly drawn respondents and they were told that the questionnaire survey was voluntary and anonymous. If they agreed to participate in the survey, they were directed to click the web link where the questionnaire was located. After they finished the survey, they submitted their answers online.
2.4. Data Analysis
As in Wei and Wu [34], this study employed a two-stage modelling process to analyze the collected data. We first applied the binary probit model to explore the probability of a respondent having a positive WTP for protecting grassland ecosystem services in Inner Mongolia. The model is specified as follows:
where are the coefficients to be estimated; X is a vector of explanatory variables such as respondents’ socioeconomic variables or attitudinal factors; is the error term, which is normally distributed. Respondents’ responses to the WTP question can be defined as:
The decision of whether to pay is expressed by:
is the standard normal cumulative distribution function, ,
In the second part of the model, since respondents’ bids in the payment card format are not continuous but discrete intervals, we employed the interval regression model to estimate the amount of WTP conditional on the requirement that the WTP must be positive [35]. Let the vector v = (v1, v2, , vj) represent the values on the payment card, arranged in ascending order, and let vi represent the value chosen by the ith respondent. The probability that a respondent picks vi is the probability that willingness to pay lies within interval (vi, vi+1) can be represented as:
Then the parameters can be estimated by maximizing the following log likelihood function [36]:
In the end, we can obtain the expected WTP using the following equation:
where Bi is bid values in the payment card; Wi is the percentage of WTP; n is the number of bid values; Prob (WTP > 0) is the percentage of positive responses.
Econometric software STATA 13 was employed to conduct data analysis.
3. Results and Discussion
A total of 13,579 questionnaires were sent to potential respondents randomly through the Internet platform. Next, 4635 completed questionnaires were collected. After censoring the incorrect or missing responses, 3573 questionnaires were left for further analysis. The results show that the proportion of questionnaires in different provinces was very similar to the proportion of population in various provinces in China.
3.1. Demographic Profile of the Respondents
The demographic profile of the sample is shown in Table 1. The results indicate 57.45% of the respondents were female. The respondents who were aged 16–29 accounted for 58.78%. This result is consistent with the one calculated from the Fifth National Census data, where the average age of the Chinese population is about 32.48 years old. Approximately 65.76% had a bachelor or university degree, which is in line with the respondents in Wei and Wu [34]. They found that 69% of their respondents obtained a college education. Of the total respondents, 16.89% worked for public institutions. The survey results show that respondents’ household monthly income was heterogeneous. The primary socio-economic characteristics of our respondents is close to the sample structure of Pu, et al. [24] who also employed an internet online survey scheme.
3.2. Respondents’ Knowledge and Awareness about Grassland Ecosystem Services
The first part of the survey questionnaire contains questions on respondents’ knowledge and awareness about grassland ecosystem services. The survey results indicate that only 10.31% of the respondents believed that they had a good knowledge about grassland ecosystem services. Most respondents (61.64%) reported they had a little or no knowledge about grassland ecosystem services. These results may reveal evidence among the Chinese public that education about grassland ecosystem services is insufficient. Therefore, new and traditional media can be employed to implement continuous education on ecosystem services of grasslands.
Respondents were asked about their traveling frequency to the grassland in Inner Mongolia. The results show that the majority of respondents (64.61%) had never been to the grassland in Inner Mongolia. More than half of the respondents (59.97%) thought the grassland in Inner Mongolia was seriously damaged. A total of 53.58% of the respondents stated that they were concerned about the protection of grassland ecosystem services in Inner Mongolia. Most respondents (94.71%) strongly agreed or agreed that it was important to protect or restore grassland ecosystem services in Inner Mongolia. This is a welcome finding since awareness is very important for the success of environmental protection [37]. The literature shows that people who are environmentally concerned usually have a higher willingness to contribute to the environmental good [38]. The attitudinal information collected and reported in this study can inform the national discussion on attitudes towards protection and restoration of grassland ecosystems.
The survey results on respondents’ agreement on each specific grassland ecosystem service are presented in Table 2. The results show that most respondents agreed or strongly agreed that grasslands can provide the services of water and soil conservation (88.59%), sand fixation (86.67%), biodiversity conservation (84.09%). Many respondents (80.74%) agreed that grasslands can provide primary and secondary products for humans. Approximately three-quarters (75.83%) strongly agreed or agreed that grasslands can provide the service of carbon sequestration. Additionally, 73.90% of the sample agreed that grasslands were involved in tourism and entertainment, and 60.89% of the respondents agreed that grasslands could inherit or maintain the ethnic culture.
3.3. Attitudes towards Payment
The results show that approximately 61.55% were willing to pay to protect grassland ecosystem services in Inner Mongolia, which suggested most Chinese netizens valued the protection of grassland ecosystem services. Figure 2 presents the distribution of the positive WTP responses obtained. The results show that the public’s WTP predominately ranged from CNY20 to CNY500 per person per year (69.02%), among which 16.69% chose CNY 20–50, 25.09% chose CNY50–100, 14.34% chose CNY100–200 and 12.9% chose CNY200–500. Approximately, 10.29% had a WTP more than CNY500 per person per year to protect grassland ecosystem services in Inner Mongolia.
Respondents were requested to present their reasons for payment. As shown in Table 3, the most important reason for positive responses was that protecting grassland ecosystems would be good for the environment. About 19.52% of the people who were willing to pay believed that protecting the grassland ecosystem was their responsibility. In total, 14.47% indicated their continued existence as a reason for protecting grassland ecosystems. Furthermore, 17.35% believed that protecting grassland ecosystems would benefit future generations.
In this survey, 38.45% of the respondents refused to pay. Regarding the reason for their unwillingness to pay, nearly one-third of the non-contributors (29.49%) stated that they did not have extra money to contribute (Table 4). Approximately 21.82% of those who said ‘no’ to the WTP question reported that the government should take the responsibility to protect grassland ecosystems. In addition, 19.45% did not believe that the money collected would be used effectively. They worried that the money collected may be used elsewhere. Of the zero WTP respondents, 16.19% indicated that the grassland was far away from where they lived. They believed that locals should pay for the protection program. Finally, 9.7% of those who were not willing to contribute argued that the people who destroyed the grassland should be responsible for the protection activities. The rest 3.35% of non-contribution respondents reported other reasons.
3.4. Mean WTP and its Spatial Distribution
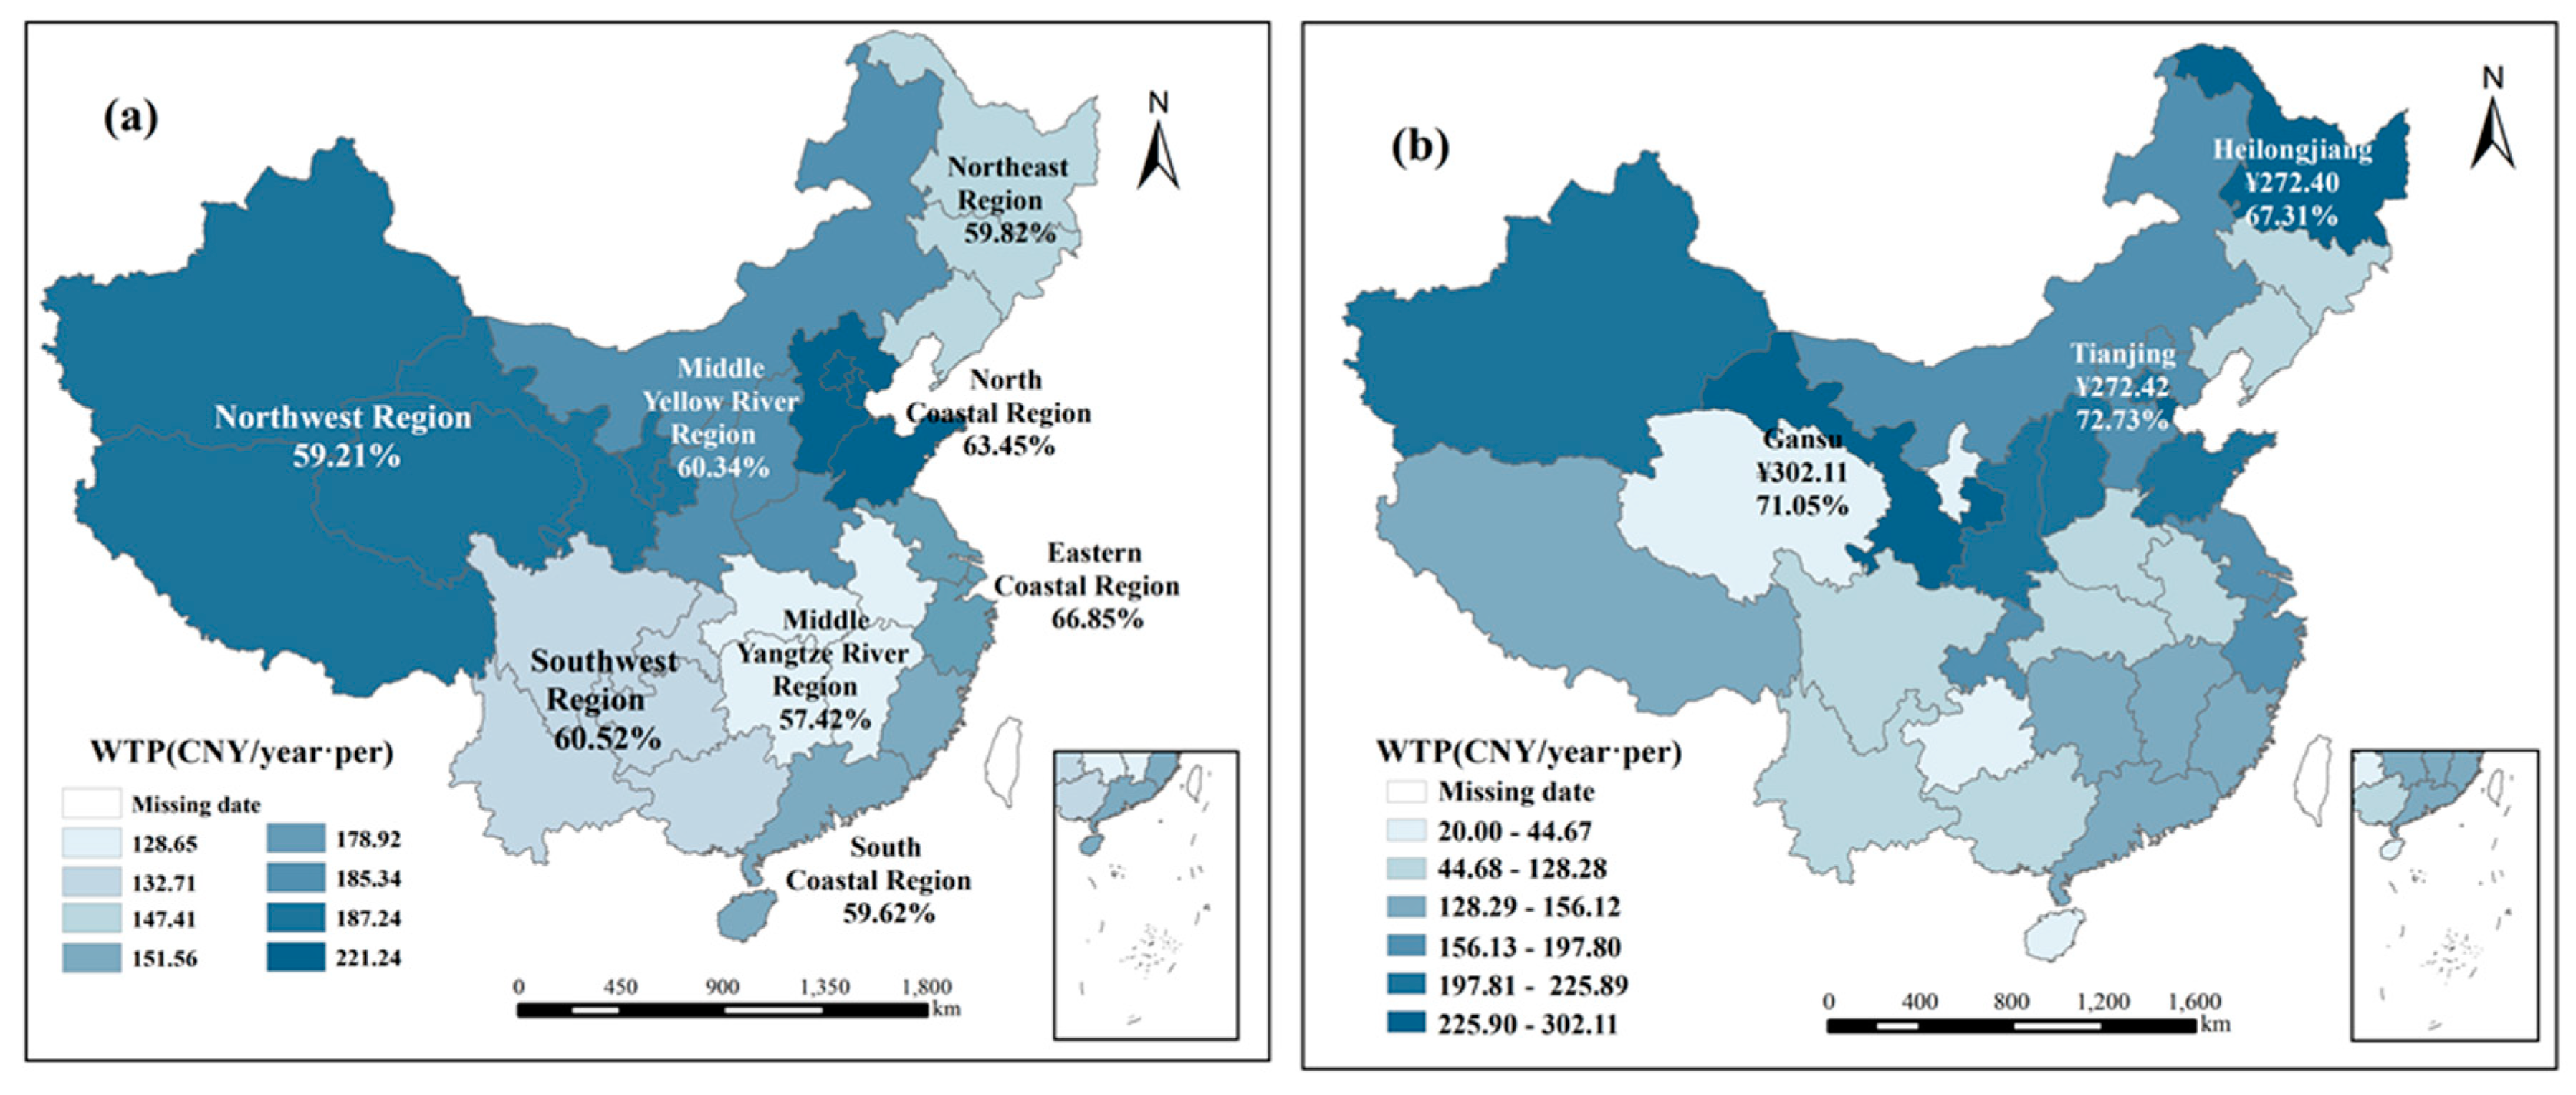
Using Equation (6), we can obtain the average WTP of the respondents for the protection of grassland ecosystem services in Inner Mongolia. The average value of WTP was CNY 170.76 (USD 25.11) per person per year. This result is comparable to the result of another national study on the Chinese public’s WTP to reduce air pollution in China [24]. According to the calculated average WTP values of each province and each economic region, the spatial distribution of these factors was mapped (Figure 3).
At the level of economic region, the range of the percentage of positive WTP was from 57.42% (middle Yangtze River) to 66.85% (eastern coastal areas). The average WTP of people from the northern coastal areas was the highest, followed by the northeast, the Central Yellow River and the eastern coastal areas. The four economic regions with relatively low average WTP were the south coast, the northwest, the southwest, and the middle Yangtze River.
At the province level, the average value WTP ranged from CNY 20 per person per year (Qinghai province) to CNY 302.11 per person per year (Gansu province). The percentage range of positive WTP was from 33.33% (Qinghai province) to 74.34% (Shandong province). Gansu, Tianjin, Heilongjiang, Beijing and Shanxi had the highest WTPs. The percentages of positive WTP of these five provinces were 71.05%, 72.73%, 67.31%, 57.53%, and 69.31%, respectively. The provinces that had the lowest WTPs were Anhui, Guizhou, Hainan, Ningxia and Qinghai Province. The ratios of positive WTP of these five provinces were 61.19%, 50%, 62.5%, 38.1% and 33.33%, respectively.
One-way ANOVA was conducted to test whether respondents from different provinces or economic regions would have different WTPs or not. The results indicated that the differences in the average WTP among the 31 provinces and 8 economic regions were significantly different (p < 0.05). Therefore, there is a spatial difference in people’s WTP for the protection of grassland ecosystem services in Inner Mongolia. This finding is consistent with previous findings that there is a spatial preference heterogeneity in different regions [39].
3.5. Influencing Factors of WTP
Understanding the determinants of people’s WTP is important because it not only helps decision makers and managers design better protection decisions, but is also a key step in validating the effectiveness and reliability of CVM [29]. Table 5 provides descriptions of explanatory variables used in the regression models. The potential collinearity problems among variables were first checked. Finally, it was found that multicollinearity was not a significant issue. The tolerances and variance inflation factors (VIFs) were within acceptable ranges [40].
This study first employed the binary probit model to estimate the possibility of a respondent having a positive WTP. The estimated results are shown in Table 6. The results show that the education coefficient is positive and highly significant, implying that the more educated respondents are more likely to contribute to the protection program on grassland ecosystem services in Inner Mongolia. This finding is expected as more-educated respondents generally have a better understanding of grassland ecosystem services and they are more likely to support conservation programs. The result is consistent with the literature [41]. As expected, regression results showed that household income was significantly and positively correlated with the probability of having a positive WTP, which means that respondents with higher household incomes are more likely to contribute to the protection of grassland ecosystem services in Inner Mongolia. The coefficient associated with the region is positive and significant, which means that there is a higher probability of having a positive WTP in Inner Mongolia and neighboring provinces.
The interval regression model was used to explore the determinants on the public’s WTP. The regression results are presented in Table 7. The estimated model is statistically significant. The age coefficient is negative and significant, indicating that older respondents have lower WTP for the protection plan. The income coefficient is positively and significantly correlated with WTP, which means that the WTP increases as the respondent’s household income increases. This result is in line with economic theory and provides validity evidence of this CVM study [16].
In addition to standard socioeconomic variables, respondents’ places of residence were included to investigate the effect of distance from the grassland that they were attempting to value on people’s WTP. The regional coefficient is positive and significant, indicating that people living in Inner Mongolia or neighboring provinces are willing to pay more. The farther the respondents are from the grasslands, the less they are willing to pay to protect them. This finding is consistent with the distance decay theory [9]. Sutherland and Walsh found that respondents who were far away from the policy area had a lower marginal WTP [42]. Pate and Loomis found that the distance had a negative impact on residents’ WTP in the San Joaquin Valley of California. Batman and others provide a theoretical basis for distance attenuation analysis from the perspective of use value [9]. More research can be done to check why and which public goods are likely to be immune to the effect of distance. The regression results also show that concern is positively associated with the respondent’s WTP, indicating that respondents that are more concerned about the protection of grassland ecosystem services in Inner Mongolia are willing to pay more.
4. Conclusions
Grassland ecosystems provide many goods and benefits for humans, such as carbon sequestration, water and soil conservation, biodiversity conservation, sand fixation and recreation. Economic valuation of grassland ecosystem services can provide useful information for decision makers to determine how much money should be invested and what policy measures should be taken to protect or restore grassland ecosystems. This study was designed to apply the contingent valuation method to measure the WTP of the Chinese netizens to protect grassland ecosystem services in Inner Mongolia, the largest pasture in China, and to identify the determinants that influence the respondents’ willingness-to-pay. A questionnaire survey was designed and implemented on a professional online survey platform.
The survey results indicate that approximately 61.55% of the respondents expressed positive willingness-to-pay to protect grassland ecosystem services in Inner Mongolia. The mean WTP was estimated to be CNY170.76 (USD 25.11) per person per year. This economic valuation can serve as a means of communicating to policy makers and other stakeholders about the Chinese netizens’ support for the protection of grassland ecosystem services. Our results also show that there is a significant spatial difference in people’s WTP. Respondents’ age, education level, family income, and concern about the grassland protection have significant effects on their WTP. Younger, higher-educated and more affluent respondents show a higher probability of payment, and respondents who are concerned about grassland protection have a higher likelihood of paying. The regression results show that the distance from the grassland has a negative impact on the probability and the value of people’s WTP. To the best of our knowledge, research on valuation of grassland ecosystem services by using the contingent valuation technique is still scarce in China. Our study is unique in its use of a nationwide survey with a larger area coverage. The methods used in this study may have an implication on other grasslands in the world.
The findings obtained have some important policy implications. First, as listed in China’s Agenda 21, public participation is important and determines the sustainable development achievements. Understanding the public’s preferences or WTP is important in determining the policies involved in the management and protection of grassland ecosystems. This study shows that more than sixty percent of the sample was willing to contribute for the protection of grassland ecosystem services in Inner Mongolia. Therefore, increasing investment in grassland restoration and management and protecting grassland ecosystem services will benefit the public. Second, this study shows that there is a significant spatial difference in people’s WTP. The distance from the grassland has a significant and negative impact. Therefore, different people from different regions with different socioeconomic backgrounds should pay different amounts to ensure fairness as much as possible. Finally, the survey results demonstrate that the respondents lack of knowledge on grassland ecosystem services, while respondents’ concern about grassland ecosystem protection is positively related to people’s WTP. Therefore, it is necessary to strengthen public education and raise their awareness of protecting grassland ecosystem services.
Finally, although several important issues were investigated and some useful findings were obtained in this study, it has some limitations. First, due to budget constraints, the results of this study were based on a relatively small sample although our sample size is comparable with some recent published studies [33]. Second, the sampled respondents in our study were Chinese netizens rather than the Chinese public. Because of the survey method that was online and used new media, the sample tended to be younger and more educated although our sample structure is in line with the existing literature [24]. Therefore, there is a need for appropriate care in extrapolating our results to the whole Chinese public. Finally, in order to validate the results of this study, some other valuation techniques such as choice experiments can be applied to value grassland ecosystem services.
Author Contributions
J.J. conceived the research; J.N. designed and performed the survey; J.N.; F.K. and X.W. analyzed the data; C.Z. and T.G. contributed materials and analysis tools; J.J. and J.N. wrote the paper.
Funding
This study received funding from the National Key Research and Development Program (2016YFC0500502 and 2016YFC0503505-06).
Conflicts of Interest
The authors declare no conflict of interest.
Appendix A

Table A1.
Main structure of the survey questionnaire.
| Question Categories | Questionnaire |
|---|---|
| 1. Knowledge and awareness questions | |
| How is your knowledge level of grassland ecosystem services? Are your concerned about the protection of grassland ecosystem services? | |
| Is it important to protect the grasslands in Inner Mongolia? | |
| 2. The CV questions | Assume that there is a protection program to protect and restore grassland ecosystems and their services in Inner Mongolia. However, this protection program is not financially covered by the government and needs public contributions. Would you be willing to contribute or not? Yes No If yes, how much would you be willing to contribute? (Please pick up the number that is close to your maximum willingness-to-pay) □20 □50 □100 □200 □800 □1000 □>1000 |
| 3. Respondents’ background information | |
| 3.1 Age | How old are you? |
| 3.2 Education | What is your highest level of education? |
| 3.3 Household income | What is your average monthly household income? |
References
- Costanza, R.R.; D’Arge, R.; Groot, S.; Farber, M.; Grasso, B.; Hannon, K.; Limburg, S.; Naeem, R.; O’Neill, J.; Paruelo, R.; et al. The value of the world’s ecosystem services and natural capital. Nature 1997, 387, 253–260. [Google Scholar] [CrossRef]
- Millennium Ecosystem Assessment (MA). Ecosystems and Human Well-Being: The Assessment Series (Four Volumes and Summary); Island Press: Washington, DC, USA, 2005. [Google Scholar]
- Chapman, P.M.; Selck, H.; Doorn, N.; Munns, W.R. Ecosystem services deserve better than “dirty paper”. Environ. Toxicol. Chem. 2017, 36, 867–868. [Google Scholar] [CrossRef] [PubMed]
- Divinsky, I.; Becker, N.; Bar, P. Ecosystem service tradeoff between grazing intensity and other services—A case study in Karei-Deshe experimental cattle range in northern Israel. Ecosyst. Serv. 2017, 24, 16–27. [Google Scholar] [CrossRef]
- Egoh, B.N.; Reyers, B.; Rouget, M.; Richardson, D.M. Identifying priority areas for ecosystem service management in South African grasslands. J. Environ. Manag. 2011, 92, 1642–1650. [Google Scholar] [CrossRef] [Green Version]
- Sala, O.E.; Paruelo, J.M. Ecosystem services in grasslands. In Nature’s Services, Societal Dependence on Natural Ecosystems; Daily, G.C., Ed.; Island Press: Washington, DC, USA, 1997; pp. 237–252. [Google Scholar]
- White, R.; Murray, S.; Rohweder, M. Pilot Analysis of Global Ecosystems Grassland Ecosystems; World Resources Institute: Washington, DC, USA, 2000; ISBN 1-56973-461-5. [Google Scholar]
- Zheng, X.; Zhang, J.; Cao, S. Net value of grassland ecosystem services in mainland China. Land Use Policy 2018, 79, 94–101. [Google Scholar] [CrossRef]
- Bateman, I.J.; Day, B.H.; Georgiou, S.; Lake, I. The aggregation of environmental benefit values, welfare measures, distance decay and WTP. Ecol. Econ. 2006, 60, 450–460. [Google Scholar] [CrossRef] [Green Version]
- Dai, E.; Huang, Y.; Wu, Z.; Zhao, D. Analysis of spatio-temporal features of a carbon source/sink and its relationship to climatic factors in the Inner Mongolia grassland ecosystem. J. Geogr. Sci. 2016, 26, 297–312. [Google Scholar] [CrossRef] [Green Version]
- Costanza, R.; de Groot, R.; Sutton, P.; Van der Ploeg, S.; Anderson, S.J.; Kubiszewski, I.; Farber, S.; Turner, R.K. Changes in the global value of ecosystem services. Glob. Environ. Change 2014, 26, 152–158. [Google Scholar] [CrossRef]
- Campbell, E.T.; Brown, M.T. Environmental accounting of natural capital and ecosystem services for the US National Forest System. Environ. Dev. Sustain. 2012, 14, 691–724. [Google Scholar] [CrossRef]
- Connor, J.D.; Bryan, B.A.; Nolan, M.; Stock, F.; Gao, L.; Dunstall, S.; Graham, P.; Ernst, A.; Newth, D.; Grundy, M.; et al. Modelling Australian land use competition and ecosystem services with food price feedbacks at high spatial resolution. Environ. Model. Softw. 2015, 69, 141–154. [Google Scholar] [CrossRef]
- Sutton, P.C.; Anderson, S.J.; Costanza, R.; Kubiszewski, I. The ecological economics of land degradation: Impacts on ecosystem service values. Ecol. Econ. 2016, 129, 182–192. [Google Scholar] [CrossRef]
- Caro-Borrero, A.; Corbera, E.; Neitzel, K.C.; Almeida-Leñero, L. “We are the city lungs”: Payments for ecosystem services in the out skirts of Mexico City. Land Use Policy 2015, 43, 138–148. [Google Scholar] [CrossRef]
- Freeman, A.M., III. The Measurement of Environmental and Resource Values: Theory and Methods; Resources for the Future Press: Washington, DC, USA, 2003. [Google Scholar]
- Cooper, J.C.; Hanemann, M.; Signorello, G. One-and-one-half-bound dichotomous choice contingent valuation. Rev. Econ. Stat. 2002, 84, 742–750. [Google Scholar] [CrossRef] [Green Version]
- Mitchell, R.C.; Carson, R.T. Using Surveys to Value Public Goods: The Contingent Valuation Method; Resource for the Future: Washington, DC, USA, 1989. [Google Scholar]
- Lindhjema, H.; Grimsrudb, K.; Navrud, S.; Kolle, S.O. The social benefits and costs of preserving forest biodiversity and ecosystem services. J. Environ. Econ. Policy 2015, 4, 202–222. [Google Scholar] [CrossRef]
- Ingraham, M.W.; Foster, S.G. The value of ecosystem services provided by the U.S. National Wildlife Refuge System in the contiguous U.S. Ecol. Econ. 2008, 67, 608–618. [Google Scholar] [CrossRef]
- Zhang, T.; Yan, H.; Zhan, J. Economic Valuation of Forest Ecosystem Services in Heshui Watershed using Contingent Valuation Method. Procedia Environ. Sci. 2012, 13, 2445–2450. [Google Scholar]
- Pinto, R.; Brouwer, R.; Patrício, J.; Abreu, P.; Marta-Pedroso, C.; Baeta, A.; Franco, J.N.; Domingos, T.; Marques, J.C. Valuing the non-market benefits of estuarine ecosystem services in a river basin context: Testing sensitivity to scope and scale. Estuar. Coast. Shelf Sci. 2016, 169, 95–105. [Google Scholar] [CrossRef]
- Fleischer, A.; Sternberg, M. The economic impact of global climate change on Mediterranean rangeland ecosystems: A space-for-time approach. Ecol. Econ. 2006, 59, 287–295. [Google Scholar] [CrossRef] [Green Version]
- Pu, S.; Shao, Z.; Fang, M.; Yang, L.; Liu, R.; Bi, J.; Ma, Z. Spatial distribution of the public’s risk perception for air pollution: A nationwide study in China. Sci. Total Environ. 2019, 655, 454–462. [Google Scholar] [CrossRef]
- Bai, Y.; Wu, J.; Clark, C.M.; Naeem, S.; Pan, Q.; Huang, J.; Han, X. Tradeoffs and thresholds in the effects of nitrogen addition on biodiversity and ecosystem functioning: Evidence from Inner Mongolia grasslands. Glob. Chang. Biol. 2010, 16, 358–372. [Google Scholar] [CrossRef]
- Qi, J.; Chen, J.; Wan, S.; Ai, L. Understanding the coupled natural and human systems in Dryland East Asia. Environ. Res. Lett. 2012, 7. [Google Scholar] [CrossRef] [Green Version]
- Zhou, S.; Zhao, K. Evaluation of the effects of implementing degraded grassland ecosystem restoration technology: A case study on technology for returning grazing land to grassland. J. Resour. Ecol. 2017, 8, 359–368. [Google Scholar]
- Fan, F.; Liang, C.; Tang, Y.; Harker-Schuch, I.; Porter, J.R. Effects and relationships of grazing intensity on multiple ecosystem services in the Inner Mongolian steppe. Sci. Total Environ. 2019, 675, 642–650. [Google Scholar] [CrossRef] [PubMed]
- Bateman, I.J.; Carson, R.T.; Day, B.; Hanemann, M.; Hanley Hett, N.T.; Jones-Lee, M.; Loomes, G.; Mourato, S.; Özdemiroglu, E.; Pearce, D.W.; et al. Economic Valuation with Stated Preference Techniques: A Manual; Edward Elgar: Cheltenham, UK, 2002. [Google Scholar]
- Kangethe, A.; Franic, D.M.; Corso, P.S. Comparing the validity of the payment card and structured haggling willingness to pay methods: The case of a diabetes prevention program in rural Kenya. Soc. Sci. Med. 2016, 169, 86–96. [Google Scholar] [CrossRef]
- Cummings, R.G.; Taylor, L.O. Unbiased value estimates for environmental goods: A cheap talk design for the contingent valuation method. Am. Econ. Rev. 1999, 89, 649–665. [Google Scholar] [CrossRef]
- Mwebaze, P.; Marris, G.C.; Brown, M.; MacLeod, A.; Jones, G.; Budge, G.E. Measuring public perception and preferences for ecosystem services: A case study of bee pollination in the UK. Land Use Policy 2018, 71, 355–362. [Google Scholar] [CrossRef]
- Wang, Z.; Gong, Y.; Mao, X. Exploring the value of overseas biodiversity to Chinese netizens based on willingness to pay for the African elephants protection. Sci. Total Environ. 2018, 637–638, 600–608. [Google Scholar] [CrossRef]
- Wei, W.; Wu, Y. Willingness to pay to control PM2.5 pollution in Jing-Jin-Ji Region, China. Appl. Econ. Lett. 2017, 24, 753–761. [Google Scholar] [CrossRef]
- Ndambiri, H.; Brouwer, R.; Mungatana, E. Comparing welfare estimates across stated preference and uncertainty elicitation formats for air quality improvements in Nairobi, Kenya. Environ. Dev. Econ. 2016, 1, 1–20. [Google Scholar] [CrossRef] [Green Version]
- Haab, T.C.; McConnell, K.E. Valuing Environmental and Natural Resources: The Econometrics of Non-market Valuation; Edward Elgar: Cheltenham, UK, 2002. [Google Scholar]
- Arcury, T. Environmental attitude and environmental knowledge. Hum. Organ. 1990, 49, 300–304. [Google Scholar] [CrossRef]
- Istamto, T.; Houthuijs, D.; Lebret, E. Willingness to pay to avoid health risks from road-traffic-related air pollution and noise across five countries. Sci. Total Environ. 2014, 497–498, 420–429. [Google Scholar] [CrossRef] [PubMed] [Green Version]
- Wang, M.; Mo, H. The impact of spatial heterogeneity on ecosystem service value in a case study in Liuyang River Basin, China. J. Resour. Ecol. 2018, 9, 209–217. [Google Scholar]
- Menard, S.W. Applied Logistic Regression Analysis; SAGE Publications: Thousand Oaks, CA, USA, 1995. [Google Scholar]
- Yoo, S.H.; Kwak, S.Y. Willingness to pay for green electricity in Korea: A contingent valuation study. Energy Policy 2009, 37, 5408–5416. [Google Scholar] [CrossRef]
- Sutherland, R.J.; Walsh, R. Effect of distance on the preservation value of water quality. Land Econ. 1985, 61, 281–291. [Google Scholar] [CrossRef]
Figure 1.
The location and distribution of grassland ecosystems in Inner Mongolia.

Figure 2.
Distribution of positive WTP responses.

Figure 3.
Spatial distribution of respondents’ average WTP in each region (a) and each province (b).
Figure 3.
Spatial distribution of respondents’ average WTP in each region (a) and each province (b).

Table 1.
Survey respondent characteristics distribution.
| Variable | Groups | Percentage (%) |
|---|---|---|
| Gender | Male | 42.55 |
| Female | 57.45 | |
| Age | 16–29 | 58.78 |
| 30–49 | 36.91 | |
| ≥50 | 4.31 | |
| Education | Primary school and below | 2.21 |
| Junior high school | 6.56 | |
| Senior high school and technical school | 12.26 | |
| Bachelor or university degree | 65.76 | |
| Postgraduate and above | 13.21 | |
| Public institution personnel | Yes | 16.89 |
| No | 83.11 | |
| Household income (CNY/month) | ≤1000 | 5.39 |
| 1001–3000 | 12.10 | |
| 3001–5000 | 18.18 | |
| 5001–7000 | 16.39 | |
| 7001–10,000 | 16.55 | |
| 10,001–15,000 | 15.10 | |
| 15,001–20,000 | 8.19 | |
| 20,001–50,000 | 5.96 | |
| >50,000 | 2.14 |
Table 2.
Respondents’ awareness on each specific grassland ecosystem service.
| Ecosystem Service | Strongly Disagree | Disagree | Neutral | Agree | Strongly Agree |
|---|---|---|---|---|---|
| Carbon sequestration | 1.76% | 3.15% | 19.26% | 43.84% | 31.99% |
| Windbreak and sand fixation | 1.42% | 2.58% | 9.33% | 30.95% | 55.72% |
| Water and soil conservation | 1.36% | 2.46% | 7.60% | 31.61% | 56.98% |
| Biodiversity conservation | 1.48% | 2.84% | 11.60% | 35.11% | 48.98% |
| Primary and secondary product provision | 1.48% | 3.25% | 14.53% | 40.43% | 40.31% |
| Tourism and entertainment | 1.70% | 4.57% | 19.82% | 37.85% | 36.05% |
| Ethnic culture inheritance | 2.30% | 7.25% | 29.56% | 34.26% | 26.63% |
Table 3.
Reasons for answering ‘Yes’ to the WTP question.
| Reasons | Percentage (%) |
|---|---|
| Protecting the grassland ecosystems is good for our environment. | 21.23 |
| It is our responsibility to protect grassland ecosystems. | 19.52 |
| Protecting grassland ecosystems will benefit our future generations. | 17.35 |
| Protecting the grassland ecosystem can ensure the existence of the grassland in Inner Mongolia. | 14.47 |
| Protecting grassland is very important for the production and life in Inner Mongolia | 13.42 |
| Protecting the grassland ecosystem can provide us with option values. | 12.03 |
| Others | 1.98 |
Table 4.
Reasons for respondents’ unwillingness to pay.
| Reasons | Percentage (%) |
|---|---|
| My household cannot afford it. | 29.49 |
| It is the government’s responsibility. | 21.82 |
| We don’t believe that the funds would be effectively used. | 19.45 |
| The grassland is far away from where I live and the local people should pay for the protection program. | 16.19 |
| The people who destroyed the grassland should pay. | 9.7 |
| Others | 3.35 |
Table 5.
The explanatory variables for regression models.
| Variable | Description | Mean | Std. Dev. |
|---|---|---|---|
| Gender | Male = 1; Female = 0 | 0.42 | 0..49 |
| Age | 16–29 years old = 1; 30–49 years old = 2; 50 years old and above = 3 | 29.13 | 9.57 |
| Education | Primary school and below = 1; Junior high school = 2; Senior high school and technical school = 3; Bachelor or university degree = 4; Postgraduate and above = 5 | 3.81 | 0.82 |
| Student | Yes = 1; No = 0 | 0.32 | 0.46 |
| Income | Household monthly income (CNY): ≤1000 = 1; 1001–3000 = 2; 3001–5000 = 3; 5001–7000 = 4; 7001–10,000 = 5; 10,001–15,000 = 6; 15,001–20,000 = 7; 20,001–50,000 = 8; >50,000 = 9 | 4.47 | 1.98 |
| Region | Inner Mongolia and neighboring provinces = 1; Others = 0 | 0.25 | 0.43 |
| Concern | Concern about protection of grassland ecosystem services in Inner Mongolia: Totally not = 1; Not very = 2; Ordinary = 3; Concerned = 4; Very concerned = 5 | 3.55 | 0.94 |
Table 6.
Probit model for respondents’ probability to have a positive WTP.
| Variables | Coef. | Std. Err | p > |z| |
|---|---|---|---|
| Gender | 0.06 | 0.05 | 0.170 |
| Age | –0.003 | 0.04 | 0.940 |
| Education | 0.16 *** | 0.03 | 0.000 |
| Income | 0.13 *** | 0.01 | 0.000 |
| Region | 0.12 ** | 0.05 | 0.032 |
| Constant | –0.93 *** | 0.15 | 0.000 |
| Log likelihood | –2001.41 | ||
| Prob > chi2 | 0.000 | ||
| Observations | 3573 |
Note: ** and *** denote significance at 5% and 1%, respectively.
Table 7.
Interval regression model for individuals who have a positive WTP.
| Variables | Coef. | Std. Err | p > |z| |
|---|---|---|---|
| Gender | 21.29 | 24.08 | 0.377 |
| Age | –46.70 ** | 21.16 | 0.027 |
| Education | 0.40 | 17.49 | 0.982 |
| Income | 50.94 *** | 6.49 | 0.000 |
| Region | 66.67 ** | 27.49 | 0.015 |
| Concern | 80.16 *** | 14.10 | 0.000 |
| Constant | –147.59 * | 89.48 | 0.099 |
| Sigma | 434.16 | 7.17 | |
| Log likelihood | –5814.35 | ||
| Prob > chi2 | 0.000 | ||
| Observation | 2199 |
Note: *, ** and *** denote significance at 10%, 5% and 1%, respectively.
© 2019 by the authors. Licensee MDPI, Basel, Switzerland. This article is an open access article distributed under the terms and conditions of the Creative Commons Attribution (CC BY) license (http://creativecommons.org/licenses/by/4.0/).
Share and Cite
MDPI and ACS Style
Ning, J.; Jin, J.; Kuang, F.; Wan, X.; Zhang, C.; Guan, T. The Valuation of Grassland Ecosystem Services in Inner Mongolia of China and Its Spatial Differences. Sustainability 2019, 11, 7117. https://doi.org/10.3390/su11247117
AMA Style
Ning J, Jin J, Kuang F, Wan X, Zhang C, Guan T. The Valuation of Grassland Ecosystem Services in Inner Mongolia of China and Its Spatial Differences. Sustainability. 2019; 11(24):7117. https://doi.org/10.3390/su11247117
Chicago/Turabian StyleNing, Jing, Jianjun Jin, Foyuan Kuang, Xinyu Wan, Chenyang Zhang, and Tong Guan. 2019. "The Valuation of Grassland Ecosystem Services in Inner Mongolia of China and Its Spatial Differences" Sustainability 11, no. 24: 7117. https://doi.org/10.3390/su11247117
Note that from the first issue of 2016, this journal uses article numbers instead of page numbers. See further details here.