Climate Change Affects Forest Productivity in a Typical Climate Transition Region of China

1
School of Geography and Tourism, Shaanxi Normal University, Xi’an 710169, China
2
State Key Laboratory of Soil Erosion and Dryland Farming on the Loess Plateau, Northwest A&F University, Yangling 712100, China
*
Authors to whom correspondence should be addressed.
Sustainability 2019, 11(10), 2856; https://doi.org/10.3390/su11102856
Submission received: 21 April 2019
/
Revised: 11 May 2019
/
Accepted: 15 May 2019
/
Published: 20 May 2019
(This article belongs to the Special Issue Assessment, Mitigation and Restoration of Ecosystems in a Changing World)
Abstract
:As global climate change has a large effect on the structure and function of vegetation, it is very important to understand how forests in climate transition regions respond to climate change. The present study investigates the net primary productivity (NPP) of two planted forests (Robinia pseudoacacia and Pinus tabulaeformis) and one natural forest (Quercus wutaishanica) from 1951–2100 using the LPJ-GUESS model in the Shaanxi province of China, which is a typical transition region from humid to dry climates. We found that: (1) Future annual precipitation and mean temperature exhibited nonsignificant and significant increasing trend in the region, respectively, indicating a drier climate in future; (2) although precipitation would increase in the dry area and decrease in the humid area, the NPP of each species in the dry area would be lower than that of the humid area, possibly because increasing temperature and CO2 concentration could restrain forest growth in dry areas and promote forest growth in humid areas; (3) of the three species, P. tabulaeformis forest exhibited the highest average NPP and R. pseudoacacia forest exhibited the highest NPP trend in both dry and humid areas, indicating these planted species may be adaptable to future climate change. Our results provide novel insights into the potential response of forest productivity to a changing climate in the transition region from humid to dry climates.
1. Introduction
The fifth assessment report of the Intergovernmental Panel on Climate Change showed that global carbon dioxide (CO2) concentrations and mean surface temperature have increased since the industrial revolution in the 1850s (by 120 ppvm and 1–2 °C, respectively) and that these trends may continue in future [1,2]. These changes will probably affect the vegetation structure and function in terrestrial ecosystems on a global scale [3,4]. As a principal part of terrestrial ecosystem, forests undertake an indispensable role to mitigate global warming by serving as a carbon sink via photosynthesis [5,6]. Therefore, it is of importance to investigate the effects of future climate conditions on forest ecosystems.
Net primary productivity (NPP) of forests is very sensitive to the changes in CO2 concentration and climate [7] and has obtained much attention in studies on global climate change [8]. Hence, forest NPP can be a crucial indicator investigating the responses of forest ecosystems to future climate [9]. Several experience- and process-based models are established to simulate the forest NPP. While an experience-based model is a quick and convenient method for estimating NPP [10,11], it does not include the interactive effects of climate, CO2 concentration, and nutrient on the productivity [12], because it is built according to the relationship between observed NPP and environmental conditions [11]. In comparison to experience-based model, a process-based model integrates scaled-up representations of basic plant physiology with ecosystem dynamics and functions with several universal processes of forest ecosystems, including canopy photosynthesis, evapotranspiration, soil moisture change, litter dynamic, and nutrient and carbon dynamics. Currently, typical process-based models include BIOME-BGC [13], LPJ-GUESS [14], and SEIB-DGVM [15], which have been employed to investigate the vegetation NPP under a changing environment around the world. Therefore, compared with experience-based models, a process-based model can be used to accurately quantify the potential responses of forest NPP to future climate change [4,13].
While many researches have been devoted to investigating forest NPP using process-based models, they have mainly focused on forest ecosystems either in cold regions [16,17] or in humid regions [18,19,20]. Moreover, few studies have been carried out in dryland ecosystems, which may be limiting our understanding of how the forest NPP in dry regions responds to future climate and how the forest NPP in dry and humid regions will differ, especially in the transition region between them. In addition, previous studies have often used the potential combined situations of future climate factors and CO2 to investigate forest ecosystem dynamics [16,17,21], which may not be any more accurate in estimating further NPP scenarios owing to a lack of serial data for future climate scenarios. Therefore, the present study sought to explore long-term differences in the effects of future climate on forest NPP in both dry and humid regions.
The aim of the present study was to investigate the differences in the responses of natural and planted forest NPP to future climate change in the dry and humid regions. Specifically, the LPJ-GUESS model was used to assess the dynamic responses of forest NPP in historical period (1951–2014) and future period (2015–2100) in the Shaanxi province of China. First, the climate change anomaly and trend during 1951–2100 were detected in the dry and humid regions. Then, the model was evaluated through the comparison between simulated and field-based NPP during 2001–2010. Finally, the historical and future forest NPP in both dry and humid regions were predicted by the model from 1951–2100 under representative concentration pathway (RCP) scenarios, and trends in forest NPP were detected.
2. Materials and Methods
2.1. Study Area
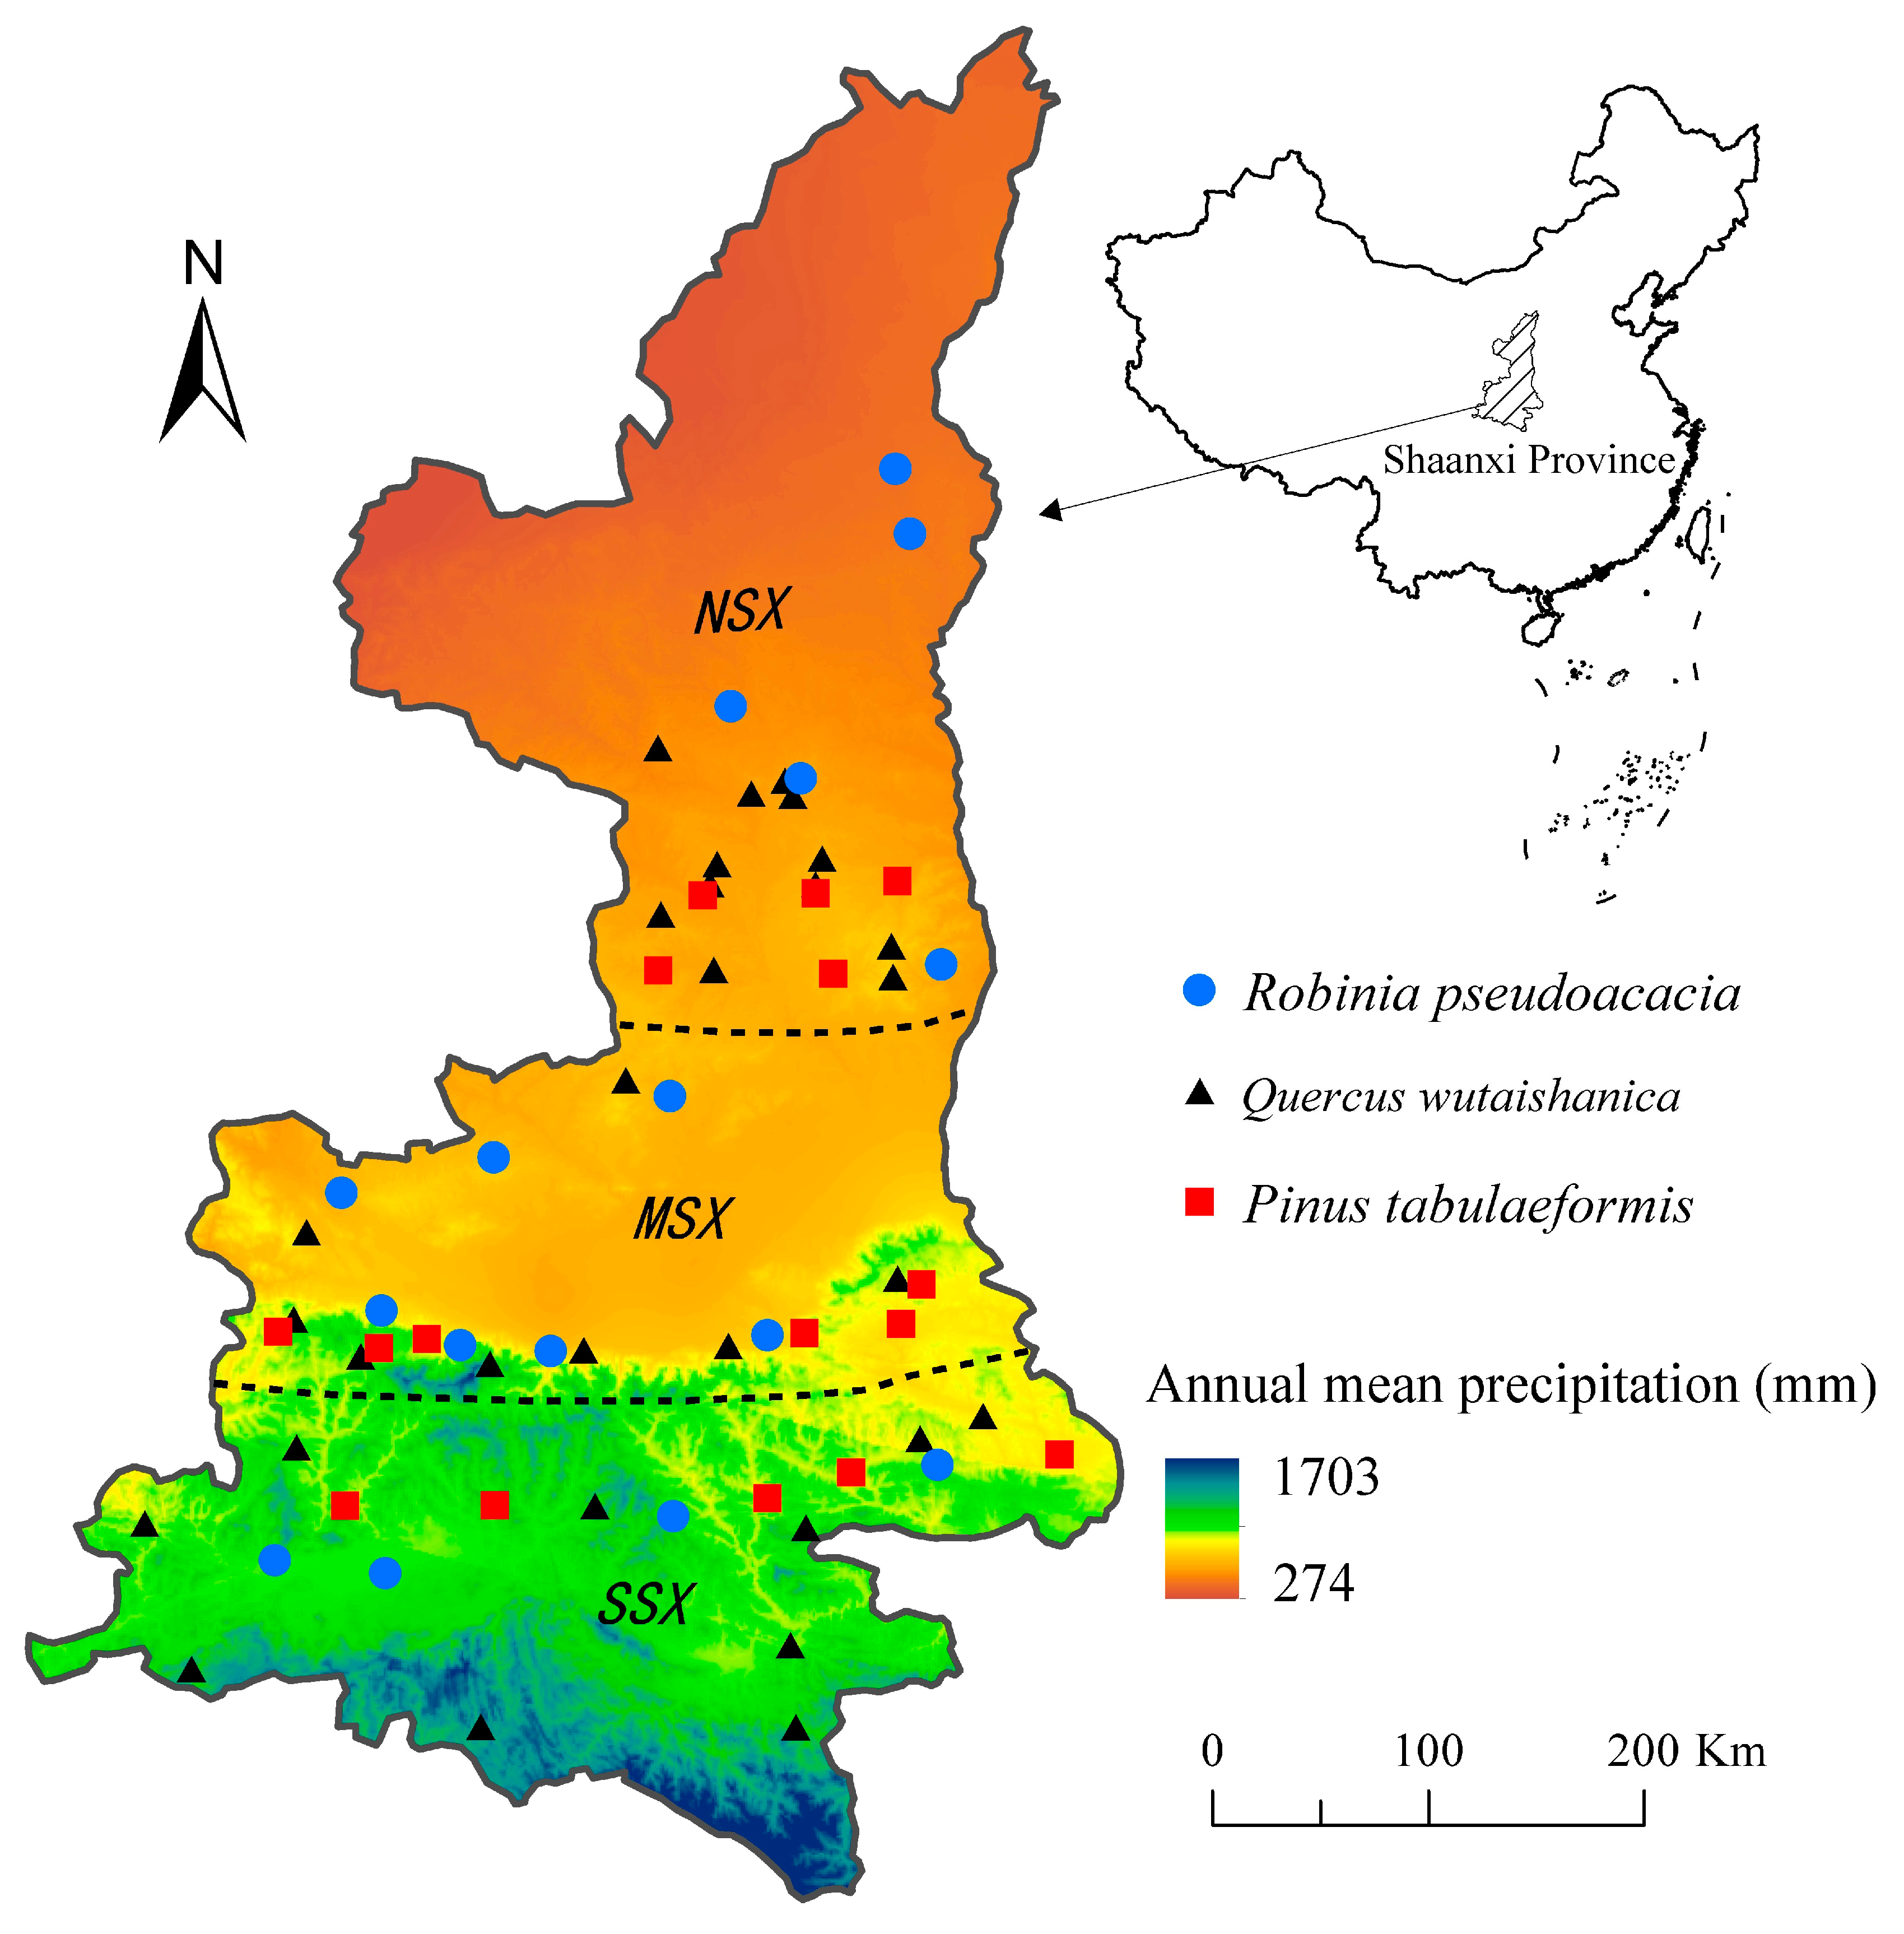
The Shaanxi province is located in the north and center of China (105.50°–111.25° E, 31.70°–39.60° N), where annual precipitation ranges from 1704 mm to 274 mm, representing a transition zone from a subtropical humid climate to a temperate arid climate (Figure 1). Although forests in this region have been destroyed in favor of croplands to a certain extent, the Grain-for-Green program led by Chinese government has largely restored the forests, which include both natural secondary and planted forests. Therefore, this region—which is a boundary region between two distinctly different climatic zones—was selected as the study area to elucidate how forest NPP responds to future climate in dry and humid regions.
This region can be divided into three natural areas in terms of its north–south geography and climate gradient: North Shaanxi (NSX), Guanzhong Plain (MSX), and South Shaanxi (SSX) (Figure 1). NSX is mainly covered by the Loess Plateau and the Maowusu desert and has a temperate arid climate, MSX is located in the center of Shaanxi and has a temperate humid climate, and SSX is mainly covered by the Qinling-Daba Mountains and has a subtropical humid climate. Accordingly, in this study, the MSX and SSX areas were considered to be the humid region, and NSX was treated as the dry region. Along the north–south climate gradient, the vegetation types in this region are: Temperate steppe, temperate forest and steppe, and warm temperate forest. Pinus tabulaeformis and Robinia pseudoacacia are the main afforestation species owing to their well-developed root system, drought tolerance, and high survival rate, and their carbon storage accounts for 50.4% of the total planted forest carbon storage in the region. The natural forests are composed mainly of the genus Quercus, in which Quercus wutaishanica is the dominant species and accounts for 63.0% of the total carbon storage of natural forests in the region [22]. Thus, Q. wutaishanica, R. pseudoacacia, and P. tabulaeformis forests were selected to model the NPP dynamics of forests undergoing climate change in the region. General information regarding the sampling sites is listed in Table 1.
2.2. Field-Based Forest NPP
In July 2015 and August 2016, field surveys were conducted at NSX, MSX, and SSX (Figure 1) to obtain model parameters and field-based estimate of NPP. Each plot size was 30 × 30 m2, where tree diameter at breast height (DBH) and height were measured for trees with a DBH > 5 cm; the tree density was also recorded for these trees at the plot. In each plot, healthy trees were selected to obtain tree core samples. The tree core sample was obtained at DBH using the increment borer, and 10–15 tree core samples were collected in each plot. In the laboratory, the core samples were glued onto wooden blocks, dried for 24 h, polished with fine sandpaper, and then examined under a stereomicroscope. All growth rings were marked, and the width of each ring was measured using a video micrometer (Olympus VM-31, Tokyo, Japan) connected to the stereomicroscope. The wood density of each tree species also can be obtained by the weight and size of tree core samples. In addition, healthy trees were selected from each plot and leaf, branch, stem, and fine root samples were collected and sealed in plastic bags. These samples were used to obtain the carbon content of each organ and specific leaf area. Specifically, the leaf samples were spread out without overlap on a white paper and photographed with a high-definition camera; the area of these leaf samples was obtained through image classification for the photograph using the ArcMap software (ESRI, USA). These leaf samples, together with the samples of other organs, were oven dried at 80 °C to constant weight to obtain dry mass; the dried samples were then ground and used to determine carbon content of each organ by an elemental analyzer (Carlo Erba 1106, Milan, Italy). The specific leaf area was calculated according to the leaf area, leaf carbon content, and leaf mass.
These survey and measurement data were employed to estimate the forest NPP, which was used to evaluate the simulated NPP by LPJ-GUESS for the Q. wutaishanica, R. pseudoacacia, and P. tabulaeformis forests. The specific estimation process of forest NPP was introduced with Q. wutaishanica forest at one plot as an example. First, annual biomass (kg year−1) of each organ for the individual tree at the plot was calculated by the annual averaged tree ring width and the allometric growth equation between the biomass of each organ and DBH (Table S1). Then, annual carbon biomass (kg C year−1) of each organ for the individual tree was calculated by its annual biomass and carbon content, and the annual carbon biomass of all organs were summed to the annual carbon biomass of the individual tree. Finally, the annual forest carbon biomass (kg C m−2 year−1) at the plot was calculated by the annual carbon biomass of individual tree and the tree density of this plot. The annual forest carbon biomass is the field-based forest NPP, which could be used to validate the model-predicted forest NPP.
2.3. Modeling Forest NPP
LPJ-GUESS model includes not only general mechanism processes of the LPJ-DGVM [23], but also detailed forest dynamics and competitions of the forest gap model [24]. The model can be run at plant functional type and species levels [25]. Detailed description is presented by Smith et al. (2014) [14]. The model could simulate the carbon biomass, NPP, and species composition of the vegetation ecosystem. The model requires several data inputs: Monthly climate (temperature, precipitation, and cloud cover), atmospheric CO2 concentration, and soil texture. Monthly climate data for 1951–2014 at 1 km spatial resolution for Shaanxi province were spatially downscaled using Climatic Research Unit time series 3.23 [26], and those for 2015–2100 were downscaled using the Coupled Model Intercomparison Project Phase 5 [27]. The downscaling process is described in our previous work [28]. For the future data, 28 general circulation models (GCMs) have been evaluated by the observations of weather stations. NorESM1-M and GFDL-ESM2M models presented the lowest biases in downscaling the future monthly temperature and precipitation, respectively [28]. Thus, the downscaling monthly temperature and precipitation data of these two GCMs were adopted in this study. Besides, future cloud cover data were generated by the BCC-CSM1.1-M model because of its high performance in simulating cloud cover over China [29]. Soil texture data were obtained from the Food and Agriculture Organization soil dataset [23]. The CO2 concentration from 1951 to 2100 was obtained from the RCP Database (http://www.iiasa.ac.at/web-apps/tnt/RcpDb).
The LPJ-GUESS model also requires about 30 parameters that influence establishment, mortality, tree growth, shade tolerance, metabolic rate, and bioclimatic limits. The ecophysiological characteristics for the three species were parameterized based on previous studies [14] and field surveys. Detailed parameter information is showed in Table S2.
Model simulation began with bare ground without harvest configuration because logging over the study area is prohibited. To run the model, it needs the starting condition of the plot, such as the ecosystem carbon and nitrogen pools in starting year. If the starting condition is unavailable, it could be established using a spin-up run. In spin-up run, climate data in historic period can be employed to run the model and force the model to achieve a steady state for the carbon and nitrogen pools. In the present study, climatic data during 1951–1980 circularly ran the LPJ-GUESS model until both carbon and nitrogen pools achieved the steady state. Using this steady state as the initial condition, the forest NPP series were simulated for the historical and future periods (using the climate and atmospheric CO2 concentration data for 1951–2100). In the current study, RCP2.6, RCP4.5, and RCP8.5 scenarios were adopted to simulate future forest NPP.
2.4. Anomaly and Trend Analyses
In the present study, analyses of anomalies and trends were conducted for climate and NPP in the study area. To analyze anomalies, we used 1961–1990 as the base period, which is a relatively stable period for the climate and often used as the reference period to investigate climate change in time series [1,28,30]. The temperature anomaly was calculated from time-series values minus averaged values for 1961–1990, while anomalies for precipitation and NPP were calculated from the time-series absolute variations divided by the time-series original values. The time-series absolute variations were calculated from the time-series values minus the averaged values for 1961–1990. In addition, due to the fact that the non-parametric tests are robust for environmental change in time series where missing data and extreme values are frequent [31], Mann–Kendall trend and Sen’s slope estimator tests [32,33] were employed to detect the trend significance and magnitude for the climate and NPP changes in time series. Moreover, the trend significance was conducted at the 95% and 99% confidence levels in this study.
3. Results
3.1. Climate Anomaly and Trend
Both the average temperature and precipitation decreased from south to north of the study area in both historical and future periods (Table 2). The future climate anomaly showed that the temperature in the three natural regions exhibited almost the same increment, while precipitation increased in the NSX region and decreased in the MSX and SSX regions (Table 2 and Figures S1 and S2). A climate trend analysis showed that annual mean temperature represented a significant increasing trend of 0.2 °C decade−1 in 1951–2014 and 0.1–0.5 °C decade−1 in 2015–2100. In contrast, annual precipitation exhibited nonsignificant trends in both historic and future periods, with the exception of significant increasing trends for the MSX and SSX regions under the scenario RCP4.5 (Table 2).
3.2. Model Validation
Based on the field-based NPP during 2001–2010, the NPP simulated by the LPJ-GUESS was validated for each of the tree species for each of the three natural areas. Although the simulated NPP of each tree species was slightly greater than the field-based NPP for each natural area with a total averaged overestimation of 28.2%, these differences were not significant in statistics (Figure 2). Therefore, the results of the NPP simulation using LPJ-GUESS were reliable for the study area.
3.3. Dynamic Changes in Forest NPP
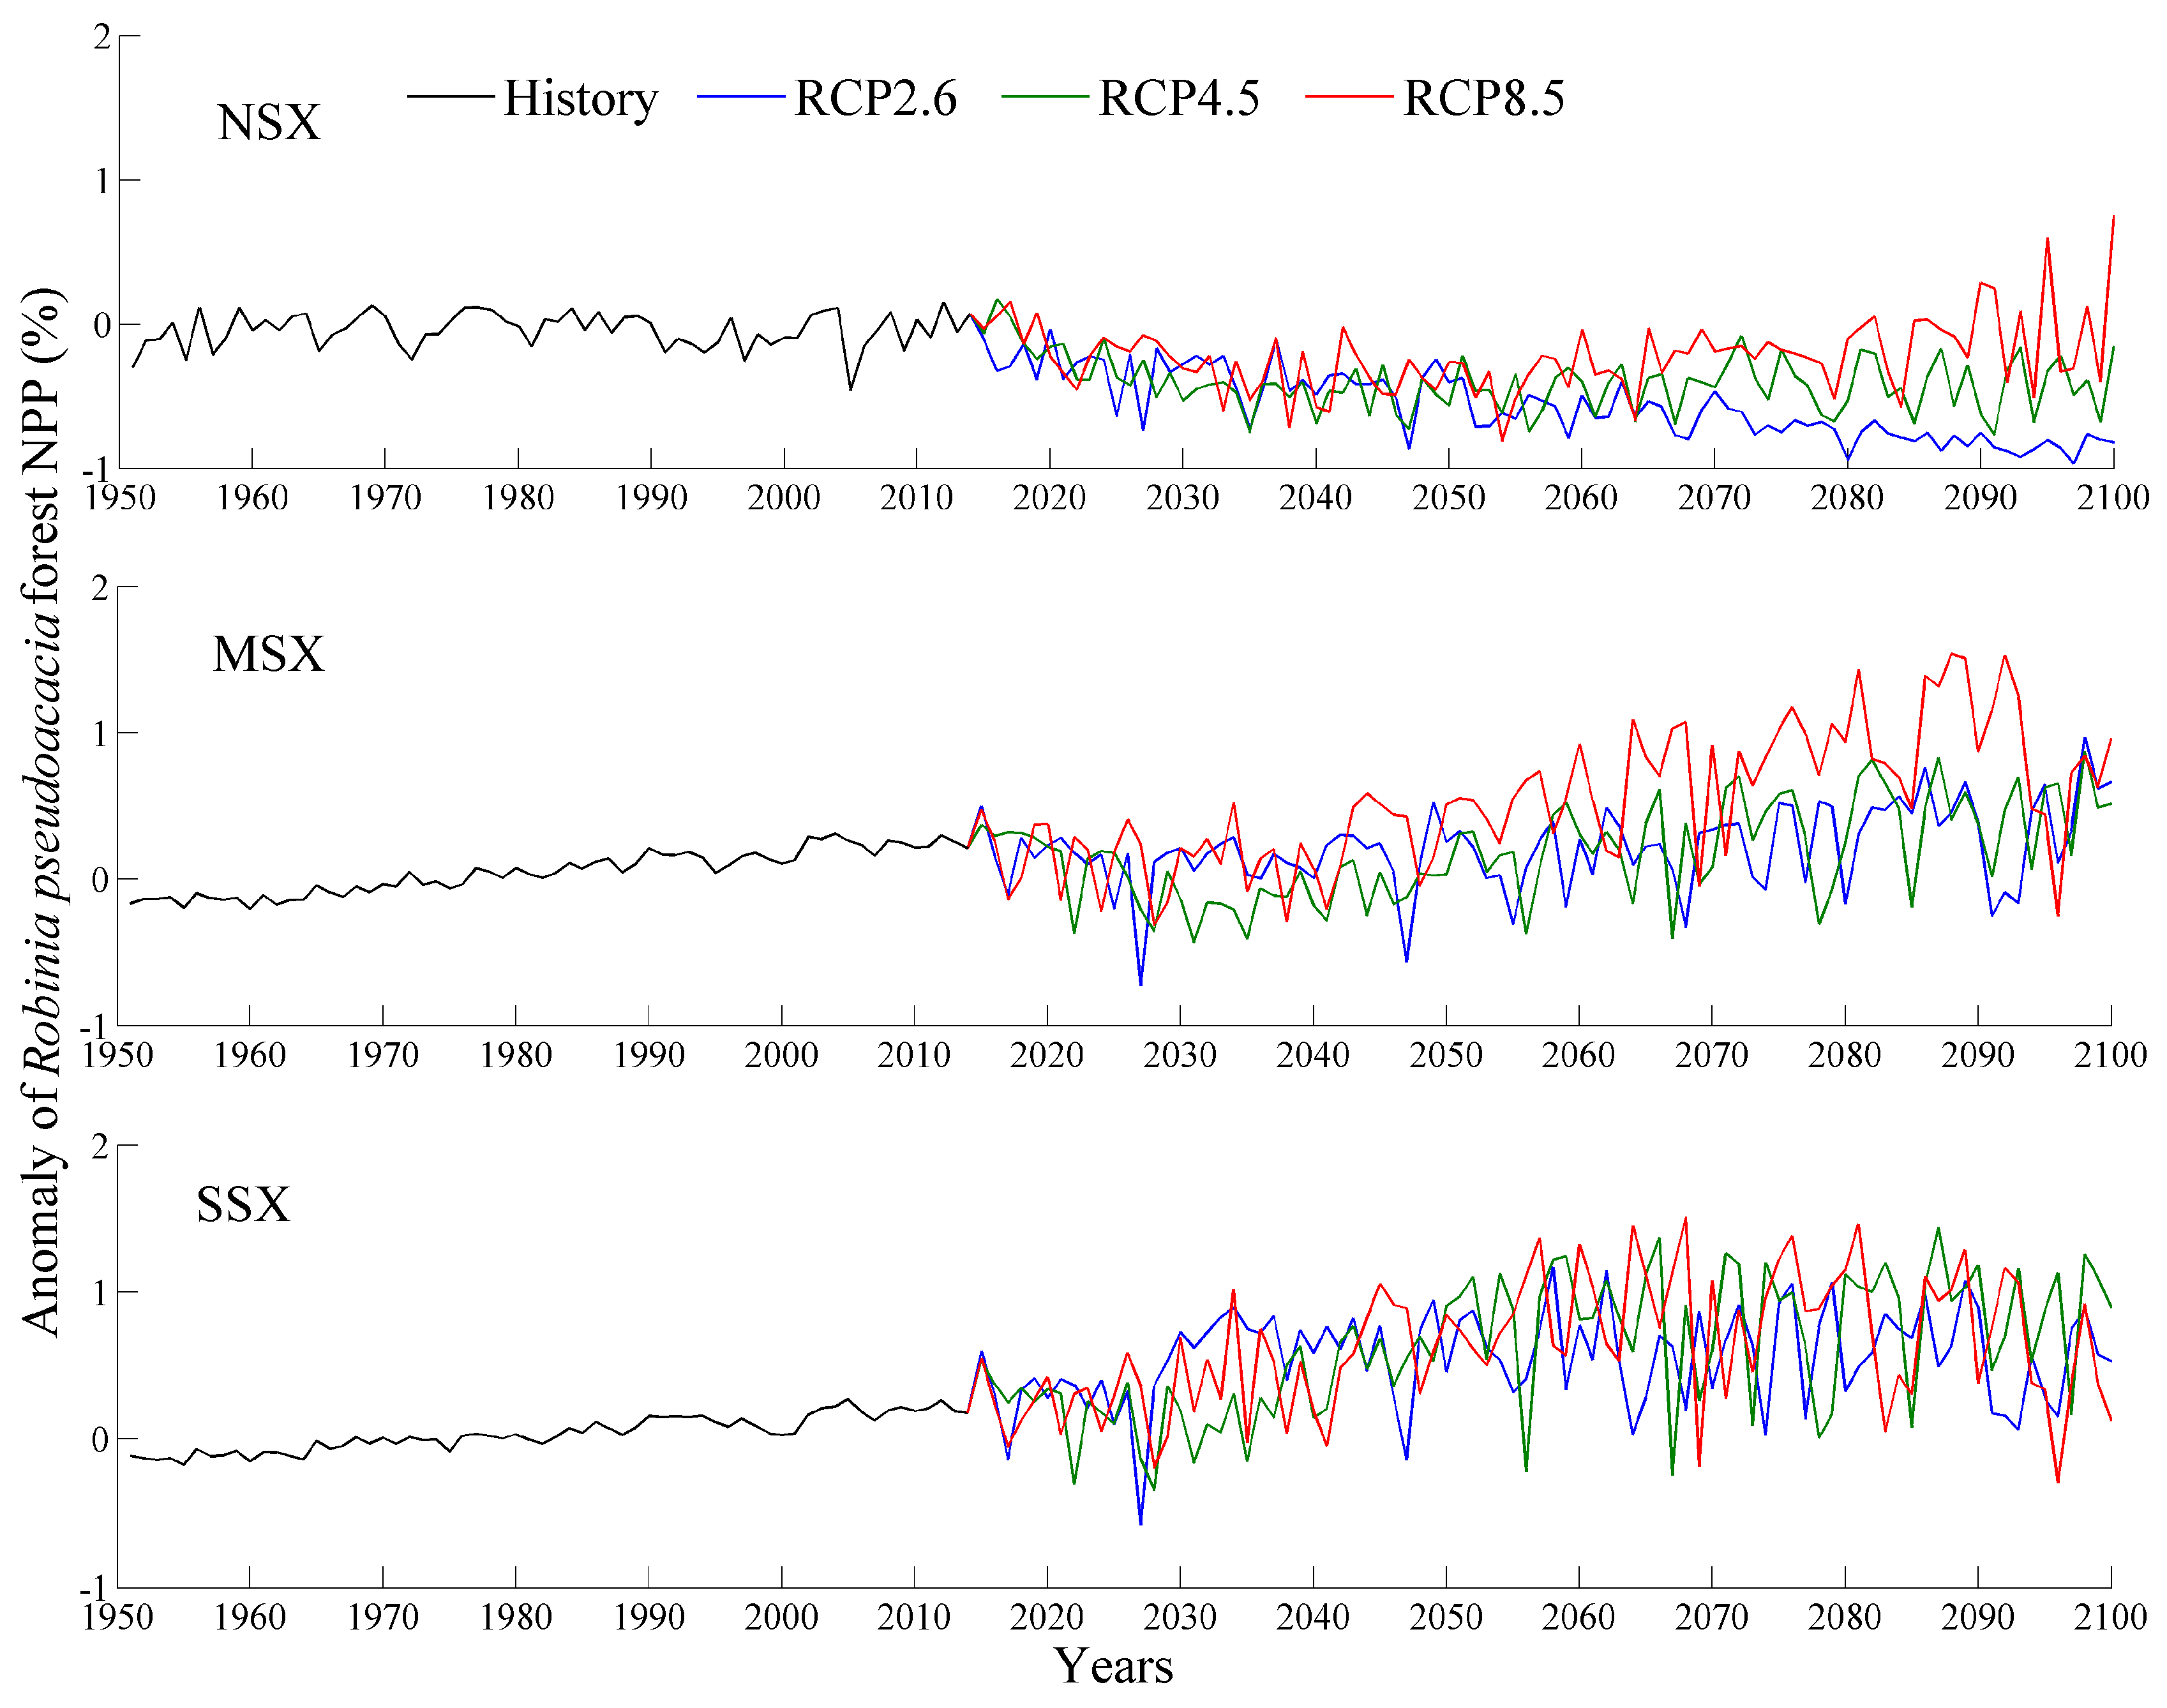
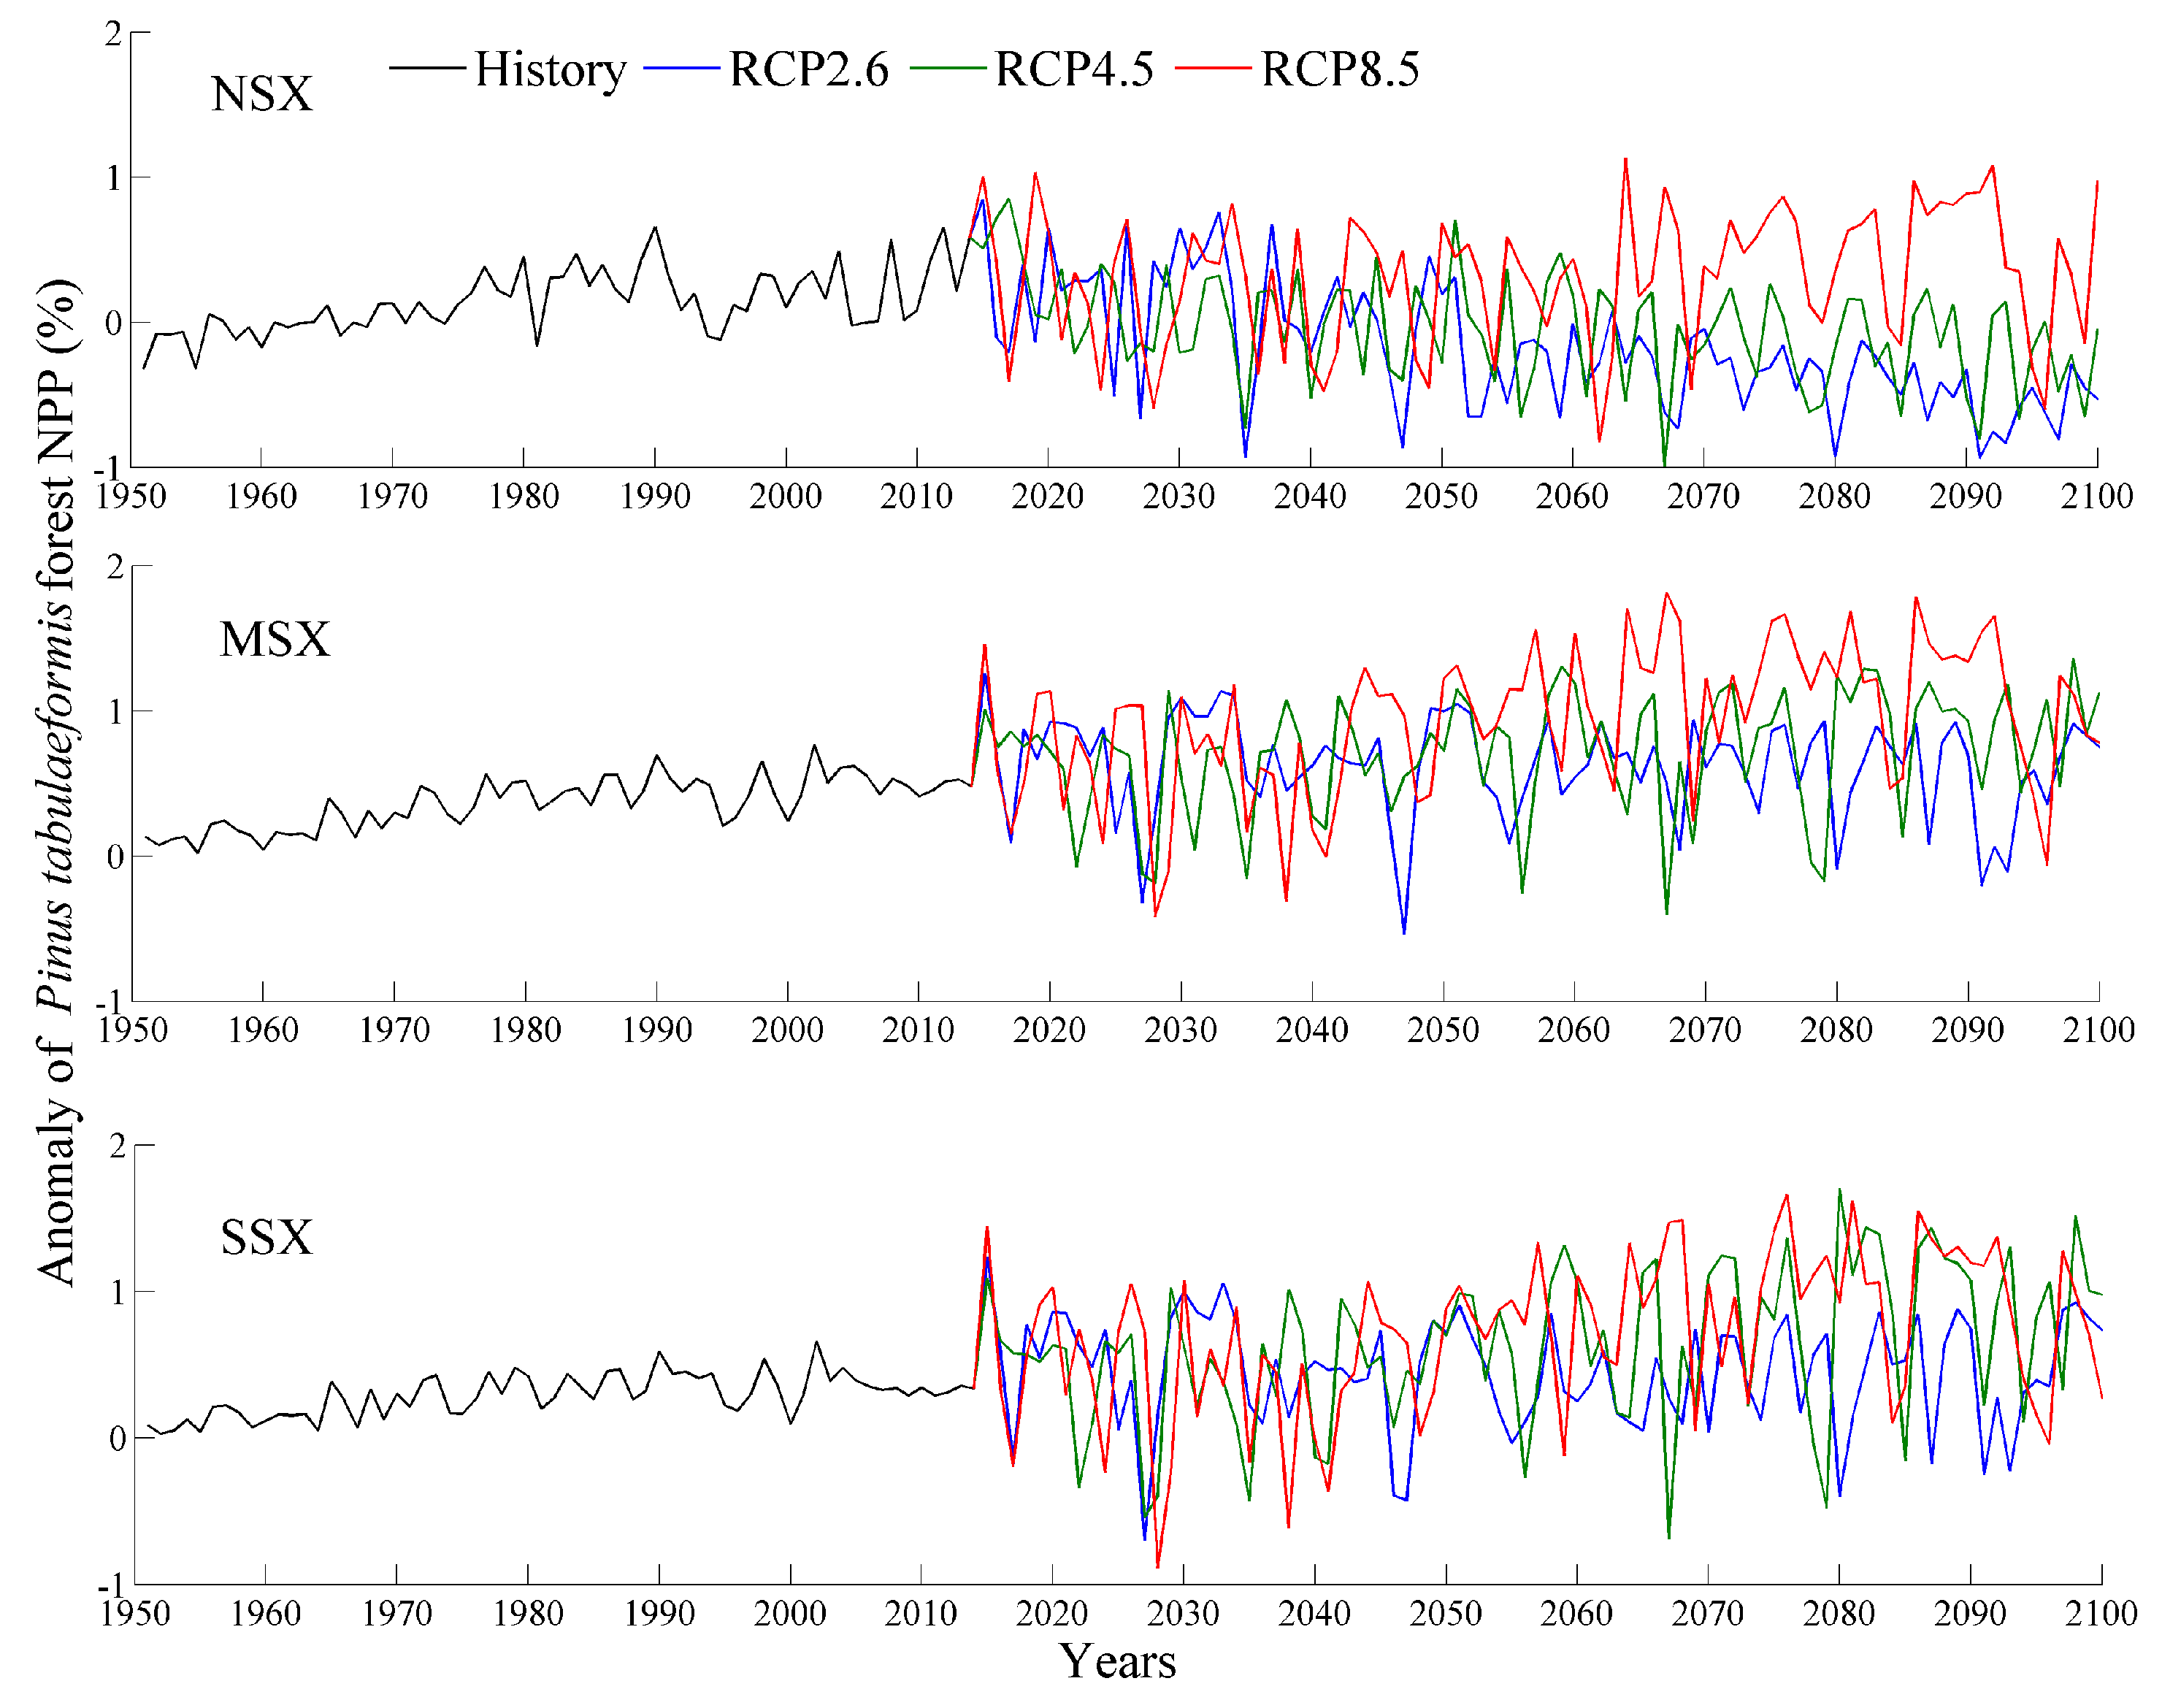
The averaged NPP and NPP anomaly during historical and future periods are shown in Figure 3, Figure 4 and Figure 5 and Table 3. Specifically, the values for the NPP of each tree species in the NSX region are lower than those of the MSX and SSX regions. In comparison to NPP of 1961–1990, the NPP of each tree species in the MSX and SSX regions exhibited an increase while those of the NSX region displayed a decrease. Furthermore, the future NPP of each tree species over each natural area increased with emission intensity. Of the three species of trees, P. tabulaeformis forest exhibited the highest NPP in all three natural areas, while Q. wutaishanica exhibited a higher NPP than R. pseudoacacia in both the NSX and MSX regions.
3.4. Trends in Forest NPP
In 1951–2014, the values for the NPP of the three forests exhibited significant increasing trends, with the exception of the R. pseudoacacia forest in the NSX region (Table 4). The magnitudes of trends in the MSX and SSX regions were greater than those in the NSX region. Furthermore, over the entire study area, the R. pseudoacacia forest exhibited had the highest trend magnitude with 22.1 g C m−2 decade−1, followed by the P. tabulaeformis forest with 21.8 g C m−2 decade−1, and finally the Q. wutaishanica forest with 16.0 g C m−2 decade−1.
In 2015–2100, NPP values of three forests in the NSX region displayed a significant deceasing trend under RCP2.6 and RCP4.5 scenarios, while in the MSX and SSX regions, NPP values exhibited a significant increasing trend under RCP4.5 and RCP8.5 scenarios (Table 4). Furthermore, the NPP trends for each tree species increased with emission intensity. Specifically, under RCP2.6 scenario, P. tabulaeformis forest NPP exhibited the most pronounced decreasing trend, with 40.6 g C m−2 decade−1, followed by Q. wutaishanica forest with 38.4 g C m−2 decade−1, and finally R. pseudoacacia forest with 24.1 g C m−2 decade−1. Under RCP4.5 and RCP8.5 scenarios, R. pseudoacacia forest NPP exhibited the most pronounced increasing trends in NPP (33.5 and 46.0 g C m−2 decade−1, respectively), followed by the P. tabulaeformis forest with 28.4 and 29.8 g C m−2 decade−1, and finally the Q. wutaishanica forest with 20.9 and 32.6 g C m−2 decade−1, respectively.
4. Discussion
4.1. Future Climate Change
In the present study, temperature and precipitation decreased from south to north during historical and future periods. Moreover, the future annual mean temperature exhibited a large increment and significant increasing trend, while there was no significant change in future annual precipitation. These results are in accordance with other studies regarding the Loess Plateau [28], China [34,35], North America, and southern Africa [36]. In comparison to the historical period, the study region may be drier in the future owing to increased evapotranspiration induced by increasing temperatures [30].
4.2. Response of Forest NPP to Climate Change
According to the simulated results, the NPP of each of the three species of tree in the dry area (i.e., NSX) was lower than that of the humid areas (i.e., MSX and SSX) in both historic and future periods. Furthermore, the future NPP of each tree species in the dry area exhibited a significant decreasing trend, while those of the humid areas displayed significant increasing trends. These results indicate that future climate change may exert both negative and positive effects on forest growth in dry and humid areas, respectively, although there were no obvious differences in climate change trends between these two areas, with the exception that future precipitation in the dry area exhibited an increase while in the humid area precipitation was predicted to decrease. Besides, the decreases in forest NPP were also observed in the Amazon forests [37] and Canada’s boreal forests [38], because of climate warming and increasing CO2 concentration.
In general, increasing temperatures and CO2 concentrations may increase NPP by prolonging the growing season and by enhancing both photosynthesis and water use efficiency [39], but could also decrease NPP by enhancing water stress caused by evapotranspiration and reducing stomatal conductance [30,40,41,42]. Specifically, the results of this study imply that the positive effects of temperature and CO2 concentration on forest growth are greater than the negative effects in the humid areas, while the contrary is true in the dry area. This phenomenon may be attributed to the fact that the humid areas had much higher precipitation than the dry areas during each period examined. Thus, we concluded that future warming climate condition would lead the forest in the dry area to be a carbon source while enhancing the ability of forest carbon sink in the humid areas. However, this inference may be not suitable to the tropical forests, because Feng et al. (2018) reported that future warming climate would lead Puerto Rican tropical forests in humid area to be a carbon source [20]. The difference should be attributed to the fact that the forest growth is not simply determined by the warming climate or increasing precipitation but the combined effect (e.g., soil water availability) of temperature and precipitation as well as the species characteristic [17,38], especially in the climate transition zone [38]. In addition, the average NPP of each species in the MSX region is greater than that in the SSX region, which may be because each species has its optimal habitat conditions according to the ecology niche theory [35,36] and the precipitation and temperature conditions in the MSX region are more suitable for the growth of the three species than that in the SSX region.
In this study, the P. tabulaeformis forest NPP was the largest in both historical and future periods, which may be because P. tabulaeformis is an evergreen conifer with small leaf surface area, and thus has a longer growth period and lower transpiration than the other two species examined in the present study [43]. Thus, increasing the afforestation area of P. tabulaeformis would be beneficial for local forest management. In addition, the magnitude of the NPP trend for R. pseudoacacia is the largest in both historical and future periods. This is attributed to the fact that the R. pseudoacacia has a higher potential for photosynthetic production than the other two species [44,45]. Hence, enhancing the forest management practices in favor of R. pseudoacacia would be beneficial for carbon sequestration. However, in comparison to P. tabulaeformis, R. pseudoacacia consumes more water [46], and thus has lower NPP values than P. tabulaeformis under future drier climatic conditions.
4.3. Uncertainty Analysis
The ecosystem model has multiple uncertainties [47]. Several researches have indicated that high CO2 concentration can increase plant NPP [39]. In the LPJ-GUESS model, higher CO2 level can improve forest productivity via directly increasing carboxylation efficiency and indirectly enhancing water use efficiency [11]. However, not all ecosystems have a positive correlation between CO2 concentration and forest NPP [39]. Shaw et al. (2002) showed that complex interactions between multiple global change drivers may produce an unexpected suppression of NPP under conditions of elevated CO2, and these effects are not captured by the LPJ-GUESS model in its current form [48]. Further, the feedback from plant to climate has not been described in the LPJ-GUESS model. These limitations could either enhance or weaken the influences of climate factors, thereby influencing plant dynamics [49] and potentially affecting the accuracy of simulated values for forest NPP. As a consequence, to overcome above defects, improving the process-based vegetation model is necessary [50].
Although the developer of LPJ-GUESS model declared that the model could be used to predict vegetation dynamics at other sites using original internal parameterization [51], this study further investigated the performance of the model in NPP simulation according to calibrated parameters (i.e., carbon content of each organ and specific leaf area). While the current study made this effort, the simulated NPP in this study may have uncertainty. Specifically, the simulated NPP was slightly greater than the field-based NPP for each species for each natural area. However, the differences between simulated and field-based NPP for each species were statistically nonsignificant. This implied that the NPP simulation using LPJ-GUESS were reliable for this study. Furthermore, the study focused on the NPP comparisons of three species in humid and dry areas. Hence, from this perspective, the conclusions in this study are reasonable. However, to achieve an accurate simulation in the vegetation dynamics, it is necessary to calibrate more model parameters in the local scale, rather than using the recommended parameters.
5. Conclusions
This study investigated the NPP responses of natural and planted forests to historical and future climate conditions in a typical transition region from humid to dry climates using the LPJ-GUESS model. Overall, the future climate in the study area will be drier than the historical climate. Specifically, the precipitation would increase in the dry area and decrease in the humid area. However, the forest NPP in the dry area would be lower than that of the humid area, possibly because future increasing temperature and CO2 concentration could restrain forest growth in dry areas and promote forest growth in humid areas. Thus, an inference could be conducted that future warming climate condition over this study area would lead the forest in the dry area to be a carbon source while enhancing the ability of forest carbon sink in the humid areas. Moreover, compared with the natural forest, the planted forests would have the highest NPP value and trend, which implied that that the planted species may be more adaptable to future climate changes in both dry and humid areas. In addition, these findings emphasized the importance of investigating the forest productivity dynamic in a climate transition region, because the completed inference could be revealed, compared to the investigation in a single climate zone. These results provide novel insights into the potential responses of forest ecosystems to climate change in dry and humid areas, which could help policy makers in planning sustainable forest management under future climate change.
Supplementary Materials
The following are available online at https://www.mdpi.com/2071-1050/11/10/2856/s1, Figure S1: Change in annual mean temperature during historical (1951–2014) and future (2015–2100) periods using 1961–1990 as the base period, Figure S2: Change in annual precipitation during historical (1951–2014) and future (2015–2100) periods using 1961–1990 as the base period, Table S1: Allometric growth equations for three tree species, Table S2: Ecophysiological parameters of the three tree species for running the LPJ-GUESS model.
Author Contributions
Y.D. conducted the modeling, performed the analysis, and drafted the manuscript; S.P. designed the study, interpreted the results, and supervised the research; S.L. contributed ideas during analysis and interpretation, and edited the paper.
Funding
This study was jointly funded by the National Natural Science Foundation of China (No. 41601058), China Postdoctoral Science Foundation (2017M623111), Fundamental Research Funds for the Central Universities (2452017183, GK201803048) and the CAS “Light of West China” Program (XAB2015B07).
Conflicts of Interest
The authors declare no competing financial interests.
References
- IPCC. Climate Change 2013: The Physical Science Basis. Contribution of Working Group I to the Fifth Assessment Report of the Intergovernmental Panel on Climate Change; Stocker, T.F., Qin, D., Plattner, G.-K., Tignor, M., Allen, S.K., Boschung, J., Nauels, A., Xia, Y., Bex, V., Midgley, P.M., Eds.; Cambridge University Press: Cambridge, UK; New York, NY, USA, 2013; p. 1535. [Google Scholar]
- Xu, Z.L.; Zhao, C.Y.; Feng, Z.D.; Zhang, F.; Sher, H.; Wang, C.; Peng, H.H.; Wang, Y.; Zhao, Y.; Wang, Y.; et al. Estimating realized and potential carbon storage benefits from reforestation and afforestation under climate change: A case study of the Qinghai spruce forests in the Qilian Mountains, northwestern China. Mitig. Adapt. Strat. 2013, 18, 1257–1268. [Google Scholar] [CrossRef]
- Grimm, N.B.; Chapin, F.S.; Bierwagen, B.; Gonzalez, P.; Groffman, P.M.; Luo, Y.Q.; Melton, F.; Nadelhoffer, K.J.; Pairis, A.; Raymond, P.A.; et al. The impacts of climate change on ecosystem structure and function. Front. Ecol. Environ. 2013, 11, 474–482. [Google Scholar] [CrossRef] [Green Version]
- Friend, A.D.; Lucht, W.; Rademacher, T.T.; Keribin, R.; Betts, R.; Cadule, P.; Ciais, P.; Clark, D.B.; Dankers, R.; Falloon, P.D.; et al. Carbon residence time dominates uncertainty in terrestrial vegetation responses to future climate and atmospheric CO2. Proc. Natl. Acad. Sci. USA 2014, 111, 3280. [Google Scholar] [CrossRef]
- Heimann, M.; Reichstein, M. Terrestrial ecosystem carbon dynamics and climate feedbacks. Nature 2008, 451, 289–292. [Google Scholar] [CrossRef] [Green Version]
- Miles, L.; Kapos, V. Reducing greenhouse gas emissions from deforestation and forest degradation: Global land-use implications. Science 2008, 320, 1454–1455. [Google Scholar] [CrossRef]
- Li, P.; Peng, C.H.; Wang, M.; Li, W.Z.; Zhao, P.X.; Wang, K.F.; Yang, Y.Z.; Zhu, Q.A. Quantification of the response of global terrestrial net primary production to multifactor global change. Ecol. Indic. 2017, 76, 245–255. [Google Scholar] [CrossRef]
- Pan, Y.; Yu, C.Q.; Zhang, X.Z.; Chen, B.X.; Wu, J.X.; Tu, Y.L.; Miao, Y.J.; Luo, L.M. A modified framework for the regional assessment of climate and human impacts on net primary productivity. Ecol. Indic. 2016, 60, 184–191. [Google Scholar] [CrossRef] [Green Version]
- Wang, H.; Liu, G.H.; Li, Z.S.; Wang, P.T.; Wang, Z.Z. Assessing the driving forces in vegetation dynamics using net primary productivity as the indicator: A case study in Jinghe river basin in the Loess Plateau. Forests 2018, 9, 374. [Google Scholar] [CrossRef]
- Sallaba, F.; Lehsten, D.; Seaquist, J.; Sykes, M.T. A rapid NPP meta-model for current and future climate and CO2 scenarios in Europe. Ecol. Model. 2015, 302, 29–41. [Google Scholar] [CrossRef]
- Deleuze, C.; Houllier, F. Prediction of stem profile of Picea abies using a process-based tree growth model. Tree Physiol. 1995, 15, 113–120. [Google Scholar] [CrossRef]
- Melillo, J.M.; Mcguire, A.D.; Kicklighter, D.W.; Moore, B.; Vorosmarty, C.J.; Schloss, A.L. Global climate change and terrestrial net primary production. Nature 1993, 363, 234–240. [Google Scholar] [CrossRef]
- Thornton, P.E.; Law, B.E.; Gholz, H.L.; Clark, K.L.; Falge, E.; Ellsworth, D.S.; Goldstein, A.H.; Monson, R.K.; Hollinger, D.; Falk, M.; et al. Modeling and measuring the effects of disturbance history and climate on carbon and water budgets in evergreen needleleaf forests. Agric. For. Meteorol. 2002, 113, 185–222. [Google Scholar] [CrossRef]
- Smith, B.; Wårlind, D.; Arneth, A.; Hickler, T.; Leadley, P.; Siltberg, J.; Zaehle, S. Implications of incorporating N cycling and N limitations on primary production in an individual-based dynamic vegetation model. Biogeosciences 2014, 11, 2027–2054. [Google Scholar] [CrossRef] [Green Version]
- Sato, H.; Itoh, A.; Kohyama, T. SEIB–DGVM: A new dynamic global vegetation model using aspatially explicit individual–based approach. Ecol. Model. 2007, 200, 279–307. [Google Scholar] [CrossRef]
- Su, H.X.; Sang, W.G.; Wang, Y.X.; Ma, K.P. Simulating Picea schrenkiana forest productivity under climatic changes and atmospheric CO2 increase in Tianshan Mountains, Xinjiang Autonomous Region, China. For. Ecol. Manag. 2007, 246, 273–284. [Google Scholar] [CrossRef]
- Peng, S.Z.; Chen, Y.M.; Zhao, C.Y.; Xu, Z.L. Simulating the productivity of a subalpine forest at high elevations under representative concentration pathway scenarios in the Qilian Mountains of northwest China. Scand. J. Forest. Res. 2017, 32, 166–173. [Google Scholar] [CrossRef]
- Poulter, B.; Hattermann, F.; Hawkins, E.; Zaehle, S.; Sitch, S.; Restrepo-Coupe, N.; Heyder, U.; Cramer, W. Robust dynamics of Amazon dieback to climate change with perturbed ecosystem model parameters. Glob. Change Biol. 2010, 16, 2476–2495. [Google Scholar] [CrossRef]
- Restrepo-Coupe, N.; Levine, N.M.; Christoffersen, B.O.; Albert, L.P.; Wu, J.; Costa, M.H.; Galbraith, D.; Imbuzeiro, H.; Martins, G.; da Araujo, A.C.; et al. Do dynamic global vegetation models capture the seasonality of carbon fluxes in the Amazon basin? A data-model intercomparison. Glob. Change Biol. 2017, 23, 191–208. [Google Scholar] [CrossRef]
- Feng, X.H.; Uriarte, M.; González, G.; Reed, S.; Thompson, J.; Zimmerman, J.K.; Murphy, L. Improving predictions of tropical forest response to climate change through integration of field studies and ecosystem modeling. Glob. Change Biol. 2017, 24, 1–20. [Google Scholar] [CrossRef]
- Peng, S.Z.; Chen, Y.M.; Cao, Y. Simulating water-use efficiency of Picea crassifolia forest under representative concentration pathway scenarios in the Qilian Mountains of northwest China. Forests 2016, 7, 140. [Google Scholar] [CrossRef]
- Ma, Q.; Liu, K.; Zhang, H. Carbon storage by forest vegetation and its spatial distribution in Shaanxi. Resour. Sci. 2012, 34, 1781–1789. (In Chinese) [Google Scholar]
- Sitch, S.; Smith, B.; Prentice, I.C.; Arneth, A.; Bondeau, A.; Cramer, W.; Kaplan, J.O.; Levis, S.; Lucht, W.; Sykes, M.T.; et al. Evaluation of ecosystem dynamics, plant geography and terrestrial carbon cycling in the LPJ dynamic global vegetation model. Glob. Change Biol. 2003, 9, 161–185. [Google Scholar] [CrossRef]
- Bugmann, H. A review of forest gap models. Clim. Change 2001, 51, 259–305. [Google Scholar] [CrossRef]
- Hickler, T.; Vohland, K.; Feehan, J.; Miller, P.A.; Smith, B.; Costa, L.; Giesecke, T.; Fronzek, S.; Carter, T.R.; Cramer, W.; et al. Projecting the future distribution of European potential natural vegetation zones with a generalized, tree species-based dynamic vegetation mode. Glob. Ecol. Biogeogr. 2012, 21, 50–63. [Google Scholar] [CrossRef]
- Harris, I.; Jones, P.D.; Osborn, T.J.; Lister, D.H. Updated high-resolution grids of monthly climatic observations–the CRU TS3.10 Dataset. Int. J. Climatol. 2014, 34, 623–642. [Google Scholar] [CrossRef]
- Brekke, L.; Wood, A.; Pruitt, T. Data from: Downscaled CMIP3 and CMIP5 Climate and Hydrology Projections: Release of Downscaled CMIP5 Climate Projections, Comparison with Preceding Information, and Summary of User Needs. 2014. Available online: https://gdo-dcp.ucllnl.org/downscaled_cmip_projections/ (accessed on 17 May 2019).
- Peng, S.Z.; Gang, C.C.; Cao, Y.; Chen, Y.M. Assessment of climate change trends over the Loess Plateau in China from 1901 to 2100. Int. J. Climatol. 2018, 38, 2250–2264. [Google Scholar] [CrossRef]
- Wu, T.; Song, L.; Li, W.; Wang, Z.; Zhang, H.; Xin, X.; Zhang, Y.; Zhang, L.; Li, J.; Wu, F.; et al. An overview of BCC climate system model development and application for climate change studies. Acta Meteorol. Sin. 2014, 28, 34–56. [Google Scholar] [CrossRef]
- Peng, S.Z.; Ding, Y.X.; Wen, Z.M.; Chen, Y.M.; Cao, Y.; Ren, J.Y. Spatiotemporal change and trend analysis of potential evapotranspiration over the Loess Plateau of China during 2011–2100. Agric. For. Meteorol. 2017, 233, 183–194. [Google Scholar] [CrossRef]
- Sicard, P.; Mangin, A.; Hebel, P.; Malléab, P. Detection and estimation trends linked to air quality and mortality on French Riviera over the 1990-2005 period. Sci. Total Environ. 2010, 408, 1943–1950. [Google Scholar] [CrossRef]
- Gocic, M.; Trajkovic, S. Analysis of changes in meteorological variables using Mann-Kendall and Sen’s slope estimator statistical tests in Serbia. Glob. Planet. Change 2013, 100, 172–182. [Google Scholar] [CrossRef]
- Atta-ur-Rahman; Dawood, M. Spatio-statistical analysis of temperature fluctuation using Mann–Kendall and Sen’s slope approach. Clim. Dyn. 2017, 48, 783–797. [Google Scholar] [CrossRef]
- Xu, C.H.; Xu, Y. The projection of temperature and precipitation over China under RCP scenarios using a CMIP5 multi-model ensemble. Atmos. Ocean. Sci. Lett. 2012, 5, 527–533. [Google Scholar] [CrossRef]
- Wang, L.; Chen, W. A CMIP5 multimodel projection of future temperature, precipitation, and climatological drought in China. Int. J. Climatol. 2014, 34, 2059–2078. [Google Scholar] [CrossRef]
- Cook, B.I.; Smerdon, J.E.; Seager, R.; Coats, S. Global warming and 21st century drying. Clim. Dyn. 2014, 43, 2607–2627. [Google Scholar] [CrossRef] [Green Version]
- Potter, C.; Klooster, S.; Carvalho, C.R.D.; Genovese, V.B.; Torregrosa, T.; Dungan, J.; Bobo, M.; Coughlan, J. Modeling seasonal and interannual variability in ecosystem carbon cycling for the Brazilian Amazon region. J. Geophys. Res. 2001, 106, 10423–10446. [Google Scholar] [CrossRef] [Green Version]
- Girardin, M.P.; Hogg, E.H.; Bernier, P.Y.; Kurz, W.A.; Guo, X.J.; Cyr, G. Negative impacts of high temperatures on growth of black spruce forests intensify with the anticipated climate warming. Glob. Change Biol. 2016, 22, 627–643. [Google Scholar] [CrossRef]
- Ainsworth, E.A.; Long, S.P. What have we learned from 15 years of free-air CO2 enrichment (FACE)? A meta-analytic review of the responses of photosynthesis, canopy properties and plant production to rising CO2. New Phytol. 2005, 165, 351–372. [Google Scholar] [CrossRef] [PubMed]
- Liu, R.G.; Li, N.; Su, H.X.; Sang, W.G. Simulation and analysis on future carbon balance of three deciduous forests in Beijing mountain area, warm temperate zone of China. Chin. J. Plant Ecol. 2009, 33, 516–534. (In Chinese) [Google Scholar]
- Digrade, A.; Mote, L.; Bachy, A.; Mozaffar, A.; Schoon, N.; Bussoti, F.; Amelynck, C.; Dalcq, A.C.; Fauconnier, M.L.; Aubinet, M.; et al. Decrease in the photosynthetic performance of temperate grassland species does not lead to a decline in the gross primary production of the ecosystem. Front. Plant Sci. 2018, 9, 67. [Google Scholar] [CrossRef]
- Pšidová, E.; Živčák, M.; Stojnić, C.; Orlović, S.; Gömöry, D.; Kučerová, J.; Ditmarová, L.; Střelcová, D.; Brestičb, M.; Kalajie, H.M. Altitude of origin influences the responses of PSII photochemistry to heat waves in European beech (Fagus sylvatica L.). Environ. Exp. Bot. 2018, 152, 97–106. [Google Scholar] [CrossRef]
- Yang, Y.J. Study on Carbon Pool of Typical Forest Ecosystem in Loess Hilly Area of Northern Shaanxi Province. Master’s Thesis, Chinese Academy of Sciences, Beijing, China, 2014. [Google Scholar]
- Li, W.H. Study on Transpirational Water Consumption and Photosynthetic Characteristics of Main Afforestation Species in the Loess Plateau of Northern Shaanxi. Doctor’s Thesis, Beijing Forestry University, Beijing, China, 2007. [Google Scholar]
- Wang, Y.L. Photosynthetic Water Consumption Characteristics and Influencing Factors of Main Tree Species in Two Typical Forests in the Semi-Arid Region of the Loess Plateau. Doctor’s Thesis, Chinese Academy of Sciences, Beijing, China, 2010. [Google Scholar]
- Yang, J.W.; Liang, Z.S. Characteristics of growth and water use of Robinia pseudoacacia under different soil water conditions. Sci. Silvae Sin. 2004, 40, 93–98. [Google Scholar] [CrossRef]
- Dai, E.F.; Wu, Z.; Ge, Q.S.; Xi, W.M.; Wang, X.F. Predicting the responses of forest distribution and aboveground biomass to climate change under RCPs scenarios in southern China. Glob. Change Biol. 2016, 22, 3642–3661. [Google Scholar] [CrossRef] [PubMed]
- Shaw, M.R.; Zavaleta, E.S.; Chiariello, N.R.; Cleland, E.E.; Mooney, H.A.; Field, C.B. Grassland responses to global environmental changes suppressed by elevated CO2. Science 2002, 298, 1987–1990. [Google Scholar] [CrossRef]
- Bonan, G.B. Forests and climate change: Forcings, feedbacks, and the climate benefits of forests. Science 2008, 320, 1444–1449. [Google Scholar] [CrossRef]
- Scheiter, S.; Langan, L.; Higgins, S.I. Next-generation dynamic global vegetation models: Learning from community ecology. New Phytol. 2013, 198, 957–969. [Google Scholar] [CrossRef] [PubMed]
- Hickler, T.; Smith, B.; Sykes, M.T.; Davis, M.B.; Sugita, S.; Walker, K. Using a generalized vegetation model to simulate vegetation dynamics in Northeastern USA. Ecology 2004, 85, 519–530. [Google Scholar] [CrossRef]
Figure 1.
Spatial distribution of the sampling plots.

Figure 2.
Comparison of field-based and simulated net primary productivity (NPP) values. NSX, MSX, and SSX are the northern, middle, and southern regions of Shaanxi province, respectively.
Figure 2.
Comparison of field-based and simulated net primary productivity (NPP) values. NSX, MSX, and SSX are the northern, middle, and southern regions of Shaanxi province, respectively.

Figure 3.
Changes in Q. wutaishanica forest NPP during historical (1951–2014) and future (2015–2100) periods using 1961–1990 as the base period. NSX, MSX, and SSX are the northern, middle, and southern regions of Shaanxi province, respectively.
Figure 3.
Changes in Q. wutaishanica forest NPP during historical (1951–2014) and future (2015–2100) periods using 1961–1990 as the base period. NSX, MSX, and SSX are the northern, middle, and southern regions of Shaanxi province, respectively.

Figure 4.
Changes in P. tabulaeformis forest NPP during historical (1951–2014) and future (2015–2100) periods using 1961–1990 as the base period. NSX, MSX, and SSX are the northern, middle, and southern regions of Shaanxi province, respectively.
Figure 4.
Changes in P. tabulaeformis forest NPP during historical (1951–2014) and future (2015–2100) periods using 1961–1990 as the base period. NSX, MSX, and SSX are the northern, middle, and southern regions of Shaanxi province, respectively.

Figure 5.
Changes in R. pseudoacacia forest NPP during historical (1951–2014) and future (2015–2100) periods using 1961–1990 as the base period. NSX, MSX, and SSX are the northern, middle, and southern regions of Shaanxi province, respectively.
Figure 5.
Changes in R. pseudoacacia forest NPP during historical (1951–2014) and future (2015–2100) periods using 1961–1990 as the base period. NSX, MSX, and SSX are the northern, middle, and southern regions of Shaanxi province, respectively.

Table 1.
General characteristics of the studied species (Q. wutaishanica, P. tabulaeformis, and R. pseudoacacia) at three sampling sites in the province of Shaanxi, China.
Table 1.
General characteristics of the studied species (Q. wutaishanica, P. tabulaeformis, and R. pseudoacacia) at three sampling sites in the province of Shaanxi, China.
| Sites | Species | Number of Plots | Tree Density (Trees ha−1) | DBH (cm) | Height (m) | P (mm) | T (°C) |
|---|---|---|---|---|---|---|---|
| NSX | QW | 12 | 746 (150–900) | 10.8 ± 0.3 | 7.6 ± 0.2 | 549.9 ± 15.4 | 9.0 ± 0.1 |
| PT | 5 | 2239 (1280–3570) | 10.4 ± 0.1 | 7.8 ± 0.1 | |||
| RP | 5 | 855 (166–1917) | 11.5 ± 0.4 | 9.5 ± 0.2 | |||
| MSX | QW | 8 | 776 (233–1550) | 11.5 ± 0.4 | 9.8 ± 0.2 | 732.0 ± 19.9 | 9.6 ± 0.1 |
| PT | 6 | 1940 (380–4370) | 11.0 ± 0.1 | 9.6 ± 0.1 | |||
| RP | 7 | 1163 (550–1860) | 11.2 ± 0.2 | 9.6 ± 0.1 | |||
| SSX | QW | 10 | 975 (300–2333) | 12.1 ± 0.3 | 10.4 ± 0.2 | 853.2 ± 21.6 | 12.4 ± 0.1 |
| PT | 5 | 1628 (783–2830) | 11.5 ± 0.2 | 10.0 ± 0.1 | |||
| RP | 4 | 1050 (617–1300) | 8.6 ± 0.2 | 10.1 ± 0.1 |
Note: NSX, MSX, and SSX are the northern, middle, and southern regions of Shaanxi province, respectively. QW, PT, and RP are Q. wutaishanica, P. tabulaeformis, and R. pseudoacacia, respectively. P and T are the mean annual precipitation and temperature over the time period 1961–2000, respectively. DBH is the tree diameter at breast height. DBH, Height, P, and T are all presented as mean ± S.E.
Table 2.
Average, anomaly, and trend of temperature (°C, °C, °C decade−1) and precipitation (mm, %, mm decade−1). (* p < 0.05, ** p < 0.01).
Table 2.
Average, anomaly, and trend of temperature (°C, °C, °C decade−1) and precipitation (mm, %, mm decade−1). (* p < 0.05, ** p < 0.01).
| Sites | 1951–2014 | 2015–2100 | |||||||
|---|---|---|---|---|---|---|---|---|---|
| RCP2.6 | RCP4.5 | RCP8.5 | |||||||
| T | P | T | P | T | P | T | P | ||
| NSX | Av | 9.2 ± 0.1 | 547.4 ± 11.7 | 10.7 ± 0.1 | 562.1 ± 11.6 | 11.2 ± 0.1 | 569.6 ± 13.2 | 12.2 ± 0.2 | 612.6 ± 14 |
| An | 0.4 | −2.5 | 1.9 | 0.2 | 2.4 | 1.5 | 3.4 | 9.2 | |
| trend | 0.3 ** | −8.1 | 0.1 ** | −1.2 | 0.2 ** | 5.5 | 0.5 ** | 6.6 | |
| MSX | Av | 9.8 ± 0.1 | 738.4 ± 15.4 | 11.2 ± 0.1 | 721.3 ± 13.5 | 11.7±0.1 | 731.5 ± 15.2 | 12.9 ± 0.2 | 744.8 ± 16.5 |
| An | 0.4 | −0.9 | 1.8 | −3.2 | 2.2 | −1.8 | 3.4 | 0.0 | |
| trend | 0.2 ** | −4.2 | 0.1 ** | −0.2 | 0.2 ** | 15.2 * | 0.5 ** | 7.7 | |
| SSX | Av | 12.5 ± 0.1 | 852.8 ± 16.2 | 13.9 ± 0.1 | 823.3 ± 15.4 | 14.4 ± 0.1 | 835.6 ± 16.3 | 15.7 ± 0.2 | 830.0 ± 17.9 |
| An | 0.3 | −1.8 | 1.7 | −5.2 | 2.1 | −3.8 | 3.5 | −4.4 | |
| trend | 0.2 ** | 0.5 | 0.1 ** | −1.0 | 0.2 ** | 18.8 ** | 0.6 ** | 6.9 | |
Note: NSX, MSX, and SSX are the northern, middle, and southern regions of Shaanxi province, respectively. T and P are the annual mean temperature and precipitation, respectively. Av and An indicate averaged and anomaly values of the climate variables, respectively.
Table 3.
Average (g C m−2 yr−1) and anomaly of forest NPP during 1951–2100.
| Site | Species | 1951–2014 | 2015–2100 | ||||||
|---|---|---|---|---|---|---|---|---|---|
| RCP2.6 | RCP4.5 | RCP8.5 | |||||||
| Av | An | Av | An | Av | An | Av | An | ||
| NSX | QW | 357.2 | 0.8% | 249.9 | −29.5% | 273.1 | −23.0% | 337.0 | −4.9% |
| PT | 402.1 | −2.2% | 289.8 | −29.5% | 334.8 | −18.5% | 464.0 | 12.9% | |
| RP | 281.7 | −4.1% | 128.8 | −56.2% | 227.8 | −22.5% | 319.0 | 8.6% | |
| MSX | QW | 445.9 | 0.6% | 536.4 | 19.5% | 586.7 | 30.7% | 668.5 | 49.0% |
| PT | 465.9 | 0.7% | 551.7 | 19.3% | 583.0 | 26.0% | 659.1 | 42.5% | |
| RP | 369.5 | 5.2% | 425.8 | 21.3% | 450.1 | 28.2% | 536.5 | 52.8% | |
| SSX | QW | 384.5 | −3.1% | 448.7 | 13.0% | 491.8 | 23.9% | 460.4 | 16.0% |
| PT | 452.6 | −0.4% | 507.5 | 11.6% | 573.4 | 26.1% | 598.1 | 31.6% | |
| RP | 316.5 | 4.0% | 472.2 | 55.2% | 454.4 | 49.3% | 495.6 | 62.9% | |
Note: NSX, MSX, and SSX are the northern, middle, and southern regions of Shaanxi province, respectively. QW, PT, and RP are Q. wutaishanica, P. tabulaeformis, and R. pseudoacacia, respectively. Av and An indicate the averaged and anomaly values of NPP, respectively.
Table 4.
Trends in forest NPP (g C m−2 decade−1) during historical (1951–2014) and future (2015–2100) periods (* p < 0.05).
Table 4.
Trends in forest NPP (g C m−2 decade−1) during historical (1951–2014) and future (2015–2100) periods (* p < 0.05).
| Site | Species | 1951–2014 | 2015–2100 | ||
|---|---|---|---|---|---|
| RCP2.6 | RCP4.5 | RCP8.5 | |||
| NSX | QW | 23.8 * | −38.4 * | −20.7 * | −8.8 * |
| PT | 25.9 * | −40.6 * | −20.5 * | 15.3 * | |
| RP | 0.7 | −24.1 * | −4.3 | 28.0 * | |
| MSX | QW | 17.7 * | −7.8 * | 20.9 * | 32.6 * |
| PT | 23.8 * | −6.1 | 14.7 * | 26.5 * | |
| RP | 26.2 * | 15.1 * | 26.3 * | 46.0 * | |
| SSX | QW | 6.4 * | −10.2 * | 17.2 * | 6.7 |
| PT | 15.6 * | −3.7 | 28.4 * | 29.8 * | |
| RP | 17.9 * | 7.4 | 33.5 * | 23.9 * | |
Note: NSX, MSX, and SSX are the northern, middle, and southern regions of Shaanxi province, respectively. QW, PT, and RP are Q. wutaishanica, P. tabulaeformis, and R. pseudoacacia, respectively.
© 2019 by the authors. Licensee MDPI, Basel, Switzerland. This article is an open access article distributed under the terms and conditions of the Creative Commons Attribution (CC BY) license (http://creativecommons.org/licenses/by/4.0/).
Share and Cite
MDPI and ACS Style
Ding, Y.; Liang, S.; Peng, S. Climate Change Affects Forest Productivity in a Typical Climate Transition Region of China. Sustainability 2019, 11, 2856. https://doi.org/10.3390/su11102856
AMA Style
Ding Y, Liang S, Peng S. Climate Change Affects Forest Productivity in a Typical Climate Transition Region of China. Sustainability. 2019; 11(10):2856. https://doi.org/10.3390/su11102856
Chicago/Turabian StyleDing, Yongxia, Siqi Liang, and Shouzhang Peng. 2019. "Climate Change Affects Forest Productivity in a Typical Climate Transition Region of China" Sustainability 11, no. 10: 2856. https://doi.org/10.3390/su11102856
Note that from the first issue of 2016, this journal uses article numbers instead of page numbers. See further details here.