Article

Strengthen Financial Holding Companies’ Business Sustainability by Using a Hybrid Corporate Governance Evaluation Model

1
Graduate Institute of Management, National Taiwan University of Science and Technology, Taipei 10607, Taiwan
2
Department of Banking & Finance, Chinese Culture University, Taipei 11114, Taiwan
3
Graduate Institute of Finance, National Taiwan University of Science and Technology, Taipei 10607, Taiwan
4
Graduate Institute of Urban Planning, National Taipei University, New Taipei City 23741, Taiwan
*
Author to whom correspondence should be addressed.
Sustainability 2019, 11(3), 582; https://doi.org/10.3390/su11030582
Submission received: 11 December 2018 / Revised: 7 January 2019 / Accepted: 14 January 2019 / Published: 22 January 2019
(This article belongs to the Special Issue Sustainable Business and Development II)

Abstract

:
While the importance of corporate governance has been broadly acknowledged in global financial markets and academic research, how to devise a practical evaluation system is relatively unexplored. This paper attempts to refine the Corporate Governance Evaluation System (CGES), constructed by the Taiwan Stock Exchange (TWSE) since 2014. The current CGES has several debatable issues in its complicated design (e.g., it comprises over 80 indicators in different types). To resolve those issues, this study invited ten senior domain experts (including several CEOs of financial holding companies) to retrieve 13 essential criteria from the CGES in four dimensions. Additionally, this study integrates several multiple criteria decision-making (MCDM) methods (i.e., decision-making trial and evaluation laboratory (DEMATEL), modified VIKOR, DEMATEL-based analytical network process (DANP)) and the fuzzy evaluation technique to rank the exemplary companies. The final ranking is consistent with the one released from the CGES in 2017. This study conducted additional experiments to ensure the robustness of the findings. The newly devised model not only assists the ranking decisions but also supports a company in discussing the plausible action plans to strengthen corporate governance based on the analytics. These findings enrich the understanding of corporate governance and contribute to gaining business sustainability for financial holding companies.

1. Introduction

The first extensive survey of corporate governance might be the one conducted by Shleifer and Vishny in 1997 [1]. They stated that: “Corporate governance deals with the ways in which suppliers of finance to corporations assure themselves of getting a return on their investment.” [1]. Academic research regarding this issue has surged significantly over the past several decades. Corporate governance received special attention during the financial crisis in emerging markets since 1998 [2]. Afterwards, a series of business scandals in the US and the EU took place in the early 21st century, which rendered corporate governance to become the focus of public attention again. The recent financial crisis (2008–2009) further enforced regulators, in the major financial markets, to renovate and devise new guidelines to strengthen corporate governance in multiple aspects; its impact on the global financial systems is apparent.
Before further discussions, we would like to define the concept of “long-term business sustainability” here. We hold a similar view as Dyllick and Hockerts [3]; they have defined corporate sustainability at the business level. We have transformed their definition and redefined the concept of long-term business sustainability as “meeting the current needs of a company’s stakeholders (e.g., investors, employees, clients, and supervisory authority) without compromising its ability to meet the needs of future stakeholders, in the long-term”.
In this perspective, it could regard corporate governance as the degree of how much a company weighs its stakeholders’ needs at the top managerial level. Because of the importance of corporate governance to long-term business sustainability, several research topics related to this subject have emerged. Examples are equal treatment of shareholders [4] and the role of stakeholders [5]. If a competent company cares about corporate governance, the management team should maintain sustainable developments in the business aspect for their clients, employees, and investors. Also, it should earn reasonable profits to share with its shareholders fairly. The long-term business sustainability of the financial industry (such as the banking and life insurance companies) are crucial to the stability of a nation’s economy. Therefore, the present study adopts the financial holding companies as an exemplary case.
The Taiwan Stock Exchange (TWSE) was aware of its crucial role and established a Corporate Governance Evaluation System (CGES) since 2014 [6], to facilitate the understanding and objective evaluations of the listed companies regarding corporate governance. The key purposes of CGES are twofold: (1) support the listed companies to identify their shortcomings and conduct the associated improvements and (2) increase outside investors’ confidence. To be more specific, the evaluation system’s objectives are to forming the culture of pursuing superior corporate governance among management teams and board members, guiding the sustainable business developments of companies, complying with international standards, and thus improving the Taiwan stock market’s overall efficiency and reputation.
The CGES of Taiwan has attained remarkable results since its debut in 2014. The listed companies refer to various indicators of the CGES to undertake required actions, and the overall awareness of corporate governance—from board members to management teams—has increased significantly ever since. For example, in the dimension of protecting shareholders’ rights and interests, the listed companies that chose the case-by-case vote approach has grown 44% in the past three years (i.e., from 2015 to 2017). The companies that adopted the candidate nomination mechanism to elect all directors and supervisors also increased to 67% until 2017.
In the dimension of enhancing board composition and operation, the proportion of listed companies that have set up audit committees to comply with the TWSE’s regulations has reached 45%. Additionally, the companies that have compiled corporate social responsibility (CSR) reports have also grown year by year, and the number of CSR reports issued has reached 439 in 2017 [6]. All the aforementioned outcomes suggest that most of the listed companies have shown their willingness and made tangible efforts to pursue corporate governance. The CGES has paved a solid ground for the listed companies to move ahead.
The framework of the CGES referred six principles of corporate governance released by the Organization for Economic Co-operation and Development (OECD) in 2004 [7]. The TWSE’s current evaluation framework comprises four major dimensions: (1) Protecting shareholder rights and interests and treating shareholders equitably, (2) Enhancing board composition and operation, (3) Increasing information transparency, and (4) Putting CSR into practice. The included number of indicators (or termed as criteria in this study) reached up to 85 in the four dimensions. The TWSE assigned a different weighting for each dimension, and the total weights sum up to 100% from the four dimensions. It is a hierarchical framework that considers multiple aspects is in line with commonly observed multiple criteria decision-making (MCDM) problems; thus, the present study attempts to explore the rationality and fairness of its design of (i.e., the CGES) from the MCDM perspective.
Although the 85 indicators seem to cover a wide spectrum of measures, the system’s design is complicated and inconsistent in its hierarchical design. The TWSE defined five types of indicators, namely A, B, AA, A+, and the EXTRA ones (see Table 1). Type A applies for all the listed companies where Type B only applies to certain industries. Most of the indicators (i.e., Types A and B) are to be gauged and assigned as either “yes (1)” or “no (0)”, a binary approach to determine a company’s performance outcome on a single indicator. If an indicator can meet the requirement, the system will assign one point for it; zero otherwise.
However, for some other indicators (i.e., Types AA and A+), the scoring mechanism is different. If additional requirements are satisfied, not only one credit will be awarded for the AA or A+ indicator within its dimension, but also another credit will be added to the company’s overall evaluation. The EXTRA Type has two indicators, which can contribute or penalize indefinite scores (e.g., +3 or −5) directly to a company’s final evaluation result. The two EXTRA indicators would cause heterogeneous impacts to a company’s overall evaluation, which is not included in the four dimensions. Its evaluation system seems to be an inadequate design from the perspective of MCDM modeling. The detail numbers of the TWSE’s 2017 corporate governance evaluation dimensions and weightings, the number of indicators and the associated types of indicators of each dimension, are reported in Table 1.
As mentioned earlier, the CGES exhibits the mission to lead those public listed companies to pursue superior corporate governance, which intends to encourage those front runners and exhort those who are lagging. Therefore, its scoring mechanism should be scrutinized to ensure this goal. The framework of the current CGES (the 2017 version), as shown in Table 1, has at least four issues that deserve a second thought:
(1)
The weighting of each dimension seems to have a direct tie with the number of indicators, which might contort the relative importance of each dimension (e.g., in the first dimension, the number of indicators is 17, and 17 / 85 = 20 % reflects its weighting);
(2)
The “yes (1)” or “no (0)” approach to judge the performance of a company on an indicator would be difficult for experts to express their opinions that consider the different degree or level of satisfaction;
(3)
The additional credit brought by a Type AA or A+ indicator to the final score (i.e., not just within a dimension) might distort the actual performance of a company compared with the other ones;
(4)
The two EXTRA indicators that do not belong to the four dimensions are lack of a clear guidance to assign objective scores, and the extra plus indicator might even cause the aggregated score to overpass 100%.
In addition, the CGES model adopts the additive type aggregation approach, which presumes the independence among the dimensions; this seems to be unlikely. For example, the 3rd dimension (increasing information transparency) should have relation with the first dimension (protecting shareholder rights and interests and treating shareholders equitably). As a result, an evaluation system that can model the interdependence or mutual influence relationship among the dimensions would be more realistic in practice.
Therefore, this study attempts to propose a hybrid approach, based on the modeling concept of MCDM, to resolve the issues mentioned above. In the first step, we attempt to distill from the existing 87 (i.e., 85 + 2 EXTRA) indicators, to identify the key factors to forming a concise corporate governance evaluation model. This step may simplify the CGES, which will be helpful to support decision makers (DMs) focusing on manageable numbers of indicators (criteria). According to the renowned theory—bounded rationality—proposed by the Nobel Laureate Herbert A. Simon [8], DMs would encounter obstacles to make rational judgments while overwhelmed by too many factors. With the help of experienced domain experts on corporate governance, the present study adopts the Delphi method [9] to eliminate the unnecessary or redundant indicators in each dimension.
In the next step, the decision-making trial and evaluation laboratory (DEMATEL) is adopted to decompose the influential relations among the dimensions; the assumption or limitation of the independence among the dimensions can thus be removed. The DEMATEL technique was proposed to model complex social problems [10], which presumes that every factor or criterion in a system has more or less influence on the others. The DEMATEL technique also has the capability to analyze the directional influence between dimensions (or criteria), which is often applied to identify the root cause of an under-performed criterion to plan for plausible actions. This technique has been widely applied in many fields, ranging from social science [11] to engineering [12], to pursue sustainability in various applications [13].
In the third step, based on the distilled criteria from the 87 indicators from the first step, we propose a hybrid MCDM approach to explore the relative influence of each criterion, and the consensus of the aggregated influence of each criterion within a dimension, from the knowledge of domain experts, can be reached. This step intends to overcome the previously mentioned issue of how to determine the weighting of each dimension, which should not be solely depended on the number of indicators of a dimension. The hybrid approach applies the DEMATEL technique and the concept of the renowned analytic network process (ANP) [14], to identify the influential weight of each indicator, termed as DANP [15]. Additionally, the modified VIKOR [16,17] is integrated with the DANP influential weight of each indicator/criterion, to form a novel corporate governance evaluation system. Unlike the conventional simple additive weighting (SAW) aggregation, the modified VIKOR has the advantage of underlining the highest weighted performance gap of a company. The identified gap can be cross-referenced with the cause-effect influences from the DEMATEL analytics, which can support planning actions.
In the present study, considering the critical role of financial holding companies to the stability of economy, five Taiwanese financial holding companies are to be examined by the proposed approach. During the evaluation phase, the study applies the fuzzy measurement technique, which enables experts to denote their linguistic opinions, which is more intuitive. By doing so, we may avoid the problematic “Yes (1)” or “No (0)” scoring approach applied by the CGES; instead, the degree of satisfaction can be expressed.
This study obtained the following outcomes by applying the proposed hybrid model to a group of five financial holding companies in Taiwan: (1) Simplify the complicated and debated CGES model to 13 critical indicators in four dimensions; (2) Explore the interrelations among the included criteria by devising a hybrid MCDM model based on domain experts’ knowledge and their professional judgments; (3) Evaluate the performance of corporate governance of five financial holding companies, and if the ranking outcome (in different experiments ) is consistent with the report of CGES in 2017; (4) Support financial holding companies to pursue business sustainability by identifying their weakness priority on corporate governance with an exemplary case and discussions.
The remainder of the study is organized as follows: In Section 2, this study reviews the major related studies of corporate governance. In addition, certain MCDM methodologies applied in this model are briefly introduced. Section 3 proposes a hybrid MCDM to model and evaluate corporate governance. Section 4 provides an empirical example, ranking three financial holding companies in Taiwan and comparing the result with the one from the CGES. Section 5 discusses the interrelationships among the assessed dimensions and criteria of the obtained evaluation. Section 6 provides management implications, research limitations, and the plausible future research direction.

2. Literature Review

This section discusses the major research topics related to corporate governance (Section 2.1) and its impacts to the financial and banking industries (Section 2.2). Additionally, the limitations of commonly adopted research methods (i.e., statistics) regarding corporate governance are briefly explained in Section 2.3, which leads to the reasons or why the concept of MCDM methodology should be more suitable to devise a system compared with the statistical approach.

2.1. Mainstream Research Topics of Corporate Governance Covered in The CGES

Because of the serious repercussions caused by corporate scandals and failures, such as those from the Enron and Worldcom [18], most countries with an open economy have become wary of corporate governance ever since. The potential consequences of impotent corporate governance, especially in the banking and financial sector, would even cause financial crises, by impeding the sustainability of vulnerable companies during a drastic market downturn. The mainstream research on the corporate governance can be roughly categorized in the following topics: (1) ownership structure, (2) board of directors, (3) CEO compensation, (4) managerial style, (5) agency problem, (6) enterprise risk management, (7) accounting and auditing, (8) company performance, and (9) CSR.
Herein, we limit the topics that relate to the four dimensions of the CGES. First, the agency problem is a well-known management issue, which partially explains the importance of corporate governance to a company’s shareholders and potential investors [19]. Previous studies have focused on how executive compensation plans can help mitigate agency problems for listed companies. For instance, in an early attempt conducted by Core and Guay [20], they suggested that firms may use annual grants of options and restricted stock to CEOs as an alternative to mitigate the agency problem. In practice, how to align the interests of the management team and their shareholders is one of the challenging tasks of corporate governance [21]. Well-defined dividend policy and the compensation to board members based on a company’s financial performance might lead companies to treat their shareholders fairly and equitably.
Second, in relation to board composition and operation, Klein [22] believes that the separation of the roles of CEO and board chairman can enhance effective monitoring of management practices. Chiou et al. [23] suggested a negative correlation between the proportion of collateralized shares and the company’s operating performance. If directors and supervisors use stocks as collateral to get funding for personal usage, while their stock prices fall, the companies will suffer from declining corporate value and rising business risk. Research done by Musteen et al. [24] also showed that board characteristics significantly influence the business community’s assessment of corporate reputation. The potential impact caused by different compositions of the board seems to be highly influential on corporate governance, as suggested by the previous research.
Third, regarding information transparency, accounting and auditing are essential for companies to communicate with their stakeholders [25]. However, creditable auditing is not always available. A previous study mentioned that the Big Four accounting firms often provide unqualified auditing opinions on the financial statements of those problematic financial companies [26]. It is worth noting that improving a company’s accounting and auditing system is the main mechanism to strengthen its corporate governance. Bushman and Smith [27] claimed unveiling consistent and reliable financial accounting information can improve the effectiveness of corporate governance and reduce the likelihood of a company getting into insolvency. Superior disclosure systems can increase the transparency of a company; in this regard, its costs of capital can be further reduced.
Fourth, the topic of performance is probably the most widely discussed consequence of good or bad corporate governance [28]. Previous studies found that corporate governance has a strong correlation with stock returns. Companies with stronger (superior) corporate governance earn higher company value, higher sales growth rates, higher profit margins, lower capital expenditures, and fewer chances to be acquired [29]. On the other hand, Giroud and Mueller [30] found that weak governance firms have lower equity returns, worse operating performance, and lower firm value in non-competitive industries. Until recently, the relationship between corporate performance and CSR has also been the subject of increasing interests. For instance, Hong et al. [31] claimed that corporate governance could be treated as managerial incentives for executive compensations to reduce the agency problem; they also suggested that CSR activities are beneficial for shareholders. Investors are inclined to support those companies with a high awareness of CSR, which implies the effectiveness of increasing company value or enhancing corporate performance by devoting CSR actions [32]. To conclude, most of the research on different continents corroborated the positive influence of corporate governance or CSR on improving performance [33].
To summarize, the above-discussed topics are relate to the four dimensions of the CGES directly or indirectly; some research topics could be associated with even more than one aspect. Table 2 illustrates the corresponding topics in each CGES dimension. In other words, the CGES has taken the major influential topics of corporate governance in its design.

2.2. Impacts of Corporate Governance on Financial Institutions

Though corporate governance applies to all kinds of businesses, financial institutions have been under increasing pressure, from investors to regulators, to scrutinize and improve their corporate governance in the long run, owing to their high impacts to the stability of a nation’s economy [34]. Due to the relevance of financial institutions in the economic system and the nature of the business of financial institutions, the issues involved in corporate governance of financial institutions are complicated, as is the mechanism for dealing with such issues.
The complexity of a financial institution’s business increases the asymmetry of information and undermines the ability of stakeholders to monitor a financial institution managers’ decisions effectively. Besides, financial institutions are usually highly leveraged companies, a significant portion of their assets often comes from customer deposits and insurance premiums. Consequently, financial institutions are subject to stricter regulations than other companies, owing to the fact that they are responsible for protecting depositors and investors, ensuring the stability of payment and trading systems, and reducing the systemic risk of financial markets [35].
Financial institutions with inadequate management and supervision not only hurt their own values but also have various negative influences on the markets during financial crises [36]. Therefore, regulators should pay special attention to monitoring the adoption and compliance of corporate governance of those financial and banking companies [37].
Although the CGES was introduced in Taiwan in 2014, its effectiveness and capability to supervise and guide those listed financial companies are still debatable, owing to its complicated and somewhat inconsistent design (we refer the reader to those issues underscored below Table 1). A well-devised and comprehensible evaluation system that can reveal the status of corporate governance of financial institutions is critical to increasing the financial market’s confidence, which is also the reason why we chose this industry as the main theme to illustrate the proposed approach.

2.3. MCDM Methods Adopted in This Corporate Governance Evaluation Model

There are two types of research methodologies commonly adopted when examining corporate governance. On one hand, research methods used in the previous works that explored various issues of corporate governance (Table 2) are mainly based on statistics. On the other hand, while devising a corporate governance evaluation model (system), their frameworks are usually hierarchical, such as the one from the OECD and the CGES of the TWSE.
The conventional statistical models are constrained by certain unrealistic assumptions. For instance, the most commonly used regression model is based on the assumption that all the considered variables (factors) are independent, which seems to be unrealistic. The present study belongs to the second type which attempts to improve the design of CGES, by proposing a hybrid MCDM model.
The existing CGES, as discussed in Section 1, has a two-layer structure with four dimensions and 87 indicators, which is close to the typical framework of MCDM research. Only a few studies (e.g., the one by Hu et al. [38]) have adopted the MCDM approach to analyzing the evaluation of corporate governance during financial crises. Until so far, we have found no academic research that focuses on refining an existing official corporate governance model designed by the authority, which would be the unique contribution of this study.
In this work, there are several adopted research methods, and each of them plays a different role. First, the Delphi method, introduced by the Rand Company [9], is applied to refine the CGES by soliciting domain experts’ opinions to eliminate unnecessary or redundant indicators. This method plays the role of refining the indicators of the CGES, and the process might require several rounds of anonymous voting to reach the consensus.
Second, the decision-making and trial evaluation laboratory (DEMATEL) technique has the capability to analyze cause-effect influence among the dimensions of a system, which was proposed to model complicated social problems. The DEMATEL technique was developed by the Battelle Memorial Institute at Geneva for the Science and Human Affairs Program in the early 1970s, which received surging interest from researchers in the past decade [10]. This technology helps decision makers explore the interrelationships among the dimensions or criteria, which also helps identify the directional influences of an MCDM model [39,40,41].
Third, inspired by the concept of the ANP method, the DEMATEL technique can be transformed into a weighting system, which was proposed by Prof. Tzeng’s research team, termed as the DEMATEL-based ANP (DANP) [15]. The DANP method requires experts’ opinions to calculate the influential weight of each criterion, and the details will be explained in Section 3.
Fourth, after forming a corporate governance evaluation model by the DANP method, the influential weight of each criterion needs to be aggregated to obtain the final performance score. Additionally, during the evaluation phase before the final aggregation, the performance of each financial holding company on each criterion will be graded by experts using the fuzzy technique [42], which is more intuitive and closer to how human beings make judgments.
Though there are several common aggregation methods, this study adopts the modified VIKOR, which has the advantage of ranking and selecting among a set of alternatives in the presence of conflict criteria [16]. The modified-VIKOR was adopted to replace the best performance of the alternatives on each criterion from the original VIKOR, in order to derive a compromised outcome.
Integration of the DANP and the modified VIKOR not only supports the ranking of alternatives but also highlights the priority of performance gaps of alternatives [43]. The details will be illustrated in Section 4 with explanations and discussions. The proposed hybrid model can be regarded as a managerial tool for board members to focus on the company’s underperformed weakness.

3. Combined VIKOR-DANP Decision Model for Corporate Governance Evaluation

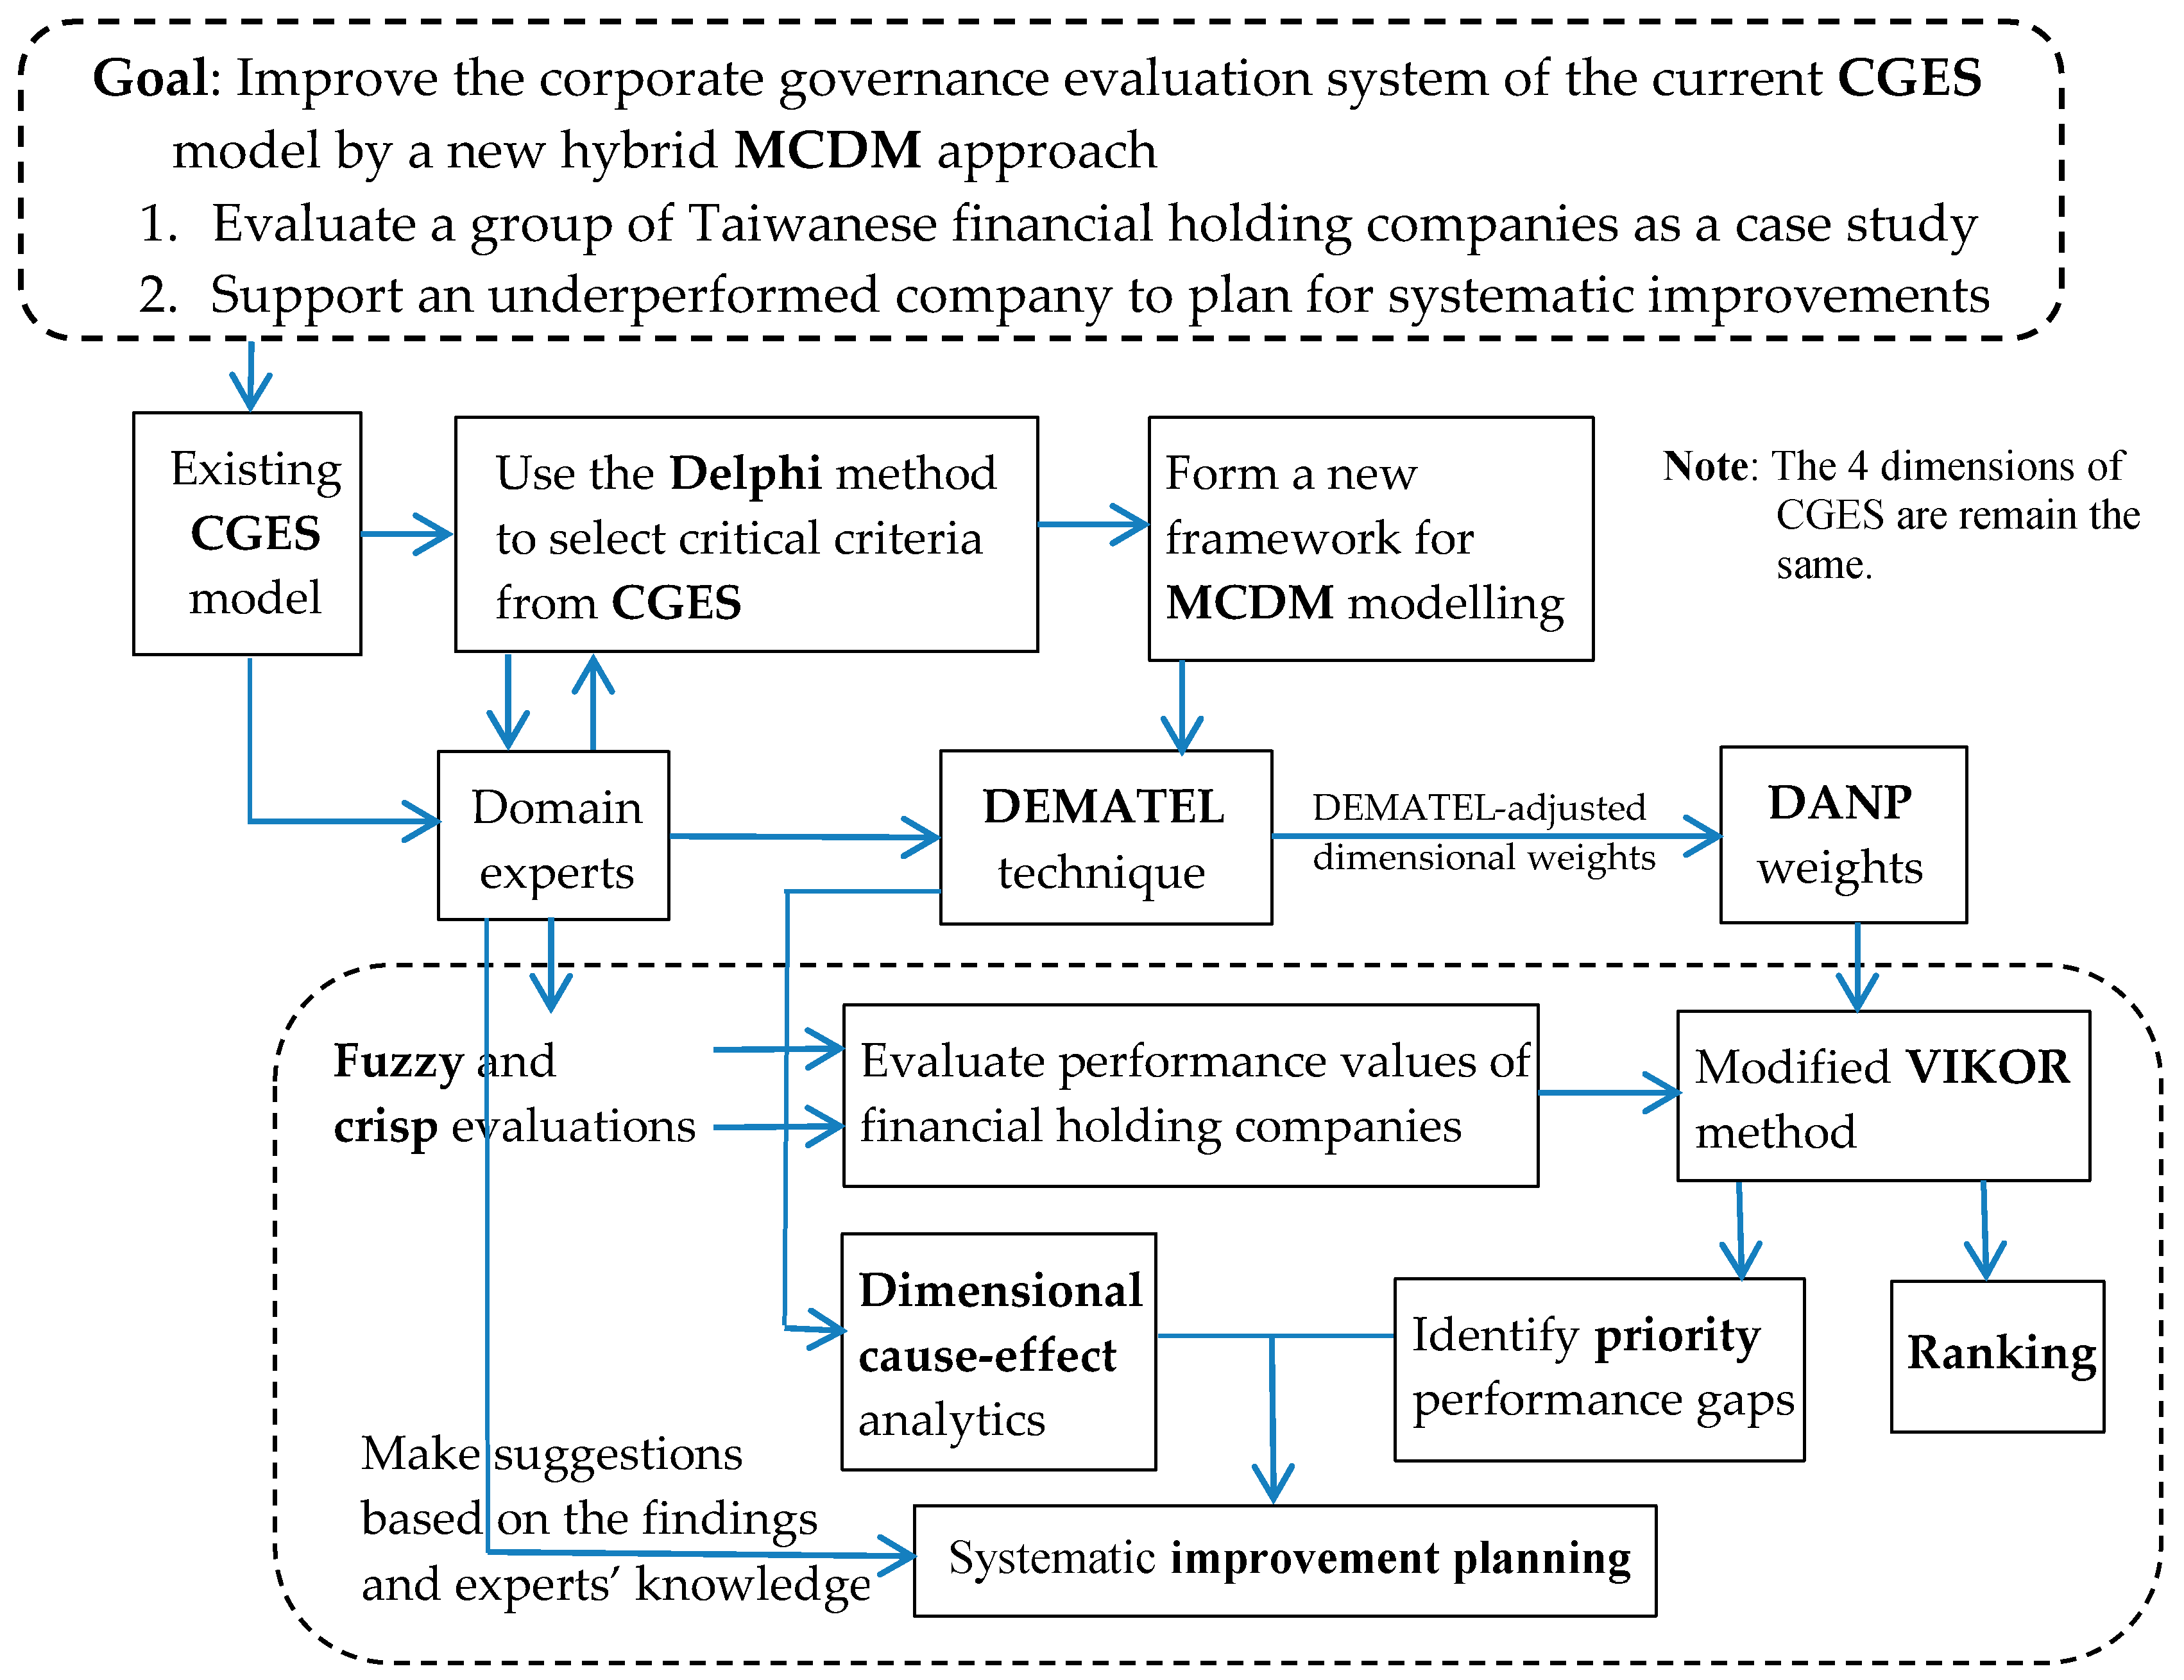
This section introduces the conceptual framework and proposes a hybrid approach to evaluate the performance of the corporate governance of companies, including the DEMATEL technique, the DANP, and the modified VIKOR methods. Additionally, the fuzzy set technique, proposed by Zadeh [42] is adopted to transform domain experts’ verbal expressions for modeling the impreciseness of their opinions. To construct a hybrid evaluation model for assessing corporate governance comprises four phases as follows in Figure 1.
In the first phase, as a typical MCDM problem, we have to identify the most relevant dimensions and the associated criteria for forming the framework of an evaluation model. In the present study, we attempt to leverage the existing CGES (devised by the TWSE) and redefine the critical criteria related to each dimension (refer to Table 1 and Table 2) by the Delphi method. The involved procedures will be further explained in Section 4, and the invited experts all have over 30 years’ experience in this domain.
In the next phase, the obtained criteria from the first stage are analyzed to explore the degree of influence of each dimension (criterion) on the other dimensions (criteria). These obtained criteria are applied to form a DEMATEL questionnaire to soliciting domain experts’ opinions. The obtained and averaged opinions from domain experts, forming an initial average matrix A (refer to Equation (1)), is used to conduct a cause-effect analysis. The outcome of the DEMATEL analytics can be further processed to derive the weight of each criterion by the DANP method. In this phase, the influential weight of each dimension and criteria of the new corporate governance evaluation model can be determined. The mathematical formulae, from the DEMATEL to the DANP, are explained in Section 3.2.
The third phase involves two steps: (1) Evaluate sample companies’ performance on each criterion and (2) Aggregate the final score of each company by using the modified VIKOR method. The first step requires experts to define their verbal (semantic) expressions in the form of the fuzzy triangular membership function, one of the most widely applied fuzzy membership functions. The second step integrates the DANP influential weights with the evaluated companies’ performance scores from the first step, to determine the final ranking result.
The fourth phase puts emphasis on pursuing business sustainability, by identifying the weighted performance gaps of a company on corporate governance. Since a company has only limited resources to pursue improvements, the identified performance gaps from the third step can be combined with the analytics from the DEMATEL technique, to devise plausible action plans.
The hybrid approach can calculate the weighted performance gaps to the aspiration levels using the modified VIKOR method, also termed as the “aspired-worst” approach, as benchmarks. The four phrases are explained in the following Section 3.1, Section 3.2, Section 3.3 and Section 3.4 respectively. The conceptual research flows are shown in Figure 1, and an exemplary case with three financial holding companies in Taiwan are analyzed and illustrated for the proposed hybrid MCDM model.

3.1. Delphi Method

The Delphi method was proposed by the Rand company in the early 1960s, to resolve the issue of different opinions from a group of experts, to reach a consensus anonymously [44]. Though there are various approaches to conduct the Delphi method, the study adopts the threshold-based approach, by setting a consensus threshold to select the relatively important factors (indicators) from the existing evaluation system of the CGES. In this study, those two EXTRA indicators will not be included.
In the beginning, each expert will be requested to fill in the importance of all the 85 indicators (exclude the two EXTRA ones, refer Table 1), ranging from 0 (Insignificant) to 10 (Very Important). By setting a threshold, the indicators that are above the threshold (after averaging the scores provided from all the experts) will be reserved for the next round. Since we merely intend to identify the candidates (indicators or criteria) in the first round, the indicators with diverse opinions will not be further investigated.
Similarly, in the second round, each expert provides their opinions about the importance of those selected indicators from the first round. Since the second round involves fewer indicators, if any arguable indicator exists (i.e., with diverse opinions regarding its importance from experts) will be reviewed by requesting the minority to express their reasoning that supports his or her opinion. Then, the minority’s explanations will be provided to other experts to collect their opinions again. In this study, we presume to reserve 12~15 criteria for constructing an MCDM model in the next stage. The details will be provided in Section 4.

3.2. DEMATEL Technique and DEMATEL-Based ANP (DANP) Method

The DEMATEL technique presumes that each criterion has influence to the other criteria of a system (or model), which is commonly observed in a social problem. The required computational steps are as follows [15].
Step 1: Form an intial influence matrix A
The initial influence matrix A can be obtained by asking experts questions such as: “What is the direct influence of criterion i on criterion j?” The influencial scale ranges from 4 (very high influence) to 0 ( no influence), and the averaged influence of criterion i on criterion j can be denoted as a i j . The other elements in A can be obtained follow the same logic (for i , j = 1 , , n in A), and the averaged influence adopts the arithmetic mean of all experts’ feedbacks, shown in Equation (1):
A = [ a 11 a 1 j a 1 n a i 1 a i j a i n a n 1 a n j a n n ] n × n
Matrix A indicates the extent of how each criterion affects the other criteria and the degree of total influences received from the other criteria.
Step 2: Normalize A to form the matrix D
The normalized initial direct influence-relation matrix D is transformed from the initial average matrix A. By referring Equation (2) and Equation (3), matrix D is obtained by multiplying η with A, and all diagonal elements in A are equal to zero.
D = η A
η = min { 1 max i j = 1 n a i j , 1 max j j = 1 n a i j } , i , j { 1 , 2 , , n }
To calculate the total influence-relation matrix T is similar to the concept of Markov Chain, which can be derived by summing up the matrices with increasing power of D, as shown in Equation (4).
T = D + D 2 + + D ϖ = D ( I D ψ ) ( I D ) 1
T n × n = D × ( I D ) 1 = [ t i j ] n × n ,   when   ψ ,   D ψ [ 0 ] n × n
While ψ increases to infinity, D ψ will be very close to a null matrix with n × n elements, and matrix T can be obtained by referring Equation (5).
Equations (6) and (7) are used to obtain each row sum and column sum in the total influence-relation matrix T, respectively. Here, the superscript denotes the transpose of a vector. Since in the matrix T is a square matrix, the total number of elements in each vector equals to n. Therefore, the two column vectors in Equations (6) and (7) can be used to calculate r C + c C and r C c C , where r C c C (for i , j = 1 , , n ) may divide the involved criteria into two groups: the cause and the effect groups. If r i C c i C > 0 , then criterion i belong to the cause group; otherwise (e.g., r j C c j C < 0 ), criterion j the effect group (i.e., receives a net influence from the other criteria).
r C = [ j = 1 n t i j ] n × 1 = ( r 1 C , , r i C , , r n C )
c C = [ i = 1 n t i j ] 1 × n = ( c 1 C , , c j C , , c n C )
Step 4: Transform the DEMATEL analytics into a DANP weighting system
Suppose that there are p dimensions and n criteria of a total influence-relation matrix T; in this step, matrix T can be shown as T C D to indicate the associated elements within each dimension in Equation (8).
Sustainability 11 00582 i001
In matrix T C D , each T c D i j denotes a sub-dimensional matrix of T C D that associates with dimensions i and j. By averaging all the elements in each T c D i j ( 1 < i , j n ), matrix T C D can be simplified to become a dimentional influence matrix T D , referring Equation (9). Take t 11 D for instance, which is the averaged result of all the elements of T c D 11 in T C D . As a result, r D = [ j d = 1 p t i d j d D ] p × 1 and d D = [ i d = 1 p t i d j d D ] 1 × p for i d , j d = 1 , , p and p < n , which form two dimensional vectors (similar to Equations (6) and (7)).
T D = [ t 11 D t 1 p D t p 1 D t p p D ] p × p
The dimentional influence matrix T D needs to be further normalized. Again, take the first row of T D for example, all of the first row’s elements in T D should be divided by k = 1 p t 1 k D . Therefore, the normalized dimentional influence matrix T N D can be shown in Equation (10). Since p denotes the number of dimensions, it should be smaller than the total number of criteria.
T N D = [ t 11 D / k = 1 p t 1 k D t 1 p D / k = 1 p t 1 k D t p 1 D / k = 1 p t p k D t p p D / k = 1 p t p k D ] p × p
The transposition of T C D is regarded as an unweighted super-matrix W (i.e., W = ( T C D ) ). Then, the DANP method adopts the normalized dimentional influence matrix T N D to multiply with the unweighted super-matrix W and forms the initial DEMATEL-adjusted initial super-matrix W i n i D E M (i.e., W i n i D E M = T N D × W ). The influential weight of each criterion, by using the DANP method, can be obtained by multipling W i n i D E M with itself multiple times until the the super-matrix becomes stable. After making normalization of the derived stable super-matrix, the sum of the influential weights of all the criteria should equal to one.

3.3. Modified VIKOR Method for Aggregating Performance Scores

While facing multiple criteria, it is usually difficult to compare the overall performance and make a ranking for a group of alternatives (e.g., 10 alternations) precisely. For instance, alternative k might outperform all the others on criterion i; however, it usually performs inferiorly on some other criteria. There are several approaches in conventional MCDM methods that may deal with this ranking problem.
One of the mainstream approaches is to measure the performance gaps that each alternative has on every criterion, and to aggregate the overall performance gaps for all the alternatives. Conventional methods, such as the technique for order preference by similarity to ideal solution (TOPSIS) proposed by Hwang and Yoon [45], sets an ideal point and the worst point for each criterion to measure the shortest distance to the ideal point and the longest distance toward the worst one. Therefore, by defining a goal in the form of a performance gap function, the best alternative can be selected by identifying the best one with the shortest overall performance gap. The obtained result is also termed as the compromised solution.
Nevertheless, those conventional methods have two potential problems: (1) they do not consider the relative importance of each criterion and (2) the ideal point of each criterion is assigned by using the best performed value from a group of given alternatives. The second issue sometimes may even cause unwanted ranking reversal [46]. The two mentioned issues can both be resolved by the modified VIKOR method [16]. In the modified VIKOR method, the suggestion is to set an aspired point to replace the ideal point in those conventional approaches, which may avoid the results being constrained by a group of poorly performing alternatives.
The concept of the modified VIKOR method, begins with a predefined Lp-metric to serve as an aggregate function by the compromise programming method [16,17]. Suppose there are q alternatives, denoted as A1,…, Ak, …, Az. For alternative k, its performance on the jth criterion is denoted as p k j , and the relative influential weight of criterion j (i.e., w j ) is obtained from the DANP method (j = 1, 2, …, n, and n is the number of the involved criteria of a problem). The Lp-metric indicates the aggregated performance gap of alternative k on all criteria, is shown in Equation (11):
L k = { j = 1 n [ w j ( | p j p k j | ) / ( p j p j ) ] q } 1 q ,   for   1 q <   and   j = 1 , , n .
In Equation (11), the aspired and the worst performance values on the jth criterion are denoted as p j and p j , respectively. To leverage the advantage of the modified VIKOR mentioned earlier, the aspired and the worst performance values on each criterion are set to be 10 and 0 (i.e., 0 p k j 10 for alternative k on the jth criterion and j = 1 , , n ) in this study. Therefore, after aggregation, even the best alternative can measure its performance gap to the aspired value (i.e., p j = 10 in here).
Before moving forward, there is one thing that needs to be noticed here; the fuzzy performance evaluation [13,15,39,47,48] will be adopted and compared with the crisp evaluation in the next Section. Since the fuzzy linguistic expression is closer to how experts making judgments, the present study adopts a 3-scale linguistic interval (i.e., Bad, Mid, and Good) for the invited experts by using the fuzzy triangular membership function, ranging from 0 to 10.
According to the modified VIKOR method, the following three indices— S k , R k , and Q k for alternative k—should be derived based on different settings of a parameter v. The indices S k and R k can be obtained by setting q = 1 (i.e., S k = L k q = 1 = j = 1 n [ w j ( | p j p k j | ) / ( p j p j ) ] ) and q (i.e., R k = L k q = max j { w j ( | p j p k j | ) / ( p j p j ) | j = 1 , 2 , , n } ) for alternative k.
The indices S k and R k have specific managerial meanings, suggested by a highly cited study [16]; in which, S k stands for the weighted group utility and R k the individual regret on a specific criterion. The different combinations of S k and R k can be applied to forming a compromise ranking index Q k , based on the choice of a decision maker for alternative k, is shown in Equation (12).
Q k = v × ( S k S b e s t ) ( S w o r s t S b e s t ) + ( 1 v ) × ( R k R b e s t ) ( R w o r s t R b e s t )
By setting p j to the aspired level (i.e., p j = 10 ) and p j to the worst value (i.e., p j = 0 ), then S b e s t = R b e s t = 0 and S w o r s t = R w o r s t = 1 . Therefore, Equation (12) can be simplified and rewritten as: Q k = v × S k + ( 1 v ) × R k .

3.4. The Advantages and Weaknesses of the Combined DEMATEL-Based ANP and Modified VIKOR

The proposed hybrid MCDM model comprises DEMATEL, DANP, and the modified VIKOR methods, which have the following advantages:
(1)
The DEMATEL technique relaxes the assumption of independence among the dimensions, which can further identify the cause-effect relationship among dimensions;
(2)
The integration of the influential weights (from the DANP method) with the modified VIKOR method can select and rank alternatives based on putting different emphases on the weighted group utility and the individual regret, to identify the biggest weighted performance gap on a specific dimension or criterion;
(3)
Once a company adopts this approach to determine its weakness priority on corporate governance, it can identify the source dimension/criterion that may influence the underperformed criterion. Therefore, the board members may discuss the plausible action plans to strengthen its corporate governance.
Despite the advantages brought by this hybrid approach, it also has two weaknesses or limitations. First, it is unlikely for a DM with insufficient knowledge/experience to indicate the degree of influence of one criterion on another criterion regarding corporate governance. Therefore, this approach requires senior experts that are familiar with board operations and have managerial experience in operating or supervising businesses. Second, how to set an adequate v (refer to Equation (12)) is not intuitive; also, the ranking result might change under different settings. Researchers or DMs would need to conduct multiple experiments to ensure the consistency of the obtained findings. A short example will be illustrated in the next Section.

4. Empirical Case for Evaluating Financial Holding Companies in Taiwan

In this section, an empirical study that applied the hybrid MCDM model is reported, and the evaluations and analyses of three financial holding companies in Taiwan are discussed.

4.1. Framework and the Latest Developments of Corporate Governance Evaluation System (CGES)

The framework of the CGES, devised by the TWSE, is based on the corporate governance principles published by the OECD in 2004 [7]. The TWSE further combined "Protecting Shareholder Rights and Interests" and "Treating Shareholders Equitably" into one dimension and made minor adjustments in 2017. The latest version of the CGES comprises four dimensions and 87 indicators (refer to Table 1). According to the TWSE, this framework also adapts the most recent global developments and research trends related to corporate governance while devising the measuring indicators in each dimension.
Since the debut of the CGES, the top 20% performed companies in Taiwan’s stock market were announced and honored in 2015. Later on, in 2016, the second corporate governance evaluation report revealed half of the listed companies in the TWSE. The latest report was conducted in 2017, which categorize nearly all the listed companies in seven layers: (1) the top 5% (43 companies), (2) the 6% to 20% (126 companies), (3) the 21% to 35%% (126 companies), (4) the 36% to 50% (127 companies), (5) the 51% to 65% (126 companies), (6) the 66% to 80% (126 companies), and (7) the remaining 20% (169 companies). Within each layer, the detailed ranking was not openly announced to the public. In addition, owing to some specific concerns (e.g., newly listed companies), 56 listed companies were not included in the latest report.

4.2. Data Description

As mentioned in Section 1, this study attempts to refine the current version of the CGES model by a hybrid MCDM approach. Since the financial holding companies play a crucial role in supporting the stability and healthy growth of Taiwan’s economy, the present study chose five public listed ones as an exemplary case to show the hybrid approach. The five financial holding companies’ basic information are reported in Table 3.
The financial holding companies are usually convoluted in their shareholder structures, which demand competent domain experts to decipher their publicly released information. Therefore, this study invited ten experts, all having served in the banking or the financial field for over 30 years, to contribute their assessments (knowledge) for the hybrid model and bring their opinions during the evaluation stage (Table 4). To cover different perspectives, some invited experts were from academia and the government. However, it is worthwhile to mention that all the professors had served as a CEO in the financial industry. Table 3. Basic information of the three selected financial holding companies in 2017.
One thing needs to be explained is that not every expert attended all the phases in the subsequent analyzes. For instance, 10 experts took part the two rounds of the Delphi selection of criteria, but only nine experts joined the subsequent DEMATEL investigation. This was due to the availability of those experts, and the final performance evaluation of each company only involved five experts from the pool (this was also because of conflicts of interest).

4.3. Select Critical Criteria by the Delphi Method

By referring to Figure 1, the exemplary case began by inviting the ten domain experts to select fewer than half of the initial 85 indicators from the four dimensions of the CGES (exclude the two EXTRA ones) in the first round, based on the Delphi method. Next, this study set a threshold that intended to reserve fewer than 15 criteria by requesting the ten experts to rate the indicators got from the first round, the rating value for each indicator ranging from 10 (very critical) to 0 (insignificant).
After averaging the opinions from the ten experts, 13 criteria that earned the highest averaged values (with no dissident) were identified. The total numbers of indicators in each dimension reserved in each round of screening are reported in Table 5, and the description of each criterion in Table 6.
Since the TWSE devised the CGES indicators for examining “Yes” or “No,” this study kept the original definition from the CGES but changed in the description slightly for each criterion in Table 6. Therefore, experts were able to express their judgments (e.g., performance degree in the form of crisp or fuzzy evaluations) in the following stages.

4.4. Forming a Hybrid Model by the DEMATEL Technique and the DANP Method

In the next step, this study adopted the 13 criteria (see Table 6) to design a DEMATEL questionnaire for the 10 experts. The questionnaire features questions like “what is the direct influence that Ci has on Cj?” The degree of influence ranges from 0 (no influence) to 4 (very high influence), and the averaged figures formed a i j (for i , j = 1 , , 13 ) in an initial influence matrix A, reported in Table 7.
Referring Equation (2) to Equation (7), the calculations can transform A into the total influence T (in Appendix A). we may derive the DEMATEL cause-effect analytic for each criterion. Therefore, two vectors (i.e., r C and c C ) can divide all the criteria into a cause group and an effect group. By aggregating the criteria’s influences within a dimension (e.g., C1, C2, and C3, belong to D1), the cause-effect analytic among the four dimensions can be identified (Table 8). As a result, we can obtain an influential relationship map (INRM), which indicates the influential relations among the four dimensions. The illustration can be found in Figure 2.
The dimensional INRM (Figure 2) indicates the directional influences among the four dimensions. Furthermore, this study referred Equation (8) to Equation (10) to transform the total influence T into a normalized dimensional influence matrix T N D (Table 9). The initial DEMATEL-adjusted super-matrix ( W i n i D E M = T N D × W ) is reported in Table A4. By applying the DANP method, after multipling W i n i D E M with itself multiple times until the the super-matrix becomes stable, the DANP influential weight for each criterion can be obtained.

4.5. Integrating DANP Influential Weights and Modified-VIKOR for Performance Ranking

As mentioned in Section 4.2, this study chose five financial holding companies: (1) Cathay financial holding company (A, code: 2882); (2) CTBC financial holding company (B, code: 2891); (3) Sinopac financial holding company (C, code: 2890); (4) E.SUN financial holding company (D, code: 2884); (5) Shin Kong financial holding company (E, code: 2888). The present study asked five experts (from the pool reported in Table 3, based on their availability) to evaluate the corporate governance performance of the five companies.
To make a comparison, the study requested the five experts to express their opinions in two forms: (1) the crisp (from 0 to 10; 0 the worst and 10 the best) and (2) the fuzzy ones (in the semantic form: Bad (B), Middle (M), and Good (G)). The fuzzy parameters of the five experts, by adopting the fuzzy triangular membership function, are in Table 10.
Herein, we need to provide an explanation regarding how the experts made their judgments for each company. At first, we scrutinized the relevant information associated with the 13 criteria of the five companies in their 2017 annual reports and the TWSE’s official website. Next, we organized a table to highlight the associated figures and statements from the disclosed information for each company on the 13 criteria in 2017. Then, the experts referred to those figures and descriptions to give their opinions as both the crisp and fuzzy evaluations (refer to Appendix B), for each company on each criterion.
After averaging the five experts’ opinions on all the criteria of the five financial holding companies, this study adopted the centroid method to defuzzify the performance value on each criterion for each company. Additionally, the crisp performance evaluations on the five companies were averaged on each criterion; the averaged crisp and the fuzzy evaluation outcomes, for the five companies, are shown in Table 11 and Table 12 respectively.
Besides, to test the robustness of the hybrid DANP-VIKOR model, different values of v (refer to Equation (12)) were assigned and compared in Table 12. One thing that should be noted is that if v was set as one, the meaning should be the same as using the SAW (simple additive weighting) method. In Table 12, by adopting different values of v, the fuzzy evaluations for the five companies reveal the same final ranking (i.e., D A E B C ).
Though both the crisp and fuzzy evaluations indicate the same ranking result, the meanings of the aggregated final values are disparate. The crisp evaluation and the DANP influential weights revealed the aggregated performance score, the higher the better. On the contrary, the fuzzy evaluation and the modified VIKOR method reported the aggregated performance gap of each company, the smaller the better.

5. Result and Discussions

In this study, the modified VIKOR method adopted 10 as the aspired value and zero the worst one. Thus, take the performance of Company A on C1 for example, the raw score is 8.83, and the weighted performance gap is 8.73 % × ( 10 8.83 ) / ( 10 0 ) = 1.02 % . The index R k shows the highest weighted performance gap of Company k. Take Company B for instance, we can find that its highest weighted gap is on C13 (6.90%). Those findings are useful for supporting a diligent company that attempts to improve its overall corporate governance performance by identifying a weakness priority. Even gigantic financial holding companies are constraint by limited resources; an improvement priority list may set a series of goals with a priority for a company to pursue.
Aside from the aforementioned robust test (i.e., not only used by the crisp and fuzzy evaluation approach but also assigned different values of v to examine the ranking by the modified VIKOR method), we also compared our findings with the latest report from the CGES. In 2017, the CGES reported that Company A belongs to the top category, Company B the third one, Company C at the bottom one (the seventh category), Company D also the top one, and Company E the second one; it is fully consistent with our findings (i.e., D A E B C ); moreover, Company D surpassed Company A, which revealed more details to investors. This consistency implies the validity of the proposed hybrid approach. The original 87 indicators were refined to be the 13 essential criteria, and it also unraveled the relative influence of each dimension and criterion by a scientific and reasonable approach (compared with the CGES evaluation model). This hybrid MCDM model can be regarded as a transparent managerial system, which improves multiple aspects of the existing CGES model.
In Section 4, this study examined the five financial holding companies’ openly disclosure information on corporate governance, and several robust tests support the validity and consistency of the obtained ranking outcome. The ranking outcome are mainly appealing to external (or potential) investors and supervisors. Once a company that attempts to strengthen its corporate governance to solicit investors’ interests and increases shareholders’ confidence, the proposed hybrid approach could also support board members to plan the plausible actions.
For instance, Company B (CTBC financial holding company) was ranked beneath Company A (Cathay financial holding company) in 2017, and its top two weighted performance gaps were C12 (5.91%) and C13 (6.90%), all belong to D4. Company B should focus on strengthening its performance on D4 (i.e., Putting CSR into practice). However, if Company B ignores the source factor (dimension) that influence 
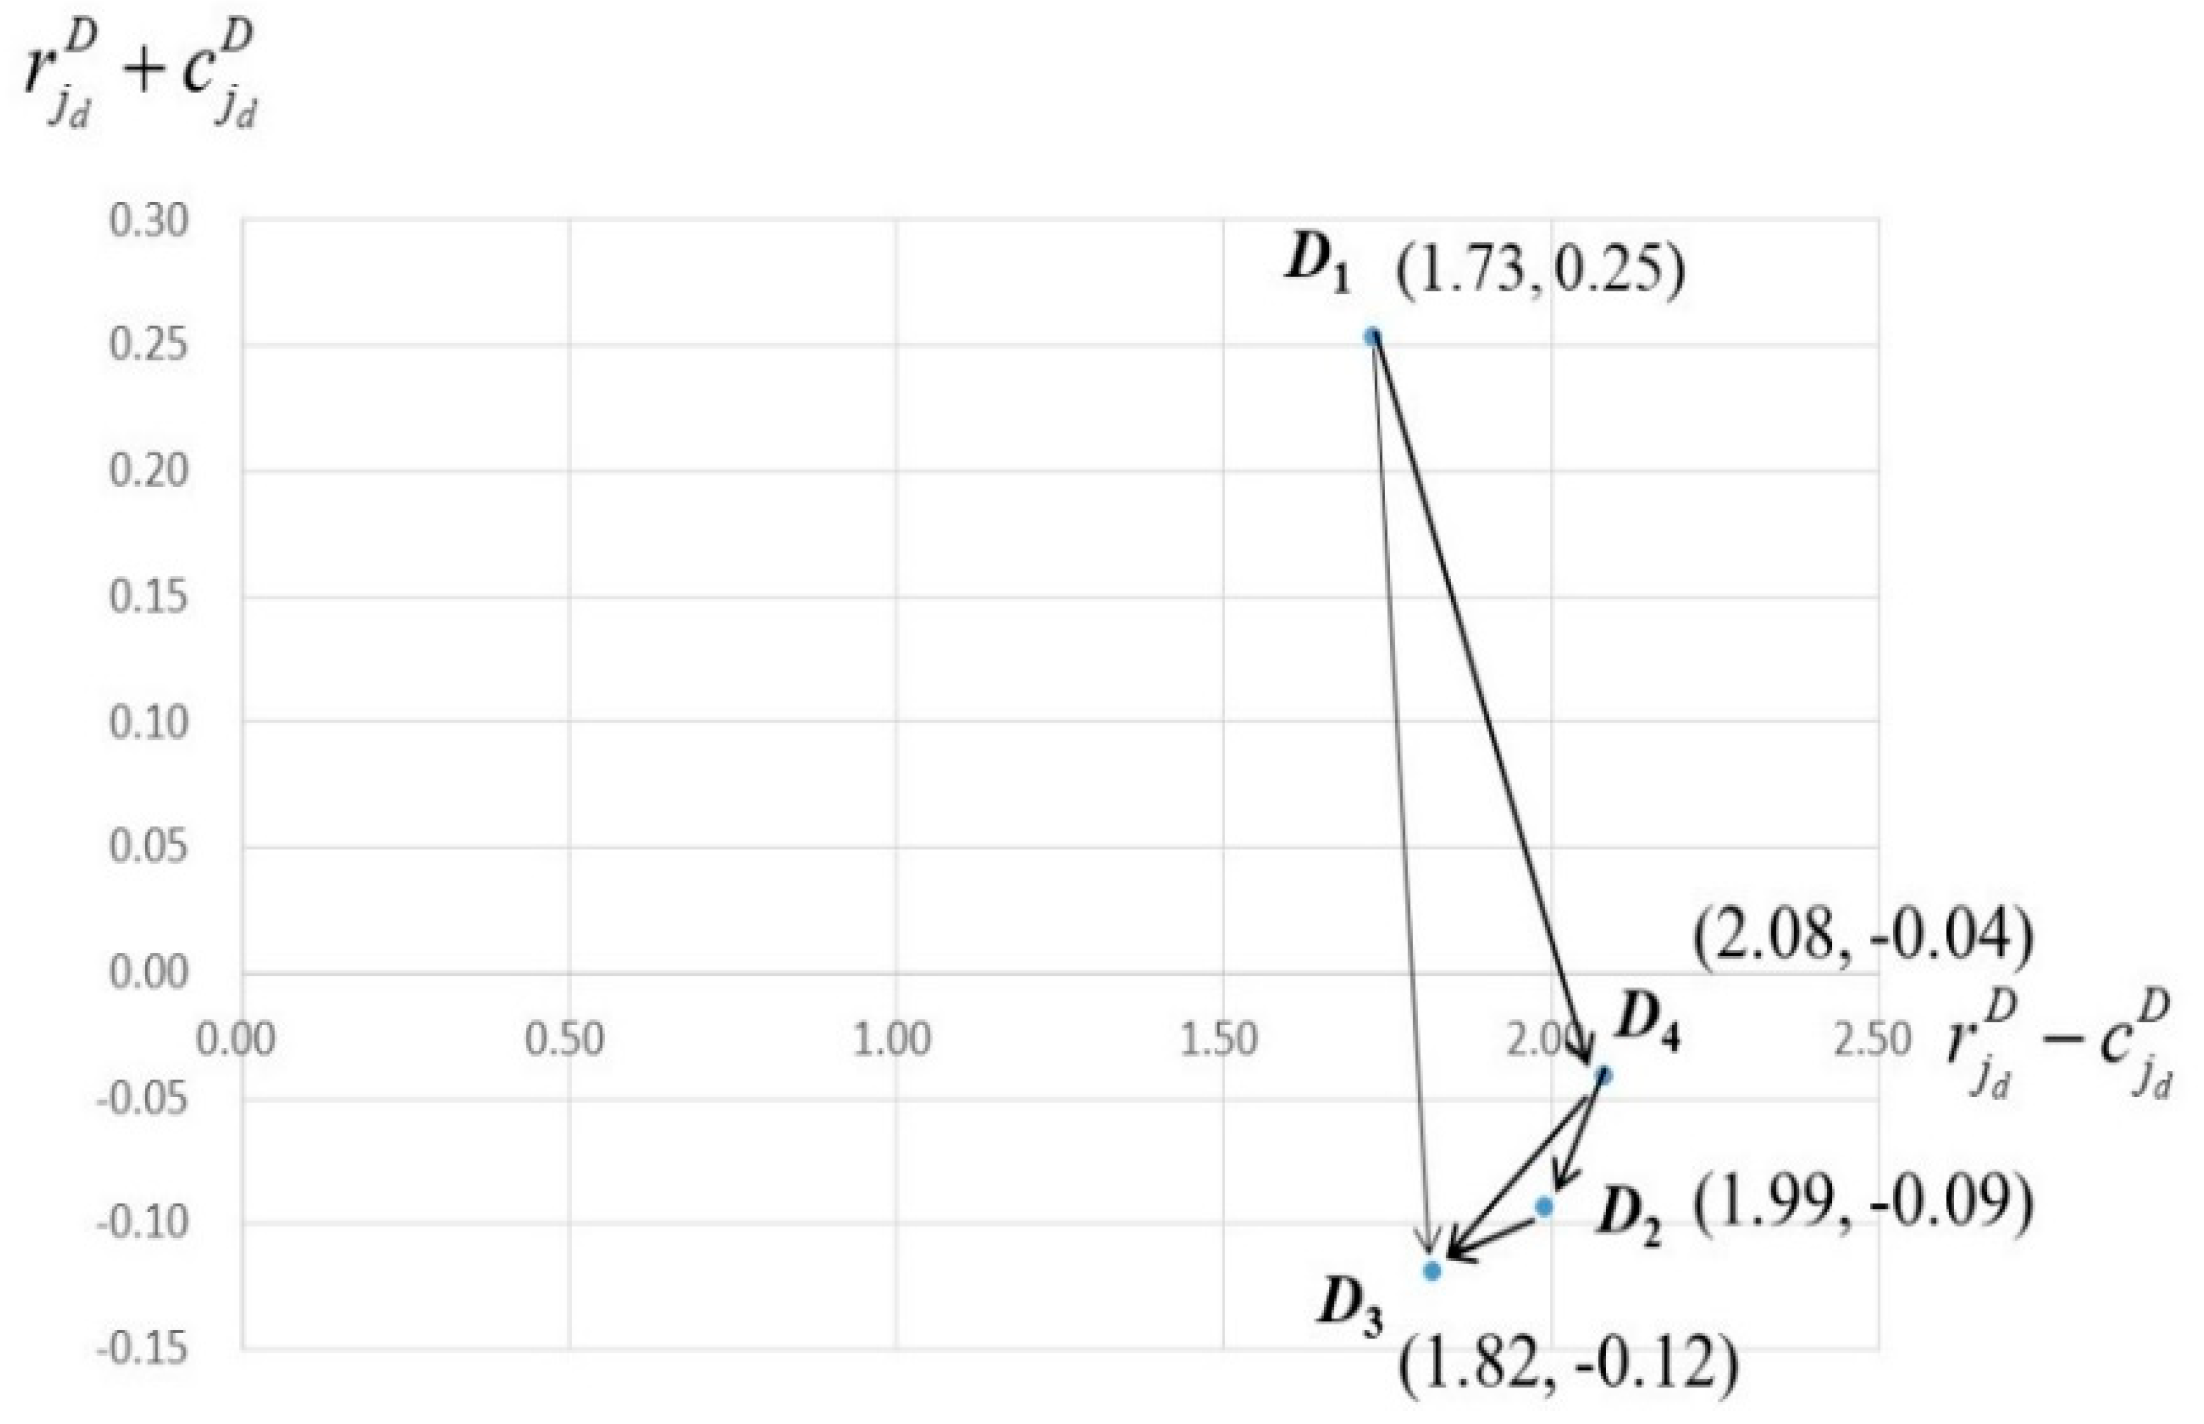
D4, it might solve its temporary problem rather than devise a long-term improvement plan. According to the analytics from the DEMATEL and Figure 2 (i.e., the dimensional INRM), D1 (Protecting shareholder rights and interests and treating shareholders equitably) should be the source that influences D4. Therefore, not only the symptoms of its weakness have been identified, the board members can also decipher the root causes that lead to its inferior performance. At the top managerial level, such as among a group of board members, they should suggest a company to use its limited resources on taking the most effective actions. The combination of the DEMATEL analytics and the modified VIKOR method pave a road to reach this goal.
To enrich the practical insights of this illustrated case, the present study conducted additional interviews with several domain experts (from the same pool, refer to Table 4) regarding how to enhance Company B based on the obtained findings. The experts suggested that CTBC should reduce its proportion of directors and supervisors’ compensation to net profit, which falls in the category of D1. The issued cash dividends of Company B were $1.08 (NT) per share in 2017. Under this circumstance, it is suggested to reduce its proportion of directors and supervisors’ compensation to net profit, form 0.95% (in 2017) to between 0.3% and 0.1%, to be closer to some other financial holding companies that announced more than NT $1.08 dividends per share in 2017. Additionally, abusive self-dealing should be prohibited. That is to say, CTBC should reduce its average share pledge ratio of its directors, supervisors, and substantial shareholders significantly (e.g., from 37.64% to less than 10%), not to affect the rights and interests of the company’s shareholders.
From the aspect of C12 (the degree which the company discloses on its website or in its annual report the identities, issues of concern to, channels of communication with, and means for responding to, stakeholders it has identified) in D4, CTBC’s official website already has a “ Center for Stakeholders ”. However, it merely plays a passive role to release important information. To enhance its effectiveness, the experts suggested CTBC to assign a dedicated team (or department) to communicate with stakeholders proactively. Constructive advice or sound (reasonable and influential) questions from stakeholders deserve more attention and direct responses. The board members and the management team of CTBC should have the right to access those questions or suggestions timely. It may even set up a “President’s Contact Window” or an “Internal Communication Network” to encourage the first line staffs to relay customers’ feedbacks to its core management team. Additionally, in C13 (the degree to which the company adopts and disclose on its website a whistleblower system for company insiders and outsiders to report illegal behavior (including corruption) and unethical behavior), the experts suggested CTBC set up a whistleblower system to handling plausible illegal and unethical conducts related to the company. A third party or independent department might be more persuasive to investigate those reported cases. If this mechanism could be implemented stringently, it will not only benefit the company but also fulfill its CSR to the whole of society.

6. Concluding Remarks and Future Research Direction

To conclude, this study reached four significant contributio: (1) Refine the complex and somewhat inadequately designed CGES model, (2) Solicit senior domain experts’ knowledge to form a transparent weighting system regarding the evaluation of corporate governance, (3) Explore the cause-effect influential relationship among the dimensions; (4) Provide a managerial tool—for the sake of business sustainability—for financial holding companies to evaluate their weakness priority.
Once a company identifies it underperformed priority, the analytics from the proposed hybrid model may support the board members to discuss or devise reasonable action plans. For instance, the discussions on Company B offer managerial insights for its stakeholders (including its management team, shareholders, customers, and authority) in Section 5. Company B may evaluate the required resources to carry out the possible plans (e.g., assign a dedicated team to communicate with stakeholders actively or set up an “Internal Communication Network” and make periodic external audits). How to support a company to identify its weakness priority and discuss the reasonable action plans to enhance its corporate governance is the significant implication of this study.
Aside from constructing an evaluation system to monitor listed companies, some other approaches might deliver similar or disparate effects. For instance, CSR-based compensation might be an alternative to motivate CEOs [31] to pursue higher standards of corporate governance. Or, the mutual monitoring [49] and both internal and external monitoring mechanisms [50] could be useful to mitigate agency costs. Those mechanisms require solid support from the board of directors to operate effectively. Because of the importance of corporate governance in business, there are various perspectives to discuss or explore different aspects of it. The present study focuses on enhancing the existing CGES of Taiwan, which mainly covers the evaluation aspect of corporate governance. Some other phenomenon or particularities yielded from different countries can be found in the recent reviews [51,52].
Despite the findings and implications obtained by the study, several limitations remain: (1) the effectiveness of the model hinges upon the knowledge and experience of the involved experts; (2) how to balance the cost-effect of the plausible improvement plans is not addressed; (3) the proposed model might not be suitable to compare companies across industries.
The proposed hybrid model is still far from perfect, which requires more samples to test its effectiveness. Therefore, one of the future research directions might be including more industries to enlarge the sample size and comparing the validity of each sector. It’s our hope to contribute our findings for the authorities and the listed companies to refer on how to attain long-term business sustainability through this practical approach.

Author Contributions

J.-Y.H. jointly designed the research framework, identified the crucial data from the CGES and each financial holding company’s annual report, made several rounds of interviews with the experts, collected all the questionnaires, and wrote the paper. As the first author, J.-Y.H. organized the relevant articles to position this study. K.-Y.S. proposed the research idea, benchmarked the CGES from the TWSE, devised the hybrid MCDM model, calculated the fuzzy evaluations, and contributed to partial writing and revision of this paper. J.C.P.S. helped collect the data and supervised the writing of this paper. G.-H.T. examined the research framework, suggested using the analytics to support improvements and revised this manuscript.

Funding

This study received funding from the Ministry of Science and Technology (MOST) of Taiwan (MOST-105-2410-H-034-019-MY2); the authors are grateful for the funding supports.

Acknowledgments

We appreciate the precious time and efforts that those senior experts spent for filling the questionnaires and providing their opinions.

Conflicts of Interest

Authors declare no conflicts of interest.

Appendix A. (DEMATEL and DANP Calculations)

1. Refer to Equation (2) and Equation (3) to obtain Table A1
Table A1. Normalized direct-influence matrix D.
C1C2C3C4C5C6C7C8C9C10C11C12C13
C10.000.050.030.080.060.060.040.050.030.100.060.070.06
C20.070.000.050.080.060.060.030.040.040.080.060.070.06
C30.090.050.000.090.080.080.080.070.070.090.080.100.09
C40.100.050.060.000.090.090.080.070.080.110.080.090.09
C50.070.040.030.040.000.090.090.070.060.070.070.070.08
C60.070.040.020.030.100.000.080.070.060.070.070.070.07
C70.020.000.010.020.070.080.000.060.040.030.050.050.07
C80.030.020.030.030.060.060.080.000.050.040.070.060.06
C90.030.020.020.030.050.060.050.050.000.050.070.050.04
C100.110.050.050.080.080.070.050.050.040.000.060.060.06
C110.080.050.050.050.090.080.070.060.070.080.000.080.08
C120.070.060.050.060.080.080.070.060.050.080.080.000.08
C130.070.060.050.070.090.090.080.070.050.070.080.090.00
Note: Consensus ratio is 1 ( i = 1 13 j = 1 9 | ( P i ¯ P i j ¯ ) | / 9 ) × 100 % = 1 3.25 % = 96.75 % among the nine experts.
2. Refer to Equation (4), Equation (5), and Equation (8) to obtain Table A2
Table A2. Total-influential matrix (with dimensional sub-matrices) T C D .
C1C2C3C4C5C6C7C8C9C10C11C12C13 r i C
C10.180.160.130.230.270.260.220.210.180.290.240.260.252.88
C20.250.120.150.230.260.260.210.200.190.270.240.260.252.88
C30.320.200.140.280.360.350.310.290.260.340.320.350.343.87
C40.340.210.200.200.370.370.320.300.270.360.330.350.353.98
C50.260.160.140.200.230.310.280.250.220.270.260.270.283.14
C60.250.150.130.180.310.220.270.240.210.270.250.260.273.01
C70.160.090.090.130.230.230.140.180.150.170.190.190.212.16
C80.180.110.110.150.230.230.220.140.170.200.220.210.222.40
C90.150.100.090.130.200.200.170.170.110.180.200.180.182.07
C100.290.170.160.230.300.290.240.230.200.210.260.270.263.11
C110.290.180.170.230.330.320.280.260.240.310.220.310.303.43
C120.270.180.160.220.320.310.270.250.210.290.280.220.293.27
C130.280.10.170.240.330.330.290.270.220.300.290.310.233.43
c i C 3.232.011.812.643.743.693.232.992.633.473.303.443.43
3. Refer to Equation (8) and Equation (9) to obtain Table A3, and the normalized dimensional matrix as reported in Table 9.
Table A3. Dimensional matrix T D .
D1D2D3D4
D10.180.270.250.29
D20.180.250.250.27
D30.170.240.210.24
D40.210.290.260.27
4. Refer to the explanation in Section 3.2, then Table A4 can be obtained as below.
Table A4. Initial DEMATEL-adjusted initial super-matrix.
C1C2C3C4C5C6C7C8C9C10C11C12C13
C10.0690.0880.0890.0900.0890.0940.0910.0900.0890.0940.0910.0880.088
C20.0600.0410.0540.0550.0570.0560.0570.0550.0570.0560.0570.0600.060
C30.0500.0520.0370.0550.0540.0500.0520.0550.0540.0500.0520.0520.052
C40.0630.0640.0580.0770.0580.0830.0820.0500.0510.0610.0550.0550.056
C50.0750.0740.0740.0750.0790.0580.0830.0780.0800.0790.0800.0790.078
C60.0730.0730.0720.0660.0720.0710.0500.0770.0800.0770.0780.0780.078
C70.0590.0590.0650.0610.0650.0640.0690.0740.0690.0630.0680.0680.069
C80.0600.0580.0620.0610.0650.0640.0690.0460.0630.0610.0610.0620.065
C90.0500.0540.0560.0560.0570.0560.0560.0570.0390.0530.0560.0530.053
C100.0820.0780.0730.0750.0710.0710.0650.0650.0660.0570.0720.0730.071
C110.0680.0690.0690.0680.0680.0680.0710.0710.0720.0690.0510.0710.070
C120.1480.1470.1460.1430.1460.1450.1460.1380.1410.1400.1410.1120.149
C130.1420.1430.1440.1470.1440.1450.1440.1420.1390.1400.1390.1480.111

Appendix B. (Crisp and Fuzzy Semantic Evaluations of the Five Companies)

1. Crisp evaluations of the five companies
Table A5. Crisp performance evaluation of Company A.
Expert 1Expert 2Expert 3Expert 4Expert 5Average
C110.09.08.89.09.09.2
C28.06.07.26.58.57.2
C37.56.07.28.07.07.1
C46.55.05.86.57.06.2
C58.07.05.56.57.56.9
C610.07.08.06.57.07.7
C79.07.09.08.08.58.3
C89.58.09.07.08.08.3
C97.58.08.07.08.07.7
C109.07.09.08.08.08.2
C119.08.09.08.08.08.4
C129.08.09.08.58.08.5
C139.08.08.58.58.08.4
Table A6. Crisp performance evaluation of Company B.
Expert 1Expert 2Expert 3Expert 4Expert 5Average
C15.06.03.82.08.05.0
C26.04.03.04.07.04.8
C36.54.06.63.58.05.7
C47.04.05.75.08.56.0
C58.05.05.55.07.56.2
C67.05.05.54.58.06.0
C77.04.06.54.57.55.9
C84.04.02.53.04.53.6
C97.58.07.64.08.07.0
C107.06.03.02.07.55.1
C116.57.06.54.07.06.2
C127.06.06.63.57.56.1
C137.07.03.03.57.05.5
Table A7. Crisp performance evaluation of Company C.
Expert 1Expert 2Expert 3Expert 4Expert 5Average
C15.06.06.02.07.55.3
C29.06.08.58.010.08.3
C33.04.03.34.53.03.6
C47.05.05.75.09.06.3
C56.05.05.55.07.55.8
C610.05.09.05.08.07.4
C76.54.05.03.57.05.2
C81.04.02.52.03.02.5
C97.58.07.73.58.06.9
C105.05.04.53.08.05.1
C116.06.06.54.07.05.9
C126.05.05.03.06.05.0
C134.06.02.52.06.04.1
Table A8. Crisp performance evaluation of Company D.
Expert 1Expert 2Expert 3Expert 4Expert 5Average
C15.06.08.69.08.07.3
C210.09.08.810.010.09.6
C39.09.07.39.08.58.6
C49.09.07.28.09.08.4
C59.09.06.87.08.58.1
C610.09.08.27.08.58.5
C79.09.09.08.08.58.7
C89.58.09.08.08.08.5
C97.59.08.07.08.07.9
C109.09.09.08.08.08.6
C119.09.09.08.08.08.6
C129.09.09.08.08.08.6
C139.09.08.68.08.08.5
Table A9. Crisp performance evaluation of Company E.
Expert 1Expert 2Expert 3Expert 4Expert 5Average
C15.08.05.55.08.06.3
C25.07.04.54.07.05.5
C33.06.03.34.03.03.9
C46.56.06.22.08.05.7
C59.06.05.75.08.56.8
C69.06.08.05.08.07.2
C79.07.09.04.08.57.5
C89.07.08.24.04.56.5
C97.56.08.05.08.06.9
C109.06.08.56.08.07.5
C118.06.08.55.07.57.0
C126.06.09.05.07.06.6
C135.05.08.35.07.06.1
2. Fuzzy semantic evaluations of the five companies
Table A10. Fuzzy semantic performance evaluation of Company A.
Expert 1Expert 2Expert 3Expert 4Expert 5
C1GGGGG
C2GMGMG
C3GMGGM
C4GMMMM
C5GGMMM
C6GGGMM
C7GGGGG
C8GGGMM
C9GGGMG
C10GGGGG
C11GGGGG
C12GGGGG
C13GGGGG
Note: G denotes “Good,” M denotes “Middle,” and B means “Bad”.
Table A11. Fuzzy semantic performance evaluation of Company B.
Expert 1Expert 2Expert 3Expert 4Expert 5
C1MMBBG
C2MMBMM
C3MMMMG
C4GBMMG
C5GMMMM
C6GMMMG
C7GMMMG
C8MBBBM
C9GGGMG
C10GMBBG
C11MGMMM
C12GMMMM
C13GMBMM
Note: G denotes “Good,” M denotes “Middle,” and B means “Bad”.
Table A12. Fuzzy semantic performance evaluation of Company C.
Expert 1Expert 2Expert 3Expert 4Expert 5
C1MMMBG
C2GMGGG
C3BMBMB
C4GMMMG
C5MMMMM
C6GMGMG
C7MMMMM
C8BBBBB
C9GGGMG
C10MMMBG
C11MMMMM
C12MMMMM
C13MMBBM
Note: G denotes “Good,” M denotes “Middle,” and B means “Bad”.
Table A13. Fuzzy semantic performance evaluation of Company D.
Expert 1Expert 2Expert 3Expert 4Expert 5
C1MMGGG
C2GGGGG
C3GGGGG
C4GGGGG
C5GGGMG
C6GGGMG
C7GGGGG
C8GGGGG
C9GGGMG
C10GGGGG
C11GGGGG
C12GGGGG
C13GGGGG
Note: G denotes “Good,” M denotes “Middle,” and B means “Bad”.
Table A14. Fuzzy semantic performance evaluation of Company E.
Expert 1Expert 2Expert 3Expert 4Expert 5
C1MGMMG
C2MMMMM
C3BMBBB
C4GMGMG
C5GMMMG
C6GMGMG
C7GMGMG
C8GMGMG
C9GMGMG
C10GMGMG
C11GMGMG
C12MMGMM
C13MMGMM
Note: G denotes “Good,” M denotes “Middle,” and B means “Bad”.
(Please cross-reference the fuzzy semantic evaluations by the five experts in Appendix B with Table 10 to generate the averaged defuzzified performance scores of the five companies in Table 11 and Table 12.)

References

  1. Shleifer, A.; Vishny, R.W. A survey of corporate governance. J. Finan. 1997, 52, 737–783. [Google Scholar] [CrossRef]
  2. Claessens, S.; Yurtoglu, B.B. Corporate governance in emerging markets: A survey. Emerg. Mark. Rev. 2013, 15, 1–33. [Google Scholar] [CrossRef]
  3. Dyllick, T.; Hockerts, K. Beyond the business case for corporate sustainability. Bus. Strategy Environ. 2002, 11, 130–141. [Google Scholar] [CrossRef]
  4. Dittmar, A.; Mahrt-Smith, J.; Servaes, H. International corporate governance and corporate cash holdings. J. Financ. Quant. Anal. 2003, 38, 111–133. [Google Scholar] [CrossRef]
  5. Belev, B. Institutional investors in Bulgarian corporate governance reform: Obstacles or facilitators? J. World Bus. 2003, 38, 361–374. [Google Scholar] [CrossRef]
  6. CGES Official Website. Available online: http://cgc.twse.com.tw/evaluationCorp/listEn (accessed on 1 June 2018).
  7. OECD Principles of Corporate Governance 2004, Online Report (69 pages). Available online: http://www.oecd.org/corporate/ca/corporategovernanceprinciples/31557724.pdf (accessed on 1 February 2018).
  8. Simon, H.A. Theories of bounded rationality. Decis. Organ. 1972, 1, 161–176. [Google Scholar]
  9. Okoli, C.; Pawlowski, S.D. The Delphi method as a research tool: An example, design considerations and applications. Inf. Manag. 2004, 42, 15–29. [Google Scholar] [CrossRef]
  10. Gabus, A.; Fontela, E. World Problems, an Invitation to Further Thought within the Framework of DEMATEL; A Technical Report; Battelle Geneva Research Center: Columbus, OH, USA, 1972. [Google Scholar]
  11. Jeng, D.J.F.; Tzeng, G.H. Social influence on the use of clinical decision support systems: Revisiting the unified theory of acceptance and use of technology by the fuzzy DEMATEL technique. Comput. Ind. Eng. 2012, 62, 819–828. [Google Scholar] [CrossRef]
  12. Zavadskas, E.K.; Antucheviciene, J.; Turskis, Z.; Adeli, H. Hybrid multiple-criteria decision-making methods: A review of applications in engineering. Sci. Iran. Trans. A Civ. Eng. 2016, 23, 1–20. [Google Scholar] [CrossRef]
  13. Shen, K.Y.; Tzeng, G.H. Advances in Multiple Criteria Decision Making for Sustainability: Modeling and Applications. Sustainability 2018, 10, 600. [Google Scholar] [CrossRef]
  14. Saaty, T.L. Theory and Applications of the Analytic Network Process: Decision Making with Benefits, Opportunities, Costs, and Risks; RWS Publication: Pittsburgh, PA, USA, 2005. [Google Scholar]
  15. Tzeng, G.H.; Shen, K.Y. New Concepts and Trends of Hybrid Multiple Criteria Decision Making; CRC Press (Taylor & Francis Group): Boca Raton, FL, USA, 2017. [Google Scholar]
  16. Opricovic, S.; Tzeng, G.H. Compromise solution by MCDM methods: A comparative analysis of VIKOR and TOPSIS. Eur. J. Oper. Res. 2004, 156, 445–455. [Google Scholar] [CrossRef]
  17. Opricovic, S.; Tzeng, G.H. Extended VIKOR method in comparison with outranking methods. Eur. J. Oper. Res. 2007, 178, 514–529. [Google Scholar] [CrossRef]
  18. Parker, L.D. Corporate governance crisis down under: Post-Enron accounting education and research inertia. Eur. Account. Rev. 2005, 14, 383–394. [Google Scholar] [CrossRef]
  19. ElKelish, W.W. Corporate governance risk and the agency problem. Corp. Gov. Int. J. Bus. Soc. 2018, 18, 254–269. [Google Scholar] [CrossRef]
  20. Core, J.; Guay, W. The use of equity grants to manage optimal equity incentive levels. J. Account. Econ. 1999, 28, 151–184. [Google Scholar] [CrossRef] [Green Version]
  21. Bebchuk, L.A.; Fried, J.M. Executive compensation as an agency problem. J. Econ. Perspect. 2003, 17, 71–92. [Google Scholar] [CrossRef]
  22. Anginer, D.; Demirguc-Kunt, A.; Huizinga, H.; Ma, K. Corporate governance of banks and financial stability. J. Financ. Econ. 2018, 130, 327–346. [Google Scholar] [CrossRef]
  23. Chiou, J.R.; Hsiung, T.C.; Kao, L.F. A study on the relationship between financial distress and collateralized shares. Taiwan Account. Rev. 2002, 3, 79–111. [Google Scholar] [CrossRef]
  24. Musteen, M.; Datta, D.K.; Kemmerer, B. Corporate reputation: Do board characteristics matter? Br. J. Manag. 2010, 21, 498–510. [Google Scholar] [CrossRef]
  25. Cao, Z.; Leng, F.; Feroz, E.H.; Davalos, S.V. Corporate governance and default risk of firms cited in the SEC’s Accounting and Auditing Enforcement Releases. Rev. Quant. Financ. Account. 2015, 44, 113–138. [Google Scholar] [CrossRef]
  26. Sikka, P. Financial crisis and the silence of the auditors. Account. Organ. Soc. 2009, 34, 868–873. [Google Scholar] [CrossRef] [Green Version]
  27. Bushman, R.M.; Smith, A.J. Financial accounting information and corporate governance. J. Account. Econ. 2001, 32, 237–333. [Google Scholar] [CrossRef] [Green Version]
  28. Ntim, C.G.; Lindop, S.; Osei, K.A.; Thomas, D.A. Executive compensation, corporate governance and corporate performance: A simultaneous equation approach. Manag. Decis. Econ. 2015, 36, 67–96. [Google Scholar] [CrossRef]
  29. Gompers, P.; Ishii, J.; Metrick, A. Corporate governance and equity prices. Q. J. Econ. 2003, 118, 107–156. [Google Scholar] [CrossRef]
  30. Giroud, X.; Mueller, H.M. Corporate governance, product market competition, and equity prices. J. Financ. 2011, 66, 563–600. [Google Scholar] [CrossRef]
  31. Hong, B.; Li, Z.; Minor, D. Corporate governance and executive compensation for corporate social responsibility. J. Bus. Ethics 2016, 136, 199–213. [Google Scholar] [CrossRef]
  32. Ali, W.; Frynas, J.G.; Mahmood, Z. Determinants of corporate social responsibility (CSR) disclosure in developed and developing countries: A literature review. Corp. Soc. Responsib. Environ. Manag. 2017, 24, 273–294. [Google Scholar] [CrossRef]
  33. Abdallah, A.A.N.; Ismail, A.K. Corporate governance practices, ownership structure, and corporate performance in the GCC countries. J. Int. Financ. Mark. Inst. Money 2017, 46, 98–115. [Google Scholar] [CrossRef]
  34. Adrian, T.; Covitz, D.; Liang, N. Financial stability monitoring. Ann. Review Financ. Econ. 2015, 7, 357–395. [Google Scholar] [CrossRef]
  35. De Andres, P.; Vallelado, E. Corporate governance in banking: The role of the board of directors. J. Bank. Financ. 2008, 32, 2570–2580. [Google Scholar] [CrossRef] [Green Version]
  36. Erkens, D.H.; Hung, M.; Matos, P. Corporate governance in the 2007–2008 financial crisis: Evidence from financial institutions worldwide. J. Corp. Financ. 2012, 18, 389–411. [Google Scholar] [CrossRef] [Green Version]
  37. Barth, J.R.; Caprio, G., Jr.; Levine, R. Bank Regulation and Supervision in 180 Countries from 1999 to 2011. J. Financ. Econ. Policy 2013, 5, 111–219. [Google Scholar] [CrossRef]
  38. Hu, K.H.; Chen, F.H.; Tzeng, G.H.; Lee, J.D. Improving corporate governance effects on an enterprise crisis based on a new hybrid DEMATEL with the MADM model. J. Test. Eval. 2014, 43, 1395–1412. [Google Scholar] [CrossRef]
  39. Tzeng, G.H.; Huang, J.J. Multiple Attribute Decision Making: Methods and Applications; CRC Press (Taylor & Francis Griup): Boca Raton, FL, USA, 2011. [Google Scholar]
  40. Tzeng, G.H.; Huang, C.Y. Combined DEMATEL technique with hybrid MCDM methods for creating the aspired intelligent global manufacturing & logistics systems. Ann. Oper. Res. 2012, 197, 159–190. [Google Scholar] [CrossRef]
  41. Shen, K.Y.; Yan, M.R.; Tzeng, G.H. Combining VIKOR-DANP model for glamor stock selection and stock performance improvement. Knowl. Based Syst. 2014, 58, 86–97. [Google Scholar] [CrossRef]
  42. Zadeh, L.A. Fuzzy logic and approximate reasoning. Synthese 1975, 30, 407–428. [Google Scholar] [CrossRef]
  43. Shen, K.Y.; Tzeng, G.H. A decision rule-based soft computing model for supporting financial performance improvement of the banking industry. Soft Comput. 2015, 19, 859–874. [Google Scholar] [CrossRef]
  44. Dalkey, N.; Helmer, O. An experimental application of the Delphi method to the use of experts. Manag. Sci. 1963, 9, 458–467. [Google Scholar] [CrossRef]
  45. Hwang, C.L.; Yoon, K. Methods for multiple attribute decision making. In Multiple Attribute Decision Making; Springer: Berlin/Heidelberg, Germany, 1981; pp. 58–191. [Google Scholar] [CrossRef]
  46. García-Cascales, M.S.; Lamata, M.T. On rank reversal and TOPSIS method. Math. Comput. Model. 2012, 56, 123–132. [Google Scholar] [CrossRef]
  47. Shen, K.Y. Compromise between short-and long-term financial sustainability: A hybrid model for supporting R&D decisions. Sustainability 2017, 9, 375. [Google Scholar] [CrossRef]
  48. Shen, K.Y.; Hu, S.K.; Tzeng, G.H. Financial modeling and improvement planning for the life insurance industry by using a rough knowledge based hybrid MCDM model. Inf. Sci. 2017, 375, 296–313. [Google Scholar] [CrossRef]
  49. Li, Z.F. Mutual monitoring and corporate governance. J. Bank. Finan. 2014, 45, 255–269. [Google Scholar] [CrossRef]
  50. Misangyi, V.F.; Acharya, A.G. Substitutes or complements? A configurational examination of corporate governance mechanisms. Acad. Manage. J. 2014, 57, 1681–1705. [Google Scholar] [CrossRef]
  51. Cuomo, F.; Mallin, C.; Zattoni, A. Corporate governance codes: A review and research agenda. Corp. Gov. Int. Rev. 2016, 24, 222–241. [Google Scholar] [CrossRef]
  52. Oehmichen, J. East meets west—Corporate governance in Asian emerging markets: A literature review and research agenda. Int. Bus. Rev. 2018, 27, 465–480. [Google Scholar] [CrossRef]
Figure 1. Illustration of the research flows.
Sustainability 11 00582 g001
Figure 2. Dimensional influential relationship map (INRM).
Sustainability 11 00582 g002
Table 1. Dimensions and associated indicators of the Corporate Governance Evaluation System (CGES) in 2017.
DimensionsNumber of Each Type of IndicatorNumber of IndicatorsWeighting (%)
A & BAAA+
Protecting shareholder rights and interests and treating shareholders equitably (D1)15111720
Enhancing board composition and operation (D2)26133035
Increasing information transparency (D3)15232024
Putting CSR into practice (D4)14221821
Total706985100
EXTRA Plus------1--
EXTRA Minus------1--
Table 2. Corporate research topics and the associated CGES dimensions.
DimensionsAssociated Research Topics
Protecting shareholder rights and interests and treating shareholders equitably (D1)Agency problem, Managerial style
Enterprise risk management
Enhancing board composition and operation (D2)Agency problem, Ownership structure
Board of directors, Managerial style
Increasing information transparency (D3)Agency problem, Accounting and auditing
Putting CSR into practice (D4)Company performance and CSR
Table 3. Basic information of the three selected financial holding companies in 2017.
Company NamesCodesMajor BusinessesNumber of EmployeesShare Capital
Cathay2882Insurance, Securities & Banking55,541125.63 B (NT dollars)
CTBC2891Insurance, Securities & Banking22,609194.97 B (NT dollars)
Sinopac2890Securities & Banking8682112.71 B (NT dollars)
E.SUN2884Securities & Banking8326108.29 B (NT dollars)
Shin Kong2888Insurance, Securities & Banking20,000121.86 B (NT dollars)
(Note: Most of the information is from the official website of TWSE, and the “numbers of employees” were retrieved from each company’s website in December 2018.)
Table 4. Invited experts’ backgrounds.
BackgroundsNumber of ExpertsPrevious or Current Job Titles (Backgrounds)
Industry4CEO, Vice President, Auditor General
Academia3Full Professor (Retired CEOs from financial holding companies)
Government3
  • Former Director-General of Securities and Futures Bureau
  • Senior Executive Vice President of Taiwan Stock Exchange
  • President of Taiwan Depository & Clearing Corporation
Table 5. Continuous screening results by Delphi method.
Number of Criteria (Indicators)
DimensionsInitial CGES1st Round2nd Round
Protecting shareholder rights and interests and treating shareholders equitably (D1)17103
Enhancing board composition and operation (D2)30154
Increasing information transparency (D3)2094
Putting CSR into practice (D4)1862
Total854013
Table 6. The 13 criteria reserved for forming the hybrid model.
DimensionsCriteria
Protecting shareholder rights and interests and treating shareholders equitably (D1)In the case of undistributed dividends, Directors and Supervisors’ Remuneration as a Percentage of the Company’s Net Profit (C1)
Average ratio of pledges by directors, supervisors and substantial shareholders (C2)
The proportion of seats held by government agencies or single-listed companies and their subsidiaries in the board of directors (C3)
Enhancing board composition and operation (D2)Among the members of the board of directors, general manager (executive director) and members of the board of directors, the proportion of relatives with spouses or second-degree relatives (C4)
The company exposes the opinions of independent directors on the major proposals of the board of directors and the degree of company processing (C5)
The company exposes the results of the resolution of the audit committee on the major proposals and the degree of disclosure of the company’s handling (C6)
The degree to which the head of internal audit/auditor general attends the board of directors and proposes the internal audit report to each supervisor and independent director (C7)
Increasing information transparency (D3)The degree to which the company voluntarily discloses its financial forecast quarterly and without having any corrections ordered by the competent authority or having any demerits imposed by the TWSE (C8)
The degree to which the company discloses long-term and short-term business development plans in its annual report (C9)
The degree to which the company discloses the remuneration details of each director and supervisor in its annual report (C10)
Putting CSR into practice (D4)The degree to which the company website discloses information related to the company’s finances, business and corporate governance (C11)
The degree to which the company discloses on its website or in its annual report the identities, issues of concern to, channels of communication with, and means for responding to, stakeholders that it has identified (C12)
The degree to which the company adopts and discloses in detail on its website a whistle blower system for company insiders and outsiders to report illegal behavior (including corruption) and unethical behavior (C13)
Table 7. Initial influence matrix A.
CriteriaC1C2C3C4C5C6C7C8C9C10C11C12C13
C10.001.671.112.892.222.111.221.671.113.562.002.442.00
C22.330.001.562.892.002.001.001.221.442.782.002.442.22
C33.001.670.003.002.892.672.672.332.443.112.783.443.22
C43.441.892.110.003.223.112.782.442.673.672.783.223.22
C52.561.331.001.440.003.223.222.562.222.442.332.442.67
C62.441.220.781.113.440.002.892.442.112.442.332.442.56
C70.780.110.440.672.562.780.002.111.441.111.891.892.56
C81.000.560.891.112.222.222.670.001.891.442.332.002.22
C90.890.670.780.891.892.001.561.890.001.562.441.561.44
C103.671.891.672.672.782.561.561.671.440.002.112.112.11
C112.891.781.671.893.002.892.442.222.332.890.002.892.78
C122.332.001.562.002.892.892.442.111.672.672.780.002.67
C132.332.001.672.333.003.112.782.561.672.442.673.000.00
Note: The consensus ratio is 1 ( i = 1 13 j = 1 9 | ( P i ¯ P i j ¯ ) | / 9 ) × 100 % = 1 3.25 % = 96.75 % among the nine experts.
Table 8. Cause and effect analysis for each criterion and dimension by DEMATEL.
Dimensions r j d D c j d D r j d D + c j d D r j d D c j d D Criteria r i C c i C r i C + c i C r i C c i C
D10.990.741.730.25C12.883.236.11−0.35
C22.882.014.900.87
C33.871.815.682.05
D20.951.041.99−0.09C43.982.646.621.34
C53.143.746.88−0.61
C63.013.696.69−0.68
C72.163.235.39−1.07
D30.850.971.82−0.12C82.402.995.39−0.59
C92.072.634.71−0.56
C103.113.476.57−0.36
D41.021.062.08−0.04C113.433.306.730.13
C123.273.446.71−0.17
C133.433.436.870.00
Table 9. Normalized dimensional matrix T N D .
Dimensions D1D2D3D4
Protecting shareholder rights and interests and treating shareholders equitablyD10.180.270.250.29
Enhancing board composition and operationD20.180.250.250.27
Increasing information transparencyD30.170.240.210.24
Putting CSR into practiceD40.210.290.260.26
Table 10. The fuzzy semantic parameters (triangular membership function) of the five experts.
Fuzzy Parameters of the Three Semantic ScalesExpert 1Expert 2Expert 3Expert 4Expert 5
(L, M, R) *(L, M, R)(L, M, R)(L, M, R)(L, M, R)
Bad (B)(0.0, 0.0, 3.5)(0.0, 0.0, 3.5)(0.0, 0.0, 3.5)(0.0, 0.0, 3.5)(0.0, 0.0, 3.0)
Middle (M)(3.0, 5.0, 7.0)(3.0, 5.0, 7.0)(3.2, 5.0, 6.5)(3.0, 5.0, 7.0)(2.5, 5.0 7.5)
Good (G)(6.5, 10.0, 10.0)(6.5, 10.0, 10.0)(6.0, 10.0, 10.0)(6.5, 10.0, 10.0)(7.0, 10.0, 10.0)
* Note: In here, the full scale is the same as the crisp (from 0 to 10), and (L, M, R) denotes the Left (L), Middle (M), and Right (R) parameters of a fuzzy triangular membership function. Therefore, if Expert 1 feels that the performance of A company on C1 is Good (G), then the associated fuzzy triangular parameters will be (6.5, 10.0, 10.0).
Table 11. Final ranking by applying DANP-SAW model by crisp evaluations in 2017.
Crisp SAWDANP WeightsFinancial Holding Companies
A   ( P A j ) B   ( P B j ) C   ( P C j ) D   ( P D j ) E   ( P E j )
C18.73%9.164.965.307.326.30
C25.62%7.244.808.309.565.50
C35.11%7.145.723.568.563.86
C46.12%6.166.046.348.445.74
C57.59%6.906.205.808.066.84
C67.29%7.706.007.408.547.20
C76.53%8.305.905.208.707.50
C86.12%8.303.602.508.506.54
C95.33%7.707.026.947.906.90
C107.06%8.205.105.108.607.50
C116.79%8.406.205.908.607.00
C1213.91%8.506.125.008.606.60
C1313.79%8.405.504.108.526.06
Final Performance8.005.645.368.446.47
(Rank)(2nd)(4th)(5th)(1st)(3rd)
Table 12. Final ranking by applying DANP-VIKOR model by fuzzy evaluations in 2017.
Fuzzy VIKORDANP WeightsFinancial Holding Companies
ABCDE
P A j GapA P B j GapB P B j GapC P D j GapD P E j GapE
C18.73%8.831.02%4.275.00%5.014.36%7.302.36%6.553.01%
C25.62%7.301.52%4.233.25%8.071.09%8.830.66%4.982.82%
C35.11%7.251.40%5.782.15%2.673.74%8.830.60%2.673.74%
C46.12%5.752.60%5.782.58%6.552.11%8.830.72%6.532.13%
C57.59%6.512.65%5.753.23%4.983.81%8.071.47%6.552.62%
C67.29%7.271.99%6.552.51%7.301.97%8.071.41%7.301.97%
C76.53%8.830.76%6.552.25%4.983.28%8.830.76%7.301.76%
C86.12%8.071.18%2.704.47%1.135.43%8.830.72%7.301.65%
C95.33%8.071.03%8.071.03%8.071.03%8.071.03%7.301.44%
C107.06%8.830.83%5.033.51%5.013.52%8.830.83%7.301.91%
C116.79%8.830.79%5.752.89%4.983.41%8.830.79%7.301.83%
C1213.91%8.831.63%5.755.91%4.986.98%8.831.63%5.735.94%
C1313.79%8.831.61%5.006.90%3.479.01%8.831.61%5.735.89%
S k 19.02% 45.68% 49.73% 14.57% 36.71%
R k 2.65% 6.90% 9.01% 2.36% 5.94%
Q k v = 0.9518.20% 43.74% 47.70% 13.96% 35.18%
(Rank)(2nd) (4th) (5th) (1st) (3rd)
Q k v = 0.9017.39% 41.80% 45.66% 13.35% 33.64%
(Rank)(2nd) (4th) (5th) (1st) (3rd)
Q k v = 0.8516.57% 39.86% 43.63% 12.74% 32.10%
(Rank)(2nd) (4th) (5th) (1st) (3rd)
Q k v = 0.8015.75% 37.92% 41.59% 12.13% 30.56%
(Rank)(2nd) (4th) (5th) (1st) (3rd)

