Social Security and Sustainable Economic Growth: Based on the Perspective of Human Capital

School of Political Science and Public Administration, Southwest University, Chongqing 400715, China
*
Author to whom correspondence should be addressed.
Sustainability 2019, 11(3), 662; https://doi.org/10.3390/su11030662
Submission received: 12 December 2018
/
Revised: 24 January 2019
/
Accepted: 24 January 2019
/
Published: 28 January 2019
(This article belongs to the Special Issue Sustainability and Social Policy)
Abstract
:China’s social security expenditure has rapidly grown during the past decade, and concerns about the impact of social security on productivity and sustained economic growth have attracted attention. Based on Chinese provincial panel data over the period 2007–2016, a threshold model analysis found that the impact of social security on productivity has a “double threshold” on human capital. Using dynamic panel data models and system General Moment Method estimators also found the existence of this threshold effect: When the human capital level is low or high, social security is favorable for sustained economic growth. However, if the human capital level is at the intermediate level, the function of social security is weak. The main conclusions were still valid after we examined the robustness of our results with several methods.
1. Introduction
After 40 years of development, the Chinese economy is currently experiencing a shift from high-speed growth to medium-to-high-speed growth. Many economists and economic forecasting agencies even predict that it is possible for China’s economy growth to continue to decline. As modern economic growth theory places considerable emphasis on the role of productivity gains in sustainable economic growth, this concern for growth sustainability has triggered a heated discussion on China’s total factor productivity growth. Fiscal funds have been heavily invested in social security in recent years in China, and therefore the effect of social security on the sustainable growth has become a worthy topic.
The traditional view argues that social security, as an important way in income redistribution and transfer payment, pursues fairness as its primary attribute, so excessive social security will lead to resource allocation efficiency decline [1]. In other words, a high level of social security will certainly have adverse influence on economic development. Moderate social security improves consumers’ budget constraints, smooth consumption, and thus promotes economic development [2]. Many studies found that social security can promote family human capital investment. Human capital is an important source of productivity improvement [3]; in other words, moderate social security is conducive to productivity growth and economic sustainability. Based on the experience of economic development of countries, there are not only the Latin American countries imitating the social security system of developed countries and then falling into the “growth trap” [4], but also Nordic welfare countries maintaining the country’s high competitiveness through high welfare.
Since the establishment of the social security system in China, its expenditure has increased year by year. During the past decade, China has built the world’s largest social security system [5]. Taking social security expenditure as an example, the total expenditure on social insurance in 2004 was only 462.7 billion yuan, accounting for 3.0% of GDP. In 2017, the total expenditure on social insurance reached 57,145 billion yuan, accounting for 7.0% of GDP. Social security expenditure was the largest government expenditure item in 2017. On one hand, the increase in social security expenditure reduced the uncertainty expectations of residents and functions as a social stabilizer. On the other hand, it resulted in some current problems, such as China’s rigid welfare benefits, solidification of beneficiary groups, and increased financial burden. It is obvious that the social security system reform has entered the deep water area [6]. Scientific and rational use of social security expenditures, especially the use of social security expenditures to enhance human capital, is an important breakthrough in realizing the role of social security and promoting sustainable economic growth.
This study investigates the effect of social security on productivity based on the perspective of human capital. The paper concludes that when human capital is relatively low, social security can promote productivity growth by cultivating human capital. However, with the improvement of human capital, the function of social security in promoting human capital investment is weakened, so social security’s influence on productivity growth is unobvious. Fortunately, if there are other mechanisms to promote the accumulation of human capital to break through this trap, then welfare growth will be accompanied by productivity growth and improvement. The research uses empirical analysis of the panel threshold model and the dynamic panel model to verify this view based on the provincial panel data of China from 2007 to 2016.
2. Literature Review and Research Hypothesis
The early literature on the relationship between social security and economic growth is more about the impact of social security on savings and investment. Barro [7] used the overlapping generations model and the intergenerational transmitting mechanism of parental altruism, concluding that social security does not change the family’s budget constraints, and thus savings is neutrality. Feldstein [8] argued that social security has a positive crowding-in effect and a reverse crowding-out effect on investment. On one hand, the increase in social security payment level enhances early retirement behavior. To improve the level of retirement life, people will save more money during their labor. On the other hand, social security has an asset substitution effect which reduces savings. Feldstein used empirical data and found that the crowding-out effect of saving on social security was greater than its crowding-in effect. Therefore, social security is not conducive to savings. Kotlikoff [9] holds a similar view that the substitution effect and income effect of social security have a negative influence on savings and economic growth. Moreover, many studies have found that there is a positive correlation between the level of social security and the rate of investment savings, which is considered to be the key to the current imbalance of “investment-deficient” in China [10]. Jia et al. [11] argued that traditional cultural beliefs have an impact on short-term economic growth through the effects of social security on physical capital accumulation. Guo and Gong [12] found that social security promotes economic growth by replacing family support for the aged. Lu and Liu [13] pointed out that the expansion of social security leads to increase in government expenditures. Simultaneously, they found that excessive government intervention has an adverse impact on market efficiency and government spending has a “crowding-out effect” on private investment, which hinder economic growth.
In recent years, the study of the relationship between social security and economic growth has concentrated on the endogenous growth theory [14,15]. In classic endogenous growth theory, human capital plays an important role in technology progress and sustainable economic growth. A line of research in endogenous growth started by a short paper of Nelson and Phelps [16] studies complementarity between R&D and investments in human capital [16]. Within this approach, human capital is not “simply another factor in growth accounting” [17], because it facilitates technology adoption and diffusion. In particular, a model developed by Redding [18], analyzes, within an imperfect labor market, low-skill, low-quality traps caused by a strategic complementarity between homogeneous human capital (chosen by workers) and R&D (provided by firms). Scicchitano [19] extended Redding [18] by introducing the heterogeneity of the human capital through both education and on-the-job training. Because of the importance of human capital, the impact of social security on human capital has caused wide public concern. It is believed that the pay-as-you-go social security model links the parents’ pension with the income of their children and then promotes the increase of parents’ educational expenses for their children, thereby improving the education level of residents and improving the health of residents [20,21,22,23,24]. Especially for low-income families, the redistribution of social security funds can improve the cultural quality and improve the basic educational conditions of family members [25]. Therefore, social security increases labor productivity through human capital accumulation and provides power for sustainable economic development [2,17,26]. Another group of scholars argued that the social security system inhibits human capital investment, which is not conducive to economic growth. Guo et al. [27] found that social security would weaken parents’ dependence on their children’s support after the introduction of parents’ self-interested motives, so parents with stronger self-interested motives lower their educational investment in their children and thus inhibit human capital accumulation and long-term economic growth. Peng and Shen [28] and Lin and Gong [29] had similar conclusions. Ehrlich and Kim [30] used multicountry panel data for empirical testing and found that social security has an inhibitory effect on human capital investment. Shen [31] and Caliendo and Findley [32] pointed out that rising social security contribution rates reduce human capital investment and hinder economic growth under the pay-as-you-go social security system.
Different from the research above, Bucciol et al. [33] pointed out that pay-as-you-go pension schemes might increase life-cycle income inequality in a model with heterogeneous agents, and it is more beneficial for educated people with high productivity. In other words, pension schemes’ income effect depends on human capital. The paper has a similar view about the role of human capital. We argue that there should be a moderate scale of social security, and this moderate input model is closely related to the level of human capital. The increase in social security expenditure increases the family’s education expenditure when the level of human capital is low, which has a significant effect on the health status of the residents and the education level [1,23,24]. With the increase of human capital and income in a country, the function of social security is inevitably weakened. Parents may reduce the human capital investment of their children for less dependence on them, which is an important reason many middle-income countries fall into the "growth trap". This study found that if there are other mechanisms that can promote the further growth of human capital, the superior social security system helps to enhance the enthusiasm, initiative, and creativity of employees, which is helpful for improving productivity [34]. In conclusion, the impact of social security on productivity growth and the sustainability of economic growth has the threshold of human capital: When the level of human capital is low or high, social security is beneficial to the sustained growth of the economy; when the level is in the middle zone, social security exerts unobvious influence on sustained growth.
3. Variables and Data
3.1. Measurement of Total Factor Productivity: A measure of Economic Sustainability
The growth of total factor productivity is the determining factor which affects sustainable economic development [35]. This study uses the growth of total factor productivity to judge and identify the sustained growth of economy. The early measurement of total factor productivity mainly uses the Solow residual method, but it is too harsh to satisfy the assumption that the production function should be required by this method. As a nonparametric method, the method is based on the DEA–Malmquist index, which has been widely used in recent research, for there is no need to make specific assumptions about the form and distribution of production functions.
Based on the nonparametric DEA method and referring to the Malmquist Productivity Index, this paper takes output as an indicator, which is defined by Fare et al. [36]. Suppose there are N decision-making units, and each unit has K kinds of factor inputs in each period (t = 1,...,T), M kinds of outputs, and the production technology set St converts the factor inputs into outputs , which can be represented by sets:
In Equation (1), St is called the production possibility set, and the maximum output subset of each given input is the frontier of production technology. Defining the output distance function of the period t as:
in general, . When , this indicates that the decision-making unit is on the frontier of the technology and the production efficiency is 100%, which means that it achieves the maximum output under a given input. In order to characterize the time variation of production efficiency, the distance function with two different moments is given as follows:
Equation (3) gives the Malmquist index concerning the t-stage’s production technique, and the Malmquist index of the next stage can also be given. In order to avoid the arbitrariness in selecting the frame of reference of production technology, the geometric mean of the two can be used as the final Malmquist productivity index:
The linear programming method is used to solve the various distance functions, and then the above formula can be used to obtain the Malmquist productivity index of each decision unit.
Thirty-one provinces, autonomous regions, and municipalities (hereinafter referred as provinces) in the mainland of China appear as decision-making units, and the annual data are used from 2006 to 2016. Physical capital and labor force seem as input factors X and regional GDP appear as output y. Based on the nonparametric Malmquist index method, the study uses the DEAP program to obtain the total factor productivity change index (TFPCH) for 30 provinces in China from 2007 to 2016. The calculation in Figure 1 shows that from the overall development trend, China’s interprovincial total factor productivity is declining, with a negative growth rate and an average annual decline of 2.7%. This is similar to the calculation of Lai [37] and Zhong and Mao [38], which were based on the growth decomposition method, although the lag of market-oriented reforms and the rapid growth of public investment after the financial crisis may hinder the improvement of China’s total factor productivity [1,37]. Moreover, our calculation does not mean that China had no technological progress during this period, because there are many other factors that affect the results. For example, our calculations only consider nonmaterialized technological advances, and some other technological advances embedded in capital factor inputs in the form of advanced machinery and equipment have not been reflected in the Malmquist index.
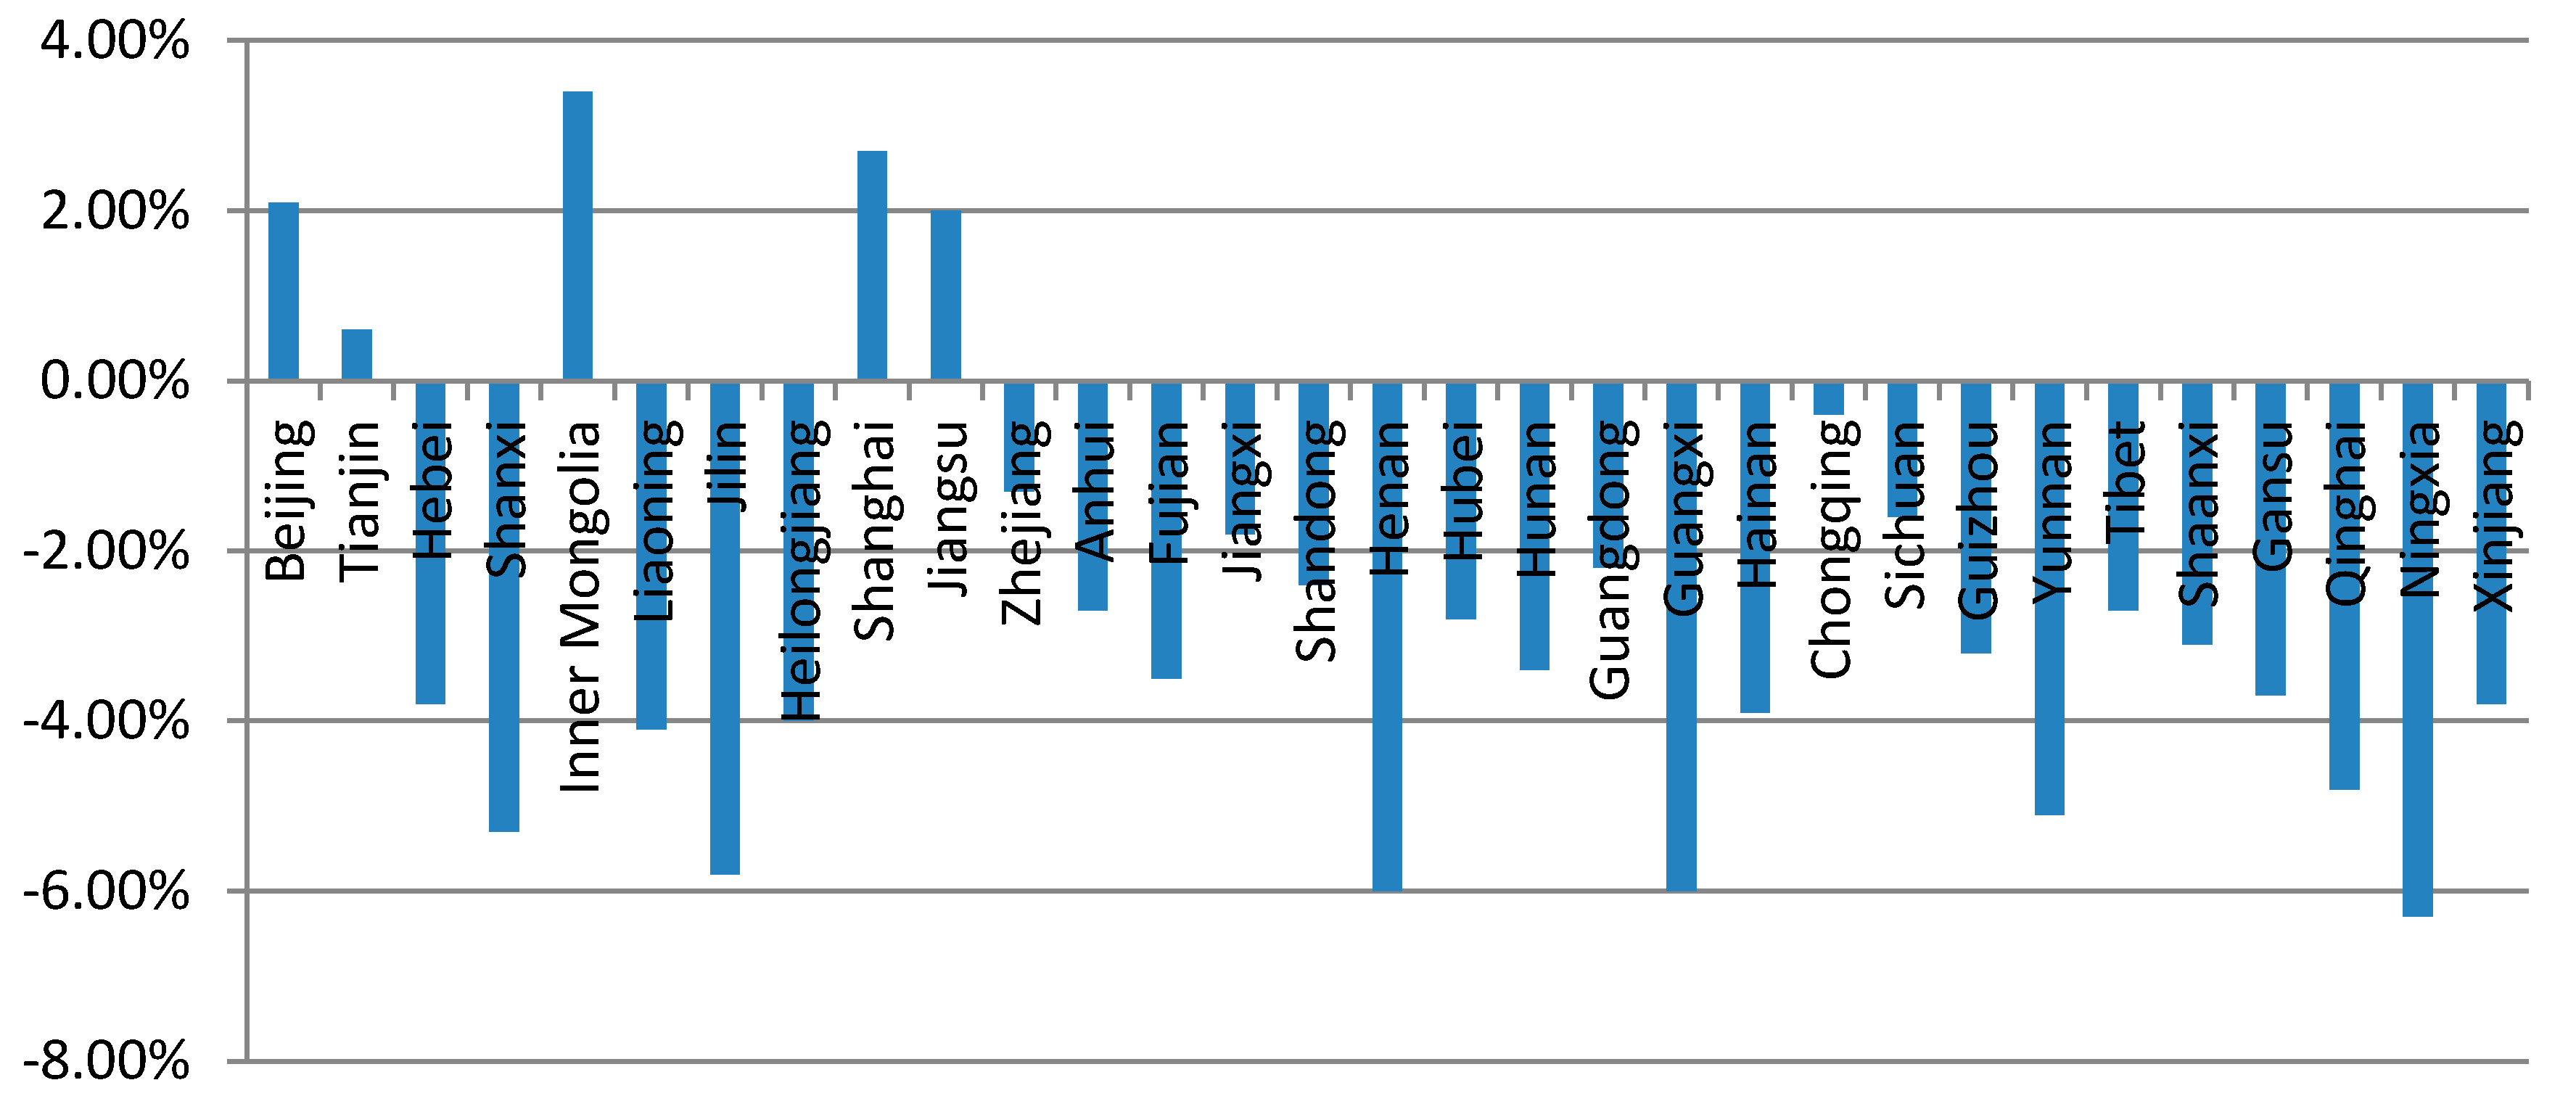
In order to observe the change characteristics of China’s total factor productivity, this study further calculated the changes in total factor productivity across provinces and regions over the sample period. Figure 2 shows that except Beijing, Tianjin, Inner Mongolia, Shanghai, and Jiangsu, most provinces have a downward trend in TFP. The Beijing, Tianjin, Shanghai, and Jiangsu provinces are regions with high level of economic development and rapid market-oriented reform, while the market-oriented reform process in other provinces and regions is slow. Furthermore, the central government had a large amount of investment and social security funds after the financial crisis. This confirms the lag of the market-oriented reform and the rapid growth of public investment after the financial crisis have a negative effect on productivity.
3.2. Measurement of Variables
Social security (SS). For the level of China’s social security, the official statistics published by China have changed, and now the statistical data are social security and employment expenditure. We used these statistical data to measure the scale of social security by the ratio of social security and employment expenditure to GDP. The data comes from the website of the National Bureau of Statistics of China.
Human capital (HC). The endogenous growth theory places significant emphasis on the role of human capital in technological advancement [3]. Human capital is related to the ability of the workforce to master new technologies and technological innovations [3,39]. According to our research hypothesis, the impact of social security on productivity has the threshold of human capital. Human capital is measured by the number of years in formal education, which includes primary school graduates for six years, junior high school graduates for nine years, high school graduates for 12 years, and junior college and above for 16 years. In China, because of the introduction of compulsory education system from 1986, the proportion of people who achieve high school education is more than 40%, and average number of years in formal education has changed from around 6 in the 1980s to around 10 in the present. The data of number of years in formal education comes from the Yearbook of China’s Population and the Yearbook of China’s Population and Employment Statistics.
We also controlled other factors that may affect productivity, such as research and development variables (RD). Countries with higher R&D capital have faster technological advances and productivity growth and promote sustained economic growth [39]. We used three patent grants per 100,000 people in each province as an R&D output indicator. The data come from the website of the National Bureau of Statistics of China.
The paper obtained the annual data of 31 provinces in the mainland of China, and Table 1 reports the mean and changes of the three independent variables of social security variables (SS), human capital (HC), and R&D (RD) from 2007 to 2016. Table 1 clearly shows that the proportion of social security expenditure in the Western region is significantly higher than that in the Eastern region in China, which is closely related to the government’s large inclined investment on social security in the backward regions such as Qinghai, Xinjiang, and Tibet in recent years. Regarding human capital and R&D, the average of the both indicators in the eastern region is significantly higher than that in the Central region and Western region, which are consistent with the level of economic development between these regions. Moreover, from the perspective of change values, the human capital or R&D growth is faster where the total factor productivity growth is faster, such as in Beijing, Tianjin, Shanghai, and Jiangsu. This may indicate that human capital and R&D are driving the growth of total factor productivity.
4. Does the Threshold Effect Exist?
According to our hypothesis, the impact of social security on productivity has the threshold of human capital. Therefore, we first tested whether this threshold effect exists based on the panel threshold model. The threshold model can divide the sample into different intervals according to the specific value (the threshold value) of a variable (the threshold variable); it makes the regression coefficient of the model have the characteristics of nonlinear conversion. Therefore, it can better capture the nonlinear characteristics of social security’s effect on productivity. The early literature on the threshold value of the model is generally subjectively set by the researcher. In order to avoid the bias caused by artificially dividing the threshold, this paper used the panel threshold model developed by Hansen [40] to determine the threshold and transition interval and to investigate the nonlinear structure of social security’s impact on productivity. Taking a single threshold model as an example, the benchmark model is as follows:
In Equation (5), i indicates the province and t indicates the year, whereas TFPCHA indicates the total factor productivity growth rate and is the explained variable. SS indicates the social security. Human capital (HC) is the threshold variable. is the control variables, which include human capital (HC) and research and development (RD). The endogenous growth theory places emphasis on the role of human capital and R&D investment in technological progress [3,39], which finds that both are important sources of productivity growth. is the threshold to be determined. is a characteristic function. When the inequality in parentheses is true, ’s value is 1, otherwise the value is 0. is used to control individual characteristics that are not observable in different provinces. is a random jamming term.
If is established in the single panel threshold model of Equation (5), it means that social security (SS) has different effects on productivity (TFPCH) and is nonlinear in a sample interval with low human capital () or high human capital (). In order to estimate Equation (5), the sample observations of each variable are subjected to intragroup de-averaging to eliminate the individual effects . Meanwhile, the sample observations of each variable are stacked, and the transformed model is in the form of a matrix, which is recorded as:
For a given threshold value , bring it into Equation (6) and perform an Ordinary Least Square estimation to obtain an estimate of the parameter of Equation (6):
Corresponding residual sum of squares is recorded as follows:
In the above formula, is the residual vector. Since the residual sum of squares is a function of the threshold value , it is possible to search for the value corresponding to the minimum :
Moreover, we can get , residual error , and the residual sum of squares .
After obtaining the parameter estimates, it is necessary to check whether the threshold effect is significant. The null hypothesis for Equation (5) is :, and the constructed F statistic is:
is the residual sum of squares obtained under the null hypothesis . Under the null hypothesis , the threshold cannot be recognized, and the distribution of F is nonstandard. Hansen [40] proposed using the “bootstrap” to obtain its progressive distribution and corresponding p-values.
The above analysis is only for a single threshold situation. When the sample data have multiple threshold characteristics, the above method can be extended to deal with them. For example, there are two threshold values of the model , . We tried to search for the estimated value of the first threshold value, and assumed that it is known, and then executed the same procedure to search for the second threshold value . is progressively active, but is not progressively effective. A solution is to fix and then return to search for again. After determining the estimated values of y1 and y2, the specific form of the model was determined. Therefore, the model parameters can be estimated, and relevant hypothesis testing and statistical inference were performed.
Based on Hansen’s method, the model was tested to determine the number of model thresholds in the absence of thresholds, single thresholds, and double thresholds, respectively. The F statistic corresponds to the number of different thresholds, and the model form is listed in Table 2. The probability p-value and its critical value were obtained by repeating sampling 1000 times by “Bootstrap”. The results in Table 2 show that the single threshold and double threshold effect are very significant, and the corresponding self-sampling p-value is 0.0020. Moreover, the triple-threshold effect is not significant, due to the self-sampling p-value being 0.4375. Therefore, the model should now be set to a double threshold model (the estimates for the two thresholds and their 95% confidence intervals are listed in Table 3). This part verifies our hypothesis that the impact of social security on productivity has a “double threshold’’ for human capital.
5. The Impact of Social Security on Productivity
5.1. Measurement Model Setting
In order to avoid the endogeneity of independent variables and the estimation bias caused by omitted variables, we did not follow Hansen [40] and did not directly estimate the impact of social security on productivity under the threshold effect model. This paper designed a dynamic panel model and determined the specific performance of the threshold effect by setting the cross terms. We controlled the first-order lag term of total factor productivity and introduced the cross-terms of social security, human capital level items, and squared terms in the model:
and represent the intersection of social security and human capital level and squared item, respectively. When the estimated coefficient of is significant and the estimated coefficient of is significantly positive, the impact of social security on total factor productivity may be the threshold of human capital mentioned in our hypothesis. is a time dummy variable to control cross-section dependence. The uneven development of China is an unavoidable fact. Therefore, we set the eastern dummy variable and the central dummy variable to control the apparent heterogeneity among the Eastern, Central, and Western regions.
Dynamic panel Genearl Moment Method(GMM) estimation can be divided into a one-step and two-step test. Since the standard deviation of the two-step estimate is downward biased and the bias will be reduced after adjustment by Windmeijer [41], it will result in an unpredictable approximate progressive distribution of the two-step GMM estimator. Therefore, a one-step GMM estimation is usually used in empirical applications [42].
5.2. Estimation Results and Analysis
Before using the dynamic panel GMM model for estimation, the unit root test is first performed on each variable. This paper uses the homogeneous Levin, Lin, and Chu [43] (LLC)tests and heterogeneous Im, Pesaran, and Shin [44] (IPS)tests to examine the unit root of the main variables:
Δ represents the first-order difference. is the tested variable and is the lag order. is the random disturbance term. The null hypothesis of the LLC and IPS tests is that the variable has a unit root in each section, but the LLC test assumes that the coefficient of is common across the sections, which belongs to the within-dimension tests. The IPS test allows to be different between different parts, which is a between-dimension test.
Table 4 reports the results of the unit root test for LLC and IPS panels. These results show that the tested variables basically reject the nonstationary hypothesis, which indicates that the rate of change in total factor productivity, social security expenditure, human capital, and R&D are basically stable. This paper examined the multivariate collinearity of the main variables and found that the average variance expansion factor VIF of all tests is less than 10, which indicates that the multicollinearity problem between the study variables is not serious and not substantive to the estimation results.
Based on the one-step system GMM method, the correlation model estimation results are shown in Table 5. The diagnostic test of each model shows that selecting the instrumental variables and their lag order is appropriate. The instrumental variables used in the one-step system GMM estimation of each model perform well. The AR(2) test results show that there is no second-order autocorrelation for the residual obtained by the difference equation. The Hansen test shows that the over-recognition condition is true. In Column I of Table 5, only social security (SS) is included as the main explanatory variable. The estimation coefficient of SS is negative, but not significant (Column I). Column II further introduces human capital (HC) and R&D based on the first column (RD) variable. Similar with the result of Column I, the coefficient of the social security variable is still not significant (Column II).
It is likely that the impact of social security on productivity is the threshold of human capital, which may lead to the estimation coefficient of the social security variable not being significant. We further report the estimation results of Equation (11), which are reported in Table 5 (Column III). These results show that the estimated coefficient of the social security variable is significantly positive. Moreover, the estimation coefficients of the two intersection terms of social security variables and human capital and are significant. Specifically, the estimation coefficient of is negative, and the estimation coefficient of is positive. These results show that the impact of social security on productivity growth has the threshold of human capital: When the level of human capital is low or high, the social security expenditure promotes sustained economic growth. When the level of human capital is at the middle, social security’s influence on sustainable growth is unobvious. These conclusions are consistent with our research hypothesis.
5.3. Robustness Test
The dynamic term estimation coefficient is large in our estimation results. In this case, the differential GMM estimation coefficients become inconsistent. The system GMM estimation uses the horizontal equation as the moment condition usually, so it is more reliable [45]. Han and Philips [45] pointed out that when the dynamic term coefficient is close to 1, conventional GMM estimation has the weak moment condition problem. Furthermore, conventional GMM estimation is suitable for large N (the number of cross-section), small T (the number of year), and the sample is hard to meet the condition sometimes. In order to deal with it, Han and Philips [45] designed a new method which can obtain an unbiased estimator when the dynamic term coefficient is close to 1 or N is not large enough. In our paper, the dynamic term coefficient is around 0.5, but the N of the sample is not enough for conditional GMM estimation. Thus, the paper used the Han–Philips moment estimation method for robustness examination.
There is the obvious spatial club effect for China’s economic development and national income level. We introduced spatial items to build a spatial panel model and obtain more robust estimation results to make our empirical model more realistic. Similar with the nonspatial panel metrology model, the spatial panel metrology model is divided into a static model and dynamic model. Due to the introduction of the dynamic lag term of the dependent variable, the estimation method of the dynamic space panel is needed. There are two main methods for estimating dynamic space panels. The first is the spatial error model, which uses the unconditional maximum likelihood function method (ML) proposed by Elhorst [46]. However, this method has no way to effectively control the endogeneity of variables. Therefore, this paper adopts another strategy to accept the setting of the spatial lag model, which is based on the spatial correlation of the control model. We used the dynamic moment system moment estimation and Han–Philips moment estimation to test the robustness. The robustness test results in Table 6 show that the estimated coefficient of is significantly negative and the estimation coefficient is significantly positive. These results suggest that the impact of social security on productivity growth has the threshold of human capital.
6. Conclusions and Policy Recommendations
China’s social security coverage has continued to expand, and the world’s largest social security system has been built during the past decade. Social security expenditure has grown rapidly [5]. This study explores the effect of social security on productivity and sustainable economic growth from the perspective of human capital. Based on provincial panel data of China from 2007 to 2016, the examination of panel threshold effect shows that the impact of social security on productivity has a “double threshold” on human capital. Moreover, the system estimation method of the dynamic panel model confirms the existence of this threshold effect: When the human capital level is low or high, social security expenditure is beneficial to the sustained economic growth. When the level of human capital is at the middle area, social security exerts unobvious influence on sustain growth. We used different methods to test the robustness of our conclusions, such as the Han–Philips moment estimation of the dynamic panel, the system moment estimation of the dynamic space panel, and the Han–Philips moment estimation, which showed that our conclusions are still valid.
The empirical results of this study have rich policy implications. On one hand, this study suggests that social security expenditure has to be coordinated with economic development and human capital. Moderate social security is conducive to the improvement of the welfare of the people and economic growth. Especially if the level of human capital is low, social security plays an important role in promoting productivity. Considering the current situation of China’s human capital levels, such as uneven regional development and large urban-rural differences, it is necessary to push the fiscal and social security expenditures to the Central–Western regions and rural areas where human capital is relative low, which will exert more positive influence on sustainable growth. On the other hand, we found that improvement of human capital is the key to breaking through the “growth trap”. Therefore, it is necessary to coordinate investment in areas to improve the level of national education with investment in social security. This is a feasible way to cross the middle-income trap for China.
Author Contributions
M.Z. conceived the main idea of the theoretical framework and manuscript drafting. X.Z. and L.S. did the literature review, related empirical analysis, and paper revisions.
Funding
This research was funded by the Fundamental Research Funds for Central Universities (No. SWU1709251 and No. SWU1709123) and the Chongqing Social Science Fund (No. 2017YBZX016 and No. 2016ZDSH04).
Conflicts of Interest
The authors declare no conflict of interest.
References
- Butter, F.A.G.D.; Kock, U. Social Security, Economic Growth and Poverty: Theoretical Considerations and Guidelines for Institutional Arrangements. Res. Memo. 2001, 5, 1–21. [Google Scholar]
- Sala-I-Martin, X. A Positive Theory of Social Security. Scand. J. Econ. 1996, 1, 277–304. [Google Scholar] [CrossRef]
- Lucas, R.E. On the Mechanics of Economic Development. J. Monet. Econ. 1988, 22, 3–42. [Google Scholar] [CrossRef]
- Fan, G.; Zhang, X.J. Welfare catching up and growth trap: Lessons from Latin America. Manag. World 2008, 9, 12–24. (In Chinese) [Google Scholar]
- Zheng, B.W. 40 years of social security in China: Experience summary and reform orientation. Chin. Popul. Sci. 2018, 4, 2–17. (In Chinese) [Google Scholar]
- Zhang, Y.H. The structural contradiction between Latin America’s welfare catching up and social expenditure. Comp. Econ. Soc. Syst. 2018, 4, 139–147. (In Chinese) [Google Scholar]
- Barro, R.J. Government Spending in A Simple Model of Endogenous Growth. J. Political Econ. 1990, 98, 103–126. [Google Scholar] [CrossRef]
- Feldstein, M. Social Security, Induced Retirement, and Aggregate Capital Accumulation. J. Political Econ. 1974, 82, 905–926. [Google Scholar] [CrossRef]
- Kotlikoff, L.J. Privatization of Social Security: How it Works and Why it Matters. Tax Policy Econ. 1996, 10, 1–32. [Google Scholar] [CrossRef]
- Sun, Y.X.; Xiao, Z.G. The reform of social security system and the rebalancing of China’s internal and external economy. Financ. Res. 2013, 6, 74–88. (In Chinese) [Google Scholar]
- Jia, J.X.; Guo, Q.W.; Ning, J. Traditional cultural beliefs, social security and economic growth. World Econ. 2011, 8, 3–18. (In Chinese) [Google Scholar]
- Guo, K.M.; Gong, L.T. Social Security, Family Pension and Economic Growth. Financ. Res. 2012, 1, 78–90. (In Chinese) [Google Scholar]
- Lu, C.C.; Liu, H.J. Does Social Security Promote Regional Economic Growth? A Dynamic Spatial Panel Model Analysis Based on Time and Space Effect and Decomposition. J. Huazhong Univ. Sci. Technol. (Soc. Sci. Ed.) 2017, 2, 55–66. (In Chinese) [Google Scholar]
- Glomm, G.; Kaganovich, M. Distributional Effects of Public Education in an Economy with Public Pensions. Int. Econ. Rev. 2003, 44, 917–937. [Google Scholar] [CrossRef]
- Nelson, R.; Phelps, E. Investment in Humans, Technological Diffusion and Economic Growth. Am. Econ. Rev. 1966, 56, 69–75. [Google Scholar]
- Scicchitano, S. On the complementarity between on-the-job training and R&D: A brief overview. Econ. Bull. 2007, 15, 1–11. [Google Scholar]
- Benhabib, J.; Spiegel, M. The Role of Human Capital in Economic Development Evidence from Aggregate Cross Country Data. J. Monet. Econ. 1994, 34, 143–173. [Google Scholar] [CrossRef]
- Redding, S. Low-skill, Low-quality Trap: Strategic Complementarities between Human Capital and R&D. Econ. J. 1996, 106, 458–470. [Google Scholar] [CrossRef]
- Scicchitano, S. Complementarity between Heterogeneous Human Capital and R&D: Can Job-training Avoid Low Development Traps? Empirica 2010, 37, 361–380. [Google Scholar] [CrossRef]
- Anand, S.; Ravallion, M. Human Development in Poor Countries: On the Role of Private Incomes and Public Services. J. Econ. Perspect. 1993, 7, 133–150. [Google Scholar] [CrossRef] [Green Version]
- Nordhaus, W.D. The Health of Nations: Irving Fisher and the Contribution of Improved Longevity to Living Standards. Cowles Found. Discuss. Pap. 1998, 64, 399–405. [Google Scholar] [CrossRef]
- Barro, R.J. Determinants of Economic Growth: A Cross Country Empirical Study. Am. J. Agric. Econ. 2003, 85, 1087–1088. [Google Scholar] [CrossRef]
- Fogel, R.W. Economic Growth, Population Theory, and Physiology: The Bearing of Long Term Processes on the Making of Economic Policy. Am. Econ. Rev. 1994, 84, 369–395. [Google Scholar] [CrossRef]
- Mimoun, M.B.; Raies, A. Education and Economic Growth: The Role of Public Expenditures Allocation. Econ. Bull. 2009, 29, 2404–2416. [Google Scholar]
- Pietro, G.D. Equality of Opportunity in Italian University Education: Is There Any Role for Social Welfare Spending. Int. J. Educ. Dev. 2003, 23, 5–15. [Google Scholar] [CrossRef]
- Fan, J.B.; Yang, T.Y. Social Welfare Expenditure, Human Capital and China’s Economic Growth—Based on the Research of Provincial Panel Data. Contemp. Econ. Manag. 2012, 7, 13–18. (In Chinese) [Google Scholar]
- Guo, Q.W.; Jia, J.X.; Zhao, Z.Y. Chinese Traditional Cultural Beliefs, Human Capital Accumulation and Family Endowment Security Mechanism. Econ. Res. 2007, 8, 58–72. [Google Scholar]
- Peng, H.R.; Shen, S.G. Pay-as-you-go pension insurance and economic growth: Theoretical model and Chinese experience. World Econ. 2007, 10, 67–75. (In Chinese) [Google Scholar]
- Lin, Z.J.; Gong, L.T. Retirement age, years of education and social security. China Econ. Q. 2008, 1, 211–230. (In Chinese) [Google Scholar]
- Ehrlich, I.; Kim, J. Social Security, Demographic Trends, and Economic Growth: Theory and Evidence from the International Experience. Rev. Econ. Dyn. 2007, 10, 55–77. [Google Scholar] [CrossRef]
- Shen, Y. The Impact of Social Security on Human Capital and Its Economic Growth—Based on China’s Data from 1989 to 2008. Soc. Secur. Res. 2012, 4, 69–76. (In Chinese) [Google Scholar]
- Caliendo, F.; Findley, T.S. Myopia, Education, and Optimal Social Security. SSRN Electron. J. 2018, 1, 1–37. [Google Scholar] [CrossRef]
- Bucciol, A.; Cavalli, L.; Fedotenkov, I. A large scale OLG model for the analysis of the redistributive effects of policy reforms. Eur. J. Political Econ. 2017, 48, 104–127. [Google Scholar] [CrossRef]
- Zhou, H.; Tang, L.R. Can market competition force companies to be kind to employees?—Micro evidence from manufacturing companies. Manag. World 2015, 11, 135–144. (In Chinese) [Google Scholar]
- Easterly, W.; Levine, R. It’s Not Factor Accumulation: Stylized Facts and Growth Models. World Bank Econ. Rev. 2001, 15, 177–219. [Google Scholar] [CrossRef]
- Fare, R.S.; Grosskopf, S.; Norriss, M.; Zhang, Z. Productivity Growth, Technical Progress, and Efficiency Change in Industrialized Countries. Am. Econ. Rev. 1994, 84, 66–83. [Google Scholar] [CrossRef]
- Lai, P.Y. Productivity Dilemma of China’s Economic Growth: Expanding Growth under Investment. World Econ. 2016, 39, 75–94. (In Chinese) [Google Scholar]
- Zhong, S.C.; Mao, Y.H. Re-measurement and Decomposition of China’s Total Factor Productivity—Based on the Perspective of Multi-factor Technology Progressive Deviation. Econ. Rev. 2017, 1, 3–14. (In Chinese) [Google Scholar]
- Romer, M.P. Endogenous Technological Change. J. Political Econ. 1990, 98, 71–102. [Google Scholar] [CrossRef]
- Hansen, B.E. Threshold Effects in Non-Dynamic Panels: Estimation, Testing, and Inference. J. Econom. 1999, 93, 345–368. [Google Scholar] [CrossRef]
- Windmeijer, F. A Finite Sample Correction for The Variance of Linear Efficient Two-Step GMM Estimators. J. Econom. 2005, 126, 25–51. [Google Scholar] [CrossRef]
- Bond, S.R. Dynamic Panel Data Models: A Guide to Micro Data Methods and Practice. Port. Econ. J. 2002, 1, 141–162. [Google Scholar] [CrossRef]
- Levin, A.; Lin, C.F.; Chu, C. Unit Root Tests in Panel Data: Asymptotic and Finite-sample Properties. J. Econom. 2002, 108, 1–24. [Google Scholar] [CrossRef]
- Im, K.S.; Pesaran, M.; Shin, Y. Testing for Unit Roots in Heterogeneous Panels. J. Econom. 2003, 115, 53–74. [Google Scholar] [CrossRef]
- Han, C.; Phillips, C.B. GMM Estimation for Dynamic Panels with Fixed Effects and Strong Instruments at Unity. Econom. Theory 2010, 26, 119–151. [Google Scholar] [CrossRef]
- Elhorst, J.P. Unconditional Maximum Likelihood Estimation of Linear and Log-linear Dynamic Models for Spatial Panels. Geogr. Anal. 2005, 37, 85–106. [Google Scholar] [CrossRef]
Figure 1.
The changes in total factor productivity from 2007 to 2016.

Figure 2.
The changes of provinces’ total factor productivity in average from 2007 to 2016.

Table 1.
Sample mean and intertemporal change values of the main variables. SS: Social security. HC: Human capital. RD: Research and development.
Table 1.
Sample mean and intertemporal change values of the main variables. SS: Social security. HC: Human capital. RD: Research and development.
| Mean | Changes from 2007 to 2016 | Mean | Changes from 2007 to 2016 | Mean | Changes from 2007 to 2016 | |
|---|---|---|---|---|---|---|
| Beijing | 0.0227 | 0.0097 | 11.5894 | 1.2187 | 2.4693 | 3.7363 |
| Tianjin | 0.0164 | 0.0060 | 10.2753 | 0.9657 | 1.3344 | 2.0430 |
| Hebei | 0.0194 | 0.0100 | 8.6279 | 0.8078 | 0.2109 | 0.3489 |
| Shanxi | 0.0332 | 0.0112 | 9.1641 | 0.9193 | 0.1703 | 0.2146 |
| Inner Mongolia | 0.0281 | 0.0118 | 8.9235 | 1.3263 | 0.1235 | 0.1779 |
| Liaoning | 0.0343 | 0.0154 | 9.5547 | 0.9848 | 0.4150 | 0.3497 |
| Jilin | 0.0300 | 0.0045 | 9.1443 | 0.7367 | 0.2044 | 0.2611 |
| Heilongjiang | 0.0365 | 0.0170 | 9.0803 | 0.6760 | 0.3280 | 0.3625 |
| Shanghai | 0.0232 | 0.0131 | 10.6278 | 0.5895 | 1.9471 | 1.4680 |
| Jiangsu | 0.0098 | 0.0034 | 9.0217 | 1.0771 | 2.1356 | 2.4769 |
| Zhejiang | 0.0093 | 0.0076 | 8.7448 | 1.0102 | 2.6584 | 3.1456 |
| Anhui | 0.0281 | 0.0032 | 8.1148 | 1.3206 | 0.5357 | 0.9284 |
| Fujian | 0.0109 | 0.0023 | 8.4528 | 0.9789 | 0.7958 | 1.5183 |
| Jiangxi | 0.0264 | 0.0097 | 8.6141 | 0.5043 | 0.2303 | 0.6380 |
| Shandong | 0.0117 | 0.0048 | 8.6407 | 0.8030 | 0.6336 | 0.7425 |
| Henan | 0.0217 | 0.0076 | 8.5574 | 0.6315 | 0.2644 | 0.4408 |
| Hubei | 0.0252 | 0.0073 | 8.9187 | 0.8739 | 0.3874 | 0.5946 |
| Hunan | 0.0256 | 0.0043 | 8.7694 | 0.9405 | 0.2881 | 0.4096 |
| Guangdong | 0.0113 | 0.0053 | 9.1226 | 0.9326 | 1.3709 | 1.7707 |
| Guangxi | 0.0235 | 0.0104 | 8.3603 | 0.7295 | 0.1402 | 0.2671 |
| Hainan | 0.0389 | 0.0168 | 8.7864 | 0.7969 | 0.1204 | 0.1764 |
| Chongqing | 0.0336 | 0.0064 | 8.4470 | 1.3492 | 0.6592 | 1.2248 |
| Sichuan | 0.0324 | 0.0143 | 8.0518 | 0.8696 | 0.4505 | 0.6336 |
| Guizhou | 0.0321 | 0.0066 | 7.4636 | 0.9238 | 0.1722 | 0.2457 |
| Yunnan | 0.0435 | 0.0111 | 7.4800 | 1.2066 | 0.1271 | 0.2048 |
| Tibet | 0.0913 | 0.1304 | 4.8223 | 0.4675 | 0.0505 | 0.0505 |
| Shaanxi | 0.0316 | 0.0062 | 8.9425 | 0.8726 | 0.4660 | 1.1777 |
| Gansu | 0.0543 | 0.0250 | 7.8999 | 1.3820 | 0.1391 | 0.2653 |
| Qinghai | 0.0844 | 0.0121 | 7.5619 | 0.6157 | 0.1010 | 0.1886 |
| Ningxia | 0.0371 | 0.0241 | 8.3998 | 1.3329 | 0.1765 | 0.3481 |
| Xinjiang | 0.0341 | 0.0265 | 8.8457 | 0.5870 | 0.1737 | 0.2235 |
Table 2.
Threshold effect test.
| Threshold Model | F Value | P | 10% Threshold Value | 5% Threshold Value | 1% Threshold Value |
|---|---|---|---|---|---|
| Single threshold | 10.313 | 0.0020 | 2.9113 | 4.1216 | 6.5654 |
| Double threshold | 8.7487 | 0.0020 | 2.6150 | 3.8296 | 6.3304 |
| Triple threshold | 0.6102 | 0.4375 | 2.9795 | 4.0144 | 7.0600 |
Table 3.
Threshold Estimation.
| Threshold | Estimated Value | 95% Confidence Interval |
|---|---|---|
| First threshold value | 7.5138 | [7.5138, 8.0390] |
| Second threshold values | 9.3523 | [7.7525, 9.8776] |
Table 4.
Unit root test. LLC: IPS: TFPCH: Total factor productivity change index.
| LLC Test | IPS Test | |
|---|---|---|
| −4.5832(0.0000) | −4.0892(0.0000) | |
| −10.0108(0.0000) | −7.2362(0.0000) | |
| −6.8059(0.0000) | −4.9425(0.0000) | |
| −1.7075(0.0439) | −5.9247(0.0000) |
Note: The p-value corresponding to the statistic value in parentheses.
Table 5.
Empirical test based on dynamic panel system GMM estimation.
| I | II | III | |
|---|---|---|---|
| 0.4787 (12.79) *** | 0.5087 (8.83) *** | 0.4401 (5.51) *** | |
| −0.2070 (−1.17) | −0.0098 (−0.05) | 1.3694 (2.15) ** | |
| 0.0039 (2.00) * | |||
| 0.0061 (2.32) ** | 0.0084 (2.81) *** | ||
| −0.4438 (−2.50) ** | |||
| 0.0334 (2.51) ** | |||
| 0.0001 (0.02) | −0.0047 (−0.64) | −0.0104 (−1.60) | |
| −0.0056 (−1.39) | −0.0034 (−0.64) | −0.0088 (−1.51) | |
| Constant term | 0.3299 (7.49) *** | 0.3052 (4.20) *** | 0.3956 (4.67) *** |
| AR(2) | 0.458 | 0.408 | 0.474 |
| Hansen | 1.000 | 1.000 | 1.000 |
| Difference-in-Hansen | 1.000 | 1.000 | 1.000 |
Note: *, **, *** are significant at the 10%, 5%, and 1% levels, respectively. t-statistics reported in brackets. The Hansen test, the difference-in-Hansen test, and the AR(2) test report the p-values of the corresponding statistics. The time dummy variables are controlled in each model, and the space is not reported. The number of samples is 10*31 = 310.
Table 6.
Robustness test.
| Ⅳ Han–Philips Moment Estimator | Ⅴ Space System Moment Estimator | Ⅵ Space Han–Philips Moment Estimator | |
|---|---|---|---|
| 0.3618 (0.96) | 0.3799 (1.01) | 0.3459 (0.91) | |
| 3.4918 (1.50) | 4.6900 (2.08) ** | 3.4639 (1.50) | |
| 0.0165 (1.96) * | 0.0156 (1.98) ** | 0.0123 (1.33) | |
| −1.1354 (−1.64) * | −1.4666 (−2.20) ** | −1.1054 (−1.65) * | |
| 0.0767 (1.68) * | 0.1040 (2.21) ** | 0.0733 (1.63) * | |
| −0.0217 (−1.42) | −0.0075 (−0.48) | −0.0243 (−1.58) | |
| −0.0196 (−1.52) | −0.0165 (−1.36) | −0.0243 (−1.81) * | |
| Constant term | 0.6285 (51.72) *** | 0.5819 (33.44) *** | 0.6406 (50.60) *** |
| Space item | 0.0067 (2.17) ** | 0.0002 (1.13) | |
| Wald-test | 19.49 | 26.95 | 21.01 |
| F-test | 2.49 | 3.37 | 2.63 |
Note: *, **, *** are significant at 10%, 5%, and 1%, respectively, and t-statistics in parentheses; Wald test, F test report corresponding statistics; sample number is 10*31 = 310. The adjacency matrix between provinces used by the space matrix.
© 2019 by the authors. Licensee MDPI, Basel, Switzerland. This article is an open access article distributed under the terms and conditions of the Creative Commons Attribution (CC BY) license (http://creativecommons.org/licenses/by/4.0/).
Share and Cite
MDPI and ACS Style
Zhang, M.; Zou, X.; Sha, L. Social Security and Sustainable Economic Growth: Based on the Perspective of Human Capital. Sustainability 2019, 11, 662. https://doi.org/10.3390/su11030662
AMA Style
Zhang M, Zou X, Sha L. Social Security and Sustainable Economic Growth: Based on the Perspective of Human Capital. Sustainability. 2019; 11(3):662. https://doi.org/10.3390/su11030662
Chicago/Turabian StyleZhang, Ming, Xiaorong Zou, and Long Sha. 2019. "Social Security and Sustainable Economic Growth: Based on the Perspective of Human Capital" Sustainability 11, no. 3: 662. https://doi.org/10.3390/su11030662
Note that from the first issue of 2016, this journal uses article numbers instead of page numbers. See further details here.