Interaction Effects between Technology-Driven Urbanization and Eco-Environment: Evidence from China’s East Zhejiang Region

1
Faculty of Economics and Management, Zhejiang A&F University, Yijin St, Lin’an, Hangzhou 311300, China
2
Zhejiang Province Key Cultivating Think Tank—Research Academy for Rural Revitalization of Zhejiang Province, Zhejiang A&F University, Yijin St, Lin’an, Hangzhou 311300, China
*
Authors to whom correspondence should be addressed.
Sustainability 2019, 11(3), 836; https://doi.org/10.3390/su11030836
Submission received: 30 December 2018
/
Revised: 1 February 2019
/
Accepted: 3 February 2019
/
Published: 6 February 2019
(This article belongs to the Special Issue Building Regional Sustainability in Urban Agglomeration: Theories, Methodologies, and Applications)
Abstract
:With the rapid pace of urbanization in populous regions, the conflict between economic development and eco-environment becomes increasingly notable, inducing policy makers to implement new technological solutions for regional sustainable growth. Choosing the East Zhejiang region in China as a case study, this paper reveals the interaction effects between technology-driven urbanization and eco-environment, by compiling novel indexes for factors such as the degree of urbanization, environmental pressure, environmental protection, and environmental quality from 2005 to 2014, and adopting a data-intensive systemic approach. Differing from previous literature, an inverted “U” structure and panel vector autoregressive model are constructed to show that: (i) Given the acceleration of technology-driven urbanization, its surrounding eco-environment is still likely to be under greater pressure; (ii) the relationships between technology-driven urbanization and environmental factors in different regions are heterogeneous, either with a normal U-shaped curve or an inverted U-shaped curve; and (iii) the two-way interaction effects are significantly unbalanced, with long-term contribution rates of environmental quality and pressure on urbanization to be 57.8% and 78.88%, respectively, which is higher than the reversal effect. This study provides scientific reference for urban planning and advocates that more technological innovations should be implemented to help maintain sustainable urbanization processes.
JEL Classification:
E20; E61; O18; O11; O32; O44; Q51; Q571. Introduction
There is a very complicated coupling relationship between urbanization processes and eco-environmental factors. Globally, the acceleration of urbanization has posed a real threat to its surrounding eco-environment (Button [1]). How to maintain sustainable green growth becomes an important issue that both academia and policy makers pay close attention to, which is not only a key component for a country’s short-term urban plan, but also the very way leading to long-term strategic development; policy makers start to implement technological innovations for green growth and sustainable resource management (Houkai [2]). China, a fast developing country with a catching-up urbanization rate and troublesome environmental problems in recent years, provides us with a good opportunity to study the interaction effects between technology-driven urbanization and the eco-environment, especially given the circumstance that this country is currently undergoing a huge transition from traditional labor-intensive economy to technology-based economy (Liu et al. [3]).
After the reform and opening up, the progress of urbanization in China was mainly from the rapid development of small towns in rural areas (Wang et al. [4] and Wu [5]). Due to a lack of environmental protection there, population over-expansion has caused many serious environmental problems, bringing smog, trash, and polluted water to the nature (Seto et al. [6]). With the improvement of people’s living standard and increasing public awareness of the importance to maintain sustainable economic growth compatible with the surrounding environment, China’s President Xi Jinping makes it crystal clear that the the policy of “sustainable green growth” must be taken into account in the process of urbanization, which emphasizes technology-driven and green/low-carbon solutions (Liu et al. [3]). The urbanization rate has reached 63.2%, 10.6% higher than the country’s average in the Zhejiang Province (Xu [7]; Houkai [2]). The provincial government has published a five-year plan, stating that they will spend over 900 billion in R&D to upgrade the region’s overall technological infrastructure and green city maintenance, such as go-paperless public vehicles, facial-recognition passageways, and GPS-positioned electronic buses (Wang [8]).
According to Han et al. [9], it is essential for policy makers to understand the dynamics between urbanization and environmental changes, based on large-scale regional evidence and systemic analysis through rigorous data-intensive approaches. In this paper, we pick the East Zhejiang region in China as the target, for the main reason that this large-scale urbanization agglomeration is one of the richest and most innovative regions in China based on disposable income per capita, with total GDP of around $8,000 billion in 2017, a record of first human habitation over 50,000 years ago, and technological firms similar to Silicon Valley in the United States (Batty [10] and Lee [11]). The co-existing drives for urban life and the compelling calls from the nature make it a suitable setting to find answers to our academic inquiry with regard to the interaction effects between technology-driven urbanization and eco-environment. Adopting a principal component analysis and a panel vector autoregressive model, we compile indexes for the degrees of technology-driven urbanization, environmental protection, environment quality, and environmental pressure. We find that a U-shaped structure exists for the target relationship, with heterogeneity over different regions. We also find that changes of regional environmental factors have a more significant impact on the urbanization process than it does on the reversal effect, especially the emission of CO2. The two-way interaction effects are therefore significantly unbalanced, with long-term contribution rates of environmental quality and pressure on urbanization to be 57.8% and 78.88% respectively, which is much higher than the reverse.
This paper contributes to the relative literature in three aspects: Firstly, novel indexes for technology-driven urbanization, environmental quality, environmental pressure, and environmental protection are constructed based on rigorous econometric modeling, which helps clarify some modeling issues in prior literature. Secondly, the empirical analysis in this paper documents first-hand evidence regarding the interaction effects between technology-driven urbanization and the eco-environment, which reveal answers as to whether the current level of technology innovations can actually promote long-term sustainable growth. This seems to suggest that it requires more technology investment in developing countries like China to have technology innovations play a real significant positive role on the environment. Lastly, this paper gives advice on urban planning for sustainable growth and calls for policy makers’ attention in putting more emphasis on technology development and environmental protection, which can be fully integrated in the urbanization process.
The rest of the paper is organized as the following: In Section 2, past literature is discussed and summarized to point out the current findings in this area; in Section 3, research methods are introduced, with analysis on the U-shape theory and panel vector autoregressive model; in Section 4, empirical study is carried out to further document the evidence regarding the target relationship; lastly, Section 5 concludes the paper and outlines a few take-aways.
2. Literature Review
The eco-environment problems in the process of urbanization have been one of scholars’ focuses globally. For example, Meadows [12], Cleveland et al. [13], and Arrow [14] believe that the economic development will exert pressure on the environment. When this pressure exceeds the carrying capacity of the environment, the eco-system will collapse. Therefore, environmental protection must be emphasized to ensure the balanced development of the environment and the economy. In Chinese studies, Xu et al. [15] studies the environmental impact of mining and urban erosion in Tsinling Mountains by remote sensing and the Geographic Information System (GIS). They find that the eco-system is most affected by the mining business in Feng, Shanxi and Baokang Counties, Hubei, China. Due to the influence of mining and urban erosion, the plight of the Tsinling Mountains sustainable eco-system is deteriorating. Infrastructures such as airport construction, tourist resorts, and real estate development have exacerbated the environmental problems. Ding and Peng [16] use high quality image data in 2000–2010 and take Dali Bai Autonomous Prefecture hospitals as an example. They comprehensively analyze the impacts of human activities on mountain environment from three perspectives, including urbanization, land use, and ecological carrying capacity. The results show that there is a mismatch effect between urbanization and environment status. With the urbanization process speeding up, the excessive and unreasonable development produces severe challenges to the sensitive ecological system.
On the other hand, researchers also find contradictory results regarding the relationship between urbanization and the eco-environment. Beckerman [17] believes that economic development is an effective means of environmental protection. Wang and Mao [18] take the Xiangxi Autonomous Prefecture of Wuling Mountain Area in China as the research object and establish an index system to uncover the dynamic relationship between urbanization and the eco-environment response. By using principal component analysis and adopting an impulse response function with variance decomposition, they find that the current urbanization in Xiangxi Autonomous Prefecture China leaves a positive effect rather than negative effects on the overall eco-environment quality measure and the environment pressure index. This positive influence implies that urbanization actually brings more positive benefits to the eco-environment. Liu [19] argues that the model of green city as one key way of urbanization is helpful for saving land and reducing the resources and energy waste. Lower energy consumption of green city will not necessarily lead to economic recession and lower the quality of life. By developing green economy and ecological management, it can effectively avoid the chaotic development of urban expansion, improve the quality of urban environment, and solve the environmental problems in the process of urbanization simultaneously.
In addition, researchers invent novel baseline hypotheses to test the target relationship between urbanization and eco-environment. Grossman and Krueger [20] propose an inverted “U”-shaped EKC curve hypothesis to examine the quantitative relationship between urbanization and the eco-environment. Based on this hypothesis, Hubacek et al. [21] introduce the basic idea of pollution coefficient in a basic IO model, considering all types of environmental pollution and resource consumption coefficients. They compare the quality of Chinese life and the change of the eco-environment in 2001 and 2020. The result shows that, while China is achieving economic growth, it will also suffer from a significant increase in the pressure on ecosystem services. Du and Liu [22] collect panel data of China’s 30 provinces and build six grades of environment pollution indicators to extend the EKC hypothesis.
Apart from that, researchers also construct several models for empirical tests on the target relationship. Henderson [23] takes the perspective of urban population and believes that the aggregation of urban population has an optimal scale, which will produce a serious threat to the eco-environment of the surrounding areas. York et al. [24], on the basis of introducing IPAT and ImPACT model, put forward a bilogarithmic model that can be decomposed and applied to the analysis. Hossain et al. [25] first considers the complex dynamics of social eco-systems through the system dynamics model (SD), based on climate change and current subsidy withdrawal policies. Their results show that withdrawal of 50% of the agricultural subsidies would result in higher temperature (2 °C) and rising sea levels. The results of the survey highlight the negative impact of this global policy and suggest that the World Trade Organization’s (WTO) cancellation of agricultural subsidies actually put agriculture ecosystems at risk. Liu et al. [26] constructs the evaluation model of urbanization and eco-environment quality, which can effectively distinguish different development levels of the coordination. Qiao and Fang [27] establishes the idea of system evolution in a dynamic coupling model between urbanization and the eco-environment by means of the system theory, on the basis of mutual coercion and evolution mechanism. Rong and Fang [28] calculate the matching degree and interaction of urbanization and eco-environment in Anhui Province China by the entropy method and gravity model, based on the comprehensive index of urbanization and eco-environment for 2005–2014. The results show that the degree of urbanization is rising, while the eco-environment quality is declining. The evolution trajectory of urbanization and eco-environment matching degree is M type, but the overall matching degree is poor. Sun et al [29] and Chen et al. [30] use the coupling coordination degree model, together with Yangtze river delta urban agglomeration data, to analyze the spatial characteristics and driving mechanism. Research shows that the coupling degree is the change of the inverted “U” curve and has the remarkable features of space agglomeration. At present, the new urbanization and ecological carrying capacity is in the transitional stage, while the overall coordination is in the low coordination stage. Li et al. [31] use Jiangsu Province in China as an example and adopt remote sensing and geographic information technology to estimate the net primary productivity of the area. By using an improved Carnegie-Ames-Stanford Approach (CASA) model and introducing piecewise linear regression method to evaluate influence of the urbanization process of Net Primary Productivity (NPP), they show that the urban land expansion for construction purpose is slowly rising; productivity of terrestrial ecosystems is also following a slowly rising trend, reflecting that the urban forest land, grassland, and farmland NPP compensate for the regional eco-system productivity loss.
To sum up, most scholars in this field focus on the driving mechanisms, evaluation methods, the coupling interactions, and the causal analysis between urbanization and the eco-environment. However, few papers provide exact quantitative measurements of the degree of urbanization and environmental factors based on scientific methodologies. Moreover, past literature fails to document direct evidence from a large-scale region where its urbanization process is partially driven by technology innovations and strongly conflicts with its surrounding eco-environment, such as cities in a major developing country. In fact, taking the technology-driven urbanization road is the inevitable direction of China’s economic transformation and development. Therefore, this paper takes Zhejiang Province in China as an example and uses panel data of 11 prefecture-level cities from 2005–2014 to conduct empirical research on the relationship between technology-driven urbanization and the eco-environment, in which the technology-driven urbanization is defined as urbanization driven by the introduction and agglomeration of regional education and expenditure on scientific undertakings. On the one hand, the inverted “U” structure relationship of urbanization and eco-environmental protection, quality, and pressure are qualitatively analyzed, on the other hand, through the unit root and co-integration test of panel data, a PVAR model is established to further quantify the interaction effects between technology-driven urbanization and the eco-environment. It is therefore expected that this study will provide a solid quantitative scientific decision-making basis for future relevant studies.
3. Research Methods
In order to find out the realistic characteristics of Zhejiang region in the Yangtze River Delta, which is a representative region of China, this paper first introduces the famous U-shaped structure theory of interaction between urbanization and the ecological environment. Secondly, embedded technology-driven urbanization index and eco-environmental indexes in different latitudes are constructed by the principal component analysis (PCA) method. Further, the U-shaped relationship between technology-driven urbanization and the ecological environment is revealed by visual and intuitive curve relationship. Finally, the indexes in different latitudes are incorporated into the dynamic panel vector autoregressive model to discuss the degree and effect of the interaction between technology-driven urbanization and ecological environment.
The main considerations of the methods used in this paper are as follows: (1) The Principal Component Analysis (PCA) method can not only objectively and data-driven realize the weight distribution between the urbanization and the multi-dimensional evaluation indexes of ecological environment, but also ensures that the original highly correlated indexes are converted to the comprehensive score index under the contribution rate of the unrelated components by the orthogonal linear transformation algorithm. (2) The dynamic panel autoregressive model is more suitable for research on the interaction effects between technology-driven urbanization and the eco-environment. The reason lies in the obvious time lag, dynamics, and endogeneity between technology-driven urbanization and the ecological environment. The nonlinear models such as supervised machine learning methods’ advantages may lie in data-driven modeling and the accuracy of prediction and may not be able to achieve the desired analytical purpose.
The following section will introduce the theory and the measurement model used in this paper, including unit root test and integration test methods for panel data. The corresponding empirical analysis can be found in Section 4.
3.1. “U” Structure of the Interaction Effects between Urbanization and Eco-environment
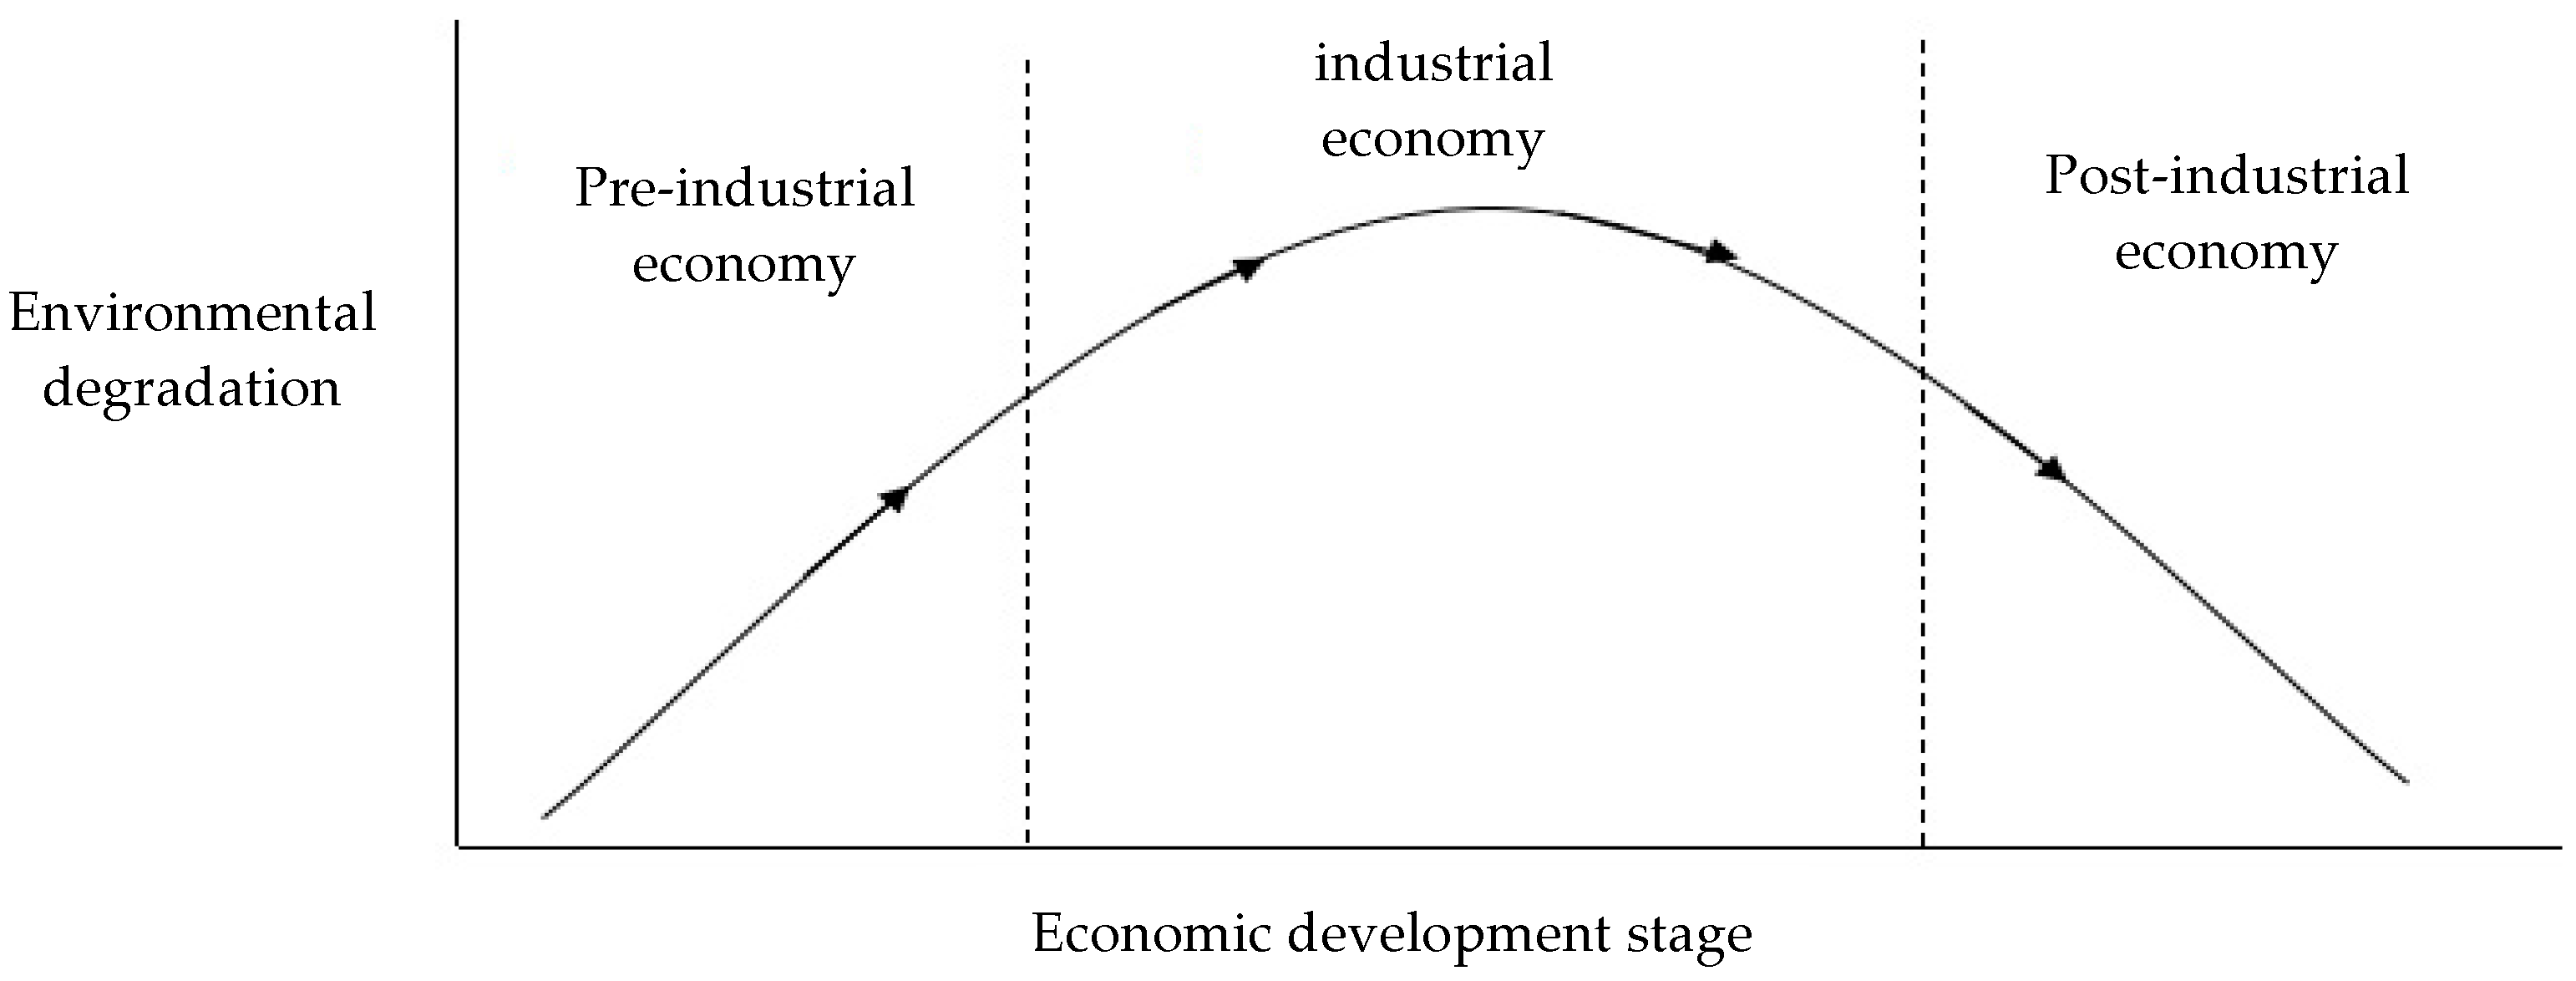
Crossman and Krueger [32] find that the relation between environment and income is inverted “U”-curve relationship, as shown in Figure 1. Environmental degradation increases together with the growth of the economy at first, and then decreases accordingly.
Huang and Fang [33] theoretically propose a dual exponential function representing the relationship between urbanization and the eco-environment:
where is the deterioration degree of eco-environment, is the urbanization level, and , , , are pending parameters, respectively.
In theory, according to the double exponential function, the ecological pressure increases first and then decreases, together with the progress of urbanization. In other words, the deterioration and pollution of the eco-environment may become worsened in the first place, and then become alleviated. This is the famous U-shaped structure theory of the relationship between urbanization and the eco-environment.
3.2. Econometric Modeling
3.2.1. Panel Unit Root Test
In order to avoid the “false regression problem” in panel data model estimation and ensure the validity of the estimation result, the stationarity of each panel sequence should be tested. However, prior literatures have ignored this point and falsely construct an obviously unreasonable vector autoregressive model. The unit root test is the most commonly used method to test the stationarity of data, which makes full use of the information of the section units and greatly improves the test validity, compared with the general unit root test. This paper follows the test method proposed by Levin et al. [34]. The null hypothesis in each time series contains a unit root.
Firstly, augmented dickey-fuller (ADF) test is performed for each section according to Equation (2).
Secondly, two auxiliary regressions for given , , are established, respectively, to obtain the residual and .
Then, normalize the residual and and finally perform a mixed least squares regression:
The Levin-Lin test takes into account the sequence correlation problems of the error term. It is suitable for panel data with more time series and shorter time periods. Once the original hypothesis () is rejected, all the cross section sequences will be considered to be stationary.
3.2.2. Panel Cointegration Test
Panel cointegration is to determine whether there is a cointegration relationship between linear combinations of two or more non-stationary time series. Panel data passing the panel unit root test does not necessarily mean that the sequence is a smooth time series. Therefore, in order to avoid false regression, it is necessary to verify whether there is cointegration relationship between models. The current panel cointegration test is based on the residual panel data cointegration test. The residual analysis is based on the assumption that the long-term cointegration coefficients between the variable level values are equal to the short-term ones of the variable first order difference; this may reduce the effectiveness of the panel unit root test method. To solve this problem, Westerlund [35] constructs four statistics based on the panel cointegration structure, which are Panel Gτ-stat, Panel Gα-stat, Panel Pτ-stat, and Panel Pα-stat. The alternative hypotheses of the first two test statistics are that there is a cointegration relationship for the panel data in general; the other two alternative hypotheses are that there is at least a cointegration relationship between the panel data. The four statistics are subject to standard normal distribution. The basic idea is to conduct panel cointegration test based on error correction model regression. If there is a cointegration relation, the error correction coefficient is not equal to zero. The cointegration test can avoid the problem of “identical factor restrictions”, i.e., the long-term error correction coefficients are not equal to the short-term dynamic adjusted coefficients. Meanwhile, the cointegration test allows cross-sectional heterogeneity and sequence correlation. Therefore, we use this method to implement the empirical test.
3.2.3. Panel Vector Autoregression Model
Strictly speaking, the research of panel data vector autoregression model started from the pioneering research of Pesaran et al. [36]. Given work done by McCoskey and Kao [37], Westerlund [38], and other scholars, it has become a well-defined model that combines the advantages of both time series and panel data analysis. The model for establishing the n-order panel vector auto regression (PVAR) is as follows:
where is the column vector of endogenous variable, is the column vector of exogenous variable, is the lagged order, is the number of cities, is the time, is the coefficient matrix to be estimated, and is the random disturbance term.
The panel data vector autoregressive model is an extension of the traditional vector autoregression (VAR) method. It is no longer necessary to distinguish between the endogenous and exogenous variables. Instead, all the variables are considered to be endogenous, which can truly reflect the interaction between each other. An orthogonalization impulse response function derived from this model can separately present the impact trajectory of an endogenous variable, and the degree of influence of one variable on others can be obtained by variance decomposition. Lastly, this model allows for unobservable individual differences while capturing the common effects that influence the cross-section observations.
Further, given that the panel data is a small sample structure, a Generalized Matrix Estimation (GMM) method is adopted to empirically implement the PVAR model. Time difference is firstly removed on the cross section data, followed by the removal of the individual fixed effect, i.e., the Heavert process. With respect to the choice of lag order, we use the t-statistic of the generalized matrix estimation coefficient and the convergence of the impulse response function. In the end, this paper selects the PVAR model of lag 1, shown as follows:
where = {Urbanization Index , Environmental Protection Index , Link Level Index , and Environmental Pressure Index x4}, indicates the number of interfaces in each city, expresses the year, represents a constant coefficient vector, and is a estimated coefficient matrix.
4. Empirical Analysis
4.1. Data
To carry out empirical analysis for the interaction effects between technology-driven urbanization and the eco-environment, in the aspect of urbanization, there are endogenous problems in the factors of technical progress, economy and space, population, and society. We select these five aspects of urbanization as far as possible, including 22 indicators. In the aspect of ecological environment, we take into account three factors: Environmental protection, environmental level, and environmental pressure, involving 12 variable indicators. We collect sample data from China City Statistical Yearbook, Zhejiang Statistical Yearbook from 2006 to 2015, and the Statistical Yearbook of 11 cities that form the urbanization agglomeration in Zhejiang Province (Hangzhou, Ningbo, Jiaxing, Huzhou, Shaoxing, Zhoushan, Wenzhou, Jinhua, Quzhou, and Lishui Taizhou). In terms of the environmental level, the per capita area of public green space and the per capita water supply are used to describe the environmental level, which is the most direct indicator for obtaining relatively long time series in the current statistical yearbook. The standard rate of industrial wastewater, Engel coefficient, and carbon dioxide measurement were all based on our calculations. In order to reduce data heteroscedasticity, control data fluctuation, and adjust the range of other variables, the measurements were all logarithmized. In particular, we incorporated “Number of internet registrations”, “Expenditure on scientific undertakings”, “Talent resources”, and “Mobile phones” categories when we built the index for urbanization, which capture the dimension of the progress of science and technology in the region, as shown in Table 1.
4.2. Construction of Indexes Based on Principal Component Analysis
To study the relationship between technology-driven urbanization and eco-environment, this paper adopts principal component analysis (PCA) to compile the comprehensive index of urbanization and eco-environment and constructs measurements based on a large number of literatures, including scientific, dynamic, completeness, and feasibility principles. The normalization coefficients of third-level indicators of PCA transformations can be used to develop higher-level indicators in the Zhejiang region and are shown in Table 1. In fact, the PCA can also be used to compile the index according to different regions. Given theories on urbanization and the eco-environment, an index system is constructed, as shown in Table 2.
4.3. The Interaction Effects between Regional Urbanization and Environmental Factors
Table 3 lists the relationships between technology-driven urbanization and eco-environment in 11 prefecture-level cities in Zhejiang Province with detailed illustrations, based on the constructed comprehensive indexes. Given Table 3, for the relationship between technology-driven urbanization and environmental protection, Hangzhou, Ningbo, and Quzhou have inverted U-shaped curves, while Wenzhou and Taizhou have normal U-shaped curves. For the relationship between technology-driven urbanization and the environmental quality, Hangzhou, Ningbo, Shaoxing, Zhoushan, and Jinhua have inverted U-shaped curves, while Jiaxing, Huzhou, Wenzhou, Quzhou, and Taizhou have the reverse. For the relationship between technology-driven urbanization and environmental pressure, only Hangzhou, Ningbo, and Quzhou have significant inverted U-shaped curves, while the other cities have either normal U-shaped or linear curves. Generally speaking, during the rapid technology-driven urbanization process, most parts of Zhejiang Province are still under environmental pressure; in terms of environmental quality, some regions are on the rise, while most of them are still declining, especially the top cities in Zhejiang Province such as Hangzhou and Ningbo. With regard to environmental protection, most regions show an upward trend, indicating that governors from nearly all cities put emphasis on environmental protection issues while developing the urban areas. Despite the gradual increase in environmental protection, the environmental quality has not been significantly improved.
4.4. PVAR Model Results
In addition, based on the constructed indexes of urbanization, environmental protection, environmental quality, and pressure, this paper constructs a Panel Vector Autoregressive (PVAR) model to quantitatively measure the interactions between technology-driven urbanization and the eco-environment. According to a previous analysis, a unit root test must be performed on the panel sequence first. The results are shown in Table 4. The P-value of the test statistic is less than 0.05, which means that the original hypothesis is rejected, i.e., the panel sequences are stationary.
Additionally, given the panel cointegration test proposed by Westerlund [38], results are shown in Table 5. The P-values of the test statistics are all less than 0.05, meaning that the original hypothesis is rejected, i.e., all the panel sequences are cointegrated. This result indicates that the establishment of PVAR model for the empirical test is statistically valid.
Finally, according to the estimation results in Table 6, applying the PVAR model, we find that technology-driven urbanization has a positive effect on the environmental protection measure in lag 1, meaning that, although less significantly, the environmental protection level is increased during the urbanization process. Meanwhile, it also positively influences urbanization and contributes to a region’s economic development. In addition, the degree of urbanization positively influences environmental quality in the first phase, while higher environmental quality requires less urbanization. Lastly, with a higher degree of urbanization, environmental pressure becomes intensified; in turn, higher environmental pressure impedes the progress of urbanization.
4.5. Results from the Impulse Response Function
It can be seen from Figure 2 that environmental protection has a significant short-term effect on technology-driven urbanization development. This curve tends to be stable in the fourth period, indicating that the two have reached equilibrium given time. Additionally, the urbanization process has a long-term influence on environmental protection; various areas attach importance to it. Later however, with the further progress of urbanization, the protection level lags behind. The development of environmental quality still has a certain influence on urbanization, but it becomes less significant; at the same time, urbanization continues to influence the environmental quality, showing a significant reduction effect. It also has certain influence on environmental pressure factors in a short period of time too, while the reversal effect still exists. Lastly, with the development of urbanization, the pressure of the environment is increased to a stage that urbanization degree and the pressure level to eventually achieve equilibrium.
4.6. Results from Variance Decomposition
With the help of the impulse response function and variance decomposition, the response of technology-driven urbanization to eco-environmental shocks and its time delay are further illustrated, shown in Table 7. The long-term contribution rate of environmental protection to urbanization is 5.1%; the fluctuation of environmental protection has a certain impact on the change of urbanization, though not very significant. The long-term contribution rate of urbanization to environmental protection is 27.35%, five times that of the reverse (5.1%), indicating that the two-way interaction effects between urbanization and environmental protection are not balanced. Lastly, the long-term contribution rate of environmental quality impact on urbanization is 57.8%; changes in environmental quality have a significant impact on urbanization while the reversed impact is 32.75%. The long-term contribution rate of environmental pressure on urbanization is 78.88%, while the reverse is 7.49%. This means the impact of urbanization on environmental pressure will gradually decrease, which is in line with the characteristics of an inverted U-shaped curve.
5. Discussions and Closure
In summary, based on the relevant data we can get from the statistical yearbook and considering some of the aspects of urbanization and environmental factors may not be directly measured by existing data, this paper adopts proxy data as effective as possible and principal component analysis to construct indexes for the degree of technology-driven urbanization and several environmental factors. Based on a novel PVAR model with two sub-tests for the panel data properties, we find that during the process of early rapid urbanization period, populous technology-driven urbanization agglomerations like those in East Zhejiang region in China are still under great environmental pressure, which means that the current level of technological innovation is not sufficient enough to release the tension between urbanization and the eco-environment. In terms of environmental quality, most regions show a downward trend, especially in top-tier cities such as Hangzhou and Ningbo. In terms of environmental protection, most regions show an upward trend, indicating that the development of urbanization will lead to increasing awareness to protect the environment, though the actual environment quality is hardly improved.
Further, by using the constructed indexes, we document U-structure relationships between technology-driven urbanization and environmental factors, exactly as what prior theory predicts. We also find that the U-structure shows heterogeneity over different regions, sometimes with inverted U-shaped curves for a few cities. According to the analysis of impulse response function and variance derived from the PVAR model, we find that the long-term contribution rate of urbanization to environmental protection is 27.35%, which is approximately five times the contribution rate of environmental protection to urbanization (5.1%)—this implies that the two-way interaction effects between urbanization and environmental protection are not balanced. Additionally, the long-term contribution rates of environmental quality and pressure on urbanization are 57.8% and 78.88%, respectively—this implies that emissions such as CO2 have significant impacts on urbanization.
Based on the above findings, we come up with a few take-aways. Given technology progress, urban plans should take environmental factors into consideration when being initiated. For example, policy makers for cities like Ningbo China should carefully investigate into giant manufacturing enterprises and strictly implement environmental protection measures while developing the technology-driven urbanization policies; public green space should be rationally arranged for urban planning and environmental protection purposes. Further, the government and other relevant parties in developing countries should pay special attentions to the problems caused by CO2 and other emissions, to help reduce environmental pressure. Given China is currently undergoing a transition period from labor-intensive economy to technology-based economy, it seems that policy makers should emphasize technological innovations and resource management more to maintain regional sustainability, which can be fully integrated in the urbanization process.
Author Contributions
G.G. is the first author that designed the research methodology and executed the empirical tests and wrote the corresponding parts. G.G. and W.Z. wrote the manuscript. Both authors approved the final version of this manuscript.
Funding
This research is supported by the China National Natural Resources Fund (71873126), the National Social Science Fund Key Project of China (18AGL015), the Social Sciences Fund Key Project of Zhejiang China (19NDJC033Z), the Soft Science Fund Project of Zhejiang China (2019C35075), the General Project of Humanities and Social Sciences Research of the Ministry of Education in China (17YJA790038), and Zhejiang Province Key Cultivating Think Tank—Research Academy for Rural Revitalization of Zhejiang Province.
Conflicts of Interest
The authors declare no conflict of interest.
References
- Button, K. City management and urban environmental indicators. Ecol. Econ. 2002, 40, 217–233. [Google Scholar] [CrossRef]
- Houkai, W. China’s urbanization process and outlook. China Econ. 2015, 10, 102. [Google Scholar]
- Liu, Q.; Lei, Q.; Xu, H.; Yuan, J. China’s energy revolution strategy into 2030. Resour. Conserv. Recycl. 2018, 128, 78–89. [Google Scholar] [CrossRef]
- Wang, J.; Da, L.; Song, K.; Li, B.L. Temporal variations of surface water quality in urban, suburban and rural areas during rapid urbanization in Shanghai, China. Environ. Pollut. 2008, 152, 387–393. [Google Scholar] [CrossRef] [PubMed]
- Wu, F. Polycentric urban development and land-use change in a transitional economy: The case of Guangzhou. Environ. Plan. 1998, 30, 1077–1100. [Google Scholar] [CrossRef]
- Seto, K.C.; Guneralp, B.; Hutyra, L.R. Global forecasts of urban expansion to 2030 and direct impacts on biodiversity and carbon pools. Proc. Natl. Acad. Sci. USA 2012, 109, 16083–16088. [Google Scholar] [CrossRef] [PubMed] [Green Version]
- Xu, J.F. New urbanization is “urbanization of human beings”—Discussion on Urbanization in Zhejiang Province. Zhejiang Econ. 2013, 20, 17–19. [Google Scholar]
- Wang, T. 50 New Policies to Create Innovation Highland for Zhejiang Province. Voice of Zhejiang, 11 December 2018. [Google Scholar]
- Han, J.; Meng, X.; Zhou, X.; Yi, B.; Liu, M.; Xiang, W.-N. A long-term analysis of urbanization process, landscape change, and carbon sources and sinks: A case study in China’s Yangtze River Delta region. J. Clean. Prod. 2017, 141, 1040–1050. [Google Scholar] [CrossRef]
- Batty, M. The New Science of Cities; MIT Press: Cambridge, MA, USA, 2013. [Google Scholar]
- Lee, B. “Edge” or “Edgeless” cities? Urban spatial structure in US metropolitan areas, 1980 to 2000. J. Reg. Sci. 2007, 47, 479–515. [Google Scholar] [CrossRef]
- Meadows, D.H.; Meadows, D.L.; Randers, J. The Limits to Growth; Universe Books: New York, NY, USA, 1972. [Google Scholar]
- Cleveland, C.J.; Costanza, R.; Hall, C.A. Energy and the U.S. Economy: A biophysical perspective. Science 1984, 225, 890–897. [Google Scholar] [CrossRef]
- Arrow, K.; Bolin, B.; Costanza, R.; Dasgupta, P.; Folke, C.; Holling, C.S.; Jansson, B.-O.; Levin, S.; Mäler, K.-G.; Perrings, C.; et al. Economic growth, carrying capacity, and the environment. Ecol. Econ. Sci. 1995, 15, 91–95. [Google Scholar]
- Xu, X.; Cai, H.; Sun, D.; Hu, L. Impacts of mining and urbanization on the Qin-Ba Mountainous environment, China. Sustainability 2016, 8, 488–502. [Google Scholar]
- Ding, Y.; Peng, J. Impacts of urbanization of mountainous areas on resources and environment: Based on ecological footprint model. Sustainability 2018, 10, 765. [Google Scholar] [CrossRef]
- Beckerman, W. Economic growth and the environment: Whose growth? Whose environment? World Dev. 1992, 20, 481–496. [Google Scholar]
- Wang, J.; Mao, W. Econometric analysis of urbanization and eco-environmental response in Wuling Mountain area—Taking Xiangxi autonomous prefecture as an example. Econ. Geogr. 2016, 36, 148–154. [Google Scholar]
- Liu, C. European green urbanism: Theory, practice and enlightenment. Soc. Sci. Abroad 2017, 1, 87–94. [Google Scholar]
- Grossman, G.; Krueger, M. Environmental Impacts of a North American Free Trade Agreement; Working paper; National Bureau of Economic Research: Cambridge, MA, USA, 1991. [Google Scholar]
- Hubacek, K.; Guan, D.; Barrett, J. Environmental implications of urbanization and lifestyle change in China: Ecological and Water Footprints. J. Clean. Prod. 2009, 17, 1241–1248. [Google Scholar] [CrossRef]
- Du, J.; Liu, Y. Urbanization and environmental pollution: An empirical study of provincial panel data in China. Resour. Environ. Yangtze Basin 2008, 6, 825–830. [Google Scholar]
- Henderson, V. The Urbanization Process and Economic Growth: The So-What Question. J. Econ. Growth 2003, 8, 47–71. [Google Scholar] [CrossRef]
- York, R.; Rosa, E.A.; Dietz, T. STIRPAT, IPAT and ImPACT: Analytical tools for unpacking the driving forces of environmental impacts. Ecol. Econ. 2003, 46, 351–3651. [Google Scholar]
- Hossain, M.S.; Dearing, J.A.; Eigenbrod, F. Operationalizing safe operating space for regional social-ecological systems. Sci. Environ. 2017, 584, 673–682. [Google Scholar] [CrossRef] [PubMed]
- Liu, Y.; Li, R.; Zhang, S. Urbanization and eco-environment coordinated standards and its evaluation model. China Soft Sci. Mag. 2005, 16, 140–148. [Google Scholar]
- Qiao, B.; Fang, C.L. Dynamic coupling model of the harmonious development between urbanization and eco-environment and its application in arid area. Acta Ecol. Sinca 2005, 25, 3003–3009. [Google Scholar]
- Rong, H.; Fang, B. Analysis on the matching degree of urbanization and eco-environment in Anhui Province based on the gravity model. China Land Sci. 2017, 31, 34–41. [Google Scholar]
- Sun, H.; Huang, Z.; Xu, D.; Shi, X.; Liu, H.; Tan, L.; Ge, J. Spatial characteristics and driving mechanism of coupling between urbanization and eco-environment in Pan Yangtze River Delta urban agglomeration. Econ. Geogr. 2017, 37, 163–170. [Google Scholar]
- Chen, X.; Guo, J.; Yao, S. Coupling coordination between new urbanization and carrying capacity of eco-environment in Yangtze River Delta urban agglomeration: Based on Leopold’s thought of Land Ethics. Resour. Environ. Yangtze River Basin 2018, 27, 715–724. [Google Scholar]
- Li, J.; Wang, H.; Wang, J.; Li, Q.; Zhang, Z.; Liu, L.; Lu, L. Impact of urbanization on terrestrial ecosystem production using linear modeling for Jiangsu. Resour. Sci. 2018, 40, 32–43. [Google Scholar]
- Grossman, G.M.; Krueger, A.B. Economic growth and the environment. Q. J. Econ. 1995, 110, 353–3771. [Google Scholar] [CrossRef]
- Huang, J.; Fang, C. Analysis of interaction mechanism and regularity between urbanization and eco-environment. Geogr. Res. 2003, 22, 211–220. [Google Scholar]
- Levin, A.; Lin, C.F.; Chu, C.S.J. Unit root tests in panel data: Asymptotic and finite-sample properties. J. Econom. 2002, 108, 1–24. [Google Scholar] [CrossRef]
- Westerlund, J. New simple tests for panel cointegration. Econom. Rev. 2005, 24, 297–316. [Google Scholar] [CrossRef]
- Pesaran, M.H.; Smith, R.P.; Smith, R. Estimating long run relationships for dynamic heterogenous panels. J. Econom. 1995, 68, 79–113. [Google Scholar] [CrossRef]
- McCoskey, S.; Kao, C. A residual-based test of the null of cointegration in panel data. Econom. Rev. 1998, 17, 57–84. [Google Scholar] [CrossRef]
- Westerlund, J. Testing for error correction in panel data. Oxf. Bull. Econ. Stat. 2007, 69, 709–748. [Google Scholar] [CrossRef]
Figure 1.
Inverted U structure model.

Figure 2.
Impulse response diagram between technology-driven urbanization and eco-environment protection.
Figure 2.
Impulse response diagram between technology-driven urbanization and eco-environment protection.


Table 1.
Technology-driven urbanization and eco-environment indicator system.
| First-Level Indicators | Second-Level Indicators | Third-Level Indicators | Normalization Coefficients |
|---|---|---|---|
| Urbanization | Economic urbanization | Per capita GDP (in ¥10,000 per capita) | 5.46% |
| Secondary industry proportion (%) | 4.25% | ||
| Tertiary industry proportion (%) | 0.71% | ||
| GDP growth rate (%) | 1.24% | ||
| Fixed assets investment (in ¥10,000) | 6.08% | ||
| Actual use of foreign capital (in $10,000) | 7.34% | ||
| Science and technology progress | Talent resources (number of professional and technical personnel) (in 10,000 people) | 5.56% | |
| Expenditure on scientific undertakings (in ¥10,000) | 3.04% | ||
| Spatial urbanization | Urban area share of land area (%) | 0.10% | |
| Urban construction land proportion of urban area (%) | 4.90% | ||
| Urban population density (persons per square kilometer) | 5.62% | ||
| Per capita cultivated area (square kilometers per person) | 3.55% | ||
| Per capita water resources (100 million cubic meters per capita) | 4.62% | ||
| Population urbanization | Secondary industry population (in 10,000 people) | 6.36% | |
| Tertiary industry population (in 10,000 people) | 5.75% | ||
| Non-agricultural population proportion (%) | 6.10% | ||
| Social urbanization | Every ten thousand people have public vehicles (count of vehicles) | 6.45% | |
| Number of doctors (in persons) | 4.92% | ||
| Mobile phone (in household) | 4.70% | ||
| Number of Internet registrations (in household) | 5.59% | ||
| Engel coefficient | 1.98% | ||
| Number of hospital beds (in sheets) | 5.68% | ||
| Eco-environment | Environmentalprotection | Environmental investment (in ¥10,000) | 1.74% |
| Industrial wastewater compliance rate (%) | 31.92% | ||
| Comprehensive utilization rate of industrial solid waste (%) | 3.48% | ||
| Industrial dust removal (in tons) | 14.90% | ||
| Comprehensive utilization of the three wastes product output value (in ¥10,000) | 24.25% | ||
| Domestic garbage harmless treatment rate (%) | 23.71% | ||
| Environmental quality | Per capita public green space (in squared meter) | 60.08% | |
| Per capita water supply (in 10,000 cubic meters) | 39.92% | ||
| Environmental pressure | Industrial wastewater discharge (in 10,000 tons) | 31.48% | |
| Industrial smoke and dust emissions (in tons) | 28.86% | ||
| Industrial sulfur dioxide emissions (in tons) | 21.15% | ||
| CO2 (in kilometer) | 18.51% |
Table 2.
Comprehensive index of urbanization and eco-environment (e.g., Hangzhou, Zhejiang).
| Hangzhou | Urbanization | Environment Quality | Environment Protection | Environment Pressure |
|---|---|---|---|---|
| 2005 | −10.9258 | 0.7538 | −0.7778 | −1.2906 |
| 2006 | −7.5987 | 1.8675 | −2.9462 | −1.2046 |
| 2007 | −6.0781 | 1.9328 | −1.6658 | −1.5801 |
| 2008 | −2.3084 | 0.9923 | −0.6672 | 0.3552 |
| 2009 | −0.9293 | 0.0882 | 1.1741 | 0.5792 |
| 2010 | 1.4999 | −0.6108 | 1.7392 | 1.1162 |
| 2011 | 3.5839 | 0.4203 | 1.2598 | 0.2927 |
| 2012 | 5.9468 | −1.5324 | 0.9952 | 0.7509 |
| 2013 | 7.2959 | −1.6086 | 0.3543 | 1.6671 |
| 2014 | 9.5138 | −2.3032 | 0.5345 | −0.6860 |
Table 3.
Coupling relationship between technology-driven urbanization and environmental factors of major cities in the Zhejiang Province.
Table 3.
Coupling relationship between technology-driven urbanization and environmental factors of major cities in the Zhejiang Province.
| Urbanization v.s. Environmental Quality | Urbanization v.s. Environmental Protection | Urbanization v.s. Environmental Pressure | Notes | |
|---|---|---|---|---|
| Hangzhou |  |  |  | Along with the technology-driven urbanization process, the environmental quality, protection and pressure curves of Hangzhou area are all inverted U-shaped. The environmental quality drops rapidly, while the environmental pressure shows a decline after 2009. |
| Ningbo |  |  |  | Although environmental protection in Ningbo is improving year by year with technology-driven urbanization, the environmental quality is decreasing still. Environmental quality and pressure both present inverted U-shaped curves. |
| Jiaxing |  |  |  | Technology-driven urbanization and environmental protection curves in Jiaxing area show U-shaped. With the gradual decline of the environmental quality, the environmental pressure gradually increases with the urbanization. |
| Huzhou |  |  |  | Technology-driven urbanization and environmental protection curves in Huzhou area are U-shaped. But contrary to the Jiaxing area, with the development of urbanization, the environmental quality improves and the environmental pressure is decreasing. |
| Shaoxing |  |  |  | Technology-driven urbanization and environmental protection curves in Shaoxing area show inverted U-shaped. Given time, the environmental quality is decreasing and the environmental pressure is rising. |
| Zhoushan |  |  |  | Technology-driven urbanization and environmental protection curves in Zhoushan area show inverted U-shaped. With the development of urbanization, environmental quality and pressure are on the rise. |
| Wenzhou |  |  |  | Technology-driven urbanization and environmental protection and quality curves in Wenzhou area are U-shaped. The environmental pressure is increasing with the urbanization process. |
| Jinhua |  |  |  | In Jinhua area, technology-driven urbanization and environmental protection curves are inverted U-shaped. With the urbanization process, the environmental quality is decreasing and the environmental pressure is increasing. |
| Quzhou |  |  |  | There is a U-shaped curve between technology-driven urbanization and environmental protection in Quzhou. The quality of environment is increasing in the process of urbanization. |
| Taizhou |  |  |  | Environmental quality and protection curves related to technology-driven urbanization in Taizhou area are inverted U-shaped. Environmental pressure is on the rise with urbanization. |
| Lishui |  |  |  | With the technology-driven urbanization process in Lishui area, the environmental quality is gradually increasing, and the environmental protection is catching up. |
Table 4.
Panel Unit Root Test.
| Variable | Uncorrected T-Statistic | Corrected T-Statistic | Adjoint Probability P Value | Conclusion |
|---|---|---|---|---|
| Urbanization | 6.1952 | 4.7718 | 0.0000 | Stationary |
| Environment protection | 5.7411 | 4.0836 | 0.0000 | Stationary |
| Environment quality | 9.1504 | 7.7944 | 0.0000 | Stationary |
| Environment pressure | 5.0054 | 4.0703 | 0.0000 | Stationary |
Table 5.
Panel Cointegration Test.
| Scenario | Panel Cointegration Test Value | Z-Score | P-Value |
|---|---|---|---|
| Urbanization v.s. Environmental protection | 70.953 | 34.425 | 0.0000 |
| Urbanization v.s. Environmental quality | 26.363 | 9.666 | 0.0000 |
| Urbanization v.s. Environmental pressure | 30.481 | 11.953 | 0.0000 |
Table 6.
PVAR Estimates for Urbanization and Eco-Environment.
| Scenario | Lag 1 Factor Mark | GMM Estimation Coefficient | T Statistic Value | ||
|---|---|---|---|---|---|
| Urbanization v.s. Environmental protection | L.h_x1 | 0.7996 * | 0.5979 | 10.2792 | 1.2237 |
| L.h_x2 | 0.0354 | 0.5246 * | 0.9988 | 2.0501 | |
| Urbanization v.s. Environmental quality | L.h_x1 | 1.1016 * | −0.3410 | 2.6699 | 0.6440 |
| L.h_x3 | 0.6491 | 0.1715 | −0.8950 | 0.1888 | |
| Urbanization v.s. Environmental pressure | L.h_x1 | −0.1035 | −1.3273 | −0.1601 | −1.1354 |
| L.h_x4 | 0.5150 | 1.5622 * | 1.3089 | 2.2109 | |
Note: * is statistically significant at 0.05 significance level.
Table 7.
Variance decomposition of technology-driven urbanization and eco-environment prediction error.
Table 7.
Variance decomposition of technology-driven urbanization and eco-environment prediction error.
| System | Factor | Variance Contribution Rate | |
|---|---|---|---|
| Urbanization v.s. Environmental protection | x1 | 0.9489 | 0.0511 |
| x2 | 0.2735 | 0.7265 | |
| Urbanization v.s. Environmental quality | x1 | 0.4220 | 0.5780 |
| x3 | 0.3275 | 0.6725 | |
| Urbanization v.s. Environmental pressure | x1 | 0.1596 | 0.7888 |
| x4 | 0.0749 | 0.8903 | |
© 2019 by the authors. Licensee MDPI, Basel, Switzerland. This article is an open access article distributed under the terms and conditions of the Creative Commons Attribution (CC BY) license (http://creativecommons.org/licenses/by/4.0/).
Share and Cite
MDPI and ACS Style
Gu, G.; Zhu, W. Interaction Effects between Technology-Driven Urbanization and Eco-Environment: Evidence from China’s East Zhejiang Region. Sustainability 2019, 11, 836. https://doi.org/10.3390/su11030836
AMA Style
Gu G, Zhu W. Interaction Effects between Technology-Driven Urbanization and Eco-Environment: Evidence from China’s East Zhejiang Region. Sustainability. 2019; 11(3):836. https://doi.org/10.3390/su11030836
Chicago/Turabian StyleGu, Guangtong, and Wenjie Zhu. 2019. "Interaction Effects between Technology-Driven Urbanization and Eco-Environment: Evidence from China’s East Zhejiang Region" Sustainability 11, no. 3: 836. https://doi.org/10.3390/su11030836
Note that from the first issue of 2016, this journal uses article numbers instead of page numbers. See further details here.