ESD for Public Administration: An Essential Challenge for Inventing the Future of Our Society


Department of Accounting, Business Information Systems and Statistics, Faculty of Economics and Business Administration, Alexandru Ioan Cuza University, 700506 Iaşi, Romania
*
Author to whom correspondence should be addressed.
Sustainability 2019, 11(3), 880; https://doi.org/10.3390/su11030880
Submission received: 4 January 2019
/
Revised: 30 January 2019
/
Accepted: 4 February 2019
/
Published: 8 February 2019
(This article belongs to the Special Issue The Importance of Sociology of Education for a Sustainable Future)
Abstract
:The role of local and central public administrations in promoting sustainable development and building up a better future for society is essential. In order to fulfill this mission, employees in public administration sector must engage in long life learning processes, for the purpose of developing skills such as: anticipation, interdisciplinarity, diversity of perspectives, working with incomplete or complex information, participation in sustainable development processes, cooperation, individual decision-making capacities, empathy, solidarity, and self-motivation. The Education for Sustainable Development as a component of lifelong learning is, in this light, of utmost importance. In this spirit, this paper investigates what is the Romanian public sector employees’ perception of long life learning as an essential premise of Education for Sustainable Development, by analysing on the one hand the degree of digital maturity of public institutions in Romania, and on the other hand the interest of employees in such institutions to engage in Education for Sustainable Development function of the following disjunct behavioural/emotional states: Disappointment, Conflicts, Satisfaction/Contentment, Doubt, Exhaustion, Attachment.
1. Introduction
United Nations Sustainable Development Goals (SDGs) define a developmental corridor and a welfare concept with which a considerable increase in global population might be made tolerable [1], in the attempt to mitigate the increasingly negative impact of humans on the planet’s resources. The 17 SDGs focus on three primary areas requiring intervention: environment, economy and society. In this paper we will turn our attention to the fourth objective of sustainable development (SD Goal number 4), namely “Ensure inclusive and equitable quality education and promote lifelong learning opportunities for all”, an objective that we believe is extremely important from the perspective of recent evolutions in the knowledge society. Moreover, our analysis has a particular focus on the public administration sector, as public institutions provide the necessary legal framework for performing the educational process, as well as the restrictions that ensure the sustainable development of the society. As such, the employees therein should have the best understanding of the changes that take place and their impact on the future of communities. They will not be able to promote sustainable development unless they have sufficient skills and knowledge on sustainability [2,3]. These are ensured via engagement in the lifelong learning (LLL) process and, more specifically, via a component under the name of Education for Sustainable Development (ESD). The employees’ wish to perfect their skills on an on-going basis is influenced, however, by a wide variety of factors—such as their actual workplace conditions, namely the level of computerization in the institutions where they work, their level of workplace satisfaction, access to refresher courses whether enabled or not by the employer institutions, potential benefits that could be obtained upon attending such courses—most of which are correlated with their age, training and experience.
According to Reference [4], this is the age of LLL. Starting from this statement and focusing on the strategic role of public administration employees (education, healthcare, financial administrations, city halls, etc.) in supporting this process, this work aims to analyse on the one hand the degree of digital maturity of public institutions in Romania, and on the other hand the interest of employees in such institutions to engage in ESD in relationship with the following disjunct behavioural/emotional states: Disappointment, Conflicts, Satisfaction/Contentment, Doubt, Exhaustion, Attachment. This section goes on to introduce the basic concepts of the study, namely LLL and ESD, as well as the necessity for public institutions to incentivize employees to engage in such processes, while the subsequent sections present the results of the study conducted in institutions pertaining to public administrations in Romania.
1.1. Lifelong Learning
Continuous learning or lifelong learning are by no means novelty concepts. The first occurrences thereof were recorded in the context of the educational system reforms in the 1970s, taking forms such as permanent education (introduced by UNESCO [5]) or recurrent education (introduced by OECD [6]). In a report published by OECD (1996) titled Lifelong learning for all, LLL, is seen as a natural result of economic and social changes, an investment in human capital to improve the capacity of individuals, families, workplaces and communities to continuously adapt and renew [7]. Over time, the concept of LLL and its implementation method have evolved, focusing on continuing the training process after finishing school (around the age of 18 or 21 years old) and throughout one’s life. LLL aimed “to raise the social participation in broad parts of the world” [8], focusing on “training for the new economy” and “adapting to the changing society” [9,10,11]. A major moment in the evolution and re-affirmation of the concept was the publishing of A Memorandum on Lifelong Learning (2000) by the European Commission, which assigned two aims for LLL: “promoting active citizenship and promoting employability” [12]. The memorandum discussed the expanding role of non-formal and informal education for individual evolution, without mitigating the importance of formal learning. The three forms of learning complement each other, and they should be approached and mixed taking into consideration the moment, objectives and relevant field of learning. The Memorandum still remains the most important in terms of reflecting the European Union’s (EU) attitude towards LLL. Over the last decades, LLL was constantly conceptualized and analysed, as a result of intensive technological, social and economic changes. Although information has become more widely available, readily storable and useable, as well as more comprehensive, it does have a “shelf life”, a short-term usability. In the current extremely dynamic context in terms of information overload, knowledge becomes obsolete quite rapidly, and people have to update it, and constantly adapt their skills and abilities for the purpose of solving immediate issues. As a result, people have to engage in a process of continuous vocational and professional development [13].
The fundamental premise of LLL is the low feasibility of traditional education, which is unable to provide students in the formal school or university education framework with all the necessary knowledge, skills and abilities they require in order to succeed throughout their lives. Per a traditional approach, the EU defines lifelong learning as “all learning activity undertaken throughout life, with the aim of improving knowledge, skills and competences within a personal, civic, social and/or employment-related perspective” [14]. The same document mentions the following characteristics of LLL: (1) encompasses the whole spectrum of formal, non-formal and informal learning, (2) addresses objectives such as those related to active citizenship, personal fulfillment, social inclusion and employment, and (3) is based on principles such as learner-centricity, the importance of equal opportunities and the quality and relevance of learning opportunities. In Reference [15] (p. 134), a more comprehensive definition is offered, LLL being seen as “the combination of processes throughout a lifetime whereby the whole person—body (genetic, physical and biological) and mind (knowledge, skills, attitudes, values, emotions, beliefs and senses)—experiences social situations, the perceived content of which is then transformed cognitively, emotionally or practically (or through any combination) and integrated into the individual person’s biography resulting in a continually changing (or more experienced) person”.
1.2. The Need for Lifelong Learning. An Approach from the Point of View of Sociology in Education
According to Reference [16], LLL is “an essential challenge for inventing the future of our societies; it is a necessity rather than a possibility or a luxury to be considered”. Continuing learning is currently necessary in all lines of activity and across hierarchy levels. Reference [17] defines LLL from a psychological perspective: the concept “combines existing theories and models under a lifespan perspective and provides relevance from both societal and research perspectives—in particular concerning educational psychology, developmental psychology and organisational psychology”. In Reference [18], three different motivations of LLL are identified: (1) for economic progress and development; (2) for personal development and fulfillment; and (3) for social inclusiveness and democratic understanding and activity.
However, the motivations for LLL are not exclusively voluntary, they are not generated only by the citizens’ wish to hone their skills in a particular field or to adapt to incoming changes. LLL is often required in the labour market upon disappearance of certain jobs and emergence of other new ones that require skills that differ from workers’ initial training. In Reference [19], “digitalisation is seen as a key influence on the future of work over the next decades”. The report estimates that more than 9% of existing jobs across member states can be fully automated, with human individuals being exposed to the risk of replacement, while upwards of 25% of all jobs will change in terms of task performance by individuals. In Reference [1], after a synthesis of data from various studies, the authors estimate that approximately half of the current jobs will be significantly influenced by digitalisation. This trend will neither affect solely low qualification, low-paying jobs, nor only industry-related jobs. For instance, for communication-based jobs (such as the majority of public sector jobs), the scenarios presented in References [20,21] mention the potential replacement of human individuals by chatbots/social bots. Risk factors associated with digitalisation include the dependence on explicit and widely-available knowledge, repetitive tasks, manual data transfers, the existence of several employees performing similar jobs or the possibility to outsource the job, to name but a few. The pressure exerted by automation and digitalisation is not naturally absorbed at the educational sector or organisation level, which Reference [22] describes as rather past-oriented, conveying and using obsolete information that is inert compared to innovation. Moreover, in References [23,24,25] is shown that individuals that cannot develop high-level skills, cannot cope with the pressure of using Information and Communication Technologies (ICT) in the workplace and are not sufficiently autonomous feel threatened, insecure and confused, which results in their failure to carry out their job duties and even quitting their jobs.
It is also useful to analyse LLL processes in the light of sociology in education. From the sociocultural point of view, learning cannot be separated by the context in which it takes place, being dependent on the interaction between the learner and the social/working environment [26]. In a particular context, learning processes are affected by tensions, contestation, and resistance. Critical participatory design of LLL processes is needed in order to respond to the real interests of learners. End users’ perception, needs and values have to be identified, and educational offerings should be built with those findings as strong foundations [27].
Within the sociology of education field, digital technology is beginning to become a serious topic of interest. The increased use of ICT in learning and their continuous availability generates new concerns. For example, employers can pressure employers to use them at home, to the detriment of their personal and family lives. Additionally, digital education requires increased levels of self-responsibility, determination and control, which are too often taken for granted, in reality being hard to achieve [27]. From the sociological point of view, it is stated that technology-based learning should not be perceived as “detached from the [spatial] conditions of common locality” [28], (p. 219).
1.3. Education for Sustainable Development
The success of LLL depends on the utility of the information and knowledge acquired reported to the regional and global socio-economic context, both upon acquiring same and in terms of the future. Per this vision, ESD is a major component of LLL. It was first mentioned in Agenda 21 of the United Nations Conference on Environment and Development (UNCED) in Rio de Janeiro in 1992 and over time it has become a comprehensive and integrating modern concept that refers to the power of education to participate in creating an optimal future for the human race. The UN General Assembly declared 2005–2014 the Decade of Education for Sustainable Development (UNDESD). Coordinated by UNESCO, the UNDESD emphasized education as a premise for individual and social development in the context of sustainability. The assimilation of ESD to LLL aims to strike a balance between human and economic well-being and cultural traditions and respect for the environment [29]. ESD, also known as sustainability literacy, provides individuals with the necessary knowledge, skills and motivation to successfully face contemporary challenges [30]. Of the ESD objectives mentioned by References [31,32] the following are relevant for the theme of this paper: to use a variety of teaching techniques that promote active (participatory), reflective, cooperative and experience-based learning, that can develop superior thinking skills; local relevance and cultural insertion of the methods being used; blending formal, non-formal and informal education, interdisciplinarity and the capacity to support labour force adaptability to the constant changes within organisations. ESD can be employed to achieve long-term cooperation habits, consistent knowledge sharing, creation of common or complementary skills, which are major factors in building and reinforcing sustainable digital ecosystems [33].
One of the central premises for the development of ESD is access to education and the individuals’ capacity to engage in training and learning, for the purpose of developing skills such as: anticipation, interdisciplinarity, diversity of perspectives, working with incomplete or complex information, participation in sustainable development processes, cooperation, individual decision-making capacities, empathy, solidarity, and self-motivation [31,34,35]. Given that self-organising, self-determination and project-based work capacities are essential in forming these skills, the employees’ training becomes an on-going need [36].
The primary facilitator for adopting and applying the aforementioned concepts and of the practices and principles associated thereto is the development of Information and Communication Technologies (ICTs) and their world-wide expansion. They facilitate access to information independent of geographical area and field of interest, having a major contribution in developing the skills determined as ESD objectives. Education is influenced by these technologies for delivering educational programs and for instructional design [13] across all levels of education. In universities, digitalisation helps students to self-organise learning processes, which allows them to have enhanced levels of autonomy and transforming educators into facilitators [23]. Moreover, digitalisation allows for knowledge sharing, both inside and outside the organisation [36].
Sustainable development and real and active involvement in the future development needs new and creative skills and competences. In 2005, OECD identified the following three competence categories as relevant in the field of sustainable development: (1) interactive use of media and methods; (2) interacting in socially heterogeneous groups; (3) acting autonomously. All these categories can be supported by the use of ICT in ESD. In References [37,38] it is shown that ICT can be used as a tool for (1) interactive communication, (2) interactive generating of knowledge, (3) interactive sharing of knowledge, (4) collaboration with local communities and (5) creating competence in the field of ESD. [39] stresses that ICT tools support ESD in acquiring, processing, presentation and communication of information through the integration of all modern media in formal education (wiki, blog, Web 2.0, Web 3.0, mobile technologies) and the use of social networking, online interactive courses and experiments, online gaming and simulation in self-assisted learning. As these tools have already become part of everyday life in different countries, helping people to use it in an intelligent and social accepted way is the main challenge on the way to LLL.
The effective and side-effect-free incorporation of ICT in work tasks, without having humans feel alienated and without affecting their future, is an important component of sustainability, and the achievement of this objective requires the creation of digital skills. Public administration is one of the sectors in direct need of such skills.
1.4. The Need for Education for Sustainable Development in the Public Administration Sector
The characteristics of public service have changed over the last years as a result of changing generations (from baby boomers to millennials), the massive implementation of ICT, globalisation and fluidisation of connections between the public and private sectors and non-profit organisations [40].
Public sector management is undergoing continuous changes caused on the one hand by the need to adapt to the economic and technologic evolution, and on the other hand by the citizens’ demands to be better informed, for ensuring information transparency and to boost the efficiency of activities conducted by the relevant institutions [41]. As such, the staff employed in public institutions has to accept and engage in continuous improvement, both via programmes designed within the organisations or courses contracted with other institutions or companies, and via informal means. The problems they face are increasingly complex, difficult and global, transcending the limits of simplicity and linearity, as well as national borders [42]. Public administrations are faced with a series of challenges that require continuous development of the knowledge and skills of employees hired in this sector, challenges that are presented below.
Innovation in ICT, the development of smart cities, the fluidity across public, private and non-profit sectors, globalisation, increasing speed of access to information and increasing volumes of available information have changed the characteristics of public services and, implicitly, the training and attitude of the providers thereof. For many domains, the private sector is the source of innovations, but filtering them is achieved via institutions within the public sector. In this category we include organisations that provide invention patenting, regulation frameworks, financing sources, organisations that purchase innovations and provide citizens with access thereto, etc. As a result, the employees in these institutions are often among the first that have to become familiar with the risks and benefits of new technologies, products or services. Along with the citizens, non-governmental organisations and private sector organisations, public institutions play a decisive role in the efficient implementation of programs geared towards mitigating social inequities, in improving the citizens’ quality of life via rapid access to high-quality information and services, and thus supporting the evolution of communities [43,44].
Local and central public administrations have to promote sustainable development and limit actions that could lead to natural or social imbalances, to formulate and execute plans reflecting sustainable development principles [45,46,47]. Their policies are influenced by actual environmental issues, the available resources and the types of decision-making processes they are involved in [48,49]. As such, they must adapt to the dynamics of the business environment in the area they manage, but they also have to be capable to coordinate it so as to evolve in favour of the citizens and for the sake of economic growth and social welfare. Based on the studies that have been conducted, some authors believe the duty of public institution leaders is to take the role of leaders in developing sustainability objectives and to ensure the implementation thereof via management and specific operations [50]. To this end, local administration employees have to have command of sufficient knowledge and information regarding sustainable development, as well as methods to quantify and stimulate the latter. According to Reference [51], approximately two thirds of the 2509 actions identified in Agenda 21 for increasing sustainability require the active engagement of local administrations. The efforts have to be redirected from defining and justifying the concept of sustainability to implementation strategies in order to boost the efficiency and effectiveness of local initiatives [49,50].
Constant information of the public administration staff has to prevent the following issue: there can be no hope for sustainable communities if “the head of municipality and his staff has no knowledge in sustainable development” [52]. Starting from SDGs and specifically SDG 16 on sustainable communities, local administrations must set their own sustainability goals. Their role is essential in conducting actions that ensure the fulfillment of such goals, as many of the activities carried out occur at a regional level and are coordinated by local authorities [53,54]. SDGs 16 focus on improving the standard of living of the population, broad access to education, restoring the natural balance, promoting innovation, equality of chances, elimination of violence, corruption, abuse, etc. Whether directly or indirectly, SDGs requires skills and knowledge in the field of ICT, both for monitoring the value of indicators regarding the environment, investments, pollution, level of education, etc., as well as for implementing the measures required to improve same. In many cases, meeting these goals is achieved via digitalisation of their respective domains. They also require setting up partnerships between governments, the private sector and the civil society, including the transfer of knowledge, continuous training and enabling education for sustainable development. The 17th goal (“Partnership for the goals”) was introduced in order to highlight it even more.
Main topic areas for the role of public administration in achieving SDGs are: “no poverty”, “zero hunger”, “good health and well-being”, “quality education”, “gender equality”, “clean water and sanitation”, “affordable and clean energy”, “decent work and economic growth”, “industries, innovation and infrastructure”, “reduce inequalities”, “sustainable cities and communities”, “responsible consumption and production”, “climate action”, “life below water”, ”life on land”, “peace, justice and strong institutions” and “partnerships for the goals” [54]. These initiatives should be provided in the processes of formal, non-formal and informal learning key competences.
The 17 SD goals are overlapping and require joint actions from local, national and international administrations. To address this requirement, their employees must have suitable training levels that they can refine on an on-going basis in accordance with the economic, technologic, social and environmental changes. In EU countries, the methods for the continuous training of public administration employees varies from one country to another [55]. For instance, in France training is performed by specialized institutions or by training providers for professional bodies, and therein per various positions. In Italy, contests are organised in order to recruit the participants for specialized courses, and the filling of certain jobs designed for higher positions is conditional upon the successful completion of such programmes. The method is named “course-contest”. In Ireland, training is encouraged via specialized formal education, while in Finland and the Netherlands the process is entirely liberal, with each institution choosing its own training method and provider function of the goals they pursue. In several countries the training is—at least partially—provided by formal education, such as by Ecole Nationale d’Administration (ENA) in France, the Dutch Institute for Public Administration (PBLQ) in Netherlands, Finnish Institute of Public Management (HAUS) in Finland, Royal Institute of Public Administration (RIPA) in United Kingdom, etc. Even so, the need for public administration personnel training and improvement, as well as the creation of new skills in accordance with current professional training trends and technological development are championed in all EU countries. In this context, professional training is a local and nationwide priority, achieved via both institutional and individual methods [55,56]. It needs to be supported by local, national and international public institutions and authorities, per their affiliation and level of responsibility.
Public administration employees have a dual role as both beneficiary and providers of LLL and ESD. Specialized public institutions are responsible for organising the education system. Their employees not only manage their own knowledge and training levels, but also the training of future generations. In this capacity, they can directly champion and provide material support for sustainable development education via subject matters in formal education contexts. On the other hand, public universities enjoying financial support from the state budget can provide administration employees with courses that can ensure the continuous development of such employees.
1.5. Public Administration in Romania
One of the essential aspects of sustainable development is its political-administrative side, which refers to the mode for streamlining the activities of government institutions in their relationships with citizens, as well as to ensuring democracy in the digital era [57]. The Romanian Government’s Strategy for developing the information technology sector states that the administration is the largest producer and user of information, that it is the main link and implicitly the most responsible component in organising and leading the society, called to offer the favourable framework for the development of the community, to ensure high-quality and diversified public services for citizens. The public administration in Romania is currently undergoing a sinuous process of modernisation and restructuring, so as to be in line with the European Union’s recommendations in terms of digitalisation as published in documents such as the Digital Agenda for Europe (one of the seven pilot-initiatives of the Europa 2020 Strategy, which is aimed at defining the essential leadership role that the use of ICT will have to play in achieving the European objectives for 2020). To this end, public administration employees must adjust to the requirements of the Agenda for developing digital and inclusion skills, bringing their services closer to the citizen and addressing the aforementioned efficiency, democracy and transparency objectives.
As per the Strategy for professional training 2016–2020, the following training providers contribute to the training of public administration staff [55]:
- Public institutions such as: Institutul Diplomatic Român (Romanian Diplomatic Institute), Institutul Național pentru Cercetare și Formare Culturală (National Institute for Research and Cultural Training), Centrul Național de Pregătire în Statistică (National Training Center in Statistics), etc.;
- Departments with training duties in certain fields of competence within public institutions, such as: Agenția Națională a Funcționarilor Publici (ANFP) (National Agency of Public Administration Employees), Autoritatea Națională pentru Reglementarea și Monitorizarea Achizițiilor Publice (National Authority for Regulating and Monitoring Public Procurement), etc.;
- Private organisations operating in the organisation and conduct of training programmes;
- Higher education institutions;
- Non-governmental organisations such as foundations or associations, e.g.,: Institutul Bancar Român (Romanian Banking Institute) or Institutul European din România (Romanian European Institute);
- Labour union organisations, etc.
The institutions and organisations mentioned in the Strategy primarily provide formal education. Its role is very important, and the studies are certified and recognized. They are complete with informal and non-formal education, which can add significant supplementary knowledge the value of which, without registration in official documents, influences the actions and decisions of public administration servants. The success of learning within the public administration essentially depends on the performance of training providers [44], as well as on the self-determined engagement of employees in the learning process.
In regard to public administration employees in Romania, Reference [58] presents a study that aimed to identify the innovator and executant profile characteristics among same. The results of the study confirmed the general cog-in-the-wheel perception of public servants, i.e. effective in performing repetitive tasks, responsible and dutiful. Although we note a certain conformity with their respective work “platoon”, public servants have lower rates of ideas and perspectives that are radically different from one other, and they do not really challenge the status quo all that much, they said they were very open to: asking “what if” questions, in order to explore new possibilities and transcending current borders; trends in their field and in other fields, by reading up-to-date books, magazines and blogs; discussions with people from diverse fields, in order to find new ideas; finding solutions to problems by building on ideas from other industries, domains or disciplines. The openness to experiments and solutions from other fields of activity, attesting to innovative behaviours, occurs as a reaction to barriers in the environment in which they conduct their activity, which is not a fertile, fluid, relaxed and stimulating one, but that by its very limitations forces its employees to break through and bring in good practices from other areas. The need to adapt knowledge via LLL processes is evident and the public servants themselves became aware of it. Additionally, Reference [44] conducted a qualitative research based on interview with experts operating in the Romanian public sector. The study advocates for the need to transfer knowledge inside and outside public institutions, via partnerships with various training providers, particularly universities. It also highlights the need for continuous non-formal education—by employees attending conferences, trainings, and meetings for presenting good practices in using ICT within the public administration.
2. Materials and Methods
Considering the need for the employed staff of public institutions to accept and engage in continuous training, primarily via programmes set within the organisations or via courses contracted with other institutions or companies, as well as considering the observation that Romanian public sector is faced with challenges that require the continuous development of knowledge of the staff employed in this sector, we formulated the following research theme: What is the Romanian public sector employees’ perception of LLL as an essential premise of ESD?
To successfully intervene in creating ESD skills in the public sector by the education providers mentioned above, it is necessary to study the following aspects (Research Tasks):
Research Task A: Assessing the maturity of the digital ICT in public administration institutions as a possible pressure factor for adapting the employees’ knowledge, skills and abilities to the requirements of increasingly technology-intensive jobs;
Research Task B: Assessing the public sector employees’ willingness to increase the adoption of ICT in their work tasks (already automatized at certain degree) in an efficient and side-effect-free manner, without having humans feel alienated and without affecting their future. Here we defined the following hypotheses:
- H1—The relation between public sector employees that are using ICT within their tasks and the institution where they work can fall in one of the following categories: I. Disappointment, II. Conflicts, III. Satisfaction/Contentment, IV. Doubt, V. Exhaustion, VI. Attachment.
- H2—Function of the relevant category, there are differences in the manners in which public sector employees are willing to make additional efforts (participation in training courses/job interviews/professional reconversion—aspects that define the LLL) in order to get higher salaries, become more efficient in the workplace (acquiring skills by participating in courses), being contented in the workplace and working in a friendly environment.
The research was conducted using the questionnaire and aimed to investigate the three aspects presented above. The questionnaire was not previously used but designed expressly for the current research. As such, in order to avoid errors, misunderstandings and other issues, the instrument was pre-tested using a group of 30 individuals one week before making it available to the recipients. Based on the results of the questionnaire pre-test, the instrument was adjusted accordingly. For the purpose of validating the content it was used Cronback’s Alpha as the majority of questions used to validate the hypotheses are based on Likert scale. For the analysis referring to Likert scale questions the Cronbach’s Alpha value is, in all cases, favourable and indicates a high level of internal consistency (Table 1 −0.852, Table 3 −0.960, Table 4 −0.949).
The instrument was distributed online in the group of students specializing in Public Administration (BA and MA programmes) at the Faculty of Economics and Business Administration with the “Alexandru Ioan Cuza” University of Iași, Romania, we applied an online questionnaire. The questionnaire was available during a 12-month term to a population upwards of 500 potential respondents. Google Docs was the platform used to set up and distribute the questionnaire. The results were exported in a file that constituted the source of data for analysis and data interpretation in the SPSS 16.0 (2010) programme. The sample compiled comprised 447 answers. A series of filters were applied, removing registrations pertaining to respondents that are not employed and that do not use ICT at work, as well as those that are employed in the private sector. Therefore, the final sample contains 335 answers, comprising only respondents that are employees in the Romanian public sector and that are having their work tasks automatized at different degrees.
The answers were analysed from a descriptive statistics point of view using the SPSS programme (25.0, IBM Corporation: New York, NY, USA, 2017) using frequency analysis (percentages per category of employee function of their degree of Satisfaction, Disappointment, Exhaustion, Doubt, etc.), descriptive indicators of the central trend, quartiles and dispersion indicators. For the robustness testing aimed at testing the hypotheses, we used student test and chi-square testing (association or independence).
Work phases:
1. For each employee we calculated the mean score per groups of items (the questions) which define the six states (categories of employees), namely: I. Disappointment, II. Conflicts, III. Satisfaction/Contentment, IV. Doubt, V. Exhaustion, VI. Attachment (see Table 1);
2. Then we grouped employees per their mean individual scores and the mean scores achieved per each category of items (corresponding to the six states);
3. We removed from the sample all employees that did not stand out as falling within a single antithetic state (of those analysed). Therefore, 335 respondents/employees remained under analysis;
4. For the purpose of analysing the connections between the degree of I. Disappointment, II. Conflicts, III. Satisfaction/Contentment, IV. Doubt, V. Exhaustion, VI. Attachment of the employees and their intention to participate in LLL processes, we applied association analysis, chi-square/t-test, and correlation analysis.
3. Results
3.1. Level of ICT Maturity in Romanian Public Institutions
A. The assessment of ICT maturity level for an organisation is a subject debated for many years in various papers. In our research endeavour we have consulted several researches [59,60,61] in our quest to assess the ICT maturity level for the public institutions. The above-mentioned authors portray ICT maturity through a blend of indicators among which are included ICT infrastructure, ICT application, HR level of education, and ICT security and policy. Therefore, in the description of Q12 it were included different level of ICT maturity so that the respondents would best frame their institution into one of the five maturity levels. During pre-testing the questionnaire we paid special attention to this question and several adjustments have been made before making the instrument available to the population.
The evaluation of the level of ICT maturity in Romanian public institutions was performed based on question number Q12 in the questionnaire (see Table 2), and the results prove (see Figure 1) that the Romanian public institutions have a high degree of ICT maturity, as per the statements of the questionnaire participants (in the body of the question were given details on how to estimate the ICT maturity level—presented below Table 2). Therefore, 7% of the respondents said that in their institutions the level of maturity is very high, 20% said it was high and 57% believed it was average. Overall, 84% of respondents (public sector employees in various branches thereof) believe that their employer institution has an average-to-high level of ICT maturity. This aspect allows us to state that, via this level of ICT maturity and through the employee’s willing to invest in their career by participating to extra courses, attending conferences and others, the Romanian public sector institutions can support the ESD component of LLL.
More support to ICT maturity is illustrated in the analysis pursued in Table 3 and Table 4 where are presented the hierarchy made by the respondents towards the organisational issues connected with ICT and related to the job (Table 3) and ICT domains (Table 4). Additionally, in relation to the subject of ICT maturity, based on the responses received, it was our intention to evaluate (in order to sustain the answers given by the respondents to Q12) the digitalisation state for the Romanian public sector and the level of education for this sector’s employee. Therefore, the responses to Q8, Q9, Q11, Q14 (presented in Table 2 and Figure 2) were the primary source of information.
Table 3 presents the results of the first investigation, via a classification of the respondents’ preferences regarding a series of organisational aspects related to the job tasks that are strongly connected to ICT. We notice that the Economic productivity and reduction of costs resulting from the use of ICT (with an average of 1772) is deemed the most important, while the next two places are held by Possibility to recover data in case of a disaster using database-specific technologies (1.892) and Reliability and efficiency of activity based on using ICT for everyday tasks (1.965).
The second analysis, the results of which are presented in Table 4, shows the classification of ICT domains in terms of importance, as determined by public sector employees. We note that employees ascribed the highest importance (with a mean of 2.180) to Business Intelligence—Analytics, followed by Technologies for harnessing datamining data and then by Desktop or Server Virtualisation, with the latter two scoring a 2.206 average.
The classifications made by public sector employees that participated in our study and presented in Table 3 and Table 4 evidence their openness to the digitalisation of their activity.
This state of affairs is also justified by the results presented in Figure 2, which illustrate the high level of endowment of public institutions in terms of ICT equipment (Q11) and other elements related to the ICT infrastructure (questions Q8, Q9 and Q14—detailed in Table 2).
Therefore, as per Figure 2, we can depict the ICT digitalisation main characteristics for the Romanian public institutions as such:
- the computer applications developed within the Institution (where the respondents are employed) and the National Integrated System for public sector are the two highest being used;
- a large number of computer devices are available for the purpose of automatizing the daily tasks in the public institutions. Among them, the desktop PCs are the most available followed by the portable computers (laptops) and the mobile equipment (tablet PCs and smartphones);
- the majority of the above-mentioned equipment is connected to a computer network and to the Internet;
- the majority of employees (using the computer applications and infrastructure from above) have a Bachelor’s degree and some are more qualified as they possess a Master’s degree or a PhD.
The percentages and values within the charts in Figure 2 are significant in favour of Romanian public sector digitalisation and we consider they justify the evaluation made by the respondents regarding their evaluation of ICT maturity level (Q12) presented in Figure 1.
Concurrently, the information in Table 5 reveals that the use of equipment is justified by the high level of automation in the activity of public servants. Therefore, 55.74% of these have more than 50% of their work tasks computerized. As a detail, the majority of people in this latter category use an application developed inside the institution (46.85%). The employees whose activity is computerized at a rate of 26% to 50% primarily use (54.41%) applications other than ERP or ICT products designed for accounting records keeping purposes. The employees whose activity is computerized at a rate of maximum 25% primarily use (43.66%) an application developed inside the institution.
B. Our research endeavour for Research Task B was to check, according with the six states of the employees, the impact of ICT load on their behaviour. Therefore, those employees that are already using ICT (in different proportions) fall within the states: I. Disappointment, II. Conflicts, IV. Doubt, V. Exhaustion are feeling pressure, conflicts, etc., at work and thus they may be unwilling/reluctant to adopting ICT as they may consider that such tools are being used by their colleagues and superiors to spy on them/check their actions while at work. Those employees having the opposite states (III. Satisfaction/Contentment, VI. Attachment) may react positively to fully adopting ICT as they consider these tools as a real support in being efficient, productive and effective at work. Therefore, this analysis intents to connect the state of the employees with their reluctance or willingness to increase the adoption of ICT at work.
Therefore, in order to assess the public sector employees’ willingness to increase the adoption of ICT in their work tasks (already automatize at certain degrees) in an efficient and side-effect-free manner, without having humans feel alienated and without affecting their future, we performed two analyses. The next step of the research entailed testing the study hypotheses.
Firstly, we conducted the analysis per age, sex, sub-sector of activity in the public domain, level of education and labour seniority criteria in order to assess the current status of the employees’ fears/satisfactions/perceptions (as per the six states defined in Table 1) of the public administration sector in respect of their jobs.
The analysis revealed differences between public sector employees (age, sex, sub-sector of activity, level of education and labour seniority) that are using ICT, in various proportions, as part of their work in terms of how employees (in various public sector institutions) perceive the workload (I Disappointment), the presence of certain conflicts between work and personal life (II Conflicts), degree of professional satisfaction (III Satisfaction/Contentment), attachment to the workplace (VI Attachment), insecurity towards the workplace and/or profession (IV Doubt) and physical exhaustion associated with the current job (V Exhaustion) in connection with ICT. We mention that all of these states are ICT related as it was proved before (Research Task A) that the majority of the employees addressed by the research are working in institutions that have an average-to-high level of ICT maturity in a proportion of 77.39% (Table 5, last two columns, the total line). Additionally, within the questions (Table 1) addressed to the respondents and that build each of the six states there are some that directly (e.g. Q30, Q37, Q38, Q39) or indirectly (e.g. Q20, Q27, Q29, Q31, Q33) tackle the impact of ICT on defining them (the states). In this context, in the following lines, an exhaustive analysis will be presented that details the preferences of employees regarding their tasks at work (involving ICT) correlated with their states.
The test for association between the variables defining each of the six states of public sector employees and the analysed variables indicate (as per Table 6) that there are strong associations as in all cases the signification value of the association (Chi-square) testing is below 0.05. As such, we can state that the Age, Sex, Sub-sector of activity, Education and Seniority variables are strongly associated with all six states defining public sector employees, namely Disappointment, Conflicts, Satisfaction, Doubt, Exhaustion, and Attachment. Consequently, the H1 research hypothesis was confirmed: employees do manifest differently in the workplace regarding their willingness to increase the adoption of ICT as part of their daily tasks, function of the six behavioural/emotional states.
Further on we will present a synthesis of current trends manifesting for each state (of the employees) and for each five variables (presented in the heading of Table 6) that were tested for association purposes.
Therefore, for State I Disappointment, the analysis of results in the intermediary tables which, for lack of space, we are unable to include in this article, highlight the following general characteristics:
- Age, in the majority of employees, has a rather homogeneous trend in terms of agreement with manifesting some degree of disappointment regarding the current employment: 19–25 years (80.9%), 31–35 years (72.5%), 36–40 years (53.1%), 41–50 years (71.6%), over 51 years (50%). At the opposite pole there is only the category of employees aged between 26 and 30 years old (majority in disagreement by 72.7%) and this situation would be interesting to investigate (in a future study);
- The sex of employees reveals that, although the majority of both sexes agree that they are disappointed with their jobs, men (68.6%) represent a higher, yet not very significant percentage compared to women (60.4%);
- The sub-sector of activity reveals that the employees in certain public sector institutions are disappointed due to certain various pressures that are exercised on then at their jobs. As such, the employees in Education (70.7%), City Halls (61.8%) and Other Institutions (65.9%) assigned majority percentages in terms of agreement, while Financial Administration (53.1%) and Healthcare (52.4%) employees mostly disagree. As such, the employees in the latter two sectors do not appear to be completely frightened neither by the heavy workloads, nor by the number of requests, problems and complaints;
- The education level reveals a certain homogeneity in the perception of disappointment among public sector employees. Thus, across all levels of studies, employees generally agree that they are disappointed with their jobs based on reasons that define state I Disappointment: High-school (76.5%), BA Bachelor Studies (54.6%), MA Masters Studies (56.7%), Vocational school/College (60%), and PhD Doctoral Studies (58.1%);
- Function of seniority in the workforce, a part of public sector employees, namely 0–4 years (64.4%), 10–19 years (61.7%) and 20–29 years (75.3%) form the majority, in terms of agreement with the fact that they are disappointed, while employees with labour seniorities of 5–9 years (60%) and upwards of 50 years (54.2%) are the majority to disagree with being disappointed due to various everyday pressures occurring in the workplace.
As for State II Conflicts (between work activities and family environment), we notice the following patterns:
- Function of age, employees aged 19–25 years (51.1%), 36–40 years (57.3%), 41–50 years (62.7%) and older than 51 years (53.6%) expressed their agreement on the negative influence of professional matters on their private lives, while at the opposite pole (majority to disagree) are employees aged 26–30 years (68.2%) and 31–35 years (62.5%). We believe that the employees that are less affected by work-related issued in their private lives succeed in managing the situation to their advantage, due to the combination of energy and expertise that are specific in the 31–35 years age interval. At that age, humans are in optimal health and rather well rounded in terms of experience;
- Function of sex, women primarily expressed various forms of agreement (55.6%), while the majority of men express their disagreement (50.4%). This situation could be explained by the fact that in the public sector women are more deeply affected by work-related matters in their personal life, while men manage to execute their professional tasks during office hours;
- Function of the sub-sector of activity, we notice that the vast majority of employees expressed their agreement: healthcare 61.9%, education 59.8%, other institutions 59.1%. The only exceptions come from city halls (52%) and financial administrations (65.6%), where the majority of employees disagreed that their work activities affected their private lives;
- The level of education manifests the following patterns: public sector employees with doctoral (64.5%), high-school (62.6%) and MA studies (55%) are the majority to agree with the existence of conflicts between one’s personal and professional life, while employees with BA studies (55.5%), and particularly those with vocational school or college studies (80%) are the majority to disagree with the analysed issue;
- Labour seniority reveals that only employees with seniority between 10–19 years (53.9%) and 20–29 years (71.4%) are affected by work-related issues in their family lives, while the remaining employees disagree, namely: 0–4 years (54.8%), 5–9 years (70%) and upwards of 51 years (58.3%), managing to successfully avoid interferences between the two aspects of their lives.
The association between State III Satisfied/Contented (Satisfaction and contentment regarding their job) revealed a majority trend upwards of 95% in terms of agreement with being satisfied with one’s job, for all five of the analysed variables (age, sex, seniority, etc.):
- As for the employees’ age, we notice that an overwhelming majority of respondents in all age categories (the lowest value being 95%) agree that they feel like they are making their contribution to the welfare of the institution. The only age categories that expressed mild disagreement were employees aged 31–36 years (5%) and 41–50 years (2%);
- The gender variable was also not heterogeneous, as employees—in proportions that are quite similar between them and to the possible maximum—agree that they are satisfied with their job. Therefore, only 0.9% of women and 1.9% of men disagree that they are satisfied with their jobs;
- the sub-sector of activity has a 100% rate of agreement for financial administration, healthcare and other public sector institutions, while mild disagreement regarding the analysed state (Contentment) was only expressed in education (2.2%) and city hall (2%);
- Employees with BA studies are the only category having the lowest rate of agreement (96.6%) with being contented with their jobs. The remaining levels of education reported 100% agreement;
- Seniority in the workforce is as heterogeneous as the other four variables. Therefore, only employees with seniority around 10–19 years (1.4%) and 20–29 years (2.6%) reported agreement rates below 100%.
Association tests regarding State IV Doubt have the following characteristics for public sector employees:
- Age is a homogeneous variable; all age categories express disagreement regarding the fear of being replaced in the workplace or having their jobs wiped out. It is interesting to notice that employees aged between 26–30 years (95.5%) are the category to express most disagreement, while the age category above 51 years (53.6%) expresses the least disagreement;
- The sex variable shows that both women and men disagree that they fear their job being wiped out or outsourced. However, we notice that men (62.9%) have lower rates of disagreement compared to women (70.9%);
- The sub-sector of activity shows a disagreement trend regarding a series of aspects that are characterized as doubt in the workplace. However, we notice significant percentage differences between certain sub-sectors. The highest rates of disagreement are reported in healthcare (90.5%), financial administration (84.4%) and education (73.9%) where employees are probably more difficult to replace given the specifics of their activities;
- The analysis per employees’ level of education reveals a general trend for disagreement regarding doubt, yet as expected, the employee category with high-school studies reported the lowest rates of disagreement (53.9%) while the highest rate was reported by employees with BA studies (80.7%);
- Seniority in the workforce shows that employees, irrespective of the number of years they worked, do not have doubts about their jobs, as the majority thereof express disagreement. As such, neither technological innovations nor other reasons will determine them to seek another job. However, as we had expected, we noticed that employees at the beginning of their careers (0–4 years) have the lowest rates of disagreement (63%), while the maximum value for disagreement corresponds to employees with 5–9 years (80%) of seniority.
The analysis of results obtained following association tests between State V Exhaustion and the employees’ age, sex, sub-sector of activity, education and seniority in the workforce variables have the following characteristics:
- Function of age, employees report a general trend of disagreement regarding the existence of feelings of pressure, exhaustion in the workplace. However, there is an exception to the general trend, namely employees aged 41–50 years, who rather agree (52%) that going to work causes them to feel tense;
- The sex of employees also reports a general trend of disagreement with the presence of pressure/exhaustion in the workplace. However, we notice that women (53.9%) disagree at lower rates compared to men (58.1%);
- The sub-sector of activity reports yet again a general trend of disagreement, the highest percentage being reported in the financial administration (84.4%). In education, however, employees break with the disagreement trend, as 52.2% thereof agree to the existence of a series of factors that generate an overall state of exhaustion/pressure in the workplace;
- The employees’ education reveals an interesting situation: the general trend is for disagreement, and it is worth mentioning that vocational school or college graduate employees agree at a rate of 100%. Employees with high-school education, however, rather agree that they are exhausted in the workplace, the percentage forming the majority (51.3%) and being the only category to report this trend in this study variable;
- The employees’ seniority in the workforce has a general trend of disagreement regarding the existence of a state of exhaustion in the workplace. The only category that contradicts the general trend is employees with 20–29 years (62.3%) seniority, who agree they feel the pressure of everyday activities, that they are exhausted or that going to work causes them a sense of tension.
The association tests applied between State VI Attachment/Stability and the age, sex, sub-sector of activity, education and seniority in the workforce variables of public sector employees have the following results:
- The age of the employees presents a general trend of agreement regarding their wish to stay in their current job, but also that they will use computer tools from now on. As such, the highest percentages of agreement are recorded for employees aged between 41–50 years (86.3%), 36–40 years (82%) and 31–35 years (80%), while the lowest rate of agreement was reported in the age category above 51 years (60.7%);
- No differentiation is reported for function of sex, with both women and men agreeing (at rates upwards of 77%) that they will stay in their current jobs;
- The sub-sector of activity presents a general trend of agreement with regard to workplace stability, except for healthcare employees who disagree (61.9%). In the case of employees who tend to agree, we notice that employees in education and in city halls have the highest rates of agreement—upwards of 84%—while public administration employees have equal scores (50% agree and 50% disagree);
- Education levels are a homogeneous variable, with no fundamental differences between employees. As such, the trend is for agreement, and employees with PhD studies and vocational school/college studies fully agree with workplace stability (100%). The lowest percentage of agreement is reported in employees with BA studies (68.1%), as they are probably more open to a new professional opportunity;
- Seniority in the workforce reveals no differences between employees. The majority agree to stability and the opposite extremes are: employees with seniority between 5–9 years (85%) and employees aged over 50 years (54%).
3.2. Employees Wish to Engage in a Lifelong Learning Process
Wishing to test the public sector employees’ willingness/wish to engage in an LLL process, we analysed elements connected to this process (participation in training courses, professional reconversion, participation in job interviews) in association with the motivation to go through with them (higher salary, efficiency and contentment in the workplace, working in a friendly, dynamic and flexible environment). Table 7 presents the questions distributed to respondents and their composition in terms of the two components analysed (motivation and LLL-related elements).
The research hypothesis being tested (H2) in this case is: Function of the respective state they fall in, are there differences in the manner in which public sector employees are willing to make additional efforts (participating in training courses/job interviews/professional reconversion—aspects that define the LLL) to obtain a higher salary, to become more efficient in the workplace (to achieve skills by participating in courses), to be contented with the workplace and to work in a friendly environment?
To test the research hypothesis (H2) we used the sample described in the methodology section and applied in testing hypothesis H1. The following tests were applied to this sample (335 answers): association (chi-square and t-test) and Spearman correlation (two-dimensional correlation coefficient/bivariate).
Table 8 presents a synthesis of the association testing results, and Table 9 shows the correlation result.
In this section, our intention was to highlight the perception of Romanian public employee’s (based on the six states identified in Table 1) support in engaging to ESD as a component of LLL. Therefore, we monitored an analysis of how public sector employees are willing/motivated to make additional efforts (financial, time for engaging in training activities, working overtime) including leaving their comfort zone (changing their current job) in order to access higher-paying jobs, to be contented/happy with their job (professional satisfaction) or to work in a friendly, dynamic and flexible environment. Table 9 presents the results of the analysis. All cases reveal that the significance value of the chi-square test is statistically significant (<0.05) and as a result we can state, with an assumed risk lower than 5%, that there is an association between all the analysed variables.
Table 9 displays the correlation matrix between the six sets of variables. Each random variable (Xi) in the table is correlated with each of the other values in the table (Xj) and this information highlights the pairs that have the highest correlation.
As displayed in Table 9 all variables are showing correlation as the p-value is significant in all cases. However, some variables are showing negative association and some display strong correlation (as p-value is <0.000) highlighted with **. Therefore, we can depict two major cases:
Case 1: As expected, there is a positive association between variables:
III. Satisfaction and VI. Attachment, both states being positive
I. Disappointment, II. Conflicts, IV. Doubt, V. Exhaustion, all four being negative states
Case 2: There is a negative correlation manifested between (State III. Satisfaction) and (States I. Disappointment, II. Conflicts, IV. Doubt, V. Exhaustion), but not between VI. Attachment and all the other “negative” states.
It can also be noticed that the strongest correlations are between the negative states of employees V. Exhaustion vs. I. Disappointment (0.695), V. Exhaustion vs. II. Conflicts (0.671), V. Exhaustion vs. IV. Doubt (0.550) and IV. Doubt vs. II. Conflicts (0.527). This shows that these pairs of “negative” states of an employee are strongly correlated.
4. Discussion
In this section we have interpreted all the six states in connection with LLL for the purpose of demonstrating the importance of employees’ acceptance of LLL processes. The approach of the subject in the sociology of education field shows that in a particular context, learning processes are affected by tensions, contestation, and resistance. Critical participatory design of LLL processes is needed in order to respond to the real interests of learners. End users’ perception, needs and values have to be identified, and educational offerings should be built with those findings as strong foundations.
Therefore, the analysis of association test results between the employees’ states (defined in Table 1) and the employees’ motivation to engage in an LLL process reveals the following major trends:
1. Level I tests their wish to engage in LLL motivated by obtaining higher salaries.
The analysis of results regarding employees that identify (agree) with State I (Disappointment) reveals that a majority proportion thereof (54.46%) wish to participate in professional training courses after work (organised and paid by the employer or paid by themselves) (36.64%). There are also majority percentages expressed both against participation in job interviews with another institution (39.94%), as well as against attempting professional reconversion (42.34%). In brief, employees that are disappointed with their jobs wish to engage in LLL by participating in courses paid for by the institution and do not wish to change their jobs.
The majority of employees are those who agree with State II Conflicts; they agree to participate in professional training courses after work (organised and paid for by the employer) at a rate of 45.65%, to participate in courses paid for by themselves (31.23%) and are opposed to both participating in job interviews with another institution (38.14%) and professional reconversion (31%).
In the case of employees who are contented with their jobs (the majority of which are those who agree with State III Contentment), we notice that an overwhelming majority thereof are willing to engage in learning processes and refuse to migrate to another job. Therefore, they wish to participate in professional training courses after work organised and paid for by the employer (89.79%) or paid for by themselves (57.73%) and refuse to participate in job interviews (67.87%), as well as to dabble in professional reconversion (61.56%).
In the case of State IV Doubt, the predominant share goes to those who disagree with this state and they have the following majority features: they wish to participate in professional training courses organised and paid for by the employer (65.47%) or paid for by the employees (42.94%) and reject the idea of participating in job interviews (53.75%), as well as to dabble into professional reconversion (46.55%).
The majority of employees for State V Exhaustion are those who disagree. They wish to participate in professional training courses organised and paid for by the employer (52.25%) or by the employees (34.23%) and wish to participate in neither job interviews (41.74%) nor professional reconversion (33.63%).
State VI Attachment/Stability is dominated by employees that agree thereto. Therefore, an overwhelming number among them are willing to participate in professional training courses organised and paid for by the employer (71.17%) and/or paid for by employees (45.65%) for the sake of higher salaries, and they do not wish—not even for a more attractive salary—to participate in job interviews (49.85%) and to resort to professional reconversion (48.65%).
2. Level II tests the wish to engage in LLL motivated by the wish to become more efficient/to increase the efficiency in the workplace. We will sketch the employee profile per each of the six states based on the two questions applied to respondents.
For State I Disappointed, the majority is formed by employees that agree with this state. Therefore, in respect to the two questions asked via the questionnaire, the majority wish to become efficient by participating in professional training courses after work (55.26%) and do not agree to work overtime daily for at least three months/year (35.44%).
The situation is slightly different in the case of employees falling in State II Conflicts. The majority here are those whose answers agreed with this state and most of them have the following preferences in terms of possibilities for boosting efficiency in the workplace: they wish to participate in professional training courses after work (47.45%) and they also agree to work overtime daily for at least three months/year (27.33%).
The majority of employees categorised under State III Contentment agree with this state. An overwhelming percentage of them (87.69%) wish to increase their efficiency by participating in professional training courses after work, but 51.95% do not find it undesirable to work overtime daily for at least three months/year.
As for State IV Doubt, the majority is employees that disagree with this state. Therefore, the majority of these have the following options regarding the two means of improving efficiency in the workplace: they wish to participate in professional training courses after work (60.06%), while 38.74% do not wish to work overtime daily for at least three months/year.
State V Exhaustion comprises of majority of employees that disagree with this state. The majority of these (51.05%) wish to participate in professional training courses, and 30.63% do not approve of working overtime daily for at least three months/year.
The majority of employees under State VI Attachment/Stability are those who agree with this state. In brief, a majority percentage of these wish to participate in professional training courses after work (72.07%) and, regarding the second analysed aspect (working overtime on a daily basis for at least three months/year), the largest percentage (39.34%) corresponds to those who disagree with that.
3. Level III tests the wish to engage in LLL motivated by the wish to be contented in the workplace and to work in a friendly, dynamic and flexible environment. This level analyses the employees’ trend in each of the six states in association with: participation in professional training courses after work organised and paid for by the employee (Q54), participation in professional training courses after work organised and paid for by another institution than the one where the employee is working (Q55), participation in job interviews with another institution (Q56) and the wish to resort to professional reconversion (Q57).
State I Disappointment is predominantly comprised of employees that agree with this state. The majority of these manifest the following trends: they wish to participate in professional training courses after work organised and paid for by the employee (36.64%), they agree to participate in professional training courses after work organised and paid for by another institution than the one where the employee is working (45.05%), they do not agree to participate in job interviews at another institution (34.53%) and they are also not willing to give professional reconversion a try (41.44%). As such, although disappointed, the majority of employees do not wish to change their employer, but they are willing to participate in various types of training courses, showing willingness for LLL.
The majority of employees under State II Conflicts agree to this state. They have the following options regarding the elements under analysis in Level III: they are willing to participate in professional training courses at their own expense (33.03%), to participate in professional training courses after work organised and paid for by an institution other than the one where they work (39.04%), they do not agree to participate in job interviews at another institution (29.43%) and they are also not interested in professional reconversion (34.83%). Consequently, employees under State II Conflicts are also willing to approach an LLL-type programme and wish to stay loyal to their current employment.
State III Contented is mainly comprised of employees that agree with this state. Wanting to be contented in the workplace and to work in a friendly, dynamic and flexible environment, they feature the following majority proportions: 55.56% wish to finance their participation in professional training courses to be scheduled outside office hours, 71.77% are willing to participate in professional training courses after work organised and paid for by another institution, they do not agree to participate in job interviews at another institution (55.86%) and they are also not interested in professional reconversion (61.56%). It becomes evident that contented employees are also open to LLL and, as expected, they stay loyal to their current jobs.
A majority of the employees under State IV Doubt expressed disagreement towards falling within this category. Their wish to have the satisfaction of a job well done and to work in a friendly and flexible atmosphere reveals the following prevailing features: 35.14% wish to participate in professional training courses after work organised and paid for by the employee, 49.55% are interested in participating in professional training courses after work organised and paid for by another institution than the one where the employee is working, 41.74% do not wish to participate in job interviews and 48.35% do not wish to try professional reconversion. We noted that a majority of the employees under this state, Doubt, are also willing to become actively engaged in an LLL process.
The employees under State V Exhaustion widely disagree with this state. They show interest in engaging in an LLL process primarily as follows:
- They wish to participate in professional training courses after work: organised and paid for by the employee (40.84%) and organised and paid for by an institution other than the one where the employee is working (33.63%);
- They do not wish to participate in job interviews (35.15%), but they are willing to give professional reconversion a try (47.15%).
State VI Attachment/Stability is comprised of employees that predominantly agree with this state. They have the following preference in terms of engagement in an LLL process motivated by the wish to be contented in the workplace and to work in a friendly, dynamic and flexible environment: they wish to participate in professional training courses organised and paid for by the employee (47.15%) and organised and paid for by an institution other than the one where the employee is working (57.96%), but reject the idea of participating in job interviews with other institutions (42.64%) and attempting professional reconversion (45.65%). As a result, the employees showing stability in the workplace wish to stay loyal to their current employer, but they are open to learning even based on self-financing.
The authors should discuss the results and how they can be interpreted in perspective of previous studies and of the working hypotheses. The findings and their implications should be discussed in the broadest context possible. Future research directions may also be highlighted.
5. Conclusions
In a first phase, our study showed a high degree of digitalisation of work tasks in the Romanian public sector. The vast majority of employees use fixed and portable computer devices in their activity and complete their professional tasks using specific software. In our opinion, this high degree of digitalisation pushes for the employees to acquire via LLL the necessary ICT knowledge, skills and abilities in order to harness the presence of the “technological partner” to the maximum in the workplace and to sustainably contribute to their own progress and that of the organisation they work in. Employees associate the use of ICT with increasing economic productivity and reducing costs, they appreciate the contribution of ICT to maintaining data integrity, as well as the contribution of ICT to the reliability and efficiency of activities in the organisation. Considering the importance of information technology domains in their activity, respondents particularly appreciated areas connected to Analytics, Data Mining technologies and Desktop or Server Virtualisation technologies.
The employees’ perception towards increasing the adoption level of ICT within their jobs was categorised in one of the following disjunct behavioural/emotional states: Disappointment, Conflicts, Satisfaction/Contentment, Doubt, Exhaustion, and Attachment. The agreement or disagreement towards falling within one of the aforementioned states, in connection with the increase in the adoption of a higher degree of ICT in their daily tasks, was nuanced function of age, sex, sub-sector of activity, level of education, seniority in the workforce. The study shows that employees that are disappointed with their jobs, as well as those having Conflicts between their personal and professional lives, wish to engage in LLL by participating in courses paid for by the institution and do not wish to change jobs. The overwhelming majority of employees satisfied with their jobs, but also of those in a state of doubt, that are exhausted or stable, are willing to engage in learning processes, namely in courses paid for by the employers or by themselves and refuse to migrate to another job. Employees under all states, whether in larger or smaller proportions, wish to participate in professional training courses after work, but are not willing to work overtime to increase efficiency in the workplace. As for the wish to engage in LLL motivated by increasing the degree of satisfaction with the job and the wish to work in a friendly, dynamic and flexible environment, this is also manifested in employees across all states, primarily for those under Contentment and Stability.
In conclusion, when creating offers for refresher courses by training providers in the public administration area, we recommend intervention via different methods, adapted to the potential states of employees in this sector, in order to ensure sustainability.
Author Contributions
Conceptualization, M.R.G., L.-D.R. and D.P.; methodology, V.-D.P.; formal analysis, V.-D.P.; investigation, V.-D.P.; writing—original draft preparation, V.-D.P., M.R.G., L.-D.R. and D.P.; writing—review and editing, V.-D.P, M.R.G, L.-D.R. and D.P.; supervision, M.R.G.; project administration, M.R.G.
Funding
This research received no external funding.
Conflicts of Interest
The authors declare no conflict of interest.
References
- Osburg, T.; Lohrmann, C. Sustainability in a Digital World: New Opportunities through New Technologies, 1st ed.; Springer: Cham, Switzerland, 2017. [Google Scholar] [CrossRef]
- Albareda-Tiana, S.; Vidal-Raméntol, S.; Pujol-Valls, M.; Fernández-Morilla, M. Holistic Approaches to Develop Sustainability and Research Competencies in Pre-Service Teacher Training. Sustainability 2018, 10, 3698. [Google Scholar] [CrossRef]
- Păvăloaia, L.; Carp, M.; Georgescu, I. Sustainability Reporting and Investor Reaction. Evidence from the Romanian Capital Market. Transform. Bus. Econ. 2018, 17, 806–822. [Google Scholar]
- Jackson, S. Innovations in lifelong learning: Politics, power and pedagogic practices. In Innovations in Lifelong Learning: Critical Perspectives on Diversity, Participation and Vocational Learning; Jackson, S., Ed.; Routledge: London, UK, 2010; pp. 1–10. [Google Scholar]
- Faure, E.; Herrera, F.; Kaddoura, A.R.; Lopes, H.; Petrovski, A.V.; Rahnema, M.; Ward, F.C. Learning to Be: The World of Education Today and Tomorrow; UNESCO: Paris, France, 1972. [Google Scholar]
- Kallen, D.; Bengtsson, J. Recurrent Education: A Strategy for Lifelong Learning; OECD: Washington, USA, 1973. [Google Scholar]
- OECD. Lifelong Learning for All; OECD: Paris, France, 1996. [Google Scholar]
- Bernhardsson, N. Contradicting values in the policy discourse on lifelong learning. In Challenging the ’European Area of Lifelong Learning’ A Critical Response; Zarifis, G., Gravani, M., Eds.; Springer: Dordrecht, Netherlands, 2014; pp. 179–187. [Google Scholar] [CrossRef]
- Reich, R. The Work of Nations: Preparing Ourselves for 21st Century Capitalism; Vintage Books: London, UK, 1992. [Google Scholar] [CrossRef]
- Martin, I. Adult Education, Lifelong Learning and Citizenship: Some Ifs and Buts. Int. J. Lifelong Educ. 2003, 22, 566–579. [Google Scholar] [CrossRef]
- Gravani, M.; Zarifis, G. Challenging the ’European Area of Lifelong Learning. A Critical Response; Springer: Thessaloniki, Greece; Dordrecht, the Netherlands, 2014. [Google Scholar] [CrossRef]
- European Commission. A Memorandum on Lifelong Learning. Brussels, 2000. Available online: http://arhiv.acs.si/dokumenti/Memorandum_on_Lifelong_Learning.pdf (accessed on 2 October 2018).
- London, M. The Oxford Handbook of Lifelong Learning; Oxford University Press: Oxford, UK, 2011. [Google Scholar] [CrossRef]
- European Commission. Making a European Area of Lifelong Learning a Reality. European Commission: Brussels, 2001. Available online: http://www.europarl.europa.eu/meetdocs/committees/cult/20020122/com(2001)678_en.pdf (accessed on 2 October 2018).
- Jarvis, P. Towards a Comprehensive Theory of Human Learning; Routledge: London, UK, 2006. [Google Scholar]
- Fischer, G. Lifelong Learning—More than Training. JILR 2000, 11, 265–294. Available online: http://l3d.cs.colorado.edu/~gerhard/papers/lll99.pdf (accessed on 16 November 2018).
- Lüftenegger, M.; Schober, B.; Van de Schoot, R.; Wagner, P.; Finsterwald, M.; Spiel, C. Lifelong Learning as a Goal—Do Autonomy and Self-Regulation in School Result in Well Prepared Pupils? Learn. Instr. 2012, 22, 27–36. [Google Scholar] [CrossRef]
- Aspin, D.; Chapman, J. Lifelong Learning: Concepts, Theories and Values. In Proceedings of the 31st Annual Conference of SCUTREA, University of East London, London, UK, 3–5 July 2001; pp. 38–41. [Google Scholar]
- OECD. Policy Brief on the Future of Work—Automation and Independent Work in a Digital Economy. Policy. Available online: http://www.oecd.org/employment/future-of-work/ (accessed on 12 May 2018).
- Möller, D.P. Digital Manufacturing/Industry 4.0. In Guide to Computing Fundamentals in Cyber-Physical Systems. Concepts, Design Methods, and Applications; Möller, D.P., Ed.; Springer: Cham, Switzerland, 2016; pp. 307–375. [Google Scholar] [CrossRef]
- Kiel, D. What Do We Know About Industry 4.0 So Far? Proceedings of 26th International Association for Management of Technology Conference, Viena, Austria, 14–18 May 2017; pp. 1–22. [Google Scholar]
- Ursul, A.; Ursul, T. Environmental Education for Sustainable Development. Future Hum. Image 2017, 9, 115–125. [Google Scholar] [CrossRef]
- Matser, I. Leading Change in Ongoing Technological Developments: An Essay. In Sustainability in a Digital World: New Opportunities Through New Technologies; Osburg, T., Lohrmann, C., Eds.; Springer: Cham, Switzerland, 2017. [Google Scholar] [CrossRef]
- Meșniță, G. Change of Functional Requirements for Information Systems Integration with Internet of Things. J. Syst. Softw. Dev. 2017, 2017. [Google Scholar] [CrossRef]
- Necula, S. Implementing the Main Functionalities Required by Semantic Search in Decision-Support Systems. Int. J. Comput. Commun. Control 2012, 907–915. [Google Scholar] [CrossRef]
- Dworkin, A.G.; Ballantine, J.; Antikainen, A.; Barbosa, M.L.; Konstantinovskiy, D.; Saha, L.J.; Essack, S.; Chang, J.; Vryonides, M.; Teodoro, A. The Sociology of Education. Sociopedia.isa 2013. [Google Scholar] [CrossRef]
- Selwyn, N.; Facer, K. The Sociology of Education and Digital Technology: Past, Present and Future. Oxford Rev. Educ. 2014, 40, 482–496. [Google Scholar] [CrossRef]
- Facer, K.; Selwyn, N. Towards a Sociology of Education and Technology. In Contemporary Debates in the Sociology of Education; Brooks, R., McCormack, M., Bhopal, K., Eds.; Palgrave/Macmillan: London, UK, 2013; pp. 218–235. [Google Scholar] [CrossRef]
- Siraj-Blatchford, J.; Smith, K.C.; Samuelsson, I.P. Education for Sustainable Development in the Early Years; World Organization for Early Childhood Education: Gothenburg, Sweden, 2010. [Google Scholar]
- Opoku, A.; Guthrie, P. Education for Sustainable Development in the Built Environment. Int. J. Constr. Edu. Res. 2018, 14, 1–3. [Google Scholar] [CrossRef]
- Lohrmann, C. Online Learning—Do MOOCs Contribute to the Goals of Agenda 21: “Education for Sustainable Development”. In Sustainability in a Digital World: New Opportunities Through New Technologies; Springer: Cham, Switzerland, 2017. [Google Scholar] [CrossRef]
- Kieu, T.K.; Singer, J.; Gannon, T.J. Education for Sustainable Development in Vietnam: Lessons Learned from Teacher Education. Int. J Sustain. High. Educ. 2016, 17, 853–874. [Google Scholar] [CrossRef]
- Aksin-Sivrikaya, S.; Bhattacharya, C.B. Where Digitalization Meets Sustainability: Opportunities and Challenges. In Sustainability in a Digital World. New Opportunities through New Technologies; Osburg, T., Lohrmann, C., Eds.; Springer: Cham, Switzerland, 2017. [Google Scholar] [CrossRef]
- Kolleck, N.; Jörgens, H.; Well, M. Levels of Governance in Policy Innovation Cycles in Community Education: The Cases of Education for Sustainable Development and Climate Change Education. Sustainability 2017, 9, 1966. [Google Scholar] [CrossRef]
- Straková, Z.; Cimermanová, I. Critical Thinking Development—A Necessary Step in Higher Education Transformation towards Sustainability. Sustainability 2018, 10, 3366. [Google Scholar] [CrossRef]
- Knaut, A. How CSR Should Understand Digitalization. In Sustainability in a Digital World. New Opportunities through New Technologies; Osburg, T., Lohrmann, C., Eds.; Springer: Cham, Switzerland, 2017. [Google Scholar] [CrossRef]
- Mathar, R. ICT in ESD, Guidelines and Experiences with the School Campaign CO2nnect. Available online: https://www.ensi.org/global/downloads/Publications/382/ICT-guidelines-Reiner.pdf (accessed on 2 January 2019).
- Dillon, P.; Kaivola, T.; Åhlberg, M.; Mylläri, J. ICT Supported Education for Sustainable Development and Global Responsibility. Report of the Conference at the Hanasaari Swedish-Finnish Cultural Centre, Espoo, Finland, 1–4 September 2008. Available online: https://www.researchgate.net/publication/291957134_ICT_Supported_Education_for_Sustainable_Development_and_Global_Responsibility (accessed on 2 January 2019).
- Kędzierska, B.; Magenheim, J.; Kędzierska, A.; Fischbach, R. The Application and Impact Of ICT In Education for Sustainable Development. In Proceedings of the, World Conference on Computers in Education, Toruń, Poland, 2–5 July 2013; pp. 152–161. [Google Scholar]
- Straussman, J.D. The Changing Public Service and the Challenges of Lifelong Learning. PDP Communique 2017. Available online: https://www.pdp.albany.edu/Media/PDF/CommuniquePDF/V18_PDP_Communique.pdf (accessed on 2 October 2018).
- Yusuf, S.; Evenett, S.J. Lifelong Learning in the Global Knowledge Economy: Challenges for Developing Countries; The World Bank: Washington, DC, USA, 2003. [Google Scholar]
- Robinson, M. From Old Public Administration to the New Public Service. Implications for Public Sector Reform in Developing Countries. UNDP Global Centre for Public Service Excellence: Singapore, 2015. Available online: http://www.undp.org/content/dam/undp/library/capacity-development/English/Singapore%20Centre/PS-Reform_Paper.pdf (accessed on 21 September 2018).
- Alberti, A. The Critical Role of Innovation in Public Administration in Promoting Economic and Social Development. United Nations, Economic and Social Council: Beirut, 2003. Available online: http://unpan1.un.org/intradoc/groups/public/documents/unescwa/unpan010862.pdf (accessed on 22 September 2018).
- Pînzaru, F.; Zbuchea, A.; Vițelar, A. Knowledge Transfer from Business to Public Administration in Smart City Developement. In Proceedings of the 19th European Conference on Knowledge Management; Bolisani, E., Di Maria, E., Scarso, E., Eds.; Academic Conferences and Publishing International Ltd.: Padua, Italy, 2018; pp. 700–707. [Google Scholar]
- Conroy, M.M.; Berke, P.R. What Makes a Good Sustainable Development Plan? An Analysis of Factors that Influence Principles of Sustainable Development. Environ. Plann. A 2004, 36, 1381–1396. [Google Scholar] [CrossRef]
- Alińska, A.; Filipiak, B.Z.; Kosztowniak, A. The Importance of the Public Sector in Sustainable Development in Poland. Sustainability 2018, 10, 3278. [Google Scholar] [CrossRef]
- Berezin, A.; Sergi, B.S.; Gorodnova, N. Efficiency Assessment of Public-Private Partnership (PPP) Projects: The Case of Russia. Sustainability 2018, 10, 3713. [Google Scholar] [CrossRef]
- McDonald, W. Sustainable Development and Public Administration: Challenges and Innovation in Citizen Engagement. Review. Pub. Administration Manag. 2017, 5, 1–6. [Google Scholar] [CrossRef]
- Krause, R.M.; Feiock, R.C.; Hawkins, C.V. The Administrative Organization of Sustainability within Local Government. J. Public Adm. Res. Theory 2014, 26, 113–127. [Google Scholar] [CrossRef]
- Wang, X.; Hawkins, C.V.; Lebredo, N.; Berman, E.M. Capacity to Sustain Sustainability: A Study of US cities. Public Admin. Rev. 2012, 72, 841–853. [Google Scholar] [CrossRef]
- Keen, M.; Mahanty, S.; Sauvage, J. Sustainability Assessment and Local Government: Achieving Innovation through Practitioner Networks. Local Environ. 2006, 11, 201–216. [Google Scholar] [CrossRef]
- Zenelaj, E. Education for Sustainable Development. Eur. J. Sustain. Dev. 2013, 2, 227–232. [Google Scholar]
- United Nations. High-level Political Forum on Sustainable Development. 2016. Available online: http://workspace.unpan.org/sites/Internet/Documents/HLPF%20-%205%20page%20summary%20report.docx.pdf (accessed on 3 September 2018).
- United Nations. About the Sustainable Development Goals. 2018. Available online: https://www.un.org/sustainabledevelopment/sustainable-development-goals/ (accessed on 3 September 2018).
- Agenția Națională a Funcționarilor Publici. Strategia privind formarea profesională 2016–2020. Guvernul României: București, 2016. Available online: http://sgg.gov.ro/legislativ/docs/2016/04/8m0vf47gd6t2zh3qybxk.pdf (accessed on 21 May 2018).
- Waltner, E.-M.; Rieß, W.; Brock, A. Development of an ESD Indicator for Teacher Training and the National Monitoring for ESD Implementation in Germany. Sustainability 2018, 10, 2508. [Google Scholar] [CrossRef]
- Ghilic-Micu, B.; Stoica, M. E-Voting Solutions for Digital Democracy in Knowledge Society. Informatica Economica 2016, 20, 55–65. [Google Scholar] [CrossRef]
- Popescul, D. Fluxurile de cunoștințe și inovația tehnologică. In Studii post-doctorale în economie. Disertații post-doctorale, Volumul 4—Studii şi cercetări privind impactul cercetării şi inovării asupra progresului economic; Otiman, P.I., Ionescu, C., Dinga, E., Eds.; Editura Academiei Române: Bucuresti, Romania, 2013. [Google Scholar]
- Ragowsky, A.; Licker, P.S.; Gefen, D. Organizational IT Maturity (OITM): A Measure of Organizational Readiness and Effectiveness to Obtain Value from Its Information Technology. Inform. Syst. Manag. 2012, 29, 148–160. [Google Scholar] [CrossRef]
- Kien, P.X.; Trung, P.Q. Proposed model to measure the enterprise’s ICT maturity under uncertainty using group IF-ANP. In Proceedings of the 2nd International Conference on Project and Program Management, Ho Chi Minh, Vietnam, 1–6 March 2015. [Google Scholar]
- Yunis, M.M.; Koong, K.S.; Liu, L.C.; Kwan, R.; Tsang, P. ICT maturity as a driver to global competitiveness: A national level analysis. Int. J. Account. Inf. Manag. 2010, 20, 255–281. [Google Scholar] [CrossRef]
Figure 1.
The degree of ICT maturity in the public sector (authors’ own projection).

Figure 2.
Graphical display of the results to Q8, Q9, Q11, Q14 (authors’ own projection).


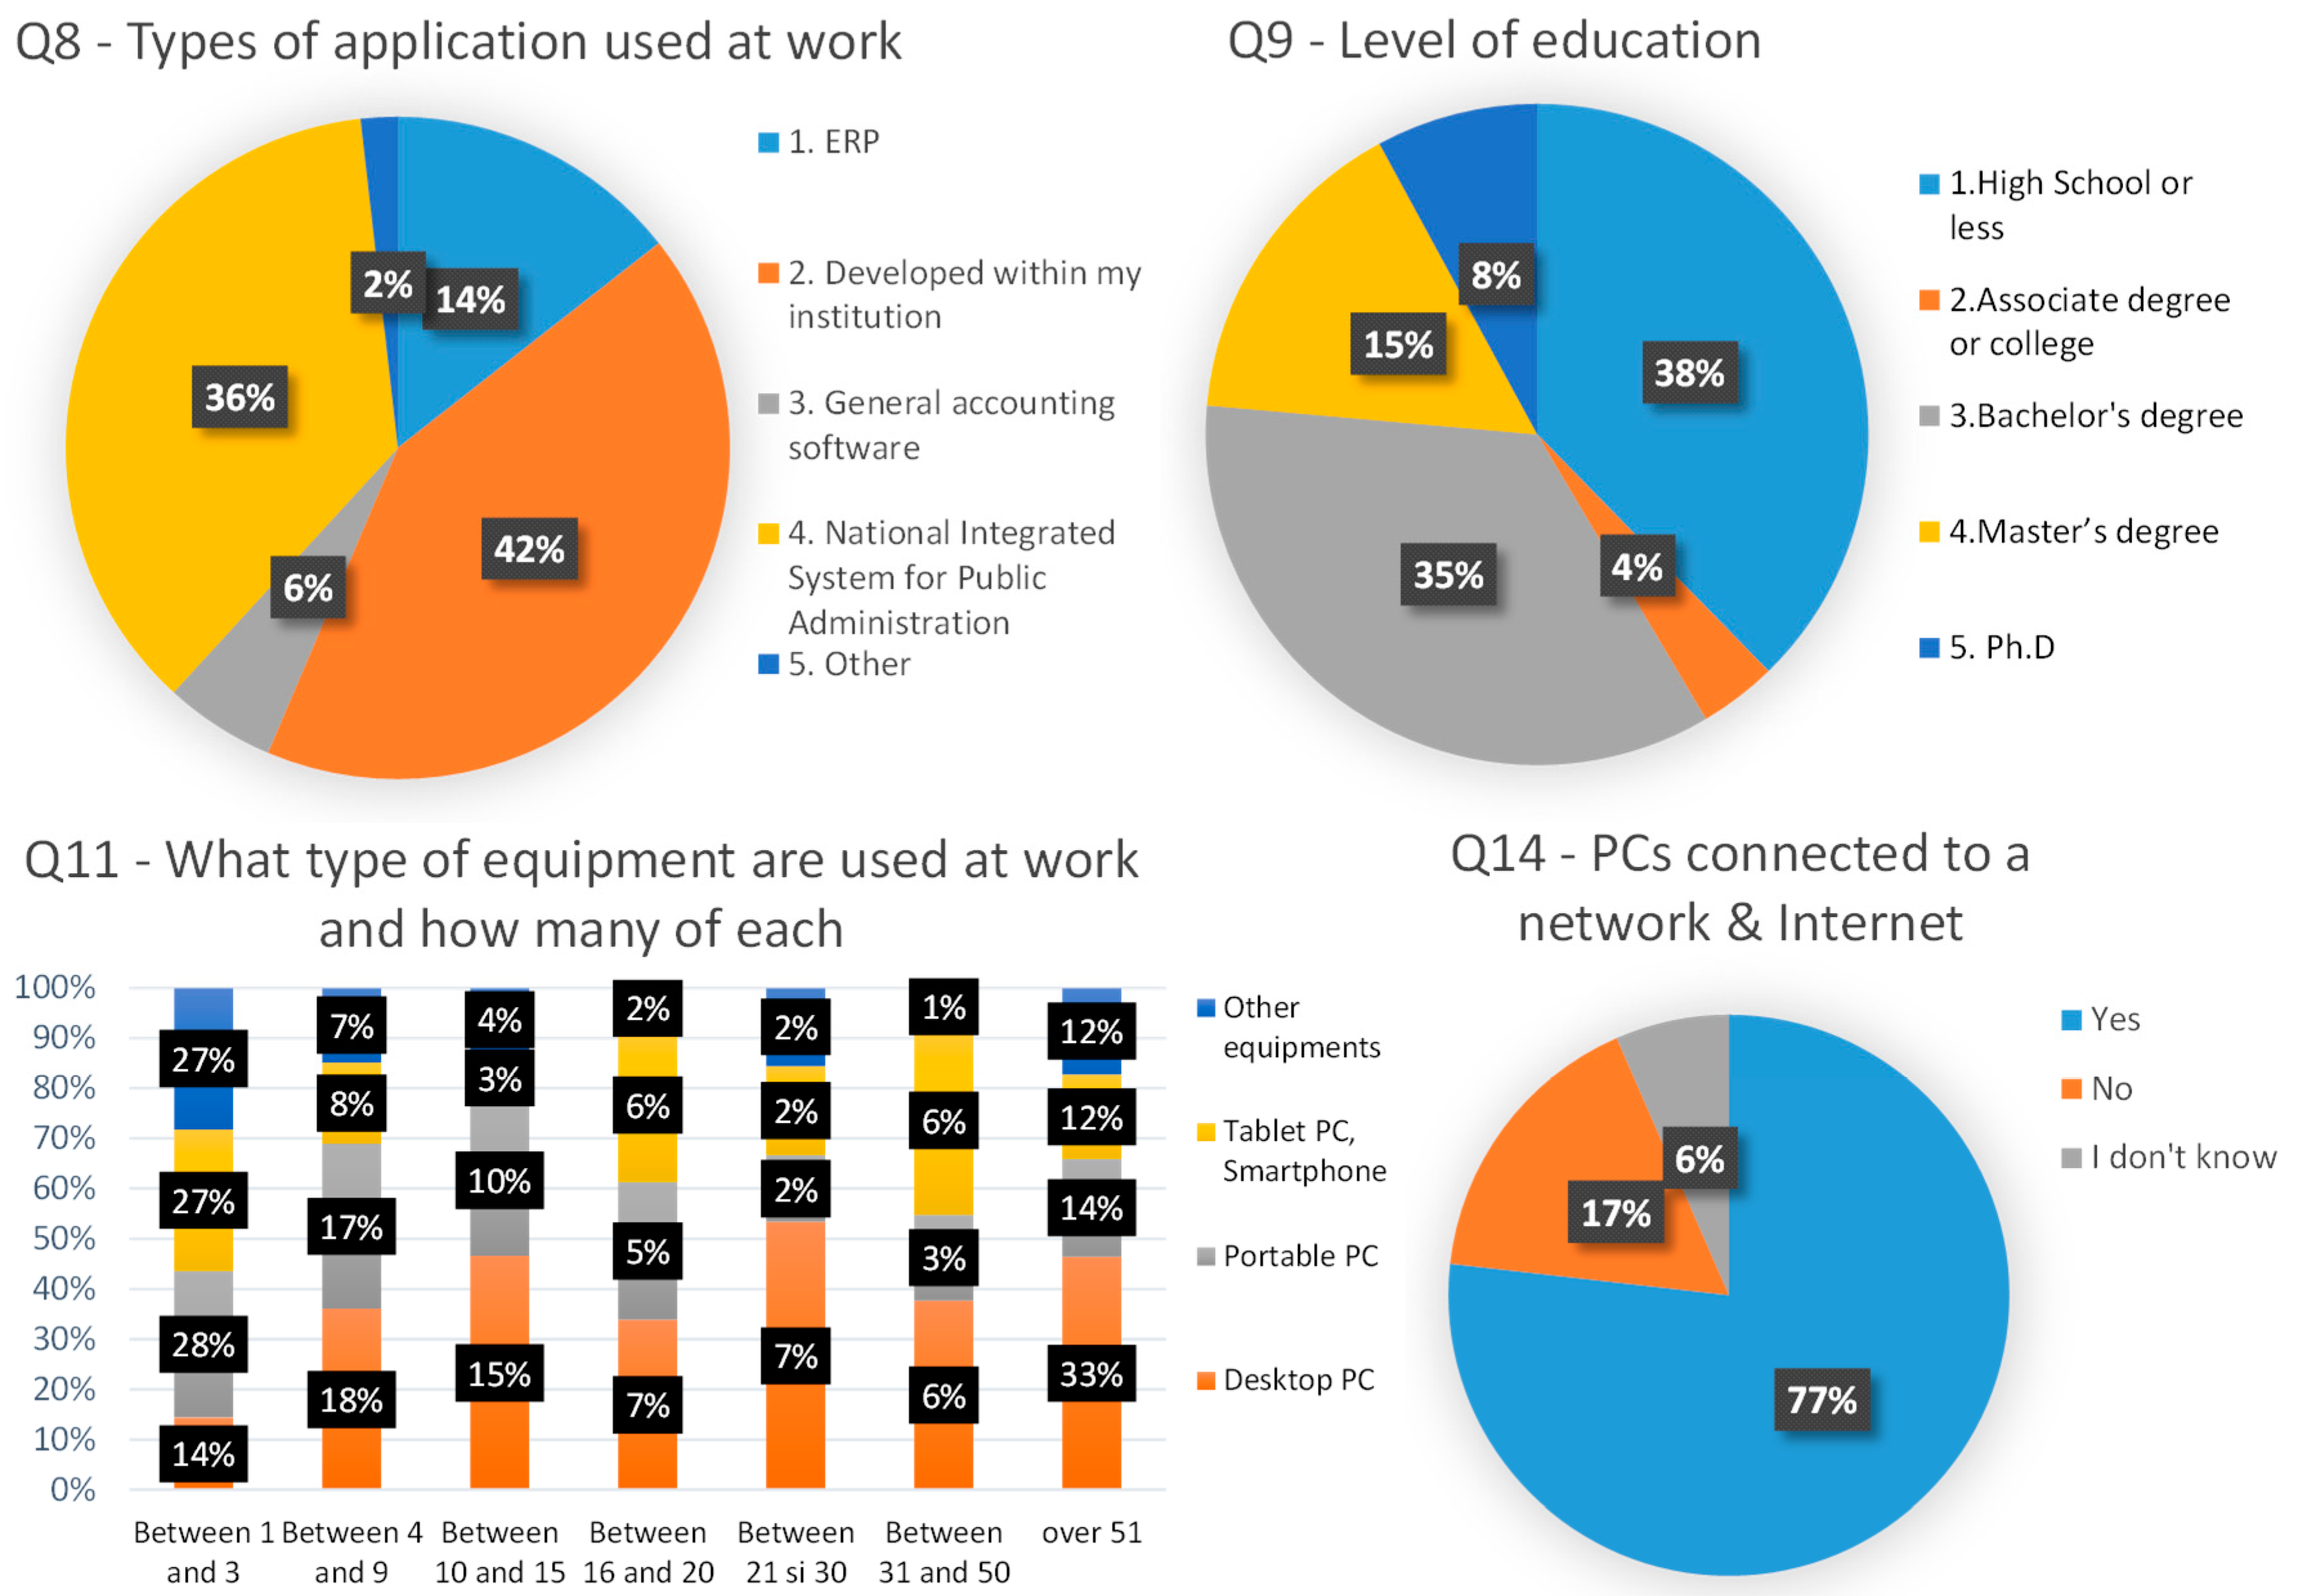
Table 1.
Association between questions in the questionnaire and the 6 states of the employees (authors’ own projection).
Table 1.
Association between questions in the questionnaire and the 6 states of the employees (authors’ own projection).
| No. | Question | Answer * | State of the Employees |
|---|---|---|---|
| Q15 | I think the number of requests, problems and complains I am faced with every day is too large compared to initial expectations. | 1 2 3 4 5 | I. Disappointment |
| Q18 | I am under the impression that the heavy workload mandated at my current job is diminishing the quality of my work. | ||
| Q19 | During the work hours I often find myself too busy or even exhausted. | ||
| Q21 | There are certain barriers between my workplace and family environment. | 1 2 3 4 5 | II. Conflicts |
| Q22 | My job responsibilities conflict my responsibilities at home. | ||
| Q23 | I cannot manage to complete my home duties because I have to complete my job duties. | ||
| Q16 | In general, I like what I do at my current job. | 1 2 3 4 5 | III. Satisfaction/Contentment |
| Q17 | I am pleased with my current job. | ||
| Q26 | I feel I contribute to the welfare of the organisation. | ||
| Q27 | In my opinion, I believe I perform my job duties optimally. | ||
| Q28 | I have several notable achievements in the workplace. | ||
| Q29 | At work, I believe I am efficient in completing my daily tasks. | ||
| Q30 | I am afraid that future technological innovations will endanger my job. | 1 2 3 4 5 | IV. Doubt |
| Q31 | I think other employees could be able to replace me. | ||
| Q32 | I am afraid my job will be wiped out. | ||
| Q33 | I am afraid my job will be outsourced. | ||
| Q35 | In the upcoming year I will take the necessary steps to find a new job. | ||
| Q38 | In the upcoming year I will take the necessary steps to find a job outside the ICT domain. | ||
| Q20 | I feel pressured by daily activities. | 1 2 3 4 5 | V. Exhaustion |
| Q24 | Having to go to work every day gives me a state of tension. | ||
| Q25 | I feel exhausted because of my job. | ||
| Q34 | I will stay in my current job for at least one year from here on. | 1 2 3 4 5 | VI. Attachment |
| Q36 | I will stay in my current job for five years from here on. | ||
| Q37 | I will work in the field of ICT (or I will use ICT tools in the workplace) over the next year as well. | ||
| Q39 | I will work in the field of ICT (or I will use ICT tools in the workplace) over the next five years. |
* Scale legend (column three): 1 strong agreement, 2 medium agreement, 3 low agreement, 4 disagreement, 5 strong disagreement.
Table 2.
List of questions defining the concept of ICT maturity and the elements that are closely connected to ICT (authors’ own projection).
Table 2.
List of questions defining the concept of ICT maturity and the elements that are closely connected to ICT (authors’ own projection).
| No. | Question | Answer |
|---|---|---|
| Q8 | What type of application do you use at work? If more, select the one used mostly | 1. ERP **, 2. Developed within my institution, 3. General accounting software, 4. National Integrated System for Public Administration, 5. Other |
| Q9 | What is your highest level of education | 1. High-School or less, 2. Associate degree or college, 3. Bachelor’s degree, 4. Master’s degree, 5. Ph.D. |
| Q11 | What type of equipment are you using at work and how many of each are available in your institution? *** | 1. Desktop PC, 2. Portable PC, 3. Tablet PC, 4. Smartphone, 5. Other equipment |
| Q12 | Please specify the level of ICT maturity in your organisation **** | 1. very high, 2. high, 3. medium, 4. very low, 5. low, 6. don’t know/cannot hierarchize |
| Q14 | Are computers connected into a network and to the Internet? | 1. Yes, 2. No, 3. Don’t know |
** ERP (Enterprise Resource Planning): SAP, Siveco, Microsoft Dynamics, WinMentor Enterprise, etc.; *** for each of the answers (1–5) the respondent was asked about the number. The options were: don’t know, between: 1 and 3, 4 and 9, 10 and 15, 16 and 20, 21 and 30, 31 and 50, over 51; **** the question was accompanied by the following description: How fully grown and developed is the organisation in its use of ICT and how fully grown and developed are its various ICT related processes (applications used, equipment available [number and diversity], security and policy, how well trained and educated are your organisation’s employees)? Try to answer with the best estimate.
Table 3.
Organisational issues related to the job. A hierarchy based on importance as ranked by the respondents (authors’ own projection in SPSS).
Table 3.
Organisational issues related to the job. A hierarchy based on importance as ranked by the respondents (authors’ own projection in SPSS).
| Hierarchy Based on Importance | Min. | Max. | Mean | Std. Deviation | Given Values for Each Question |
|---|---|---|---|---|---|
| Economic productivity and reduction of costs due to ICT | 1.0 | 5.0 | 1.772 | 1.1207 | 1 Very high importance 2 High importance 3 Medium importance 4 Low importance 5 Very low importance |
| Possibility to recover data in case of disaster | 1.0 | 5.0 | 1.892 | 1.2578 | |
| Reliability and efficiency of ICT | 1.0 | 5.0 | 1.965 | 1.1960 | |
| Project management | 1.0 | 5.0 | 2.000 | 1.0954 | |
| Data security and confidentiality via ICT | 1.0 | 5.0 | 2.009 | 1.3249 | |
| Knowledge management | 1.0 | 5.0 | 2.051 | 1.1536 | |
| Alignment between the economic and ICT aspects | 1.0 | 5.0 | 2.092 | 1.1823 | |
| Use of own computer equipment | 10 | 5.0 | 2.117 | 1.2455 | |
| Management of ICT–ITIL services | 1.0 | 5.0 | 2.146 | 1.1809 | |
| Strategic planning of ICT | 1.0 | 5.0 | 2.161 | 1.0995 | |
| Business agility and speed of reaction to market demands | 1.0 | 5.0 | 2.190 | 1.2632 | |
| Reduction of ICT costs | 1.0 | 5.0 | 2.297 | 1.2345 | |
| Attracting and retaining ICT professionals | 1.0 | 5.0 | 2.326 | 1.3726 | |
| ICT innovations that create revenues for organisations | 1.0 | 5.0 | 2.361 | 1.2982 |
Table 4.
ICT domains. A hierarchy based on importance as ranked by the respondents (authors’ own projection in SPSS).
Table 4.
ICT domains. A hierarchy based on importance as ranked by the respondents (authors’ own projection in SPSS).
| Hierarchy Based on Importance | Minimum | Maximum | Mean | Std. Deviation | Given Values for Each Question |
|---|---|---|---|---|---|
| Business Intelligence–Analytics | 1.0 | 5.0 | 2.180 | 1.2832 | 1 Very high importance 2 High importance 3 Medium importance 4 Low importance 5 Very low importance |
| Technologies for harnessing datamining data | 1.0 | 5.0 | 2.206 | 1.3137 | |
| Desktop or Server Virtualisation | 1.0 | 5.0 | 2.206 | 1.2794 | |
| Software as a SaaS service | 1.0 | 5.0 | 2.301 | 1.3339 | |
| Telecommunication networks | 1.0 | 5.0 | 2.329 | 1.3543 | |
| Collaborative systems and data flow systems | 1.0 | 5.0 | 2.345 | 1.2692 | |
| Mobile and wireless applications | 1.0 | 5.0 | 2.383 | 1.3901 | |
| Customer-relationship management (CRM) | 1.0 | 5.0 | 2.396 | 1.4092 | |
| Social networks–Social Media | 1.0 | 5.0 | 2.424 | 1.3466 | |
| Service-oriented architecture (SOA) | 1.0 | 5.0 | 2.560 | 1.3891 | |
| Cloud computing | 1.0 | 5.0 | 2.582 | 1.2559 | |
| BigData systems | 1.0 | 5.0 | 2.620 | 1.3644 | |
| ERP integrated business platforms | 1.0 | 5.0 | 2.633 | 1.3586 | |
| Development of applications for mobile devices | 1.0 | 5.0 | 2.759 | 1.4384 |
Table 5.
Rate of use of a computerized tool in the workplace and type thereof (authors’ own projection in SPSS, * significant at 99%).
Table 5.
Rate of use of a computerized tool in the workplace and type thereof (authors’ own projection in SPSS, * significant at 99%).
| Question | Answers | Please Estimate How Much You Use Computerized Tools in the Workplace | ||
|---|---|---|---|---|
| Max. 25% | 26 to 50% | Over 50% | ||
| Count | Count | Count | ||
| If you use a computerized tool at your current job for performing your daily tasks, mention the relevant category of the computer application: | Other | 24 | 37 | 50 |
| ERP (integrated business accounting system: SAP, Siveco, Dynamics, etc.) | 12 | 3 | 39 | |
| An application developed inside the institution | 31 | 23 | 81 | |
| Generalized accounting product (Ciel, Saga, Pionier, WinMentor, etc.) | 4 | 5 | 5 | |
| Total % of Grand total | 71 (22.61%) | 68 (21.66%) | 175 (55.73%) | |
| Chi-square test P-value | 22.697 0.001 * | |||
Table 6.
Results of independence test (chi-square) between the six variables (table header) and the states of the employees (authors’ own projection in SPSS, * statistically significant <0.5%).
Table 6.
Results of independence test (chi-square) between the six variables (table header) and the states of the employees (authors’ own projection in SPSS, * statistically significant <0.5%).
| State of the Employees|Statistics | Age | Sex | Sub-Sector of Activity | Education | Labour Seniority | |
|---|---|---|---|---|---|---|
| I. Disappointment | Chi-square | 81.376 | 6812 | 47.788 | 68.064 | 68.682 |
| Df | 20 | 4 | 16 | 16 | 16 | |
| Sig. | 0.000 * | 0.044 * | 0.000 * | 0.000 * | 0.000 * | |
| II. Conflicts | Chi-square | 48.874 | 12.809 | 30.041 | 43.242 | 52.369 |
| Df | 20 | 4 | 16 | 16 | 16 | |
| Sig. | 0.000 * | 0.012 * | 0.018 * | 0.000 * | 0.000 * | |
| III. Satisfaction/Contentment | Chi-square | 55.389 | 31.696 | 31.287 | 52.410 | 43.947 |
| Df | 20 | 4 | 16 | 16 | 16 | |
| Sig. | 0.000 * | 0.000 * | 0.012 * | 0.000 * | 0.000 * | |
| IV. Doubt | Chi-square | 70.044 | 12.603 | 55.102 | 36.722 | 62.634 |
| Df | 20 | 4 | 16 | 16 | 16 | |
| Sig. | 0.000 * | 0.013 * | 0.000 * | 0.002 * | 0.000 * | |
| V. Exhaustion | Chi-square | 33.730 | 10.240 | 60.843 | 51.857 | 79.900 |
| Df | 20 | 4 | 16 | 16 | 16 | |
| Sig. | 0.028 * | 0.037 * | 0.000 * | 0.000 * | 0.000 * | |
| VI. Attachment | Chi-square | 114.297 | 1.441 | 72.595 | 46.920 | 104.799 |
| Df | 20 | 4 | 16 | 16 | 16 | |
| Sig. | 0.000 * | 0.837 | 0.000 * | 0.000 * | 0.000 * | |
Table 7.
Disposal of the two components (motivation and LLL-related elements) in the questions in the questionnaire.
Table 7.
Disposal of the two components (motivation and LLL-related elements) in the questions in the questionnaire.
| Motivation for Engaging in an LLL Process | Means of Engaging in LLL | Values | Question No. |
|---|---|---|---|
| Level I: To get a higher salary, would you be willing to: | participate in professional training courses scheduled after work and organised and paid for by your employer? | Yes/No | Q46 |
| participate in professional training courses scheduled after work and organised and paid for by yourself? | Yes/No | Q47 | |
| participate in job interviews at another institution, even if it entails more effort, particularly in terms of time? | Yes/No | Q52 | |
| try professional reconversion with all its implicit pros and cons? | Yes/No | Q53 | |
| Level II: To become more efficient in the workplace, would you be willing to: | participate in professional training courses scheduled after work? | Yes/No | Q49 |
| accept to do overtime on a daily basis for at least 3 months/year? | Yes/No | Q50 | |
| Level III: To be contented in the workplace and work in a friendly, dynamic and flexible environment, would you be willing to: | participate in professional training courses scheduled after work and organised and paid for by yourself? | Yes/No | Q54 |
| participate in professional training courses scheduled after work and organised and paid for by another institution than the one where you are currently working? | Yes/No | Q55 | |
| participate in job interviews at another institution, even if it entails more effort, particularly in terms of time? | Yes/No | Q56 | |
| try professional reconversion with all its implicit pros and cons? | Yes/No | Q57 |
Table 8.
Results of the association tests between the six states and the wish to engage in a specific LLL process (authors’ own projection in SPSS; * <0.5% significance).
Table 8.
Results of the association tests between the six states and the wish to engage in a specific LLL process (authors’ own projection in SPSS; * <0.5% significance).
| States of the Employees Statistics | Q46 | Q47 | Q52 | Q53 | Q49 | Q50 | Q54 | Q55 | Q56 | Q57 | |
|---|---|---|---|---|---|---|---|---|---|---|---|
| I. Disappointment | Chi-square | 23.360 | 27.033 | 24.824 | 18.621 | 42.511 | 65.986 | 18.202 | 19.769 | 47.399 | 62.612 |
| df | 8 | 8 | 8 | 8 | 8 | 8 | 8 | 8 | 8 | 8 | |
| Sig. | 0.003 * | 0.001 * | 0.002 * | 0.017 * | 0.000 * | 0.000 * | 0.020 * | 0.011 * | 0.000 * | 0.000 * | |
| II. Conflicts | Chi-square | 60.858 | 25.096 | 27.142 | 60.667 | 26.316 | 13.504 | 46.616 | 28.720 | 27.196 | 60.563 |
| df | 8 | 8 | 8 | 8 | 8 | 8 | 8 | 8 | 8 | 8 | |
| Sig. | 0.000 * | 0.001 * | 0.001 * | 0.000 * | 0.001 * | 0.046 * | 0.000 * | 0.000 * | 0.001 * | 0.000 * | |
| III. Satisfaction | Chi-square | 14.566 | 30.814 | 20.642 | 33.034 | 21.915 | 16.347 | 24.162 | 15.086 | 38.671 | 38.860 |
| df | 8 | 8 | 8 | 8 | 8 | 8 | 8 | 8 | 8 | 8 | |
| Sig. | 0.048 * | 0.000 * | 0.008 * | 0.000 * | 0.005 * | 0.038 * | 0.002 * | 0.047 * | 0.000 * | 0.000 * | |
| IV. Doubt | Chi-square | 36,426 | 43.200 | 21.866 | 26.714 | 23.463 | 27.520 | 31.715 | 20.836 | 41.054 | 37.141 |
| df | 8 | 8 | 8 | 8 | 8 | 8 | 8 | 8 | 8 | 8 | |
| Sig. | 0.000 * | 0.000 * | 0.005 * | 0.001 * | 0.003 * | 0.001 * | 0.000 * | 0.008 * | 0.000 * | 0.000 * | |
| V. Exhaustion | Chi-square | 28.335 | 29.025 | 15.915 | 39.484 | 21.432 | 26.649 | 23.535 | 21.112 | 29.813 | 23.117 |
| df | 8 | 8 | 8 | 8 | 8 | 8 | 8 | 8 | 8 | 8 | |
| Sig. | 0.000 * | 0.000 * | 0.044 * | 0.000 * | 0.006 * | 0.001 * | 0.003 * | 0.007 * | 0.000 * | 0.003 * | |
| VI. Attachment | Chi-square | 23.877 | 36.385 | 28.225 | 15.089 | 85.293 | 24.317 | 24.066 | 27.576 | 35.503 | 32.701 |
| df | 8 | 8 | 8 | 8 | 8 | 8 | 8 | 8 | 8 | 8 | |
| Sig. | 0.002 * | 0.000 * | 0.000 * | 0.047 * | 0.000 * | 0.002 * | 0.002 * | 0.001 * | 0.000 * | 0.000 * | |
Table 9.
Results of the correlation between the six states of the employees (authors’ own projection in SPSS).
Table 9.
Results of the correlation between the six states of the employees (authors’ own projection in SPSS).
| Xi Xj | I. Disappointment | II. Conflicts | III. Satisfaction/Contentment | IV. Doubt | V. Exhaustion | VI. Attachment | |
|---|---|---|---|---|---|---|---|
| I. Disappointment | Pearson Correlation | 1 | |||||
| Sig. (2-tailed) | |||||||
| N | 335 | ||||||
| II. Conflicts | Pearson Correlation | 0.476 ** | 1 | ||||
| Sig. (2-tailed) | 0.000 | ||||||
| N | 335 | 335 | |||||
| III. Satisfaction/Contentment | Pearson Correlation | −0.113 * | −0.167 ** | 1 | |||
| Sig. (2-tailed) | 0.039 | 0.002 | |||||
| N | 335 | 335 | 335 | ||||
| IV. Doubt | Pearson Correlation | 0.429 ** | 0.527 ** | −0.167 ** | 1 | ||
| Sig. (2-tailed) | 0.000 | 0.000 | 0.002 | ||||
| N | 335 | 335 | 335 | 335 | |||
| V. Exhaustion | Pearson Correlation | 0.695 ** | 0.671 ** | −0.224 ** | 0.550 ** | 1 | |
| Sig. (2-tailed) | 0.000 | 0.000 | 0.000 | 0.000 | |||
| N | 335 | 335 | 335 | 335 | 335 | ||
| VI. Attachment | Pearson Correlation | 0.240 ** | 0.109 * | 0.172 ** | 0.363 ** | 0.225 ** | 1 |
| Sig. (2-tailed) | 0.000 | 0.046 | 0.002 | 0.000 | 0.000 | ||
| N | 335 | 335 | 335 | 335 | 335 | 335 | |
* correlation, ** strong correlation.
© 2019 by the authors. Licensee MDPI, Basel, Switzerland. This article is an open access article distributed under the terms and conditions of the Creative Commons Attribution (CC BY) license (http://creativecommons.org/licenses/by/4.0/).
Share and Cite
MDPI and ACS Style
Păvăloaia, V.-D.; Georgescu, M.R.; Popescul, D.; Radu, L.-D. ESD for Public Administration: An Essential Challenge for Inventing the Future of Our Society. Sustainability 2019, 11, 880. https://doi.org/10.3390/su11030880
AMA Style
Păvăloaia V-D, Georgescu MR, Popescul D, Radu L-D. ESD for Public Administration: An Essential Challenge for Inventing the Future of Our Society. Sustainability. 2019; 11(3):880. https://doi.org/10.3390/su11030880
Chicago/Turabian StylePăvăloaia, Vasile-Daniel, Mircea Radu Georgescu, Daniela Popescul, and Laura-Diana Radu. 2019. "ESD for Public Administration: An Essential Challenge for Inventing the Future of Our Society" Sustainability 11, no. 3: 880. https://doi.org/10.3390/su11030880
Note that from the first issue of 2016, this journal uses article numbers instead of page numbers. See further details here.