Young Romanians’ Transition from School to Work in a Path Dependence Context

1
Faculty of Geography and Geology, University Al. I. Cuza, 700505 Iasi, Romania
2
Geography Group, Department of Iasi, Romanian Academy, 700505 Iasi, Romania
*
Author to whom correspondence should be addressed.
Sustainability 2019, 11(5), 1254; https://doi.org/10.3390/su11051254
Submission received: 23 January 2019
/
Revised: 21 February 2019
/
Accepted: 25 February 2019
/
Published: 27 February 2019
(This article belongs to the Special Issue The Importance of Sociology of Education for a Sustainable Future)
Abstract
:For the past 25 years, Romania crossed a contradictory evolution between the social–educational and economic aspects. From the inflexible educational system of the totalitarian regime, when all graduates from different levels of education immediately received a job (to avoid unemployment—a phenomenon that the communist authorities did not tolerate), there was a transition to an educational system marked by frequent structural and methodological changes and by an increasing gap between the educational offer and the real necessities of the labor market. In this context, the aim of this paper was to analyzes, in the light of the sociology of education, the difficulties met by the new generations that enter the labor market after following a previously established educational model, often intended to be changed according to European sociological principles, but with deeply rooted mentalities and structure, actually difficult to alter. The ability to adapt to the new socio-economic context and to adjust educational programs to the new labor market requirements, in a strong correlation with the European policies, is constantly taken into account by interpreting the results in the spirit of the sociology of education and sustainable development.
1. Introduction
Investments in education cause the human capital to develop, bringing about a wide range of social advantages, such as improved health state, and lower criminality rate and dependence on social allowances. Therefore, it must be regarded as a long-term investment which results in future income and contributes to the development of the society—the higher the state’s spending on education is, the lower the inequity level will be in the future [1]. The objective of ensuring a functional relationship between the education system and the labor market cannot elude sustainability, a key concept in social change and in the sociology of education [2]. Education plays a significant part in achieving social and economic desiderata, at the same time contributing to economic equity and growth [3], the benefits being on short, medium, and long term, especially when it comes to higher education—73% of those who only completed secondary education hardly reach the average salary threshold, while only 27% of higher-education graduates find themselves in this situation [4]. From the point of view of the sociology of education, education and professional training gained increasing importance in all European countries, this statement being supported by the extended duration of compulsory schooling, by the increased spending on education, and a permanent adjustment of the educational offer to the economy demands. Education provides, most of the time, easier access to the labor market. A sustainable economy, based on knowledge, involves highly skilled jobs, thus improving the capacity of human resources, which means that the modernization and consolidation of the education system represents a priority for all European countries. The main explanation resides in the fact that the authorities became aware of the strong relationship between sustainable economic development and substantial investments in labor force, and between improved wealth and investments in human capital [5,6], as main topics in the sociology of education field. Starting from the complex relationship between education and labor, the former is one of the most important strategic points of concern for the European Union (EU) Member States, which designed “Education and Training 2020”, establishing some guiding objectives to be fulfilled by 2020: at least 15% of adults involved in lifelong learning; at least 40% of adults aged 30–34 having a tertiary education diploma; less than 10% early leavers from school and training; at least 75% employment rate for 20–64-year-olds [7].
According to Reference [8], these advantages can be of two types: market and non-market benefits, each of them manifested both at the private (decreased unemployment, larger earnings and work market flexibility, better health state and quality of children education) and social level (higher productivity, lower predisposition to criminality and infectious diseases). Consequently, a coherent higher education system represents a stimulus for better economic performance, alleviating inequity and ensuring a more equitable distribution of income and wealth [9], since education is converted into increased labor productivity by accumulating knowledge and skills, and by facilitating technological progress and innovation [10,11]. Educational institutions, as places where future citizens are trained, can play a key role in addressing the challenges of sustainable education [12], its objectives being to create a balance between the economic, social, and environmental dimensions [11]. The Sociology of Education Research Committee (RC04) selected and examined multiple aspects of the education–society relationship [13], the school-to-work transition being one of them. Education sociologists are interested in the patterns of younger graduates’ entry into the labor market and their effectiveness, highlighting the generally low support that young people receive to access jobs that are in line with their training and the fact that under-employment of well-trained young people is a problem encountered in all types of economies.
On the other hand, there is scientific “concern” as regards the fact that the purpose of increasing educational equality opportunities might have a negative impact on educational quality [14]. At the same time, the relationship between education and labor market should not be eluded, in the sense that the requirements of the latter should harmoniously overlap with the educational system from the quantitative and qualitative point of view, so that the young work force might get optimally integrated. This could be achieved by strengthening the cooperation between the supply and demand for labor, which could be enabled by a better collaboration between universities and economic decision-makers [15,16,17].
From another standpoint, we do not speak only about education in general, but also about the demand of developing a sustainable educational system, which stands in need of meeting three decisive criteria: lack of wasted talents, renewed energy for learning, and fostering students’ needs in order to enable them to shape the skills that are of uttermost importance for their future lives and for the future of our planet [18]. The necessity of creating and promoting a new curriculum at the beginning of the third millennium was motivated by the multiple changes that took place so far at different levels, ultimately endangering the Earth itself [19]. A sustainable education paradigm does not only rely on a traditional knowledge foundation, but it integrates new competencies, such as synthesis, integration, and appreciation of complex systems [20]. In this context, it is obvious that, in order to secure the future of the world, education must turn its face to sustainability, changing from transmissive to transformative learning, in order to better understand the ecological worldview and further contribute to ecologically sustainable societies [21]. According to the United Nations Educational, Scientific, and Cultural Organization (UNESCO) documents [22] quoted by Reference [23], Education for Sustainable Development involves eight important key competencies for sustainability, including systems thinking competency, strategic competency, collaboration or the very important integrated problem-solving competency, which is the ability to develop viable, inclusive, and equitable options that promote sustainable development. UNESCO demonstrates that education is vital to promoting sustainable development goals (SDGs) and sustainability skills and proposes 17 such SDGs, among which we can mention, in close connection with the topic of this article, SDG 4, on quality education, the provision of inclusive and equitable quality education and the promotion of lifelong learning opportunities for all, as well as SDG 8, on decent work and growth, promoting inclusive and sustainable economic growth, full and productive employment, and decent work for all [22,24].
In this regard, Shohel and Howes [25] grasped the relationship between education and sustainable development, designing three models meant to explain the role of education in arising aware of the human–nature system, in supporting the health of the planet we inhabit and in cultivating responsibility for the present and future world. Thus, the authors show that there is an education about sustainable development (which provides awareness and generates attitude and behavior changes), an education for sustainable development (which focuses on actions and skills acquired and practiced throughout one’s life), and a critical education toward sustainable development (which emphasizes the importance of knowledge production through critical actions and developing a critical spirit). In the long run, the social goal of education is geared toward building and maintaining a sustainable future.
Precisely starting from the manifold benefits that education brings both at the individual and society level, the access to education stands out as a very important issue, school dropouts often triggering long-term negative consequences [26]. It is generally considered that, most often, the main causes that obstruct the access to education are the type of residential area one lives in (rural environment is more vulnerable from this point of view [27,28] and stereotypes [29], but most of all poverty. Human capital (parents’ education, salary, and employment situation) and physical capital at home (material resources used for educational purposes) are positively associated with educational attainment [30]. Within the sociology of education field, school is universally recognized as the main tool for training tomorrow’s citizens; thus, each country should invest funds and allocate the best human resources to this system. As regards educational sustainability, the success of this process depends on all parties involved: students (who benefit from the educational process), parents (who operate a selection between different schools, but also greatly contribute to their children’s education), teachers (who define the strategy and guidelines but also put them into practice), and, last but not least, the local community (which supports the system by providing funds and benefits from an increasing overall educational level) [31]. A fast school-to-work transition ensures a successful integration into the work market. Nevertheless, there are certain elements that may intervene in this process: individual characteristics, the general economic and demographic situation, labor market institutions and regulation, education and training systems, and the mitigating effect of welfare regimes [32].
School-to-work transition is regarded by J. Perron et al. [33] as a process comprising not only the job search activity itself but also the frustrations that result from the constraints of finding work. Along the pathway toward finding their place on the labor market, people engage themselves in causal attribution analyses meant to make them integrate both the successes and failures they experienced throughout this process. The three constructs of the theory of action (attitude, social norms, and perceived control) are inter-correlated, positively predicting the level of intention, which is further connected to the process of job search, including the objective and subjective quality of the first job (Figure 1). According to economics literature [34], education and school years are attributes that validate the human capital theory, according to which education contributes to a better remuneration of one’s labor, the profitability of education, thus, proving to be positive and high. Education and diplomas play the part of a signal which is sent to the employer, indicating a certain capacity level the individual can have. This is beneficial for both parties—the graduate sells his/her services at a certain price (wages), and the employer is generally willing to pay higher wages to hire better laborers (wage signal).
Numerous studies focused on the inconsistency between the level of education achieved by young graduates and the level of education required on the labor market at that moment, educational mismatches which lead to an inefficient distribution of the human capital and, ultimately, to social and economic losses. For example, Jeong et al. [35] analyzed the way in which the labor market can keep up with a rapid increase in the educational level in three different countries (the United States of America (USA), Germany, and South Korea) and what happens when the labor market cannot provide a sufficient amount or quality of jobs, so as to fit the existing educational outcomes. The authors reached the conclusion that not only the job information system, but also different labor market institutions can play an important role in solving mismatches, especially when it comes to flexibility or job competency.
The breakdown of the communist regime in 1989 worked as a crossroads not only in the evolution of the Romanian education system, which was subject to various but often incoherent restructurings and reforms, but also in the social and economic environment, which was disturbed by serious disruptions: hundreds of thousands of people formerly employed in agriculture and industry lost their previously safe jobs, finding themselves forced to discover in themselves and develop new professional abilities meant to help them find their place within the newly set-up capitalism [36]. However, just like in other post-socialist countries, not all of them could be integrated within the private sector which emerged in the transition period [37].
These social and economic mutations brought about structural and functional changes in the educational field, reforms aimed at better adjusting the Romanian society to the European requirements of development [38] and, at the same time, at more efficiently aligning the qualities of the workforce to the requirements of the labor market, which are constantly expanding and diversifying [39]. Of course, this process was not gentle, as it was not even in the case of some countries which enjoyed successful experiments and pilots [40]. The transition from a centralized market profoundly pervaded by the communist ideology to the knowledge economy forced Romania to upgrade its educational system in keeping with the demands of the community acquis in the EU pre-integration period. After the collapse of socialism in former communist countries, education was granted a new part in training the youth for the “real world”, the school-to-work transition being more difficult and generating consistent disparities in terms of initial professional walk [41].
However, this transition to the acculturation to Western Europe and its developmental path was not soft, the reform path being undoubtedly often disturbed by the previous political, cultural, social, and economic path dependency matrix [42], the starting conditions being of crucial importance for the success of economic and socio-political transformations [43]. This means that present resolutions and actions can experience restrictions because of past markings which have long-lasting effects, even if they are no longer valid [44].
The authors considered the correlation between the school-to-work transition and the path dependence theory as necessary since the classic communist educational system, rather focused on the theoretical perspective of things than on practical experience, laid hardly ignorable marks on the present context of Romania. Consequently, the theoretical scheme comprising the four distinct evolution phases (Figure 2) was used to describe addictions directed to a set of variables and to clarify the existence of some correlations which can explain the synthetic phenomena observed in the first phase.
It can be argued that, during the period of time analyzed below, attitudes, social norms, and control perceived on the labor market changed profoundly, providing more freedom to jobseekers and complicating the evolution of the market processes. While these processes used to previously lead, theoretically, to an objective selection, subjective selection processes also resulted from individual choices. The various reforms shaped by different governments after 1989 (also motivated by the general perception that school institutions must get more and more competitive [47]) followed some important directions: highlighting educational sociological principles in an attempt of adapting school to the necessities of students, the implementation of new educational policies by means of a flexible territorial network, professionalization of school management and teaching career, and reorganization of the curricula, didactic methodology, and evaluation of academic results [48]. Post-communist decision factors tried to adjust the Romanian education to the needs of the modern and demanding international systems, understanding the necessity of shifting school processes and activities from those based on moral purposes to those which stake on productivity and efficiency [49] in order to improve and enlarge the cognitive skills of students [50], and to accommodate the present school curricula to the needs of a modern and demanding school system [51]. For example, we could mention the efforts made by Romania by means of the Informational Educational System (launched in 2001 by the Ministry of Education) to provide students with adequate equipment in order to help them acquire the minimum knowledge of computer science, in the context in which, in 2001, Romania recorded an average of 3.5 computers connected to the internet per 100 students. We must also bring forth the idea that, as a result of the shocks the Romanian economy was subject to after 1989, the occupational structure underwent important changes—not all former types of jobs were able to cope with the requirements of capitalism, which, among other things, largely promotes the reprofessionalization of a certain segment of the labor force in the direction of its absorption within the green sector [52]. The whole process involved a wide range of law initiatives against the background of a constant and significant problem: the low funding of education at all levels [19]. However, many times, these reforms were regarded and perceived as genuine quasi-experiments in the field of the educational policies, with “painful” effects [53]. Despite these steps forward, Romania still faces considerable challenges, such as the large number of children not integrated into the educational system and the high rate of early school leaving and investments in higher education, although beneficial to economic growth, not being able to lower social disparities, as people at risk of exclusion generally face difficulties in graduating from secondary education. This happens against the background of an increasing role of education in smoothing the transition from school to work, which is many times subject to structural dysfunctionalities, since we can speak of a growing incidence of NEETS—youth who are not in employment, education, or training, as a consequence of not managing to get a job after graduation [54]. This happens because of the rising rigidity of the labor market [55] generated by the fact that the requirements of the work field do not perfectly match the configuration of the work force, a fact which exposes them to the challenge of consenting to underemployment in order to bypass unemployment, while ignoring its negative consequences on their career success at a later stage of their lives [56].
2. Materials and Methods
Starting from the statistics provided by the Romanian National Institute of Statistics [57] and Eurostat [58], the analysis methodology comprised two different stages as follows:
- (1)
- The descriptive analysis of representative indicators, depending on identified evolution trends and cycles, correlated with significant moments of the political, economic, and educational transition: the privatization of services and productive activities, the relaxation of the access to the EU labor market beginning with 2001, the EU integration after 2007, and the manifestation of the recent economic crisis (2009–2014);
- (2)
- The selection of the representative indicators with coherent chronological data series in order to test the extent to which their evolution corresponds to the theoretical path dependence model. The chosen indicators were grouped into three categories (those describing the evolution of unemployment, those depicting the dynamics of the labor market, and those related to vocational training) and used to produce a principal component analysis following three steps, listed below.
- (a)
- Designing an unemployment rate index and an employment rate index
The synthetic analysis was based on the evolution of two indicators: IU (unemployment index) and IE (employment index). The period established for analysis was 1990–2016, and the authors made use of relative values (standardized values at the arithmetic mean of each chronological series). The option for standardization was meant to remove extreme variations, with standardization bringing further comparability and accuracy. The values of the two indices were estimated on the basis of a principal component analysis (PCA) that allowed score function parameters to be obtained. The following independent variables were considered in order to calculate IU and IE:
- Unemployment rate (UNR) for IU;
- Unemployment 15–24 years (U 15–24) for IU;
- NEET unemployment (U-NEET) for IU;
- High school and higher education unemployment (U-HSHE) for IU;
- Employment rate (ER) for IE;
- Total activity rate (RTACT) for IE;
- Total activity rate 15–24 years (RTACT 15–24) for IE;
- Total activity rate 25–34 years (RTACT 25–34) for IE.
For the calculation of IU and IE, the matrix of the abovementioned components was considered. The equation model took into account the β and γ values of the components. The mathematical formalization of the equation was as follows:
(IU) = β1 · UNR + β2 · U 15-24 + β3 · U-NEET + β4 · U-HSHE;
(IE) = γ1 · ER + γ2 · RTACT + γ3 · RTACT 15–24 + γ4 · RTACT 25–34.
The equations obtained by introducing the estimations resulted from the PCA were as follows:
where IU ≈ N(0,1), with min(IS) = −1 and max(IS) = 1; IE ≈ N(0,1) with min = −1 and max = 1.
(IU) = −0.877 · UNR + 0.867 · U 15–24 + 0.888 · U-NEET + 0.464 · U-HSHE,
(IE) = 0.969 · ER + 0.926 · RTACT + 0.868 · RTACT 15–24 + 0.962 · RTACT 25–34,
- (b)
- Estimating and testing the influence of some explanatory factors, such as share of the population attending vocational training, share of persons following such courses, share of secondary- and higher-education graduates, and share of school population aged 15–23. In order to estimate and test this influence, a multiple regression was conducted based on four determinants: the share of people attending vocational training (PCP), the share of the unemployed attending vocational training (UCP), the share of graduates with higher education (HED), and the share of the 15–23-year-old school population (PS 15–23). The regression model retained for IU and IE was as follows:IU = θ0 + θ1 · PCP + θ2 · UCP + θ3 · HED + θ4 · PS 15–23 + ε;IE = θ0 + θ1 · PCP + θ2 · UCP + θ3 · HED + θ4 · PS 15–23 + ε.
- (c)
- Estimating and testing the influence over time of the explanatory factors on the two indices, the third period (2009–present) being taken as a reference point. The retained analysis model was as follows for each of the two indices:IU = θ0 + θ1 · PCP + θ2 · UCP + θ3 · HED + θ4 · PS 15–23 + θ5 · P1 + θ6 · P2 + θ7 · P1· PCP + θ8 · P1 · UCP + θ9 · P1 · HED + θ10 · P1 · PS 15–23 + θ11 · P2· PCP + θ12 · P2 · UCP + θ13 · P2 · HED + θ13 · P2 · PS 15–23 + ε;IE = θ0 + θ1 · PCP + θ2 · UCP + θ3 · HED + θ4 · PS 15–23 + θ5 · P1 + θ6 · P2 + θ7 · P1· PCP + θ8 · P1 · UCP + θ9 · P1 · HED + θ10 · P1 · PS 15–23 + θ11 · P2· PCP + θ12 · P2 · UCP + θ13 · P2 · HED + θ13 · P2 · PS 15–23 + ε.
The analysis of the main components (PCA) was used in order to obtain the two indices, while generalized linear models (GLMs) [59] facilitated the analysis of the influence over time of the considered factors on the two indices. The option for this modeling pattern was based on the hypothesis of a significant influence of the explanatory factors on the change of the transition from school to work, since they could be considered as predictors of cyclical changes and evolutionary trends. The ultimate aim of the analysis was to identify the peculiarities of the school-to-work transition in Romania and to determine its degree of dependence on the factors that are involved in the labor market. This objective was necessary to be able to analyze the territorial disparities arising from the manifestation of a differentiated resilience capability to the shocks of transition. The previously mentioned variables are understood according to their definition by the Eurostat methodology.
3. Results and Discussion
3.1. Descriptive Analysis
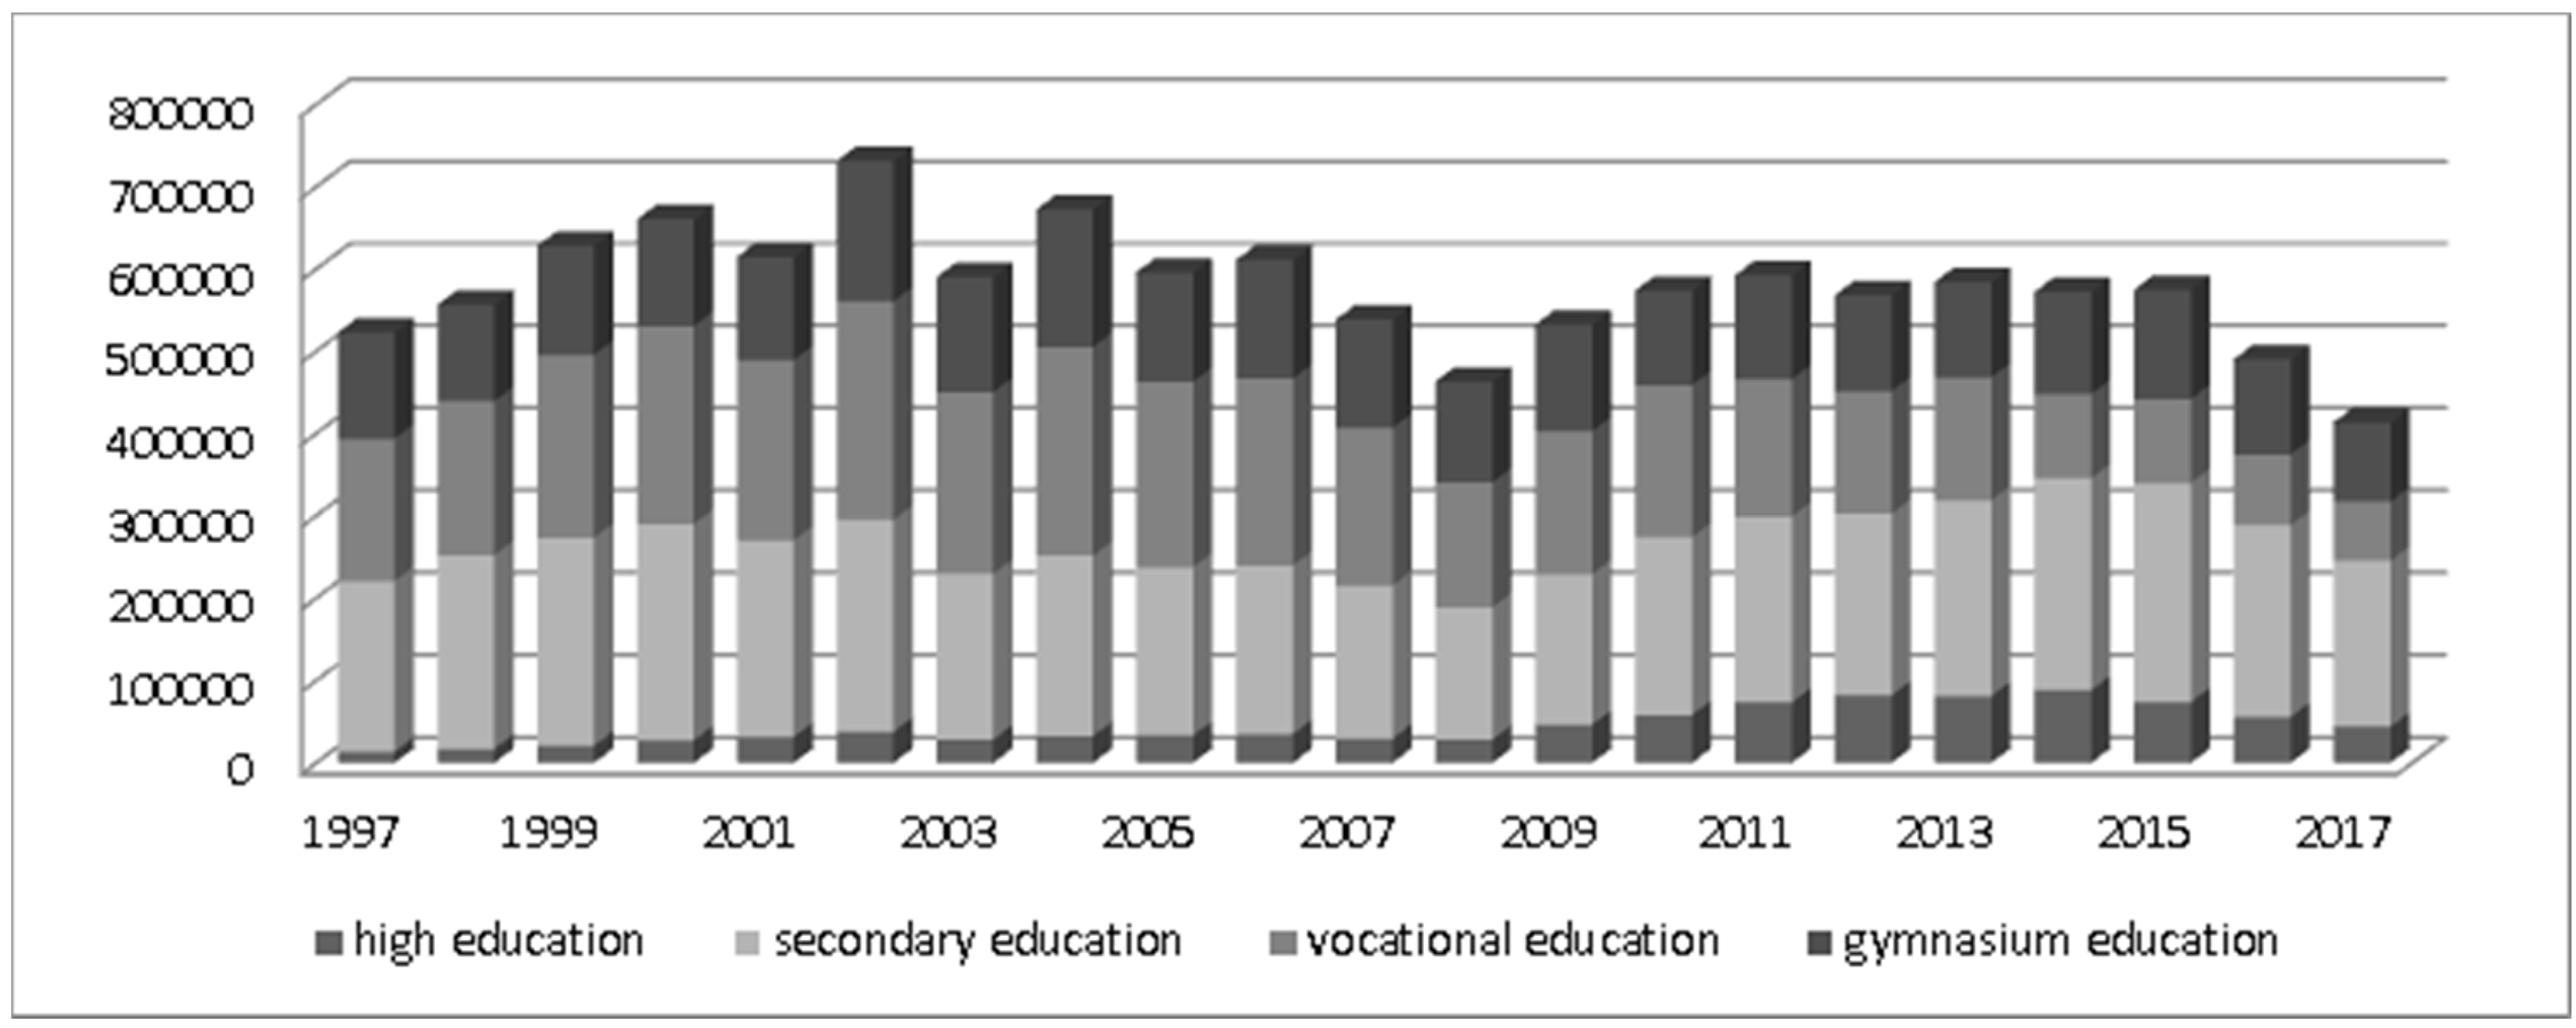
The descriptive analysis of some indicators referring to the relationship between schooling, sustainable education for the future, and the labor market shows that the Romanian society faced a period of significant mutations. Educational policies, although not explicitly geared toward meeting the demands of a changing labor market, tried to mitigate negative evolutions, such as youth unemployment (15–24 years) or dropout rates. The lack of coherent policies is also the result of the inconsistency of spending on education which, although steadily rising after 1990, ranged between 3.4% and 4.4% of gross domestic product (GDP), regardless of macroeconomic conditions, representing one of the lowest budget allocations in Europe. The desideratum frequently promoted by electoral campaigns or public speeches of politicians (6% of GDP) is far from being reached. In 2004, for example, Romania had the lowest budget share for education in Europe, with only 3.29%, compared to the 5.1% average of the 24 EU Member States, with values ranging from 8.47% in Denmark to 3.93% in Luxembourg. However, it is noteworthy that, after having fluctuated around 3–3.5% of GDP, the budget allocated to education experienced a significant leap in 2006 (4.52%), approaching the EU average [60]. Unfortunately, subsequent values were lower, never again reaching the 2006 peak. Demographic changes led to a drop in school population, progressively propagated from primary to higher education, generating an increase in enrolment in secondary or higher education, where new permanent study programs were opened or private institutions were developed (Figure 3).
The more significant increase in the enrolment rate in higher education was manifested until 2008 when, following the entry into this cycle of the generation born in 1990 (a year which recorded a steep decline in birth rates), there was a significant decline which continued until 2014, closely linked with the 2009–2013 economic crisis and the European integration in 2007, which opened up multiple job mobility opportunities (Figure 4). It should be noted that the number of average education graduates (aged 15–18) was rather steady in recent years, the decline caused by the drop in birth rate in 1990 not being felt. This shows a sustainable trend of massive inclusion in the average education system, correlated with the constant reduction of the vocational–technical education opportunities.
School dropout has profoundly negative aftermaths for the future labor market, decreasing the chances of these persons of getting sustainably integrated into it and, thus, causing them to fail in playing a role in shaping a sustainable world. These trends are also revealed by the analysis of the evolution of the share of the low-educated population (gymnasium and elementary school graduates or persons having no education), but there are also contradictory phenomena. Although the reduction of their share was slow if we take into account the population aged 25–64 years (from 31% in 2000 to 28% in 2014, according to the data provided by the National Institute of Statistics), in the case of the population aged 25–34, there was a divergent trend compared to the group aged 55–64. The significant increase in the low-educated young population, from 13% in 2000 to 25% in 2014, is the effect of an often occulted phenomenon, that of early school leaving. Particularly manifested amongst high-social-risk populations (Roma community or the rural population as a whole), this phenomenon is ineffectively targeted by public policies. This evolution can also be correlated with the reduction in the number of places in vocational schools as a result of uninspired reforms. On the contrary, the generation aged 55–64 experienced a massive decrease in the analyzed range, precisely as a result of its massive inclusion in vocational education during the communist period.
As already pointed out, the phenomenon of school leaving is a reality, including in the medium- or higher-education cycle. The trend of increasing the share of students who do not get a baccalaureate or bachelor’s diploma strengthened especially after 2010, when the conditions for the organization of exams changed. The school dropout rate, which reflects the difference between the number of pupils enrolled at the beginning and at the end of the school year is, according to official figures, far from capturing reality, many of those who leave school being excluded from school records. The significant increase in abandonment rate in post-secondary and foremen education, two very popular forms of professionalization, can be assigned to deindustrialization (in the case of foremen schools) or to the competition induced by opening up higher-education branches (the case of nurse qualifications provided by universities and post-high schools). Correlated to the evolution of age structure, school dropout at the end of the gymnasium cycle can be estimated at over 30%, the highest level in the European Union. Territorial disparities are difficult to connect to the level of economic development or to the degree of urbanization, with more economically advanced areas (southern Transylvania, Banat) having a surprisingly high abandonment rate (Figure 5).
University dropout is more difficult to investigate, with official statistics providing incomplete information. In 2013, the National Alliance of Student Organizations in Romania [60] advanced a share of 38.7% of students who dropped out from higher education. The lack of professional orientation in pre-university cycles may be the main cause of this type of abandonment. This leads to an increasing risk of poverty, inequalities, and low welfare, which does not comply with the sociological principles of sustainable development, according to which the labor market should be inclusive, providing real work opportunities and good-quality jobs able to ensure social security and a living salary. Extending the duration of studies had no effect on the transition from school to work. On the contrary, as the period spent in various forms of education was prolonged, the youth employment rate continued to decline, inducing more and more pressure on the public sector to generate jobs for a growing number of higher-education graduates. The employment rate among young people (15–24 years old) was steady in recent years, following a long-lasting downward trend. The value recorded in 2015 (23.9%) is well below the European average (32.9%), expressing both the lack of opportunities and the manifestation of a cultural model (Figure 6). Romania is dealing with some critical situations regarding the rate of young people who neither work nor study. This leads to an increasing risk of poverty and inequalities.
The analysis by educational level shows a declining trend of the employed working-age group (15–64 years old) for the population with an average or low education level and a positive dynamic in the case of the population with higher education. This evolution, contrary to the general dropping declining trend recorded by the employed population, introduced significant changes in the structure of the employed population by its professional training, with the share of the tertiary education category rising from 9.8% in 2000 to 18.6% in 2012. This doubling, in a relatively short period of time, can be interpreted as an effect of the increased quality of jobs, especially in services, which became dominant as a form of employment during this period. The 2020 estimations show that this trend will continue, with values approaching the EU average (32% in 2016) [58]. The employment rate of young people aged 15–24 dropped directly proportionally to the increase in the number of students. The labor market response to this new situation was a rise in the number of employees, in the education system, especially in the humanities and socio-economic fields, to the detriment of the technical specializations, which experienced a regress. Generating new jobs could not keep up with the alert rhythm of growth of the number of graduates with higher education. New jobs in attractive areas (financial/banking, information technology (IT)) are concentrated in major cities, and the services sector clearly exceeds the productive field in providing new opportunities.
There is a direct relationship between the level of education and unemployment, which reflects the lack of performance or, on the contrary, the performance of the educational system. Unemployment rates generally decrease when the level of education increases. The labor market more easily absorbs a graduate with higher education, even below his competencies, mainly due to his integration capacity and his openness to life-long learning. The recent evolution shows that there is a tendency of convergence in Romania; the number of those unemployed with average education, which recorded high values for a long period of time, is now dropping, while that of those unemployed with higher education is increasing. This raises another question on the effectiveness of the Romanian educational system. By age group, there is an increase in the difference between those aged 15–24 and those over 25 years, thus proving that the young people are the most vulnerable on the Romanian labor market. The high number of unemployed young people aged 15–24 and 25–34 reflects the inefficiency of the education system and the lack of knowledge of the new market principles, based on competition and competitiveness, the lack of studies on labor market demands, the inflexibility of initial training programs, and their lack of finality, as well as a slow process of accepting the new principles of continuing education and its role in adjusting the educational defects brought about by the economic transition. The benefits of higher education can also be noticed by analyzing the level of training of the unemployed. In 2014, Romania recorded 142,955 unemployed people who had completed a pre-university or university form of education. If we refer to primary, secondary, and vocational education graduates, they represent 45.69% of the total number of unemployed. Those unemployed with high-school and post-high-school education count up to 41.45%, while only 18.382 (12.86%) of those unemployed are registered as having higher education [57]. It is conspicuous that tertiary-education institutions can play the role of genuine levers capable of promoting regional sustainability projects meant to alleviate regional disparities [61], including by providing impartial educational opportunities and by helping preventing dropout as part of the sustainable education sociological strategy. In order to achieve these goals, universities have to develop a governance culture based on the principles of social responsibility [62], further contributing to deepening the interrelation between economic and social performance, as well as to designing sustainable sociological solutions to the challenges of the 21st century [63]. The comments are obvious, whereby the unemployment rate is decreasing by passing from a lower level of education to a higher one and by getting old (as a matter of fact, age and the level of education/qualification are directly correlated) (Figure 7).
Against this general background, the labor force is unevenly affected by labor market disruptions and/or the disagreements between demand for qualifications and skills on the labor market and the supply of the education system—the education market. Thus, the unemployment rate of young people aged 15–24 was and still is the highest; in the period 1999–2002, it was more than double in comparison to the 35–64 age group. In addition, this group (usually with a low or intermediate qualification at the most) has to face one more problem: the security of the job people have at some point. Thus, the risk of unemployment is higher for this category, which ranks among the most disadvantaged on the labor market. In countries such as Belgium, Estonia, Greece, Spain, France, Ireland, Italy, Latvia, Lithuania, Poland, Slovakia, Finland, Sweden, Bulgaria, and Romania, the unemployment rate of this age group exceeds 20% [58]. The unemployment risk (caused by the periodical fluctuations of the two markets (labor and education) is the most strongly felt by both the youngest and the oldest workers. Of course, with respect to the variations in the unemployment rate (including that of people with higher education per age groups), there are natural differences in time and space between the member countries. As regards the Romanian youth’s unemployment rate (15–24 years old), while it was 18.3% in 2000, below the EU 27 average (18.4%), in 2010, it was much higher (22.1%), exceeding the European average (20.9%). After 2008, there was a sharp rise in the youth unemployment rate from 18.6% (2008) to 23.7% (2011), an increase comparable to that recorded at the EU 27 level (5.1 pp). In 2012, the youth unemployment rate was 22.7%, down by one percentage point compared to the previous year and very close to the European average of 22.8%, but well below the level recorded in Member States such as Greece (55.3%), Spain (53.2%), Portugal (37.7%), and Italy (35.3%) [58]. It should be noted that the unemployment figures in Romania are masked by massive emigration (3–4 million Romanian citizens, according to current estimates [57]).
A worrying factor is the increase in the number of young people (aged 15–24) who are not in education, employment, or training (the so-called NEETs), which indicates difficulties in the transition from the education system to the labor market and which represents one of the categories that particular attention should be paid to in the coming period. The high level of young people who are neither employed nor involved in any form of education or training increases the poverty and social exclusion risk among these people. In 2008, the NEETs group comprised 11.6% of the Romanian youth aged 15–24, the share recording a rising tendency until 2015 (the year which registered the highest value of this indicator—18.1%), followed by a descending trend during the next two years [64], against the background of a constant overrepresentation in comparison to the EU dynamics (Table 1).
The school-to-work transition is easier for those who work during their studies. In European countries where there is a stronger link between school and work (which promote apprenticeship programs and where part-time work is supported by both employers and educational institutions etc.), the shift from school to work is much easier. Romania is among the EU states with the lowest percentage of young people working during studies [65] and, when they do it, they are forced to work full-time, which is a serious impediment to continuing and completing their education. In Europe, the share of working students is about 28%, with Finland (56%), Denmark (61%), and the Netherlands (69%) clearly standing out. At the opposite end, there are Romania, Bulgaria, and Greece, where less than 10% of students combine education and work, after Eurostat data. The youth in eastern Europe, formerly part of the communist bloc, face longer transition periods in comparison to the European average in the case of all low and medium educational levels. This is especially the case for Bulgaria (21.5 months), Slovakia (24.3 months), and Poland (17 months). Romania records slightly higher values than Hungary and the Czech Republic, being also above the European average: 12.5 months for those with a low educational level, 12 months for those with a medium educational level, and 7.3 months for those with a high educational level. Once more, we have confirmation of the fact that tertiary education helps people more easily find their place on the labor market [60].
3.2. Multivariate Analysis
- The descriptive statistical analysis of the parameters used (UNR; U 15–24, U-NEET, and U-HSHE for the unemployment index and ER, RTACT, RTACT 15–24, and RTACT 25–34 for the employment index) is displayed in Table 2.
The results of the PCA indicate the links between the variables the two indices comprise, being reinforced by the correlation matrix (Table 3). The significantly positive correlation between U-HSHE and UNR can be interpreted as an initial refusal of this category to accept the existing job offer. The unemployment which affects this category can be interpreted as a combination of structural unemployment and voluntary unemployment. The positive correlation between the unemployed who have never worked (NEE) and the 15–24 age group is logical, with their share being independent of the rate of unemployment, but relatively correlated with U-HSHE.
The matrix of component correlation served to calculate their influence on IU and IE, according to the equation model described in Section 2. The result of applying the equation shows that, in the case of IU, the values of the components used were less correlated (0.681) than in the case of IE (0.741) (Figure 8).
The interpretation of IU and IE values, supported by their graphic representation, demonstrates the difficulties young graduates (with average or higher education) face when trying to get inserted into the labor market, as well as the importance of the level of professional training. A deeper analysis (by introducing new variables, such as the share of unemployed people undergoing vocational training) may further highlight the importance of training activities even if the results indicate the difficult integration of young graduates into the labor market. A deeper dimension of this interpretation can also be obtained by testing the influence over time of the analyzed variables on IU and IE, given the gradual expansion of tertiary and vocational training, especially after integration in the European Union. This helps grasping the influences of the reminiscences of the centralized model of labor market integration, at least for the years 1990–2000, or the impact of the transition to a free market economy.
In this respect, two further analyses were carried out in order to deepen the results of the previous analysis.
- 2.
- The first of these two tested the influence of some variables considered as determinant factors for the previously calculated IU and IE. The four factors taken into account (PCP, UCP, HED, and PS 15–23) express, on the one hand, the relationship between the forms of vocational training, including those aimed at the unemployed, and, on the other hand, the relationship between IU and IE. The results of this analysis are shown in Table 4 and Table 5. This situation may reside in the fact that the Romanian labor market is insufficiently solid. On the basis of the determination ratio, estimated after performing the regression analysis, the four variables introduced in the analysis explain 45.8% of IU variation and 85.5% of IE variation. The fact that the UCP and PS 15–23 parameters are strongly correlated in the case of IU certifies the maximum incidence of unemployment among graduates with secondary or higher education. Consequently, the presence of major difficulties in labor market integration becomes indubitable. An explanation for the job offer being in contradiction with the demand is related to the excessively high share of the active population in the primary sector, which indicates sequelae of a chronic underdevelopment, especially in rural areas [66].
In the case of IE, the influence of UCP and PS 15-23 was significant, illustrating the importance of vocational training activities in reducing unemployment and in increasing employment. However, the contrasting values of the two parameters show that a graduation diploma is not sufficient for labor market integration, with post-secondary or post-graduate life-long learning activities being necessary. It should be noted that, from this point of view, Romania has the lowest values of the adult learning indicator in the European Union, even lower than those of candidate countries, in addition to the values dropping between 2011 and 2016 (from 1.6% to only 1.2% compared to the European averages of 9.1 and 10.8% respectively, according to Eurostat).
- 3.
- The last analysis was meant to estimate and test the influence in time, over the three suggested periods (P1, P2, and P3), of the same parameters on IU and IE. The descriptive statistical analysis table highlights a certain turbulence of P1 (in the 1990s) and P3 (the current period). In the first case, this can be related to the start of the transition to a market economy and, in the case of P3, to the influence of the economic crisis that worsened unemployment, just like in the 1990s. By contrast, in the case of P2, the pre-accession policies and the opening up of the EU labor markets for Romanian citizens adjusted possible asperities. In relation to the reference period (P3), P1 records negative values and P2 records positive ones. On the basis of the determination ratio (R2) estimated from the regression analysis, the four variables introduced in the analysis explain 45.8% (R2 = 0.964 (adjusted R2 = 0.918) of the IU variation, and 85.5% (R2 = 0.980 (adjusted R2 = 0.955)) of the IE variation. In the case of unemployment, the analysis of the influence over time shows a reduced incidence of the four explanatory factors, correlated with the immaturity of the Romanian labor market, still dominated by low- or medium-skilled jobs. That is why the share of graduates with higher education is somewhat significant in the context of the recent development of services and IT activities. There is a strong significance of HED and PCP, which demonstrates the importance of tertiary and vocational training in fighting unemployment and in ensuring a better insertion into the labor market. The statistical analysis of the evolution of the variables over the three periods of time shows a discordant evolution of IU and IE. The first index evolved from negative regression values in the first post-communist decade to positive values, with a peak in the pre-accession period, in line with the dynamics of the macroeconomic indicators (declining industrial output, falling demand, accelerating inflation, etc.).
The second index changed from positive regression values in the first post-communist decade to negative, subsequently stable values, which are explicable in the new context generated by the easier access to the community labor market after 2001, with much of the surplus of labor force produced by economic reforms emigrating and, thus, reducing the incidence of unemployment, a trend that became stronger since the country’s integration into the European structures in 2007. Using GLM, the multiple regression (which took P3 as a reporting period), generated the following results for each of the two indicators (Table 6 and Table 7):
Following the evolution of each period, for each of the two indices, it can be noticed that P1 is marked by the reminiscences of the educational model of the totalitarian period, with a reduced influence of the vocational training activities. On the contrary, P2 faces an increased incidence of training courses for the unemployed, of continuous training courses, or of the changes induced by the implementation of higher-education reforms (Bologna model). It can be argued that, despite structural shortcomings, the transition to the market economy introduced several filters specific to the free market, especially some of its components (competition, specialization), with their effects resonating gradually.
This transitional phase took place until 2002, when the access to the Schengen labor market relaxed these filters, allowing for the amelioration of some previously aggressive trends, such as the massive increase in unemployment.
4. Conclusions
On the whole, the school-to-work transition in Romania records specific forms, influenced by the difficulty of the inherited structures to adapt to the economic, social, and cultural shocks generated by the transition from a centralized communist system to a free market economy. Many times, there is a gap between the theoretical knowledge of graduates and their practical skills. It is essential to facilitate the transition from education to professional life, including by increasing the number of quality traineeships. Also, there should be funded and developed programs which encourage the fast insertion of young people into the labor market. Ensuring an increased quality of the vocational and technical education, academic system, and lifelong learning, as well as an easier access to them, could improve people’s adaptation to the current needs of the labor market. The resilience capacity of the categories affected by these shocks seems to be dependent on the access to higher or additional forms of vocational training.
Overall, the process can also be influenced by the gradual replacement of generations. At present, those affected by unemployment or entering the labor market do not know the rigors of the communist experience, being more open to experimenting with various (including temporary) ways of regulating the difficulties encountered in getting a job. What was analyzed is the national profile, which is circumscribed, to a certain extent, to the evolution pattern specific to former communist countries. Territorially, there may appear specificities which enable us to understand the appearance and deepening of the significant development gaps on the labor market, subsequent to the communist convergence in keeping with the desiderata of the totalitarian regime.
The tendencies expressed by the chronological evolution of the analyzed parameters reveal a natural evolution from a centralized model, with a general access to the labor market but restrictive with respect to the access to higher education, to a liberal, competitive, and future-orientated model characterized by a relaxation of access to all forms of education, with the insertion of market-based training structures. At the same time, there are increased difficulties of getting inserted into the labor market due to the competitiveness and emergence of certain phenomena specific to post-modern societies (over-qualification of labor force, job instability, etc.). In this respect, the current labor market requires a series of skills and abilities that the vocational training system was not prepared for and had to adapt under way, many times through contradictory measures or by imitating models which are inappropriate to the specificity of Romanian society. Discrepancies between what the education system can offer and the real needs of the labor market are, thus, inevitable, requiring to be solved precisely in order to allow for a better insertion of young graduates. The insertion in the circuits of the increasingly globalized competitive labor market forces the structures that ensure the school-to-work transfer to adapt. The analysis of the national profile reveals the dependence on previous mechanisms, difficult to adapt to the new conditions. We can also talk about the existence of a certain delay in this process, with the emergence phase of the new model lasting for more than a decade (1989–2001). The shock of the transition was not brutal, as in other states in the region. It was moderate but unallowably long, with reverberations which can still be felt, including at the local level. The Romanian school-to-work transition remains to be completed, with the shift from the centralized system to the free market being not linear and manifesting an uneven territorial diffusion. The European integration boosted this transition, especially as regards the attitudes and choices of young people, who no longer regard the labor market in a narrow, national sense but at the European level, as illustrated by the low influence of the unemployment rate within the multivariate analysis.
When evaluating the results of this study in the context of the sociology of education and sustainable development, it can be noticed that the previously established educational model, along the evolution of contemporary Romania, still plays a major role, with the mentalities and structure of the educational system being difficult to change. However, following the results and progress of other central and eastern European countries, it can be noticed that the changes and increasing adaptability of the labor market can be achieved through sustainable education, by creating a durable link between education and economic development policies. A future-oriented education system has to promote values, attitudes, and behavioral patterns suitable for a reality in which both the principles of the sociology of education and sustainable development can be found.
Author Contributions
All three authors equally contributed to the development of the framework and writing of the manuscript. M.I. managed the coordination process and worked on the methodology, statistical analysis, and result interpretation. R.H.-S. worked on the literature review and theoretical background. I.M. contributed to creating the statistical database and the interpretation of results.
Funding
This research received no external funding.
Conflicts of Interest
The authors declare no conflicts of interest.
References
- Sylwester, K. Can education expenditures reduce income inequality? Econ. Educ. Rev. 2002, 21, 43–52. [Google Scholar] [CrossRef]
- Neckel, S. The Sustainability Society: A Sociological Perspective. Culture 2017, 2, 46–52. [Google Scholar]
- Halász, G. Education and Social Transformation in Central and Eastern Europe. Eur. J. Educ. 2015, 50, 350–371. [Google Scholar] [CrossRef]
- Organisation for Economic Co-operation and Development (OECD). Education at a Glance. OECD Indicators. 2014. Available online: http://www.oecd.org/education/Education-at-a-Glance-2014.pdf (accessed on 10 December 2018).
- Hawkes, D.; Ugur, M. Evidence on the relationship between education, skills and economic growth in low-income countries. In A Systematic Review; EPPI-Centre, Social Science Research Unit (SSRU), Institute of Education, University of London: London, UK, 2012. [Google Scholar]
- Horea-Serban, R.; Istrate, M. High Education, Professional Insertion and Economic Development in Romania. In Advances in Applied Economic Research; Tsounis, N., Vlachvei, A., Eds.; Springer: Berlin, Germany, 2017; Volume 32, pp. 487–501. [Google Scholar]
- Education and Training 2020 (ET 2020). Available online: https://ec.europa.eu/eurostat/web/education-and-training/eu-benchmarks (accessed on 21 November 2018).
- Psacharopoulos, G. Rates of return and funding moods in Europe. In Final Report to the European Comission, ch. 2, the Returns to Investment in Higher Education: Methods, Data and Policy Implications; European Commission: Luxembourg, 2007. [Google Scholar]
- Perugini, C.; Pompei, F. Employment Protection and Wage Inequality within Education Groups in Europe. J. Policy Model. 2016. [Google Scholar] [CrossRef]
- Drăgoescu, R.M. Education as a Determinant of the Economic Growth. The Case of Romania. Procedia Soc. Behav. Sci. 2015, 197, 404–412. [Google Scholar] [Green Version]
- Valdes, H.; Correa, C.; Mellado, F. Proposed Model of Sustainable Construction Skills for Engineers in Chile. Sustainability 2018, 10, 3093. [Google Scholar] [CrossRef]
- Kahle, J.; Risch, K.; Wanke, A.; Lang, D.J. Strategic Networking for Sustainability: Lessons Learned from Two Cases Studies in Higher Education. Sustainability 2018, 10, 4646. [Google Scholar] [CrossRef]
- Dworkin, A.G.; Ballantine, J.; Antikainen, A.; Barbosa, M.L.; Konstantinovskiy, D.; Saha, L.J.; Essack, S.; Chang, J.; Vryonides, M.; Teodoro, A. The Sociology of Education. Sociopedia isa 2013, 1–6. [Google Scholar] [CrossRef]
- Pfeffer, F.T. Equality and quality in education. A comparative study of 19 countries. Soc. Sci. Res. 2015, 51, 350–368. [Google Scholar] [CrossRef] [PubMed] [Green Version]
- Iancu, T.; Hurmuzache, T.C.; Brad, I.; Sîrbu, C.C.; Iosim, I.; Pîrvulescu, L. Study on the development of education in Romania. Procedia Soc. Behav. Sci. 2015, 182, 560–565. [Google Scholar] [CrossRef]
- Pauceanu, A.M.; Alpenidze, O.; Edu, T.; Zaharia, R.M. What determinants influence students to starts their own business? Empirical evidence from United Arab Emirates Universities. Sustainability 2019, 11, 92. [Google Scholar] [CrossRef]
- Stanciu, S.; Banciu, V. Quality of Higher Education in Romania: Are Graduates Prepared for the Labour Market? Procedia Soc. Behav. Sci. 2012, 69, 821–827. [Google Scholar] [CrossRef] [Green Version]
- Van den Branden, K. Sustainable Education: Exploiting students’ energy for learning as a renewable resource. Sustainability 2015, 7, 5471–5487. [Google Scholar] [CrossRef]
- Van den Branden, K. Sustainable education: Basic principles and strategic recommendations. Sch. Eff. Sch. Improv. 2012, 23, 285–304. [Google Scholar] [CrossRef]
- Stephens, J.; Hernandez, M.; Roman, M.; Graham, A.; Scholz, R. Higher Education as a Change Agent for Sustainability in Different Cultures and Contexts. Int. J. Sustain. High. Educ. 2008, 9, 317–338. [Google Scholar] [CrossRef]
- Sterling, S. Sustainable Education: Re-Visioning Learning and Change; Number: ED464791; ERIC: Washington, DC, USA, 2001.
- United Nations, Educational, Scientific and Cultural Organization (UNESCO). Education for Sustainable Development Goals, Learning Objectives; United Nations, Educational, Scientific and Cultural Organization: Paris, France, 2017. [Google Scholar]
- Serpa, S.; Sá, M.J. Exploring Sociology of Education in the Promotion of Sustainability Literacy in Higher Education. JSSR 2019, 5, 101–116. [Google Scholar]
- Kolb, M.; Fröhlich, L.; Schmidpeter, R. Implementing sustainability as the new normal, responsible management education—From a private business school’s perspective. Int. J. Manag. Educ. 2017, 15, 280–292. [Google Scholar] [CrossRef]
- Shohel, M.M.C.; Howes, A.J. Models of Education for Sustainable Development and Nonformal Primary Education in Bangladesh. J. Educ. Sustain. Dev. 2011, 5, 129–139. [Google Scholar] [CrossRef] [Green Version]
- Merce, I.I.; Milin, I.A.; Petroman, C.; Ciolac, R.M. School dropout—A social problem in Romania. In 4th World Conference on Educational Technology Researches WCETR; Elsevier: Amsterdam, The Netherlands, 2014; Volume 182, pp. 623–628. [Google Scholar]
- Tomulețiu, A.E.; Moraru, A. Rural education in Romania: Present and perspectives. WCES. Procedia Soc. Behav. Sci. 2010, 2, 402–406. [Google Scholar]
- Alacacı, C.; Erbas, A.K. Unpacking the inequality among Turkish schools: Finding from PISA 2006. IJED 2006, 30, 182–192. [Google Scholar] [CrossRef]
- Mosora (Dobre), M.; Mosora, C. The access to education in Romania. A regional study. Procedia Soc. Behav. Sci. 2012, 93, 916–920. [Google Scholar] [CrossRef]
- Coleman, J. Families and schools. Educ. Res. 1987, 16, 32–38. [Google Scholar] [CrossRef]
- Cassano, R.; Costa, V.; Fornasari, T. An Effective National Evaluation System of Schools for Sustainable Development: A Comparative European Analysis. Sustainability 2019, 11, 195. [Google Scholar] [CrossRef]
- Menéndez-Valdés, J. Labour Market Transitions of Young People. European Foundation for the Improvment of Working and Living Conditions, II International Forum on Public Employment. 2014. Available online: http://www.eurofond.europa.eu/es/events/ii-international-forum-on-public-employment (accessed on 10 January 2019).
- Perron, J.; Corbière, M.; Coallier, J.C.; Cloutier, G. La transition études-travail, un modèle multithéorique et longitudinal. Psychol. Trav. Organ. 2006, 12, 211–224. [Google Scholar] [CrossRef]
- Popescu, M.E.; Militaru, E. Wage inequalities in Romania under successive adjustments in minimum wage levels. Theor. Appl. Econ. 2017, 2, 213–220. [Google Scholar]
- Jeong, Y.; Lee, A.; Cho, J. Educational mismatches and job resolution in South Korea, the USA, and Germany. Asian Pac. Econ. Lit. 2018, 32, 95–108. [Google Scholar] [CrossRef]
- Istrate, M.; Banica, A. Female labour force in the Romanian urban environment: Structures, relations, segregation indexes. Procedia Econ. Financ. 2015, 20, 316–325. [Google Scholar] [CrossRef]
- Allison, C.; Ringold, D. Labor Market in Transition in Central and Eastern Europe (1989–1995); World Bank Technical Paper; World Bank: Washington, DC, USA, 1996. [Google Scholar]
- Jucu, I.S. Rethinking geography in Romanian school: Curricular changes in geography learning in post-socialist Romania. Procedia Soc. Behav. Sci. 2012, 46, 5440–5448. [Google Scholar] [CrossRef]
- Achim, M.V. The new economy asking for new education approaches. Evidence for Romania and other post-communist European countries. Procedia Econ. Financ. 2015, 32, 1199–1208. [Google Scholar]
- Slaughter, R. Futures education, catalyst for our times. JFS 2008, 12, 15–30. [Google Scholar]
- Kogan, I.; Noelke, C.; Gebel, M. Making the transition. In Education and Labor Market Entry in Central and Eastern Europe; Stanford Unviersity Press: Palo Alto, CA, USA, 2011. [Google Scholar]
- Zweynert, J.; Goldschmidt, N. The Two Transitions in Central and Eastern Europe and the Relation between Path Dependent and Politically Implemented Institutional Change; HWWA Discussion Paper; Hamburg Institute of International Economics: Hamburg, Germany, 2005. [Google Scholar]
- Magnin, E. Path-Dependence and Initial Conditions in the Transition Process: The cases of Hungary and Romania. J. Econ. Bus. 2002, 1, 67–87. [Google Scholar]
- Bodea, G.; Plopeanu, A.P. Romania—To have or not to have its own development path? CES Work. Pap. 2016, 2, 155–166. [Google Scholar]
- Simmie, J. Learning Regions and Path Dependence; Presentation at the Workshop Conceptualising the Learning Region: Economic-Geographical Aspects; Radboud University: Nijmegen, The Netherlands, 2009; Volume 17. [Google Scholar]
- Martin, R.; Sunley, P. The Place of Path Dependence in an Evolutionary Perspective on the Economic Landscape. In The Handbook of Evolutionary Economic Geography; Boschma, R., Martin, R., Eds.; Edward Elgar: Cheltenham, The Netherlands, 2010; pp. 395–438. [Google Scholar]
- Usher, R.; Bryant, I.; Johnston, R. Adult Education and the Postmodern Challenge; Routledge: London, UK, 2011; p. 268. ISBN 13 978-0415120210. [Google Scholar]
- Ezechil, L. The Necessity of a Pedagogical Reform in the Pre-university Education in Romania. Procedia Soc. Behav. Sci. 2015, 180, 559–564. [Google Scholar] [CrossRef] [Green Version]
- Băeșu, V.; Marian, L.; Farkaș, Z.-B.; Drăghici, A. Education evaluation—A proposed approach for the technical schools in Romania. Procedia Technol. 2015, 19, 1115–1122. [Google Scholar] [CrossRef]
- Scippacercolaa, S.; D’Ambraa, L. Estimating the Relative Efficiency of Secondary Schools by Stochastic Frontier Analysis. Procedia Econ. Financ. 2014, 17, 79–88. [Google Scholar] [CrossRef] [Green Version]
- Popescu, C. Capitalul Uman in Noile Democratii; Editura Universităţii’’ Alexandru Ioan Cuza: Iași, Romania, 2015; 188p. [Google Scholar]
- Banica, A.; Istrate, M. Renewable energy emergence-opportunities for a resilient workforce in Romania. An. Stiint. Univ. 2014, 60, 111–126. [Google Scholar]
- Hatos, A. Serving the New Class: The Dynamics of Educational Transitions for Romanian Adults Born Before 1985 During Communism and Afterwards. Soc. Indic. Res. 2014, 119, 1699–1729. [Google Scholar] [CrossRef]
- Dorsett, R.; Lucchino, P. Explaining patterns in the school to work transition. An analysis using optimal maching, advance. Life Course Res. 2014, 22, 1–4. [Google Scholar] [CrossRef] [PubMed]
- Thompson, K.; Shea, T.; Sikora, D.; Perrewé, P.; Ferris, G. Rethinking underemployment and overqualification in organizations: The not so ugly truth. Bus. Horiz. 2013, 56, 113–121. [Google Scholar] [CrossRef]
- Verbruggen, M.; van Emmerick, H.; van Gils, A.; Meng, C.; de Grip, A. Does early-carrer underemployment impact future career success? A path dependency perspective. JVB 2015, 90, 101–110. [Google Scholar]
- Romanian National Institute of Statistic. Available online: http://www.insse.ro (accessed on 11 December 2018).
- EUROSTAT. Available online: http://www.eurostat.eu (accessed on 10 December 2018).
- Jaba, E.; Robu, I.B. Obtaining Audit Evidence for Testing the “Going Concern” Assumption Using Advanced Statistical Methods to Analyze the Influence on Overall Borrowing Rate. Audit. Financiar. 2011, 9, 37–46. [Google Scholar]
- National Alliance of Student Organizations in Romania. Cifrele Bugetului Educatiei—Unde suntem și unde ar Trebui să Fim. Raport. 2015. Available online: http://www.anosr.ro (accessed on 10 December 2018).
- Karatzoglou, B. An in-depth literature review of the evolving roles and contributions of universities to Education for Sustainable Development. J. Clean. Prod. 2013, 49, 44–53. [Google Scholar] [CrossRef]
- Marlow, D.R.; Moglia, M.; Beale, D.J.; Stenstomer, A. Embedding sustainability into a utility business culture. J. Am. Water Work Assoc. 2012, 104, 121–126. [Google Scholar] [CrossRef]
- Von Hauff, M.; Nguyen, T. Universities as Potential Actors for Sustainable Development. Sustainability 2014, 6, 3043–3063. [Google Scholar] [CrossRef] [Green Version]
- Bechir, M. România, una Dintre Țările cu Cele mai Lungi și mai Grele Tranziții de la Școală la Piața Muncii. Available online: http://cursdeguvernare.ro (accessed on 10 January 2019).
- Istrate, M.; Horea-Șerban, R. The dynamics of poverty and its consequences on regional inequalities in Romania. EJES 2018, 9, 63–86. [Google Scholar]
- Muntele, I.; Ungureanu, A. Geografia Populației; Sedcom Libris: Iasi, Romania, 2017. [Google Scholar]
Figure 1.
Correlation and causality links in school-to-work transition pattern. This figure was sourced from Reference [33].
Figure 1.
Correlation and causality links in school-to-work transition pattern. This figure was sourced from Reference [33].

Figure 2.
The four phases of path dependent development. This figure was adapted from References [45,46].

Figure 3.
Total number of graduates by education level. Data were sourced from Reference [57].
Figure 3.
Total number of graduates by education level. Data were sourced from Reference [57].

Figure 4.
School enrolment rate in Romania. Data were sourced from Reference [57].
Figure 4.
School enrolment rate in Romania. Data were sourced from Reference [57].

Figure 5.
Abandon rate in pre-university education. Data were sourced from Reference [57].
Figure 5.
Abandon rate in pre-university education. Data were sourced from Reference [57].

Figure 6.
Employment rate by age and gender. Data were sourced from Reference [57].
Figure 6.
Employment rate by age and gender. Data were sourced from Reference [57].

Figure 7.
Unemployed persons by level of education. Data were sourced from Reference [57].
Figure 7.
Unemployed persons by level of education. Data were sourced from Reference [57].

Figure 8.
(a) Unemployment index (IU) and (b) employment index (IE).


Table 1.
The number of young people who are not in education, employment, or training (NEET) rate for the population aged 15–24 (% of population 15–24). Data were sourced from Reference [58].
Table 1.
The number of young people who are not in education, employment, or training (NEET) rate for the population aged 15–24 (% of population 15–24). Data were sourced from Reference [58].
| GEO/TIME | 2008 | 2009 | 2010 | 2011 | 2012 | 2013 | 2014 | 2015 | 2016 | 2017 |
|---|---|---|---|---|---|---|---|---|---|---|
| EU28 | 10.9 | 12.4 | 12.8 | 12.9 | 13.2 | 13 | 12.5 | 12 | 11.6 | 10.9 |
| Romania | 11.6 | 13.9 | 16.6 | 17.5 | 16.8 | 17 | 17 | 18.1 | 17.4 | 15.2 |
Table 2.
Results of the descriptive statistical analysis of variables.
| Descriptive Statistics | ||||
|---|---|---|---|---|
| Index | Mean | Std. Deviation | Analysis N | |
| IU | UNR | 0.9985 | 0.33465 | 26 |
| U 15–24 | 1.0012 | 0.23456 | 26 | |
| U-NEET | 1.0004 | 0.33449 | 26 | |
| U-HSHE | 0.9988 | 0.30379 | 26 | |
| IE | ER | 0.9992 | 0.09674 | 26 |
| RTACT | 1.0000 | 0.06356 | 26 | |
| RTACT 15–24 | 1.0004 | 0.20664 | 26 | |
| RTACT 25–34 | 0.9988 | 0.04852 | 26 | |
| ER | 0.9992 | 0.09674 | 26 | |
Table 3.
Correlation matrix.
| UNR | U 15–24 | U-NEET | U-HSHE |
| 1.000 | −0.613 | −0.705 | 0.390 |
| −0.613 | 1.000 | 0.757 | −0.244 |
| −0.705 | 0.757 | 1.000 | −0.173 |
| 0.390 | −0.244 | −0.173 | 1.000 |
| ER | RTACT | RTACT 15–24 | RTACT 25–34 |
| 1.000 | 0.952 | 0.757 | 0.894 |
| 0.952 | 1.000 | 0.647 | 0.842 |
| 0.757 | 0.647 | 1.000 | 0.847 |
| 0.894 | 0.842 | 0.847 | 1.000 |
| 1.000 | 0.952 | 0.757 | 0.894 |
Table 4.
Estimations of the regression model parameters for Equation (5).
| Parameter | B | Standard Error | t | Significance | |
|---|---|---|---|---|---|
| IU | Intercept | −3.226 | 1.644 | −1.962 | 0.063 |
| PCP | 0.311 | 0.750 | 0.415 | 0.682 | |
| UCP | 1.308 | 0.786 | 1.663 | 0.111 | |
| HED | 0.310 | 0.819 | 0.378 | 0.709 | |
| PS 15–23 | 1.291 | 2.451 | 0.526 | 0.604 |
Table 5.
Estimations of the regression model parameters for Equation (6).
| Parameter | B | Standard Error | t | Significance | |
|---|---|---|---|---|---|
| IE | Intercept | 4.855 | 0.851 | 5.706 | 0.000 |
| PCP | 0.171 | 0.388 | 0.440 | 0.665 | |
| UCP | 0.675 | 0.407 | 1.660 | 0.112 | |
| HED | −0.381 | 0.424 | −0.898 | 0.379 | |
| PS 15–23 | −5.311 | 1.268 | −4.187 | 0.000 |
Table 6.
Results of multiple regressions using a generalized linear model (GLM) for IU.
| Parameter | IS | |||
|---|---|---|---|---|
| B | Std. Error | T | Sig. | |
| Intercept | 23.511 | 4.222 | 5.568 | 0.000 |
| PCP | 3.288 | 0.883 | 3.725 | 0.003 |
| UCP | −9.430 | 2.627 | −3.589 | 0.004 |
| HED | −0.774 | 1.064 | −0.728 | 0.482 |
| PS 15–23 | −10.317 | 2.942 | −3.507 | 0.005 |
| [Period = 1] | −34.757 | 6.053 | −5.742 | 0.000 |
| [Period = 2] | −37.845 | 12.664 | −2.988 | 0.012 |
| [Period = 3] | 0 a | |||
| [Period = 1] * PCP | −4.938 | 1.103 | −4.477 | 0.001 |
| [Period = 2] * PCP | −3.364 | 1.027 | −3.276 | 0.007 |
| [Period = 3] * PCP | 0 a | |||
| [Period = 1] * UCP | 14.581 | 2.963 | 4.921 | 0.000 |
| [Period = 2] * UCP | 9.285 | 3.016 | 3.079 | 0.010 |
| [Period = 3] * UCP | 0 a | |||
| [Period = 1] * HED | 5.602 | 1.932 | 2.900 | 0.014 |
| [Period = 2] * HED | 1.730 | 1.282 | 1.350 | 0.204 |
| [Period = 3] * HEDP | 0 a | |||
| [Period = 1] PS 15–23 | 16.864 | 5.824 | 2.895 | 0.015 |
| [Period = 2] * PS 15–23 | 22.839 | 12.504 | 1.827 | 0.095 |
| [Period = 3] * PS 15–23 | 0 a | |||
Table 7.
Results of multiple regressions using a GLM for IE.
| Parameter | IO | |||
|---|---|---|---|---|
| B | Std. Error | t | Sig. | |
| Intercept | 6.563 | 3.148 | 2.085 | 0.061 |
| PCP | 0.215 | 0.658 | 0.326 | 0.750 |
| UCP | −3.683 | 1.959 | −1.881 | 0.087 |
| HED | 0.022 | 0.793 | 0.027 | 0.979 |
| PS 15–23 | −2.080 | 2.193 | −0.948 | 0.363 |
| [Period = 1] | −9.269 | 4.513 | −2.054 | 0.065 |
| [Period = 2] | −5.211 | 9.441 | −0.552 | 0.592 |
| [Period = 3] | 0 a | . | . | . |
| [Period = 1] PCP | −1.063 | 0.822 | −1.292 | 0.223 |
| [Period = 2] PCP | −0.653 | 0.766 | −0.853 | 0.412 |
| [Period = 3] PCP | 0 a | . | . | . |
| [Period = 1] UCPF | 6.524 | 2.209 | 2.954 | 0.013 |
| [Period = 2] UCP | 3.482 | 2.248 | 1.549 | 0.150 |
| [Period = 3] UCP | 0 a | . | . | . |
| [Period = 1] HED | −1.760 | 1.440 | −1.222 | 0.247 |
| [Period = 2] HED | 0.353 | 0.956 | 0.370 | 0.719 |
| [Period = 3] HED | 0 a | . | . | . |
| [Period = 1] * PS 15–23 | 5.908 | 4.342 | 1.361 | 0.201 |
| [Period = 2] * PS 15–23 | 0.673 | 9.321 | 0.072 | 0.944 |
| [Period = 3] * PS 15–23 | 0 a | |||
© 2019 by the authors. Licensee MDPI, Basel, Switzerland. This article is an open access article distributed under the terms and conditions of the Creative Commons Attribution (CC BY) license (http://creativecommons.org/licenses/by/4.0/).
Share and Cite
MDPI and ACS Style
Istrate, M.; Horea-Serban, R.; Muntele, I. Young Romanians’ Transition from School to Work in a Path Dependence Context. Sustainability 2019, 11, 1254. https://doi.org/10.3390/su11051254
AMA Style
Istrate M, Horea-Serban R, Muntele I. Young Romanians’ Transition from School to Work in a Path Dependence Context. Sustainability. 2019; 11(5):1254. https://doi.org/10.3390/su11051254
Chicago/Turabian StyleIstrate, Marinela, Raluca Horea-Serban, and Ionel Muntele. 2019. "Young Romanians’ Transition from School to Work in a Path Dependence Context" Sustainability 11, no. 5: 1254. https://doi.org/10.3390/su11051254
Note that from the first issue of 2016, this journal uses article numbers instead of page numbers. See further details here.