Urban Commercial Spatial Structure Optimization in the Metropolitan Area of Beijing: A Microscopic Perspective


1
School of Public Administration, Inner Mongolia University, Hohhot 010070, China
2
Institute of Geographic Sciences and Natural Resources Research, Chinese Academy of Sciences, Beijing 100101, China
*
Author to whom correspondence should be addressed.
Sustainability 2019, 11(4), 1103; https://doi.org/10.3390/su11041103
Submission received: 13 December 2018
/
Revised: 17 February 2019
/
Accepted: 18 February 2019
/
Published: 20 February 2019
(This article belongs to the Section Sustainable Urban and Rural Development)
Abstract
:Urban commercial districts (UCDs) are the concentrated areas for commercial activities in a city, which provide shopping, leisure, business, and other functions. Urban planners usually face problems in how to plan and design UCDs. The layout of UCDs should not only be appropriately concentrated to realize economic benefits, but should also be properly dispersed to accommodate the distribution of the population. Using Beijing as a case study, this study conducted research into UCDs from a microscopic perspective by utilizing open source big data. A recognition and classification method of UCDs was proposed based on the data of POI and road networks. The proposed model combines Huff’s model and the Voronoi method to analyze how various UCDs should be distributed within a city according to the spatial pattern of the population. The results showed that different kinds of UCDs had different spatial distribution features. Problems were also found, for example, UCDs on the urban outskirts served a large population; there were limitations to the spatial distribution of UCDs in the downtown area; and there was incongruity between the UCD types and the population layout. Based on these findings, suggestions regarding the optimization of the urban commercial spatial structure were also put forward.
1. Introduction
With rapid economic development, cities worldwide are being transformed from a production type to a consumption type due to the emergence of commerce and service industries as the major incentives for advances in urban economy. The rapidly evolving commerce and service industries have made urban commercial districts (UCDs) the most active space in the city. Therefore, UCDs are no longer just auxiliary service facilities in a city, but have become the most active functional districts and the growth engines of a city, as they promote service infrastructure development, regional economic growth, and urbanization, thereby exerting significant influence on the urban economy, society, and culture [1]. In terms of spatial structure, on the one hand, UCDs should be concentrated appropriately in the city to earn the benefit of scale; on the other hand, they should also be scattered appropriately to ensure sufficient accessibility to residents, to adapt to the distribution of people, and to decrease urban traffic pressure [2]. Thus, how to adapt the urban commercial structure to the transformation of the economy and society and how to coordinate the needs of urban residents as well as promote the healthy and orderly development of cities are important issues faced by urban geographers and urban planning scholars.
With regard to China, the reformation and opening-up have led to significant transformation in its cities. During the last few decades, unprecedented urbanization has reshaped China’s geography as well as social, economic, and cultural landscape [3,4]. As the capital of China, Beijing has been experiencing rapid urbanization and a burgeoning of its urban commerce, which has resulted in commercial expansion, and thus broken the age-old tradition of urban commercial centers [5]. Furthermore, Beijing is characterized by a long history and profound commercial culture. As a result, Beijing has developed a diverse and multi-layered modern commercial structure. At the same time, the urban population in Beijing has increased rapidly and the distribution of its population is also experiencing great change. Therefore, Beijing is a suitable case study for the analysis of the urban commercial spatial structure and for further analyzing the relationship between the distribution of UCDs and population distribution.
The recognition and classification of urban commercial districts (UCDs) is the basis of urban commercial spatial structure research. The term UCD has yet to be defined authoritatively, although it has been studied by many scholars around the world. Proudfoot (1937) [6] was the first scholar to study UCDs according to the location and characteristics of commercial activities. Berry (1963) [7] used multivariate analysis to divide the UCDs of Chicago into three categories according to the spatial structure. Furthermore, the shape and vitality of the UCDs in 40 small towns north of New York city were studied by Lamb (1985) [8]. Since the 1990s, Chinese scholars have gradually carried out research on UCDs. The initial research mostly studied the classification and spatial structure of UCDs through qualitative research and large-scale research due to the limitation of data and methodology. For example, Zhang (2001) [9] analyzed the development trends of the Beijing retail market at the county scale. Xue (2005) [10] used the spatial interactive model to measure the population potential and commercial attractiveness of each town in Haidian, Beijing. In recent years, scholars have begun to employ new data to analyze UCDs. Zhang (2013) [11] used economic census data to analyze the distribution characteristics of commercial outlets in Beijing. Ye (2013) [12] compared the real development status with commercial network planning based on the field survey data of Changsha City. According to previous studies, the definition of UCDs varies across research contexts. The proposed concepts of UCDs include commercial streets, office buildings, a single commercial complex, or a central business district. In this study, we sum up these study results to define UCDs as the districts where various shops, stores, and markets are concentrated, which act as the city level or district level centers for shopping, leisure, business, and other urban activities. Therefore, the biggest difference between UCDs and the CBD (central business district) is the scale and function. The CBD is the very core of business in the city, perhaps even in the country, and has a greater business function and higher level of service. On the whole, research of UCDs needs to be further sharpened. However, in China, the nationwide economic census only began in 2004 and takes place once every four years, with poor real-time performance and no spatial data. The traditional interpretation of urban functional districts through remote sensing data is highly complex and has a large workload; moreover, these data are expensive and cannot be updated in time, so they can prove inefficient at meeting the needs of various research and applications. The field survey data also has a large workload and may even involve trade secrets.
With regard to urban commercial spatial structure, the research scale has extended from conventional stores to informal, mobile, and online stores [13,14,15,16,17,18]. Since the late 1950s, there has been growing awareness that human behavior and culture have a strong influence on the commercial spatial structure. Research into trading areas has developed due to this new school of thought [19]. Huff [19,20] (1964, 1966) describes the trading area as a geographically delineated region containing potential customers for whom there exists a probability greater than zero of their purchasing a given class of products or services offered for sale by a particular firm or by a particular agglomeration of firms. According to Ghosh and McLafferty (1987) [21], the trading area is ‘‘the geographic area from which the store draws most of its customers and within market penetration is highest’’. Therefore, the trading area is determined by the consumption behaviors of consumers and the operation ability of enterprises [22] (Wang, 1999;). After defining and delineating the trading area, researchers have proposed methods to determine the trading area boundaries based on retail gravitation law, which has been defined from Newton’s law [19,23,24,25]. The empirical study of trading areas has developed against this background and focuses on two main aspects. The first is the analysis of influencing factors of the trading area boundary. For example, Eva (2012) [26] proposed that from the consumer’s perspective, the attraction of shopping centers was due to six major factors: the emporium’s style, popularity, personalization, entertainment, and the internal and external environment. Lu (2015) [27] analyzed nine factors (e.g., geographical location, traffic, scale, etc.) that impacted the boundary of the trading area. In general, the research on the factors affecting the boundary of the trading area is becoming more and more comprehensive and closer to reality. The second aspect focuses on researching the selection of locations for stores and the optimization of the spatial distribution of stores. This kind of research includes the optimal selection of locations for public infrastructure such as hospitals, schools, and transit hubs [28,29,30] as well as the optimal selection of locations for particular types of stores such as cinemas, furniture markets, and restaurants [31,32,33]. The empirical research is mostly concentrated on the macro scales of cities or Jiedaos (townships), due to limited business data and micro-data [34].
In general, on the one hand, it can be seen from the above analysis that the previous research into UCDs had a heavy workload and was inefficient due to the data limitations. On the other hand, the studies into trading areas have focused primarily on the attraction of a particular type of store, and most of the previous empirical research has been related to the macroscopic analysis. However, UCDs are the main functional districts in a city. Identification of the various types of UCDs, their spatial pattern, and ultimately, the optimization of the spatial structure of the UCDs, is of great significance to the city’s overall planning and sustainable development. The microscopic analysis of urban commercial spatial structures may highlight important information needed by city planners and managers for the formulation of policies. Hence, this paper contributes to the much-needed study of the commercial spatial structure of UCDs at a microscopic scale.
This study identified and classified UCDs in Beijing by utilizing publicly available big data (Point of Interest, Open Street Map, etc.), conducting a microscopic analysis of the population size of the housing block where the majority of urban residents live, and, then, analyzing the trading areas of various UCDs in the city, thereby yielding insights into the optimization of the urban commercial structure.
2. Data Source and Research Method
2.1. Research Region and Data Source
2.1.1. Study Region
The 2014 Beijing census showed that 79.5% of Beijing’s permanent residents lived within Sixth Ring Road. Furthermore, the majority of Beijing’s retail stores were concentrated in the downtown area. It was also noted that several regions had convenient transportation and a developed economy. These included: the areas near Nanshao Station along the Changping metro line, adjacent to Sixth Ring Road; the regions near the Qianfujie and Hedong bus stations along the 15th line; and the regions near Mentougou along the west extension of the first line, with many housing blocks and retail stores concentrated within these regions. Therefore, the regions within Sixth Ring Road and surrounding areas (3 km2 buffer area outside of Sixth Ring Road) were selected for analysis in this paper. This meant a total area of 2785 km2 (Figure 1).
2.1.2. Data Source
A point of interest (POI) refers to any geographical entity that can be abstracted into a point. It describes the spatial and property information of the entity, such as the entity’s name, type, and coordinates. This information makes up the background data of electronic maps such as Baidu Maps. Due to the proficiency of POI in effectively describing an entity’s geographical location effectively, accurately, and quickly, POI data have been used in recent years for research of urban spaces. For example, Zhao et al. (2011) [35] extracted the layered landmarks from the city’s POI data to obtain layered knowledge space, which can be used for intelligent route guidance. Long et al. (2015) [36] established a model to recognize the functional zones of a city using the POI data and the data from bus smart cards.
The 2015 point of interest (POI) data from Baidu Maps were adopted and the addresses were matched (http://lbsyun.baidu.com/index.php?title=lbscloud/poitags). Next, 95,466 retail stores were extracted from within the research region. The data extracted included the type, latitude, longitude, and zip code of the retail stores. The researchers then conducted random sampling investigations, telephone interviews, and on-site investigations to ensure the data were valid and reliable (Figure 2).
In June 2013, the details of housing blocks in downtown Beijing and its outskirts were collected from the largest two real estate information websites: Soufun (http://www.soufun.com/) and Anjuke (http://beijing.anjuke.com/). The data included the floor area ratio, building area, land area, and location, among others. A total of 4942 samples of housing blocks were finally collected. Spatial matching was conducted to obtain the distribution of housing blocks in Beijing, as shown in Figure 2. Furthermore, the data on the population living in the Jiedaos (towns), the basic management unit in a Chinese city, were collected from the sixth Beijing population census. The study area had a total of 171 Jiedaos within the study region, accounting for 56% of the total. In addition, all kinds of streets (from Open Street Map) and subways as well as other basic data were collected.
2.2. Research Methods
2.2.1. Recognition and Classification of UCDs
(1) Recognition of UCDs
UCDs have specific service scopes and consumer groups; this is the partition space unit. They are structurally comprised of various commercial service facilities, and are mostly clustered together. The urban block in the city is the piece of land partitioned by urban roads and is also the planar unit of life and the urban environment for residents. In this paper, the urban block was described as the basic unit for recognizing UCDs within the city. Based on the vector diagram of road networks in Beijing, the study regions were partitioned into urban blocks, each of which was naturally segmented by the four roads surrounding it.
It was necessary to identify and calculate the commercial activity intensity of each urban block. The density of retail stores in a basic unit can directly indicate the spatial distribution of commercial service facilities. However, the density of retail stores alone cannot fully represent the commercial activity, and the size of each store should also be considered in order to represent the spatial structure of the commercial activity more accurately. The metrics that describe the operation scale of retail stores include the operation area, number of employees, and revenues. However, these metrics are data-intensive and are most often confidential, making it difficult and time consuming to collect all of these metrics. As a result, this paper simplified the metrics and only considered those that were accessible to the public and easy to obtain. Therefore, the number of stores in each urban block and the average operation area of these stores (classified according to the commercial type) were defined as the metrics. The operation area was determined considering China’s existing criterion for the classification of commercial types (GB/T18106-2010) (Table 1).
Based on this, the activity of commerce in a block was computed as:
where Ci denotes the dimensionless operation area of the ith retail store; ai denotes the average operation area of the retail stores of i type; and amean denotes the weighted average area of all kinds of retail stores, i.e., the sum of the number of all kinds of retail stores multiplied by their corresponding operation areas, which was then divided by the total number of retail stores; CQj denotes the commercial activity intensity at the jth block; n denotes the number of retail stores in the jth block; and Sj denotes the area of this block. During analysis, the urban blocks that displayed a commercial activity intensity level of zero were eliminated first, and the average commercial activity intensity of the remaining blocks was then analyzed. From these results, the blocks that displayed a commercial activity intensity above the mean were regarded as commercial blocks.
The next step was to merge commercial blocks and recognition of UCDs. UCDs should have convenient traffic conditions to ensure accessibility. Moreover, complete and closed shopping spaces should also be available for consumers to shop comfortably, easily, and safely. Therefore, the effects of urban road networks on the range of UCDs were considered in this paper. In particular, the primary roads and expressways were mainly considered via the damage impact to the shopping environment and spatially isolated effects of UCDs, while the secondary trunk roads and feeder roads were considered to contribute to a positive commercial climate and shopping environment. Thus, this information suggests that commercial blocks that are separated by secondary trunk roads and feeder roads should be merged, and those that are separated by primary roads and expressways should remain.
(2) Classification of UCDs
In this study, the K-means clustering technique was employed to classify the UCDs. In this method, the data are regarded as a point in the K-dimensional space, and the distance is defined as a measure of affinity between individuals. First, the K clusters are randomly generated. Next, the clusters are improved by iteratively moving the center of each cluster. The UCDs in this study were classified according to their service functions, so the metric used to cluster the UCDs was the ratio of a certain kind of commercial activity intensity to the total commercial activity intensity of each UCD (non-zero). This consisted of six variables: the ratio of large emporiums and business streets; the ratio of large special emporiums; the ratio of comprehensive markets; the ratio of specialty shops and the market for flowers, birds, fish and so on; the ratio of convenience stores and supermarkets; and the ratio of the activity intensity of restaurants.
2.2.2. Determination of Population Size in Housing Blocks
This study took housing blocks as population clusters and assessed the size of the population living in the housing blocks from the micro-view. We chose the areal interpolation method in ArcGIS to assess the population size of the housing blocks. This method was chosen because empirical research can be performed, more effectively than with other methods such as the Clark model and the Sherratt model, on the spatial features of urban populations living in the entire city or large areas of the city [37,38,39]. We assumed that the per-capita area of the same type of land (herein referred to as residential land) was the same. Therefore, the housing block was defined as the basic unit, to enable analysis of the attraction of the UCD to the residents, to calculate the probability that the housing block selects a particular UCD. Additionally, the building area of the housing block was defined as the basic weight, and the Jiedaos (towns) were defined as the source regions so that the population was allocated to different housing blocks. Due to this, the population weight was computed as:
where is the assessed size of population in the ith housing block and is the total population size of the Jiedao (town) where the ith block belongs. is the building area of the ith housing block. is the sum of the building area of all housing blocks in the Jiedao (town) where the ith housing block belongs and n is the number of housing blocks in the block where the ith housing block belongs.
2.2.3. Huff Model
The various factors that are considered when residents decide which UCD to visit can be described using the classic Huff model [40]. This model was proposed by Professor Huff at the University of California in 1963 to delineate a trading area in a particular city [19]. According to Huff’s model, the resident’s affinity towards a particular UCD is the most fundamental factor in determining the size of the trading area. Studies have shown that residents prefer to visit UCDs they perceive as attractive. Attractiveness is characterized by size (larger stores are preferred), variety (a wide selection of products and commercial activities), and famous brands (well-known and reliable products) as well as retail stores that utilize aggressive marketing techniques to grab the residents’ attention. Therefore, the core foundation of Huff’s model suggests that the scale of the trading area of a UCD is directly proportional to the level of attraction of the UCD. Meanwhile, the time and distance residents must spend to reach the UCD is inversely proportional to the residents’ possibility of choice. Hence, Huff’s model is displayed below:
where Pij is the probability that the inhabitant i (housing block i) chooses the UCD j; Sj is the size of UCD j; and d is the distance or the time spent from housing block i to UCD j. Due to the lack of data regarding footpaths and travel times, this paper used linear distance, so k is all possible choices and β (β > 0) is the friction coefficient.
2.2.4. Determination of Trading Area
According to Huff’s model, the data obtained relate to the attraction intensity of each UCD to each housing block. In order to delineate the trading area of each UCD, this paper needed to extend the analysis results of the housing blocks into the planar dimension.
The Voronoi diagram is very effective at extending the features of a point to the planar dimension [41] (Zhu et al., 2005). Many works have previously been undertaken to define the regional spatial scope influenced by a geographical entity using the Voronoi graph [35,42]. Therefore, the Voronoi function of ArcGIS was used to transform the properties of the point elements into the properties of the polygon layer. Meanwhile, the polygon elements attracted to the same UCD were merged to delineate the distribution of the trading areas.
3. Spatial Distribution of Trading Areas of UCDs in Beijing
UCDs in Beijing were recognized by the above steps through recognition and classification methods. The information of 1063 UCDs was obtained and the average area of each was 0.065 km2. K-means clustering analysis was performed on the UCDs. After repeated experiments, the UCDs were divided into five functional types. The results are shown in Figure 3 and Table 2.
Dietary and cultural UCDs are the gathering areas of all kinds of restaurants such as formal restaurants, fast food restaurants, snack bars, and so on. Franchise-type UCDs focus on a certain type of specialty merchandise, such as construction materials or appliances and the electronics market, and so are highly professional. Shopping center UCDs are districts with more than one large shopping mall or central commercial street as the core; these are accompanied by restaurants, clothing, and other types of specialty stores. This type of UCD is integrated with the functions of shopping, entertainment, dining, social, spiritual, etc., and, in general, has higher service levels and a larger service radius. Convenience UCDs provide the inhabitants with necessities and basic services including supermarkets, convenience stores, grocery stores, and fast food restaurants, so their service object is mainly the nearby inhabitants and their service radius is relatively small. Complex UCDs have many formats and integrated functions, including integrated markets, various specialty stores, and restaurants.
Next, the distribution of trading areas of various UCDs was analyzed using Huff’s model and the trading area determination method. The scope of services delivered by the UCDs and the size of the population served by the UCDs were analyzed to optimize the urban commercial spatial structure in Beijing. The results of this are shown in Figure 4.
3.1. Trading Areas of Dietary and Cultural UCDs
The dietary and cultural UCDs had an average area of 0.015 km2 and were often spatially connected with large scale UCDs such as shopping center UCDs and complex UCDs. This may be because this type of UCD mainly considers the convenience of services and the ability to pay the rent at the same time.
Regarding the trading area size of the dietary and cultural UCDs, this paper found that those located near Third Ring Road and Fourth Ring Road were small. However, the ones located beyond Fifth Ring Road were significantly larger. In terms of the size of the population served by these trading areas, the dietary and cultural UCDs that served the largest population size were in the Shijingshan district (Pingguoyuan Jiedao and Guangning Jiedao), the Haidian district (Xibeiwang town and Shangzhuang town), and the Chaoyang district (Guangying Jiedao). Furthermore, the researchers found that several small trading areas within Fifth Ring Road served a large population, such as that of Chedaogou and Liujiayao, due to the increase in the demand for dietary services as well as an increased amount of urban residents moving to the outskirts. Hence, these regions serve many residents requiring more dietary and cultural UCDs, so these regions present high market potential.
3.2. Trading Areas of Franchise-Type UCDs
In franchise-type UCDs, many large emporiums or small shops concentrate and specialize in selling special commodities such as household appliances and electronics, or furniture and building materials. These UCDs differ from other UCDs as residents are willing to travel further to shop for specialized goods. The goods sold in these places are durable and are not daily necessities for residents, moreover, these goods are purchased less frequently. Therefore, this type of UCD attracts customers from across a larger region. With regard to Beijing, these UCDs were spatially distributed near Third and Fourth Ring Roads, and in the south of the city, there were approximately 150 franchise-type UCDs concentrated between Third and Fifth Ring Roads, accounting for 57% of the total of franchise-type UCDs. The coverage of the franchise-type trading areas was relatively uniformly distributed. The residents served by franchise-type UCDs were largely located in the regions of the Shijingshan district and several Jiedaos in the Chaoyang district, including Changying Jiedao and Guanzhuang Jiedao.
3.3. Trading Areas of Shopping Center UCDs
The shopping center UCD is home to facilities for shopping, entertainment, and dining. The core of the shopping center UCD is one or more emporiums. Restaurants and other shops that specialize in clothing and cosmetics are also available. This type of UCD is large and has an average area of 0.121 km2. These UCDs can afford high rent and are mostly adjacent to downtown and other regions with adequate transport, public, and other necessary facilities. It delivers a premium service for customers across a wide region that are in need of quality or durable products. Due to recent urban advances, housing blocks have rapidly developed in the outskirts of Beijing. These new developments have led to this kind of UCD also being located in the outskirts. Currently, there are 82 UCDs beyond Fifth Ring Road.
With regard to the spatial range of the trading areas of shopping center UCDs, the variation depended on location. For example, the trading areas in the northwestern regions of the Haidian district (Xibeiwang town and Qinglongqiao Jiedao) and in some Jiedaos of the Fengtai district (Changxindian and Wangzuo town) were considerably larger. Regarding the population covered by these trading areas, the study found that the several Jiedaos beyond Fifth Ring Road in the Haidian, Tongzhou, and Shunyi districts covered a considerably large population. This is because residential land use in city centers has given way to transport infrastructure and industrial development. With the rapid development of the Chinese urban economy, residential suburbanization is the inevitable trend of the urbanization process [43,44]. These regions, as the frontier of urban suburbanization, contain more housing blocks. Thus, shopping center UCDs are needed to meet the suburbanization trend and the residents’ living standards, which can be viewed as a higher stage of urbanization. More importantly, the construction of urban transportation in these regions, especially of rail transit facilities, will directly guide the settlement and development of these UCDs.
Several trading areas of shopping center UCDs within Fifth Ring Road serve a large population, for example, that of the region near Xinjiekou. Due to the large number of residents served by these UCDs, optimization could be performed at a microscopic scale by facilitating the circulation of passenger and traffic streams.
3.4. Trading Areas of Convenience UCDs
Convenience UCDs have been established to supply basic necessities and living services such as supermarkets, convenience stores, and fast food restaurants. The function and levels of services provided by convenience UCDs are fundamental, and target residents that live nearby. Therefore, these types of UCDs are scattered, and also have a small service radius. Thus, they are usually located near accessible and densely populated regions such as large-scale housing blocks or office buildings.
The number of residents being serviced by convenience UCDs within Third Ring Road and beyond Fifth Ring Road is significantly larger. Furthermore, the trading areas between Fourth and Fifth Ring Roads had the smallest amount of served residents, less than 10,000 people. This is due to the shopping center UCDs within Third Ring Road that operate as a substitute and, thus, reduce the need for convenience UCDs. In contrast, the number of served residents beyond Fifth Ring Road was significantly larger, due to fewer shopping center UCDs being available, for example, the Guangzhuang and Sanjianfang Jiedaos in Chaoyang. Therefore, there is a strong need for convenience UCDs in these regions.
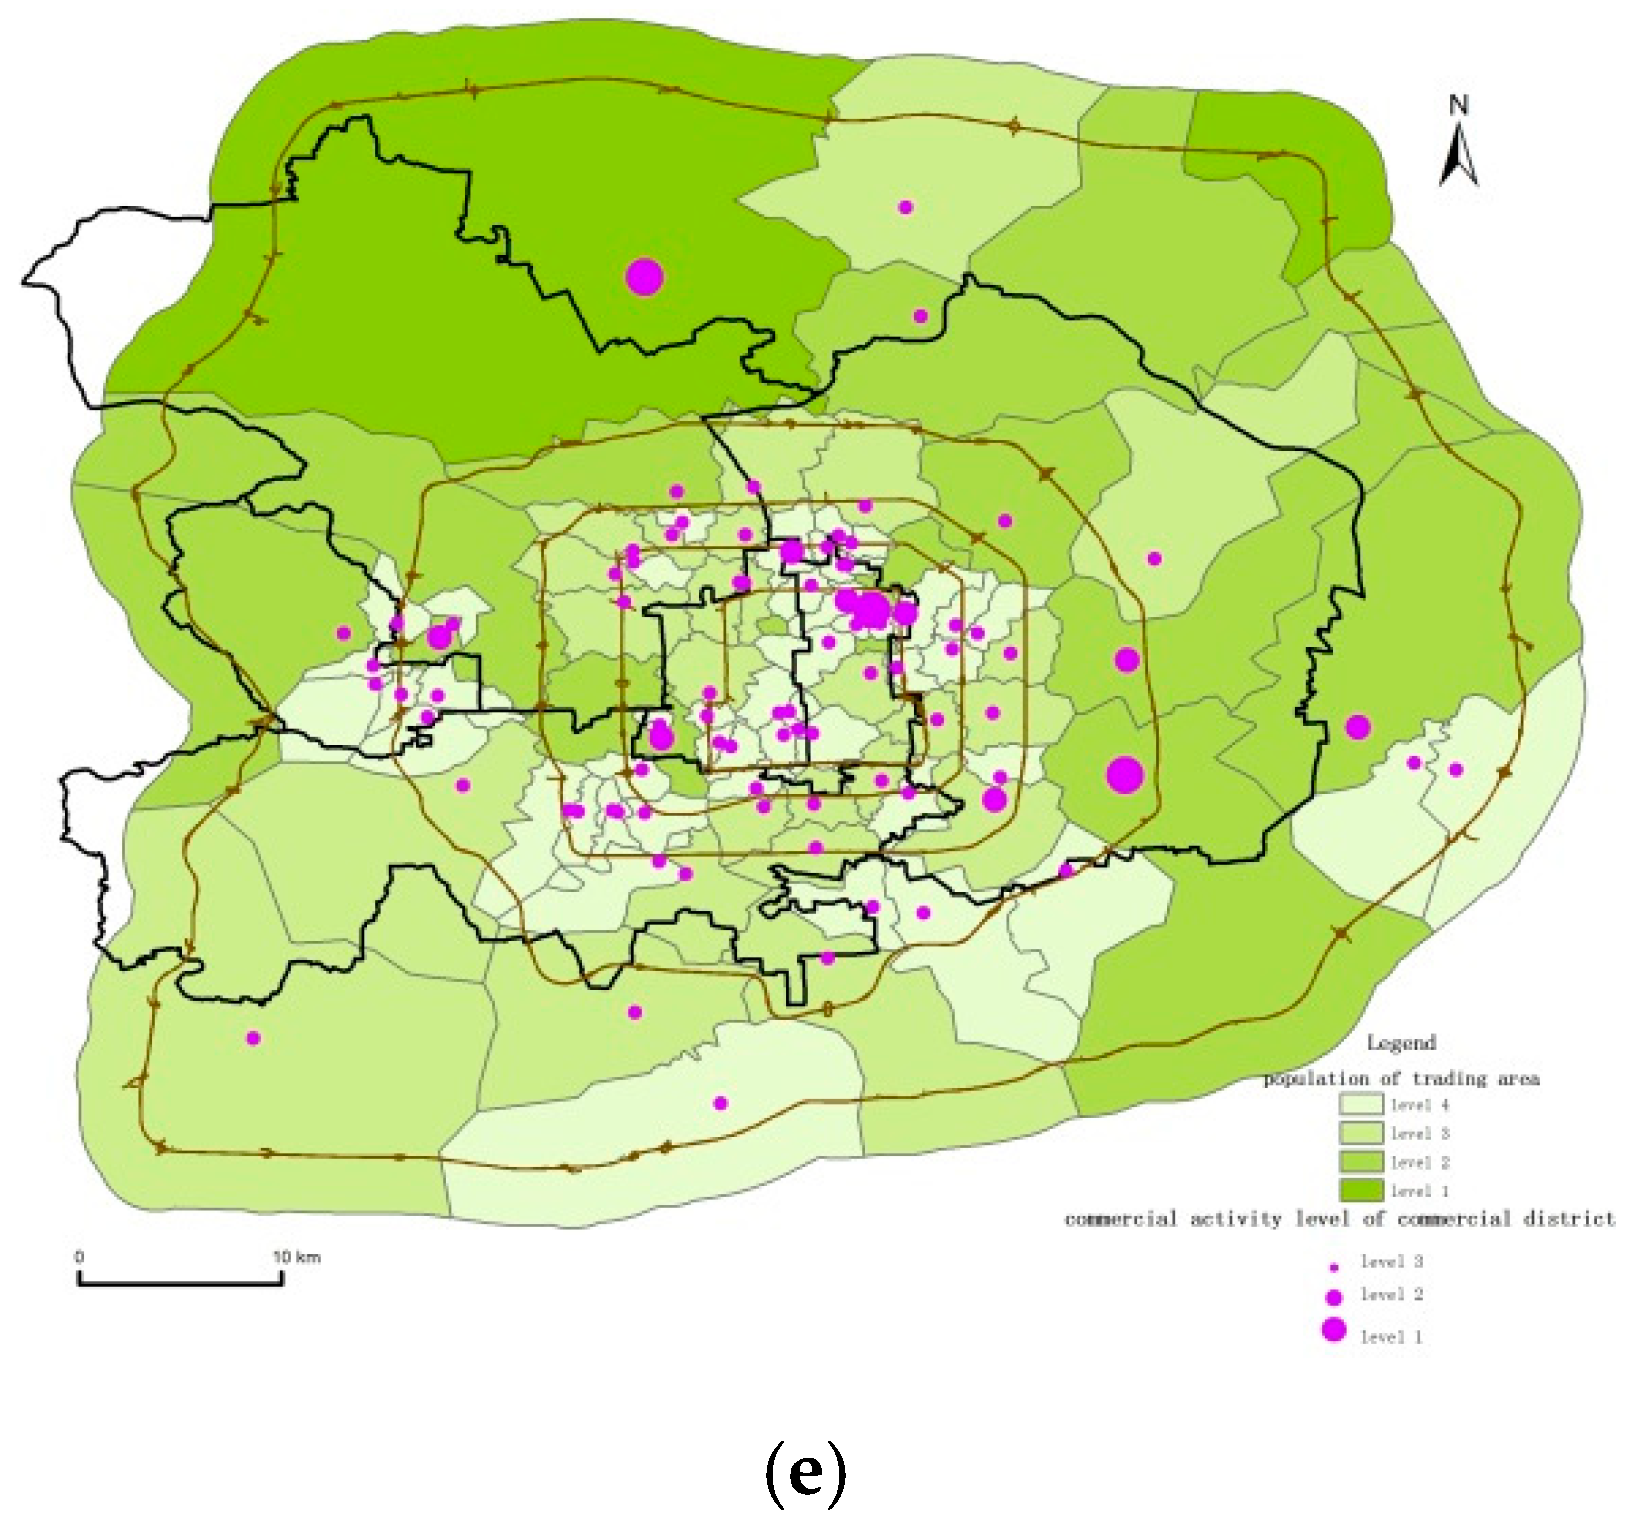
3.5. Trading Areas of Complex UCDs
Complex UCDs have various commercial types and provide various functions. They consist of commercial complexes, specialty shops, restaurants, and medium-level shopping centers. In addition to offering daily living services to housing blocks nearby, they are also convenient for employees who work in these regions and for passersby. They are usually located near housing blocks and other densely populated regions.
Beijing’s trading area of complex UCDs beyond Fifth Ring Road is very large and has an average area of 111.28 km2, especially for those to the north of the Haidian district and in some parts of the Changping district. In terms of the number of served residents, the complex UCDs beyond Fifth Ring Road serve an average population of 311,640 people. Furthermore, some complex UCDs near Fourth Ring Road such as those near the Huangquxi and Maguanying Jiedao also serve a large number of residents. This may be due to the nearby shopping center UCDs not being considered an adequate substitute.
4. Recommendations for Optimizing Commercial Space in Beijing
The urban commercial spatial structure refers to the spatial relationship between various commercial elements. In the era of the commercial economy, UCDs have become the most active functional districts and the growth engines of a city. The rational layout of the UCDs is conducive to the healthy development of the entire urban space. Optimization of the urban commercial spatial structure means adjusting the commercial spatial structure based on its characteristics and functions to achieve the optimal allocation of urban land resources, thus maximizing the benefits for the community, economy, and environment, and promoting the sustainability of commerce in the city.
Generally speaking, the total amount of commercial facilities in Beijing continues to increase, the service level continues to improve, and a multi-center commercial structure is taking shape. However, there are still many problems with the commercial spatial structure of Beijing. Combined with Beijing’s current commercial planning, as demonstrated by the microscopic analysis above, we suggest several methods to optimize Beijing’s commercial space. Our goal was to yield some insights from the perspective of the distribution of residents and UCDs that would benefit urban and commercial development in Beijing.
(1) Promoting commercial development in the outskirts
An analysis of the trading areas of five types of UCDs showed that the trading areas beyond Fifth Ring Road had a larger area and served a larger population. This was especially true for shopping center UCDs, dietary and cultural UCDs, and complex UCDs. Currently, in the context of suburbanization, many housing blocks have formed in the suburbs, resulting in a dense population. However, commerce in these regions has failed to fill the void because the level and number of commercial facilities remains insufficient to meet the consumption demands of these residents. As a result, the residents have to travel a long distance to shop, which causes environmental pollution and traffic jams.
Therefore, we recommend promoting the development of commerce in the suburbs of Beijing, specifically in the regions north of Fifth Ring Road and the south of Fourth Ring Road to conform to the suburbanization trends. To support this development, we suggest constructing large-scale shopping center UCDs, complex UCDs and some dietary and cultural UCDs in suburban areas to optimize the urban commercial spatial structure. Note that commerce does not merely play a supplementary role in development; instead, it can boost the development of a suburb through the healthy development of the service-oriented industry, and realize the transformation of commerce from supporting industries to pillar industries in the region. At the same time, this will reduce commute times and improve the living and working standards of nearby residents. This shift is particularly important in large suburban residential areas.
(2) Reducing the limitations in the distribution of UCDs in downtown regions
The analysis of the distribution of UCDs and trading areas indicated that there are many large, traditional UCDs in the downtown regions of Beijing stemming from historical and cultural factors. The traditional UCDs in Xidan, Wangfujing, and Qianmen are still very active and remain the most influential UCDs in Beijing. At the same time, since the late 1990s, many UCDs have been constructed in Chaowai, Sihui, Zhongguanchun, and Gongzhufen. These UCDs have prospered and have now combined with the traditional UCDs to form the backbone of the urban commercial spatial structure in Beijing.
The UCDs in downtown Beijing have flourished, but their distribution has many limitations. From the analysis of the trading areas of UCDs, it can be seen that all types of trading areas in downtown Beijing have different levels of blind spots—when UCDs are located far away from the housing blocks and have a low service level, making it difficult to provide good service to residents. At the same time, some UCDs located downtown serve too many residents, which affects the quality of the commercial services and consumption environment, and has caused vicious competition. For example, some merchants have blindly entered shopping center UCDs downtown, which has resulted in poor management and brutal competition. Therefore, the spatial layout of UCDs in Beijing’s downtown area needs to be further rationalized, guiding merchants to settle in reasonable locations, and adding certain types of UCDs in the corresponding blind spots.
(3) Distributing UCDs based on their characteristics
The UCDs in this paper were divided into five types. Each type of UCD has its own characteristics. As a result, UCDs should be distributed based on their characteristics.
For example, franchise-type UCDs specialize in the delivery of commodities that are durable but are not basic necessities for residents, and can operate normally despite a small number of visitors. Hence, the downtown and densely populated regions are not ideal for this type of UCD. This paper further suggests that franchise-type UCDs near Second and Third Ring Roads should be channeled towards the suburbs and concentrated there to form larger franchise-type UCDs. Another example is the dietary and cultural UCD, which occupies a small area and has the function of offering convenient dietary services to nearby residents and employees. Therefore, this paper recommends that this type of UCD should be located near large housing blocks. Furthermore, the trading areas of shopping center UCDs cover relatively large areas, always provide a higher service level, and are attractive to a large number of residents. Therefore, we recommend that shopping center UCDs be easily accessible, located near metro stations and trunk roads so that the stream of residents and vehicles can circulate efficiently and consistently.
(4) Deepening urban commercial planning in terms of function and spatial structure
The urban commercial planning specified in the tenth, eleventh, and twelfth five-year plans of Beijing only considered the development direction of the city’s commerce. These plans merely described the area of the auxiliary commercial stores, but failed to thoroughly analyze and design the type, scale, and spatial distribution of the commercial stores. As a result, the construction of new housing blocks in the outskirts has only taken into account the commercial stores within the communities, but has neglected to consider the area outside of the communities, which has led to an insufficient reserve of urban commercial land, which will impede the future development of urban commerce. Therefore, the construction of commercial stores and UCDs should consider the city’s long-term planning of commercial spatial structure by appropriately analyzing the scale, type, and spatial distribution of commercial stores. Additionally, the construction of urban residential districts, UCDs, and other functional districts should be planned together to ensure the healthy development of the urban commercial space. At the same time, the various commercial needs of different residents should also be considered.
For example, the “Beijing Urban Master Plan (2004–2020)” and the “Beijing 12th Five-Year Business Service Industry Development Plan” proposed that the city focus on building comprehensive commerce of a certain scale in Shunyi, Tongzhou, and Yizhuang. Based on our analysis, the development direction should be further refined in terms of commercial type and layout. The regions beyond Fifth Ring Road in Beijing are in need of large-scale shopping center UCDs and complex UCDs to meet the demands of residents in these regions. There also needs to be an increase in the number of UCDs located in the regions where trading areas cover a large area and service a large population. Therefore, the city’s urban plan and the business service plan should fully consider the type and layout of UCDs. They should also issue policies to guide the development of UCDs instead of merely stipulating the area of UCDs or commercial facilities in the plan. Detailed commercial guidance is needed for various residential districts and UCDs. In addition to optimizing the relationship between the UCDs and the residential districts, it is also necessary to coordinate the relationship between the UCDs and other functional districts in the city, for example, the complementary optimization between the UCDs and the tourist districts, and the coordinated development between the UCDs and the industrial districts.
5. Conclusions and Prospects
In this fast-paced commercial and economic environment, there are many questions on how the urban commercial spatial structure can adapt to the transformation of the economy, and how it can coordinate with the needs of today’s urban residents. For example, what method should be used to rapidly and accurately identify and classify the UCDs and how can we analyze the spatial structure more scientifically and accurately? This paper constitutes an analytical approach to identifying and classifying UCDs via POI and road network data. Real-time POI data were adopted to ensure that the study of UCDs was current, as well as to reduce previous difficulties in the collection of commercial data. Meanwhile, this method of recognizing UCDs can eliminate the complexity and improve the accuracy of identifying UCDs through remote sensing interpretation. Next, the model of the spatial distribution of the statistical population was combined with Huff’s model and the Voronoi method to analyze how various UCDs and their trading areas were distributed within the city from a microscopic perspective. The above methods expanded the research scale of the urban commercial space and provided reference methods for future research on urban commercial space. Finally, by taking Beijing as an example, the study highlighted several issues and gave recommendations regarding urban and commercial planning, and location restrictions as well as choices for commercial stores, which can be used as a reference in other megacities at the same development stage.
However, this study also had several limitations. First, there were issues with partitioning the trading area of different UCDs. To combat this, the UCDs were classified by type, but the service functions of these UCDs still overlapped. Furthermore, trading areas are usually variable, according to time and the influencing factors [45] (Baray & Cliquet, 2007). Additionally, the space occupied by the same type of commercial district was not separated, leading to the possibility of overlap and gradual change. Due to the limitations of the data and methods used in this study, these problems were not effectively addressed, highlighting the need for future studies in this area. In addition, due to the lack of data and the amount of calculations required to determine the spatial distance between the UCDs and the housing block, the linear distance was used instead of the path distance, causing a slight deviation from the real result. In future research, we will enhance the accuracy of the distance or time calculations.
Furthermore, it should be noted that advances in the Internet have led to the rapid development of e-commerce, which has exerted a substantial influence on people’s lifestyles. Residents are frequently switching from shopping in-store to more convenient online shopping. This raises questions with regard to the relationship between online-shopping and on-site shopping. This paper recommends research into whether online shopping is complementary to on-site shopping or a substitute, and how it will influence the urban commercial spatial structure.
Author Contributions
This study was conducted under cooperation between F.W. and F.-q.N. F.W. constructed the methods and wrote this paper. F.-q.N. revised and approved the final version.
Funding
This research was funded by the National Natural Science Foundation of China, grant number 41801149; the Natural Science Foundation of Inner Mongolia, grant number 2016BS0401; National Key Research and Development Program of China, grant number 2016YFC0503506.
Conflicts of Interest
The authors declare no conflict of interest.
References
- Zhao, D.; Zhang, J. The overall logic of the coupling and interacting relationship between consumption space and city development: Taking Deji Plaza as an example. Urban Plan. Int. 2015, 30, 53–58. (In Chinese) [Google Scholar]
- Rao, F.; Summers, M. Planning for retail resilience: Comparing Edmonton and Portland. Cities 2016, 58, 17–106. [Google Scholar] [CrossRef]
- Xu, J.; Yeh, A.; Wu, F. Land commodification: New land development and politics in China since the late 1990s. Int. J. Urban Reg. Res. 2009, 33, 890–913. [Google Scholar] [CrossRef]
- Ye, D.; He, W.; Li, Z.; Xu, W. Symmetrical distributions of cities and urbanization trends in china. J. Geogr. Sci. 2012, 22, 382–383. [Google Scholar]
- Wu, Z.; Dai, X. The study on the spatial structure of Beijing’s commercial centers. City Plan. Rev. 2001, 25, 15–19. (In Chinese) [Google Scholar]
- Proudfoot, M.J. Intra-City Business Census Statistics for Philadelphia, Pennsylvania; Government Printing Office: Washington, DC, USA, 1937.
- Berry, B.J.L. Commercial Structure and Commercial Blight: Retail Patterns and Processes in the City of Chicago; Research Paper; Department of Geography, University of Chicago: Chicago, IL, USA, 1963. [Google Scholar]
- Lamb, R.F. The morphology and vitality of business districts in upstate New York. Prof. Geogr. 1985, 37, 162–172. [Google Scholar] [CrossRef]
- Zhang, S.; Zhang, D. A study on retail market’s regional difference in Beijing. Hum. Geogr. 2001, 16, 79–83. (In Chinese) [Google Scholar]
- Xue, L.; Yang, K. Spatial planning of commercial allocation in Haidian district in Beijing based on spatial interactive models. Geogr. Res. 2005, 24, 265–273. [Google Scholar]
- Zhang, X.; Zhang, X.; Zhong, E.; Wang, S.; Zhang, J. Study on the spatial structure and driving force of urban areas in Beijing based on building space structure. Geogr. Res. 2013, 32, 2055–2065. (In Chinese) [Google Scholar]
- Ye, Q.; Tan, Y.; Zhao, X.; Luo, L.; Chen, N.; Xiang, H. Assessment of implementation effect of commercial network planning based on GIS: A case study of Changsha. Geogr. Res. 2013, 32, 317–325. [Google Scholar]
- Jackson, P.; Thrift, N. Geographies of consumption. In Consumption: Critical Concept Sin the Social Sciences; Miller, D., Ed.; Routledge: London, UK, 2001; pp. 383–409. [Google Scholar]
- Huang, X.; Chen, Z. The retail business structure of the metro site based on the information entropy—A case study of the 15 subway site in guangzhou. Econ. Geogr. 2014, 34, 38–44. (In Chinese) [Google Scholar]
- Burcu, H.; Cigdem, V.; Ozge, Y. Do shopping centers abate the resilience of shopping streets? The co-existence of both shopping venues in Ankara, Turkey. Cities 2014, 36, 145–157. [Google Scholar]
- Wang, F.; Gao, X. Structure of commercial space and its coupling relationship with population distribution in Beijing. City Plan. Rev. 2015, 39, 23–29. (In Chinese) [Google Scholar]
- Wang, F.; Gao, X.; Xu, Z. Identification and classification of urban commercial districts at block scale. Geogr. Res. 2015, 34, 1125–1134. (In Chinese) [Google Scholar]
- Wang, F.; Li, Y.; Gao, X. A SP survey-based method for evaluating environmental performance of urban commercial districts: A case study in Beijing. Habitat Int. 2016, 53, 284–291. [Google Scholar] [CrossRef] [Green Version]
- Huff, D.L. Defining and estimating a trading area. J. Mark. 1964, 28, 34–38. [Google Scholar] [CrossRef]
- Huff, D.L. A programmed solution for approximating an optimum retail location. Land Econ. 1966, 42, 293–303. [Google Scholar] [CrossRef]
- Ghosh, A.; McLafferty, S.L. Location Strategies for Retail and Service Firms; Lexington Books: Reading, MA, USA, 1987. [Google Scholar]
- Wang, H. The theoretical model of commercial trading areas. Mark. Demogr. Anal. 1999, 5, 23–25. (In Chinese) [Google Scholar]
- Reilly, W.J. The Law of Retail Gravitation; W.J. Reilly: New York, NY, USA, 1931. [Google Scholar]
- Drezner, T.; Drezner, Z. The gravity multiple server location problem. Comput. Oper. Res. 2011, 38, 694–701. [Google Scholar] [CrossRef]
- Matthias, D.; Dirk, V.; Nico, V. An extended Huff-model for robustly benchmarking and predicting retail network performance. Appl. Geogr. 2014, 46, 80–89. [Google Scholar]
- Eva, M.; Margarita, O. A segmentation study of Mexican consumers based on shopping centre attractiveness. Int. J. Retail Distrib. Manag. 2012, 40, 759–777. [Google Scholar]
- Lu, C.; Wang, H.; Liu, L.I. Retail district range compare model construction and Shanghai districts demonstration. Econ. Geogr. 2015, 11, 133–137. (In Chinese) [Google Scholar]
- Wan, N.; Zou, B.; Sternberg, T. A three-step floating catchment area method for analyzing spatial access to health services. Int. J. Geogr. Inf. Sci. 2012, 26, 1073–1089. [Google Scholar] [CrossRef]
- Bruno, G.; Improta, G. Using gravity models for the evaluation of new university site locations: A case study. J. Comput. Oper. Res. 2008, 35, 436–444. [Google Scholar] [CrossRef]
- Shahrzad, K.; Mohammad, R. Facility and hub location model based on gravity rule. Comput. Ind. Eng. 2017, 109, 28–38. [Google Scholar]
- Davis, P. Spatial competition in retail markets: Movie theaters. Rand J. Econ. 2006, 37, 964–982. [Google Scholar] [CrossRef]
- Birkin, M.; Clarke, G.; Clarke, M. Refining and operationalizing entropy-maximizing models for business applications. Geogr. Anal. 2010, 42, 422–445. [Google Scholar] [CrossRef]
- Dolega, L.; Pavlis, M.; Singleton, A. Estimating attractiveness, hierarchy and catchment area extents for a national set of retail centre agglomerations. J. Retail. Consum. Serv. 2016, 28, 78–90. [Google Scholar] [CrossRef] [Green Version]
- Li, Y.F.; Pan, H.Z.; Tian, L.; Wu, Y. Modification of Huff Model and its application in urban commercial network planning: A case of Changzhou City, Jiangsu Province. Arid Land Geogr. 2014, 37, 802–811. (In Chinese) [Google Scholar]
- Zhao, J.; Sun, Q. Model and Simulation of Data Aggregation Based on Voronoi Diagram in Hierarchical Sensor Network; Springer: New York, NY, USA, 2012; Volume 202, pp. 107–113. [Google Scholar]
- Long, Y.; Han, H.; Yu, X. Discovering Functional Zones Using Bus Smart Card Data and Points of Interest in Beijing. 2012. Available online: http://www.beijingcitylab.com/working-papers-1/wp1-20/ (accessed on 15 June 2013).
- Qi, W.; Liu, S.; Gao, X.; Zhao, M. Modeling the spatial distribution of urban population during the daytime and at night. J. Geogr. Sci. 2015, 25, 756–768. [Google Scholar] [CrossRef]
- Zhang, Z.; Zhou, Y.; Li, Q.; Lin, Y. An estimation method of dynamic population within an urban local area. J. Geo-Inf. Sci. 2010, 12, 503–509. [Google Scholar] [CrossRef]
- Sherratt, G.G. A Model for General Urban Growth. In Proceedings of the Sixth International Meeting of the institute of Management Science; Churchman, C.W., Verhulust, M., Eds.; Pergamon Press: Oxford, UK, 1960. [Google Scholar]
- Wu, Z. Remodified model of location of urban trading areas based on Huff modified model. J. Jishou Univ. Nat. Sci. Ed. 2009, 30, 108–111. (In Chinese) [Google Scholar]
- Zhu, Q.; Zhang, W.; Zhao, D. Topography-based spatial daily precipitation by means of PRISM and Thiessen polygon analysis. Sci. Geogr. Sin. 2005, 25, 233–238. (In Chinese) [Google Scholar]
- Guruprasad, K.; Ghose, D. Heterogeneous locational optimisation using a generalised voronoi partition. Int. J. Control 2013, 86, 977–993. [Google Scholar] [CrossRef]
- Garcia-Lopez, M.-A. Population suburbanization in Barcelona, 1991–2005: Is its spatial structure changing? J. Hous. Econ. 2010, 19, 131–144. [Google Scholar] [CrossRef]
- Huang, D.; Liu, Z.; Zhao Xi Zhao, P. Emerging polycentric megacity in China: An examination of employment subcenters and their influence on population distribution in Beijing. Cities 2017, 69, 36–45. [Google Scholar] [CrossRef]
- Baray, J.; Cliquet, G. Delineating store trade areas through morphological analysis. Eur. J. Oper. Res. 2007, 182, 886–898. [Google Scholar] [CrossRef]
Figure 1.
Study area: Beijing, China.

Figure 2.
The distribution of the data sources. (a) Retail stores; (b) housing blocks.

Figure 3.
The distribution of different types of commercial districts in Beijing.

Figure 4.
The spatial distribution of different kinds of commercial trading areas. (a) Dietary and cultural commercial trading areas; (b) franchise-type commercial trading areas; (c) shopping commercial center trading areas; (d) convenience commercial trading areas; and (e) complex commercial trading areas.


Table 1.
Operation area of the retail stores.
| Store | Type | Operation Content | Operation Area (m2) |
|---|---|---|---|
| Retail | Large emporium | Shopping center, commercial complex. | 50,000 |
| Business street | Mall and special business street. | 30,000 | |
| Special emporium | Furniture and construction material market, household appliance and electronics market. | 3000 | |
| Supermarket | Multinational supermarket chains, native supermarkets. | 3000 | |
| Comprehensive market | Market for farm and sideline products, market for petty commodities, market for secondhand goods, market for fruits, market for seafood, and market for vegetables. | 2000 | |
| Market for flowers, birds, fish, and insects | Pet market, flower market, and the comprehensive market for flowers, birds, fish, and insects. | 1000 | |
| Various specialty shops | Cosmetic shops, sports requisite shop, stationary supply shops, shops for clothing and leather goods, exclusive shops, and specialist trading arenas like pawnshops and auction houses. | 300 | |
| Convenience store | All kinds of convenience stores. | 100 | |
| Restaurant | Formal restaurants | Various Chinese and foreign restaurants. | 800 |
| Fast food restaurants | All kinds of fast food restaurants. | 400 | |
| Recreational dietary places | Coffee shops, tea houses, cold drinks, bars, and other recreational places. | 300 | |
| Take-out shops | Dessert shops, cake stores, etc. | 100 |
Table 2.
The classification and functional characteristics of different types of UCDs in Beijing.
| Functional Characteristics | Dominating Store | Quantity of UCDs | Average Area of the UCDs (km2) | Cases | |
|---|---|---|---|---|---|
| 1. Dietary and cultural UCD | Catering services | Restaurants | 240 | 0.015 | Wei Gong Cun UCD |
| 2. Franchise-type UCD | A certain type of franchise service | Construction materials, appliances, electronics market | 264 | 0.068 | Shi Li He UCD, Si Hui UCD |
| 3. Shopping left UCD | Upscale and integrated shopping, entertainment services | Large shopping mall, central commercial street | 350 | 0.121 | Wang Fu Jing UCD, Xi Dan UCD |
| 4. Convenience UCD | Basic life needs, daily popularization of service and food | Supermarket, convenience store, grill room | 120 | 0.011 | Kan Dan Lu UCD |
| 5. Complex UCD | A variety of services, comprehensive functions | Professional store, integrated market, restaurants, supermarkets | 89 | 0.051 | Hui Long Guan UCD, Wu Dao Kou UCD |
© 2019 by the authors. Licensee MDPI, Basel, Switzerland. This article is an open access article distributed under the terms and conditions of the Creative Commons Attribution (CC BY) license (http://creativecommons.org/licenses/by/4.0/).
Share and Cite
MDPI and ACS Style
Wang, F.; Niu, F.-q. Urban Commercial Spatial Structure Optimization in the Metropolitan Area of Beijing: A Microscopic Perspective. Sustainability 2019, 11, 1103. https://doi.org/10.3390/su11041103
AMA Style
Wang F, Niu F-q. Urban Commercial Spatial Structure Optimization in the Metropolitan Area of Beijing: A Microscopic Perspective. Sustainability. 2019; 11(4):1103. https://doi.org/10.3390/su11041103
Chicago/Turabian StyleWang, Fang, and Fang-qu Niu. 2019. "Urban Commercial Spatial Structure Optimization in the Metropolitan Area of Beijing: A Microscopic Perspective" Sustainability 11, no. 4: 1103. https://doi.org/10.3390/su11041103
Note that from the first issue of 2016, this journal uses article numbers instead of page numbers. See further details here.