Abstract
Counterfactual analysis has been recommended as a means of assessing the impacts of European Rural Development Programmes (RDP) over recent years, although its application has been scarce to date. This paper examines the use of counterfactual analysis to assess socioeconomic impacts in a set of 2007–2013 ex-post evaluations. The analysis undertaken shows that a wide variety of counterfactual approaches have been applied, although certain barriers still remain to address the estimation of RDP impacts following the EU evaluation standards. Furthermore, we noted that impacts provided by individual RDP evaluations may hardly be aggregated, making it difficult to draw clear conclusions about the effectiveness of rural development policy at the EU level.
1. Introduction
Rural Development Programmes (RDPs) have represented the main instrument of the second pillar of the European Union’s (EU) Common Agricultural Policy (CAP) since their introduction as part of the Agenda 2000 reform. These multi-annual programmes, defined at national or regional level by member states (MS), cover programming periods of seven years. To date, two programming periods have been completed (2000–2006 and 2007–2013), with the third (2014–2020) currently ongoing.
Like other structural funds, RDPs are subject to ex-post evaluations to assess their success and impacts with respect to defined objectives. The evaluation procedures of EU programmes have increasingly gained relevance within the European Commission’s (EC) activities over recent years [1,2,3]. The recent EU Better Regulation Agenda [4] highlights the role of these evaluations in the EU policy cycle as they “… aim to inform policymaking by assessing existing interventions regularly and ensuring that relevant evidence is available to support the preparation of new initiatives”.
The assessment of RDP impacts, however, implies particular challenges for policy evaluators due to the complex and cross-sectoral nature of rural communities [5]. In order to ease and enhance these evaluations, different guidelines have been issued in parallel with programme implementation [6,7,8,9,10], becoming the main references to address the evaluation of these programmes [11]. Among the recommendations of these guidelines, it is suggested the application of counterfactual analysis to address the estimation of programme impacts.
In policy impact evaluation, counterfactual analysis is based upon comparison of a situation where a policy has been implemented and the counter-point, where that policy has not been applied [12]. When proper comparisons are carried out, it is possible through this form of analysis to identify the causal effects of each policy intervention [13].
However, to date, application of counterfactual methodologies in RDP evaluations is scarce. The synthesis of the 2000–2006 RDP ex-post evaluations [14] noted that counterfactual approaches were seldom applied to assess ex-post impacts due to, inter alia, data availability. The methodological revision of the mid-term evaluations for the 2007–2013 RDPs also support this observation, noting that less than 20% of evaluations employed counterfactual approaches to estimate impacts [15]. In place of counterfactual analyses, other evaluation approaches have been employed to estimate RDP impacts such as qualitative approaches [16] or quantitative naïve techniques [11].
The results obtained from these evaluations have been questioned by the European Court of Auditors (ECA), which reported “serious weaknesses” in the availability and quality of information provided by evaluations related to rural development spending [17]. Furthermore, Andersson et al. [18] explore the influence of RDP evaluations in the design of EU rural development policy and conclude that they seem to scarcely contribute, partly as a consequence of the limited scientific foundation of the methods used to derive the recommendations provided.
To our knowledge, no study has focused on the application of counterfactual analysis to assess RDPs, especially in the context of 2007–2013 ex-post evaluations. To date, just the European Economic and Social Committee (EESC) has performed ex-post assessments of 2007–2013 programmes, carrying out a stakeholder based qualitative evaluation of their effectiveness [19].
To fill this research gap, the aim of this paper is to explore the application of counterfactual approaches in estimating the ex-post impacts of the 2007–2013 RDPs. In particular, we focus on socioeconomic impacts due to the role of RDPs in boosting employment and economic growth in EU rural areas. To this end, we analyse seven regional and national ex-post evaluation reports, focussing on the methodological approaches used to estimate the programme’s socioeconomic impacts reported in the related common evaluation questions. Furthermore, with the aim of deriving lessons for future evaluations, we analyse the limitations of the methodologies applied, and we outline some recommendations.
The paper is organised as follows: Section 2 outlines the structure of EU rural policy for the period 2007–2013; Section 3 reviews the framework established to estimate the RDP ex-post socioeconomic impacts; Section 4 presents the analysis carried out according to the estimation of the reported socioeconomic impacts; Section 5 discusses the findings of the analysis and outlines a set of suggestions and Section 6 presents the main conclusions of the paper.
2. European Union (EU) Rural Development Policy 2007–2013
For the programming period 2007–2013, implementation by the MS of the EU rural development policy followed several steps. First, MS submitted national strategy plans. Secondly, MS set up their RDPs at national or regional level. Thirdly, a Common Monitoring and Evaluation Framework (CMEF) was developed for assessing the performance of the RDPs and rural development networks were established—at national and EU level—to support the implementation and evaluation of the rural policy.
A total of 94 rural programmes were implemented across the EU–27: two national frameworks, four programmes on national rural development network and eighty-eight national/regional RDPs [20]. These programmes were financed with a budget of €151.5 billion, co-funded by the European Agricultural Fund for Rural Development (EAFRD) and the MS [21].
The structure of RDPs was based on four axes following the EU’s rural development objectives: (1) improving the competitiveness of the agricultural sector; (2) improving the environment and the countryside through support for land management; (3) improving the quality of life in rural areas and encouraging diversification of economic activity; and (4) innovative governance through the locally based “Liaison Entre Actions de Développement de l’Économique Rurale” (LEADER) approach.
Each axis is articulated through an array of measures. These measures are defined to achieve specific objectives and are targeted to a particular type of beneficiary, who has to accomplish a set of requirements to obtain the aid. A total of forty-two measures were proposed to MS for the programming period 2007–2013 [20]. The 10 most representative measures at the EU–27 level, in budgetary terms, are presented in Table 1.

Table 1.
Most representative measures of the European Union (EU) rural development policy 2007–2013. * First code number is related to the belonged axis (e.g., measure 214 belongs to axis 2).
As shown in Table 1, RDPs cover a wide variety of policy instruments to support rural communities. All these measures directly or indirectly contribute to boost economic growth and employment within intervention areas. However, quantification of these socioeconomic effects is not straightforward. The wide variety of beneficiary types, together with the cross-sectorial dimension of the aids, represent a major challenge for policy evaluators to estimate the impacts of these programmes.
3. Framework for Rural Development Programme (RDP) Evaluations
3.1. The Common Monitoring and Evaluation Framework (CMEF)
The CMEF, designed by the EC in cooperation with the MS, is based upon a set of documents that establish a common framework for monitoring and evaluating individual RDPs [7]. To address the estimation of the ex-post impacts, the CMEF stated a set of common evaluation questions (CEQs) and impact indicators. The CEQs are established to structure the information on the ex-post evaluation reports and to synthesise the main results obtained. Regarding the socioeconomic impacts, two main programme-related questions were defined: to what extent has the RDP contributed to the growth of the whole rural economy? (CEQ1) and; to what extent has the RDP contributed to employment creation? (CEQ2).
To address these questions, they were linked to the three socioeconomic impact indicators defined under the intervention logic of the programmes: (I1) Economic growth; (I2) Employment creation and (I3) Labour productivity. These indicators are measured by the net additional gross value added (GVA) in purchase power standard (PPS), by net additional full-time equivalent (FTE) jobs and the change in GVA per FTE job, respectively. The association between CEQs and impact indicators presented in Table 2 is key for the independent evaluators of the programmes as stated by the common framework to assess RDP socioeconomic impacts.
Table 2.
Socioeconomic common evaluation questions (CEQs) and impact indicators defined in the 2007–2013 Common Monitoring and Evaluation Framework (CMEF).
3.2. Rural Development Programme (RDP) Impacts and Counterfactual Methodologies
RDP impacts are understood by the EU Directorate-General for Agriculture and Rural Development (DG-AGRI) as the “… causal effects of an intervention lasting in medium or long term (causality has to be verified) and refer to the effect of the programme beyond the immediate direct beneficiaries at the level of the intervention” [9] (p. 50). In practice, this interpretation of impacts implies methodological challenges for evaluators, as they need to identify the programme’s direct effects and take into account a set of indirect effects (e.g., leverage effect, deadweight loss, multiplier effects) to measure the programme net impacts (see more in [9]). A vast array of methodological approaches has been proposed to assess these effects (for instance, Terluin and loan [22] review 22 evaluation methods to assess rural programmes).
To address the estimation of RDP net impacts following the CMEF standards, counterfactual analysis was recommended. As previously mentioned, counterfactual analysis in the field of policy impact evaluation aims at comparing a situation with a policy and its counter-part “what would have happened in the absence of the policy” [23]. Several international institutions provide guidelines on counterfactual analysis, with the aim of enhancing policy impact evaluation procedures [9,13,24,25,26]. In these guidelines, a set of methodological approaches are commonly considered (see Table 3).
Table 3.
Counterfactual methodologies outlined in different impact evaluation guidelines.
From a methodological perspective, experimental approaches are considered the evaluation golden standard, as they allow for robust counterfactual comparisons through random assignment of programme participation among individuals [27]. However, some ethical and representativeness issues provide barriers to application of these methods, and are yet to have been applied for evaluation of agricultural programmes in the EU [28]. Due to these limitations, quasi-experimental approaches—those that attempt to simulate experimental conditions (i.e., randomisation) using observational data—are often recommended to address counterfactual analysis. Four main counterfactual approaches are highlighted according to the reviewed literature: (1) regression discontinuity design (RDD) methods; (2) matching methods, (3) difference in differences (DiD) techniques and; (4) instrumental variable (IV) methods.
RDD approaches compare outcomes of programme participants and non-participants around a cut-off point determined by a programme/measure accessibility criterion [29]. According to the rationale behind this methodology, participants around the cut-off point in both groups are comparable (a kind of randomisation is established) and it is possible to estimate the causal effects of the policy [30]. RDD approaches have been employed to assess the effects of European regional policy, exploiting the fixed limits established for its implementation [31,32]. However, to our knowledge, these approaches have yet to be used to assess the impacts of RDPs.
The application of matching methods, however, is extensive in the field of RDP evaluation. These approaches seek to create a group of programme non-participants (control group) statistically similar to programme participants (treatment group) using matching algorithms. Among matching methods, particular attention is given in the literature to propensity score matching (PSM). PSM allows participants and non-participants to be paired using a binary score (i.e., the propensity score) econometrically estimated using observable characteristics of individuals (see more in [33]). To partially address its limitations regarding the selection bias on unobservables—differences between groups due to unobserved factors (e.g., participants’ motivation)—PSM is usually combined with DiD technique. The DiD technique is based on comparing outcomes of participants and non-participants (first difference) before and after policy implementation (second difference). When participants and non-participants are previously matched with PSM or another matching method (see for instance [34]), the methodological approach is usually called conditional DiD.
PSM-DiD approach was recommended to estimate 2007–2013 RDP ex-post impacts [9]. Its suitability to assess programme impacts at micro and regional level was previously reviewed by Michalek [11,35]. PSM-DiD has been commonly applied to assess socioeconomic impacts of certain RDP measures, mainly agri-environmental payments [36,37,38,39] and farm investment measures [40,41,42]. From a geographical perspective, PSM-DiD has been applied to assess RDP impacts in several MS and non EU countries (21 examples of its application are noted in [10] (p. 13)). Most of these studies employ the Farm Accountancy Data Network (FADN), an EU-harmonised database with microeconomic data for more than 80,000 farms across Europe (the suitability of FADN for evaluating RDPs is discussed in [43]).
IV methods allow for approximate randomisation using an external instrument (i.e., exogenous factor or shock) that influences programme participation but not directly the results (e.g., a programme implementation delay in certain areas with respect to others). This method deals with selection bias on unobservables and allows for assessment of the policy causal effects under certain conditions [24]. Kuhfuss and Subervie [44] exploited a delay in the implementation of agri-environmental schemes to assess the impacts of these instruments in the use of herbicides in two regions in France.
Regarding modelling approaches, few policy impact evaluation guidelines consider them to address a counterfactual analysis in ex-post setting (see Table 3). However, some applications can be found in the literature. Within the Common Agricultural Policy Regional Impact Analysis (CAPRI) modelling system [45], a rural development module which combines regional computable general equilibrium (CGE) models and mathematical programming (MP) approaches was developed and was tested to estimate ex-post RDP impacts in Germany [46]. This advanced simulation model, based on behavioural assumptions and exogenous parameters, allows for implementation of the counterfactual approach as it is designed to construct alternative agricultural scenarios in comparison with a baseline scenario. Input–output (I/O) modelling has been also used to estimate the impacts of rural development policy. Input-output models allow to simulate an external shock (e.g., RDP expenditure) to assess the distributional effects within the economy. Monsalve et al. [47], for instance, applied a multiregional I/O model to assess the effects of EAFRD funds in Europe and the rest of the world considering economic, social and environmental variables.
4. Evaluation of Socioeconomic Impacts in Selected 2007–2013 RDP Ex-Post Evaluations
4.1. What Ex-Post Evaluations Have Been Reviewed and How?
This paper analyses a total of seven ex-post evaluation reports of national and regional 2007–2013 RDPs. The assessed reports correspond to the following programmes: Mainland (Portugal), Murcia (Spain), Castilla y Leon (Spain), Scotland (UK), Malta, Romania and Ireland. The evaluation reports were selected according to the online access to the full published documents at the time of the analysis and the used language.
The undertaken analysis was two-fold. On one side, we reviewed the responses of the CEQs related to the programme socioeconomic impacts (CEQ1 and CEQ2 defined in Section 3.1). The aim was to identify the reported socioeconomic impacts by each RDP evaluation and to check whether the CMEF considerations were followed with respect to impact indicators. Furthermore, we reviewed the methodologies and databases employed to address the estimation of those reported impacts. The objective was to explore the way in which counterfactual analysis was addressed and to provide insights about methodological limitations and potential improvements for further evaluations.
Focusing on the selected RDP evaluations, important differences exist in the type of policy intervention adopted (Figure 1). With regard to budget allocation, measures related to land management (agroenvironmental (AE) and less-favoured area (LFA) payments) account for a large share of expenditure in Ireland (70.7%) and Scotland (49.6%), while measures related to competitiveness (farm, agro-industry and infrastructure investments) represent a significant fraction of the budget in Murcia (46.1%) and Portugal (38.8%). Support related to quality of life and diversification of the rural economy is especially important in Romania, where 17.3% was targeted towards village renewal.
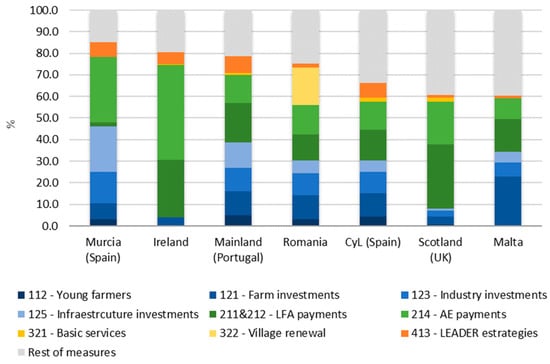
Figure 1.
Total public expenditure by measure of the analysed RDPs (%). Source: Own elaboration based on data from [21].
4.2. How Have the Evaluations been Conducted?
All reviewed evaluations quantify RDP impacts in terms of economic growth and employment creation, while two of them did not quantify impacts on labour productivity (Romania and Ireland). The reported impacts cover mainly the agricultural and food sector, with limited evidence of impacts in forest and other non-agricultural sectors. Regarding the requirements of CMEF indicators, net impacts were estimated in all cases, although certain shortcomings were observed in terms of units and result disaggregation (for instance, PPS units for economic growth impacts were just used in Castilla y Leon and Malta evaluations).
Focusing on methodologies, several micro and macro level approaches were applied across evaluations. We consider micro-level approaches as those that use microdata as the main data source (e.g., individual farm data) to address the estimation of socioeconomic impacts, while macro-level approaches are those that employ mainly aggregated data to address the impact estimation (e.g., input/output tables).
Across evaluations, two main counterfactual micro-level approaches were employed: interviews (Scotland and Portugal) and econometric techniques (Murcia, Malta, and Romania). The interviews undertaken were based on counterfactual analysis, as evaluators firstly obtained gross impacts of programme intervention (from direct questionnaires in Scotland and from the RDP monitoring system in Portugal) and later subtracted the estimated indirect effects (these were obtained through questionnaires and integrated in the impacts’ estimation as multiplier factors or coefficients). In Scotland, the interviewed sample consisted of 1239 beneficiaries of a set of measures and the obtained net impacts were scaled up at axis and programme level according to the beneficiary representativeness (see more in [48]). In Portugal, employment net impacts were obtained based on a sample of 918 beneficiaries’ responses of two LEADER measures (see more in [49]).
With respect to econometric techniques, two main approaches were identified: PSM-DiD (Murcia and Romania) and standard regression approaches (Malta and Ireland). The PSM-DiD approaches were employed to estimate the programmes’ impacts on the agricultural and food sectors. In Murcia, those impacts were calculated using the FADN and SABI (SABI (Sistema de Análisis de Balances Ibéricos) is a database with financial information of Spanish enterprises) databases respectively. For the agricultural sector, the beneficiary sample varies between 9 and 54 farms (mainly from AE and LFA measures) according to the available years, while for the food sector, the sample covered 36 enterprises (see more in [50] (p. 315)). In both estimations, results were scaled up at programme level according to the beneficiary representativeness.
In Romania, input data came from a combination of National Ministry of Public Finance (NMPF) data and the so-called Romanian-Companies database. The data covered beneficiary information of certain measures (in particular, seven measures from Axis 1, Axis 3 and LEADER). In this case, the treated sample varied from 16 to 155 observations depending on the measure, with the outputs from the PSM-DiD not found to be statistically significant for some of the socioeconomic impact variables (see more in [51] (pp. 164–171)).
In Malta, fixed-effect regression approaches were selected to address the socioeconomic impacts estimation of two RDP measures (farm and agro-industry investments). The selection of this method was conditioned by data availability (see more in [52] (p. 124)). The studied sample covered 77 supported farms obtained from FADN and 34 supported enterprises obtained from a combination of the Managing Authority and Inland Revenue Department data. To estimate net impacts, the results were weighted by a multiplier effects factor—estimated by a national I/O table—and scaled up according to the number of beneficiaries of those measures. In Ireland, a set of standard regression approaches for unobserved factors were employed (see more in [53] (p. 18)). Fixed and random effect regressions were run to obtain the counterfactual impacts of AE and farm investment measures using data from national FADN.
Regarding macro-level approaches, two evaluations employed I/O modelling approaches (Castilla y Leon and Ireland) and one used a production function-based regression approach (Portugal). In Castilla y Leon, a regional I/O model was employed to estimate impacts to the wider economy (73 activity branches) using a regional I/O table (see more in [54] (p. 78)). The obtained impacts were annually reported and disaggregated by axes. The distribution of RDP expenditure among activity branches were estimated through questionnaires to RDP Managing Authorities. In Ireland, the Bio-Economy I/O model [55] was employed to estimate the wider economic impacts of the RDP on the national economy. According to the evaluation report, this model shows special resolution for primary sectors as Irish I/O table is discomposed using national FADN and other sectorial data sources. Apart from wider impacts, the model allows for estimation of disaggregated multiplier effects by agricultural activity (see more in [53] (p. 35)).
In Portugal, estimation of impacts on economic growth and productivity was addressed through a regression based on a Cobb–Douglass function. GVA of the agricultural sector is defined under this function and calculated using national statistical data (i.e., Economic Accounts for Agriculture). Counterfactual analysis is carried out varying the function’s capital parameter using private expenditure data related to farm investment and young farmers’ measures, obtained from the RDP monitoring system. Productivity is estimated dividing annual GVA by the averaged agricultural employment.
A synthesis of databases and methodologies employed in the set of evaluations analysed is presented in Figure 2.
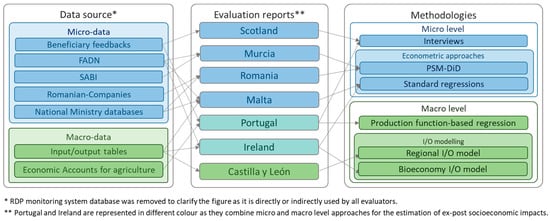
Figure 2.
Methodological approaches employed in the reviewed RDP ex-post evaluations to assess socioeconomic impacts. Source: Own elaboration.
4.3. What Are the Main Impacts Reported?
Reported socioeconomic impacts largely differ between evaluation reports (see Appendix A). In general, the reviewed 2007–2013 RDPs appear to have contributed more to rural economy growth than employment creation (generally, the evaluations reported sustaining employment effects rather than creating new jobs). Investment measures (Axis 1) and AE measures (Axis 2) are particularly highlighted among evaluations as key instruments to boost economic development in rural communities.
The RDP impacts with respect to GVA were estimated to be 2800 M£ in Scotland, while in Ireland and Portugal they were estimated to be 2337 M€ and 1536 M€ respectively. In Scotland, these net effects were mainly associated with the implementation of measures under Axis 2, while in Ireland and Portugal these impacts were mainly related to the on-farm investment measure (Axis 1). In Romania, a significant contribution of the measures under axes 1, 3 and 4 was noted, although only the impacts related to Axis 3 were quantified (150 M€ of additional GVA in non-agricultural sector). In Malta, a net impact of 7.2 M€ on the national rural economy was estimated due to farm and agroindustry investment measures. The region of Castilla y Leon reported a RDP contribution of 1045 M PPS to the regional economy. In Murcia, the impact was estimated to be an increase of 13.5 M€ in terms of GVA (adding up the estimated impacts in agricultural and agroindustry sectors).
In terms of productivity, Scotland and Malta reported an increase of 37,000 £/FTE and 1853 €/FTE respectively due to the RDP intervention. Castilla y Leon and Murcia reported smaller impacts. An increase of 421.5 PPS/FTE was reported by the first region, while an increase of 290 €/FTE in agricultural sector and 396.2 €/FTE in agroindustry were reported by the second region. In Portugal, impacts on productivity were estimated with an average increase of 3% among beneficiaries.
With respect to employment, 26,000 FTE jobs were estimated in Scotland, mainly due to Axis 2 measures. In Ireland, an increase of 6466 and 643 FTE annual jobs in the national economy and the agricultural sector were reported. In Portugal, the creation of 7000 FTE jobs was estimated through LEADER measures (with particular impacts on the tourism sector) and, although not calculated, the contribution of Axis 1 measures is recognised in this regard. In Romania, 2000 jobs for women were estimated on the basis of Axis 3 (specifically by measure 312). In Castilla y Leon employment creation for the region was estimated at 24,571 FTE jobs. Limited impacts were reported in Murcia and Malta. The first one reported 60 jobs in the agricultural sector and 98.7 jobs in the food industry sector. In Malta, the evaluation reported a creation of 3.6 jobs per enterprise in the food industry.
The comparability of estimated impacts across RDPs, however, present several barriers. These limitations are discussed in the following section.
4.4. What Are the Main Limitations Encountered?
Numerous interrelated factors interfere in the evaluation processes thus affecting the calculation of RDP impacts. We attempted to categorise and aggregate them around four main groups attending the following issues: political/institutional issues, data issues, methodological issues and aggregation issues.
Regarding the first group, a relevant factor influencing RDP evaluations is the regulatory flexibility given to MS in implementing the European rural development policy. The rationale behind this design encourages the adaptation of policy instruments to the specific features of the European rural territories [56]. As Section 4.1 shows, analysed programmes not only differ at the implementation level (i.e., national or regional), but in the adopted measures and allocated budget to those measures (see Figure 1). This flexibility, considered crucial to achieve the EU rural development objectives [56], unavoidability leads to a heterogeneous and complex set of rural development instruments and economic priorities among European rural zones. Moreover, other policy instruments (e.g., Pillar 1 of the CAP, the European regional policy) are implemented to develop rural communities in different ways. Consequently, evaluation approaches are quite sensitive to the specific rural contexts where RDPs are implemented. The evaluation of Castilla y Leon, for instance, highlights the additional challenges that are generated through the implementation of the RDPs at regional level from the evaluation perspective, especially considering the demands of CMEF indicators [54] (p. 262). In this regard, impact indicators for the programming period 2007–2013 were criticised in certain reports ([48] (p. 148), [53] (p. X)), arguing its partial contribution to understand the programme’s success. In general, the evaluation system of the 2007–2013 period has been criticised as a very “economic indicator” oriented system [5].
Another major factor is the coordination among the different institutions involved in the implementation of the policy. While the design and implementation of RDPs is the responsibility of the national or regional Managing Authority, the management of rural funding is the responsibility of payment agencies, and evaluations are the responsibility of independent evaluators, generally private consultant groups or research institutions. As highlighted in different reports ([48] (p. 148), [54] (p. 262), [50] (p. 302)), interactions between these bodies add difficulties to the evaluation process, especially regarding data availability from monitoring systems and consequently for evaluations. According to the Murcia evaluation [50] (p. 302), this fact may be explained through the still limited institutional evaluation culture.
The budget devoted to evaluation procedures also conditions the quality of instruments employed to evaluations. At the EU level, the average programmed expenditure in technical assistance (measure 511), which includes funds for monitoring and evaluation activities [57], was 1.56% [21]. In our analysis, only three programmes (Malta, Portugal and Murcia) exceed this threshold during the programming period 2007–2013.
From the evaluation perspective, the adopted flexibility of RDPs generates an extensive range of impacts to be measured across regions and MS. These impacts encompass different scales (e.g., national, regional, farm level), dimensions (i.e., economic, environmental, social) and economic sectors (e.g., agriculture, industry, forestry). However, data is not always available for evaluators to capture such effects as noted in most reviewed evaluations reports.
In terms of data availability, the recommended econometric approaches demand microdata (e.g., farms, business data) to address the assessment. Ideally, sourced microdata should accomplish five main requirements: (1) homogenised data across MS and regions (to allow comparability); (2) coverage of requested CMEF indicators (to ensure common measurement of policy achievements); (3) disaggregated information about RDP measures (to afford counterfactual analysis of the programme); (4) coverage of RDP implementation period (to timely measure RDP impacts); and (5) availability of sufficient data and balanced number of beneficiaries and non-beneficiaries (microdata for 150 RDP beneficiaries and 300–450 non-beneficiaries would be required to estimate programme impacts [9] (p. 104)).
A recommended database in this regard is FADN ([9,10]). This database generally fulfils the five points, although certain points (namely 3, 4 and 5) are partially covered based upon the information provided by the reports analysed. Regarding point 3, the number of RDP measures represented in FADN are limited (mainly AE, LFA and investment measures). As these measures accounted for half of the total 2007–2013 RDP budget (see Table 1), the use of FADN limits the impact’s estimation of the whole RDP funds in the rural areas. Additionally, FADN enables the estimation of RDP impacts exclusively on farms due to its intrinsic characteristics, thereby only enabling the assessment of impacts on the agricultural sector. As agriculture represents a small share of the rural economy in some EU MS/regions, impact estimation on other strategic sectors within rural communities (i.e., industry, tourism) would be needed for a more comprehensive evaluation results. For instance, Murcia complemented FADN with the SABI database to address the impact evaluation also in agroindustry as an attempt to provide a more holistic perspective of RDP impacts. However, the selection of this database fail in the first point mentioned above, as it is an Iberian database. With respect to point 4, a lag between data availability and RDPs closure year was observed. At the time of evaluation, FADN data available for evaluators covered the period 2009–2013 in Murcia and 2008–2014 in Malta. According to the high level of expenditure in the last years of programme implementation, this may be a limitation as the whole RDP impacts derived from rural funds cannot be captured. Regarding point 5, tiny FADN samples were available in the analysed evaluations to estimate RDP impacts (e.g., 9 to 54 beneficiaries in Murcia and 34 in Malta). Also, the other micro-databases exploited in the reviewed econometric approaches showed a scarce number of RDP participants (16 to 155 observations in Romania).
Focusing on macro-level approaches, data requirements are different. I/O models demand two main data sources. On the one hand, these models employed I/O tables, which represent the productive structure of an economy by sectorial activities. The availability of I/O tables, however, presents large delays especially at the regional level. At the time of evaluation, 2005 was the last available year for the regional table of Castilla y Leon. The use of data which is from a year prior to programmes’ implementation (2007–2013) may be questioned in an ex-post evaluation context, especially when the lag between data availability and evaluation moment is too large. On the other hand, I/O models precise additional data to define the shock introduced to the model. The internal issue of aids assignment to economic activities within I/O models is not an easy task in the RDP context, as some aids are not specifically targeted to any sector and its effects may spread among the whole economy [54] (p. 82). A common procedure is to undertake interviews to Managing Authorities to distribute the allocated funds among economic sectors. This step may condition the obtained results as subjective criteria are introduced in the model.
Looking at the methodological aspects of the evaluations, different limitations arose according to the approach applied. The exclusive use of beneficiary feedbacks used in Portugal and Scotland to address counterfactual analysis may be brought into question. According to Colen et al. [28], the use of qualitative methods based on stakeholders’ perception can impede conclusive statements that change in outcomes are caused exclusively by the policy. Michalek [11] noted that quantitative effects derived exclusively from beneficiaries’ interviews without definition of robust comparison group (i.e., estimated from matching approaches) lead to “anecdotal evidence” of RDP impacts. In line with RDP guidelines [9,15], these approaches should be carried out in cases when no data is available or accompanying quantitative approaches to better explain the obtained results. Moreover, undertaken questionnaires were not found across consulted documents, hampering in-depth assessments of how counterfactual analyses were carried out.
As for econometric approaches such as PSM-DiD, they are commonly recommended to estimate policy ex-post causal effects, provided that sufficient data is available. As outlined above, tiny samples were available to estimate impacts in the reviewed evaluations. This may condition the quality of the results obtained and may lead to overestimation or underestimation of impacts. Murcia’s evaluation report also noted that data was not available in panel form [50] (p. 104), limiting the robustness of the PSM-DiD approach employed due to the forced assumption (i.e., participants and non-participants performed equally prior programme implementation). In the Romanian evaluation, certain estimates presented no statistical significance [51] (p. 165). Moreover, reviewed evaluations show that the suitability of econometric approaches to estimate impacts at programme level (requirement of CMEF impact indicators) is limited as just certain measures can be assessed given the coverage of current databases.
In line with the CMEF requirements, I/O modelling approaches allow for the estimation of the wider programme impacts. Results obtained by I/O models, however, are affected by the time lag between I/O tables and RDP implementation [58]. These models also are highly conditioned to the applied spatial context [23]. This may hamper its generality across EU programmes. From a methodological perspective, these models require strong assumptions that may be questioned. For example, these models consider that the structure of the regional economy is maintained over the analysed period (i.e., fixed input and output relations are considered). This assumption may be considered unrealistic in the RDP context and the analysed period for two main reasons: first, because RDPs are expected to change the economic structure by reinforcing the rural sectors as noted in the evaluation of Castilla y Leon [54]; second, because the analysed period (2007–2013) was strongly affected by the economic crisis experimented across EU, producing notorious changes within regional economic structures. Thus, these assumptions heavily affect the validity of the conclusions reached. In addition, I/O-models have a limited capability to account for certain effects (e.g., leverage and deadweight effects) [23] and may lead to the overestimation of indirect effects.
It should also be noted that the evaluators of reviewed reports do not seem to consider I/O modelling as a counterfactual approach, as they never mention this term in the methodological explanation (see [53] (p. 78) and [52] (p. 34)). According to guidelines [10], these models demonstrate an “incapability” for implementing a counterfactual analysis. Thus, to define the shock introduced in the models, previous micro-econometric approaches are needed to conduct a counterfactual approach.
Besides the methodologies mentioned in the RDP guidelines, other approaches have been applied, as for example in the case of Portugal. The rationale of their approach was based upon specific characteristics of RDP investment measures (i.e., maximum and minimum thresholds of private investments). This means that this method cannot be extrapolated to assess other relevant RDP measures with different characteristics (i.e., AE or LFA payments), limiting the scope of the impact analysis. Moreover, it would be meaningless using this technique to address RDP impacts in MS or regions where budget devoted to the investment measures represents a little share of total budget (e.g., Ireland and Scotland).
From a comparative perspective, reviewed evaluation approaches differ not only in the applied counterfactual method, but in the input data used to estimate RDP impacts (e.g., scale of data, time periods, sample size). The results reported in the socioeconomic programme-related CEQs (Appendix A) show the different information provided by evaluation reports about the performance of individual RDPs. In our opinion, the heterogeneity of those results (i.e., different sectors, measures, units) together with the different methodological backgrounds to obtain them (i.e., assumptions, variables) reduces the validity of cross-comparisons amongst reports and/or the aggregation of obtained impacts. This fact may hamper the impact evaluation of the rural development policy at EU level, limiting the usefulness of these reports to inform EU policymaking.
Lastly, with respect to the availability of ex-post evaluation reports, the limited online access to the documents and the use of the native language in most of them affect to the knowledge transfer between evaluators among MS and hamper analyses such as presented in this paper.
The main limitations gathered from the reviewed evaluations and our own experience are presented in Table 4.
Table 4.
Issues and limitations with respect to RDP evaluation process.
5. Discussion and Suggestions
The ex-post assessment of the socioeconomic impacts of RDPs represents a considerable challenge for programme evaluators. The wide range of measures, together with the variety of beneficiary types and involved sectors, limit the development of a comprehensive and homogenous impact evaluation at programme level, as required by the definition of CMEF impact indicators. It should be stressed, nevertheless, that improvements have been made in the methodological approaches adopted to assess 2007–2013 ex-post impacts, compared with previous mid-term evaluation reports. For instance, Murcia and Malta employed advanced micro-econometric approaches instead of qualitative approaches exclusively (see [59,60]). The “recent” culture of evaluation of RDP impacts—previous programming periods were mainly focused on results and not on impacts [5]—require time to internalise certain procedures among agents involved, especially regarding required data. The programmes’ evaluation procedures are a constant improvement process and rely on the basis of experience.
Most of the policy issues interfering in the evaluation processes described in Section 4.4 are intrinsically linked to the programme’s implementation procedure. The complexity of evaluations derived from the flexibility given to MS to policy implementation is an added difficulty needed to attend the local specifications across EU rural territories. The pitfalls derived from the interrelations between institutions are natural and could be solved through increasing cooperation between them. Awareness of the importance of evaluation should be raised and incorporated at all stages of a programme’s implementation. These procedures represent a key instrument for improving accountability of public funding and to define improvement areas within programmes [61]. Providing good data contribute to this process.
Regarding the system of indicators, certain shortcomings of the CMEF 2007–2013 were noted by reviewed evaluations. For the programming period 2014–2020, a new indicator framework has been developed [62]. New economic impact indicators have been selected for the impact evaluation of the 2014–2020 RDPs, namely agricultural entrepreneurial income (I.01), agricultural factor income (I.02) and total factor productivity (I.03). However, it is too soon to derive conclusions about the suitability of these indicators to assess RDP impacts, as the first attempts to calculate them will be submitted on June 2019 [61].
Budgets allocated to the evaluation process over the 2007–2013 programming period appear to have been scarce in relation with the tasks. Andersson et al. [18] described budgeted amounts as “tiny and hardly sufficient for proper analyses”. The global economic crisis suffered by European regions may partially explain the allocation of resources to other priorities, rather than evaluation. For the 2014–2020 programming period, an increase of up to 2.0% in technical assistance is planned across EU programmes [63]. Regarding our analysis, most reviewed RDPs have programmed higher rates of this amount for the current period [63], so a reinforcement of evaluation activities can be expected. With respect to the CAP beyond 2020, funds devoted to RDPs are expected to decline by 15.3% [64]. The expenditure allocated to evaluation, consequently, may be affected and the quality of further evaluations may be threatened. This may be partially compensated through the cumulative knowledge gathered by evaluation teams over recent years.
Looking at data available for evaluations, it seems that FADN, despite the shortcomings outlined in the previous section, is the most suitable database to address counterfactual analysis in the RDP context. FADN represents a key database from the EU policy-making perspective due to its harmonisation across European regions and its coverage related to CMEF indicators, including those of the current 2014–2020 programming period. This fact encourages the comparability of estimated impacts between RDPs. Regarding the coverage of RDP measures, FADN covers mainly AE, LFA and farm investment measures. The scope of FADN, although limited, allows to capture a representative share of the aids allocated to the agricultural sector (approximately 86.5% of the budget targeted to farms at EU level [21]). Moreover, FADN ensures data quality and offers a solid base to address counterfactual approaches due to the experience gathered over years [10] (p. 3). However, it should be highlighted that FADN needs to be complemented with RDPs monitoring system data (e.g., number of RDP beneficiaries) to up-scale the estimated effects at national/regional level, so monitoring systems should ensure good data in this regard.
The selection of data is a critical part within the evaluation processes. From an economic perspective, the selection of FADN database may reduce the operational costs of evaluations. FADN is a statistical operation of national statistical offices based upon European regulations. The resources and efforts devoted to gather primary data via questionnaires in the qualitative approaches and I/O models may be reduced using this secondary data. Moreover, these resources may be reallocated to the methodological development phase to improve the robustness of the evaluation approaches applied. The availability of FADN microdata, nevertheless, may face data protection barriers [65]. With respect to this point, cooperation between national statistical offices and RDP involved agents should be strengthened to overcome those barriers, and make available the datasets needed for evaluation purposes without compromising data privacy. As Poppe et al. claim [66], microdata is a critical source in the field of policy evaluation, particularly in a context of budget constraints.
From the RDP evaluation perspective, it would be advisable to increase the representability of RDP beneficiaries within the FADN sample to favour the robustness of micro-level approaches employed. The increase of interviewed farms would be ideal to face this shortcoming, although we assume that this recommendation faces economic constraints [67]. In case this could not be afforded, FADN limitations according to limited samples (particularly at regional level) and RDP measures coverage should be acknowledged at the time of evaluation, and the requirements of impact evaluation standards would need to be adapted accordingly. From our point of view, it seems more suitable the calculation of impacts at measure level rather than at programme level due to the coverage of databases like FADN. This may allow comparability of impacts between specific rural policy instruments across EU to improve the outputs of evaluations. Andersson et al. [18] supported this point arguing the interrelated effects (economic, environmental and social) produced by each measure and outline the meaninglessness of impact aggregation at programme level.
FADN should be complemented with other databases to measure the impacts on other sectors rather than the agricultural sector. However, from our knowledge, there is no databases with similar characteristics to FADN with respect to other sectors. It is noteworthy that the efforts carried out by the evaluation team from Murcia in combining the assessment of impacts on agricultural and agro-industry sectors. FADN complementarity, nevertheless, should be assessed in terms of evaluation resources allocation taking into account the representability of measures that affect other sectors within the RDP budgets (e.g., measure related to investment on agroindustry represented 5.3% at EU level over the 2007–2013 programming period [21]).
From a methodological perspective, there is no “golden” counterfactual method to assess RDP impacts, as discussed in previous sections. Econometric approaches, including the recommended PSM-DiD, present limitations for assessing programme impacts given the coverage of databases. Other employed approaches such as interviews and the macro-level I/O models also present methodological constraints to assess ex-post RDP impacts. Despite this, from our point of view, the exclusive use of interviews should be dissuaded in favour of more statistically rigorous methods, to increase robustness in estimating the programme’s impacts. Qualitative approaches, nevertheless, should be conducted to complement quantitative methods to provide a wider overview of the estimated impacts and better understanding of programmes’ success.
According to the reviewed methodologies, micro-econometric approaches seem to be the most suitable methods to address counterfactual analysis according to CMEF demands and available databases. These approaches allow for the calculation of impacts at small scales (i.e., farms, enterprises) and scaled-up to national/regional level. As noted, the microdata to be used in these approaches should be accompanied by monitoring data recovered from the MA.
The application of micro-econometric methodologies, however, may face knowledge constraints within evaluation groups. The learning process of these methodologies is expensive in term of resources and is affected by the institutional capacities (i.e., expertise, priorities within evaluation activities, budgets). It is understandable that evaluation teams address RDP impact estimations with the previous knowledge they have—especially regarding the budget constraints previously noted—despite of apply the recommended approaches given by the RDP guidelines. However, efforts should be allocated to the development of advanced methodologies to increase the robustness in the estimation of programmes’ impacts.
From the evaluation perspective, a combination of advanced micro and macro level approaches would be ideal to obtain detailed insights about programmes’ performance. Moreover, it would allow the comparability and contrast of obtained results between different methodological backgrounds. However, limitations may increase according to resources allocation for evaluation and may not be affordable by evaluation teams.
With regard to the evaluation of the rural development policy, the complexity of assessing impacts at the EU level is evident, at least through the information provided by RDP ex-post evaluations. We emphasize that the different methods and data sources employed make meaningless the aggregation of socioeconomic impacts. If a comprehensive EU level impact evaluation of this policy is desirable, RDP evaluation standards need to be improved. In particular, it would be necessary to increase expert consensus around a common methodological approach (including databases) to address the ex-post evaluation of RDP impacts under the CMEF requirements. Aditionally, the overlap between programming periods—i.e., new RDPs are implemented before RDPs are evaluated—hamper timely exploitation of the insights derived from the undertaken ex-post evaluations. This fact may explain why these evaluations seem to scarcely contribute to the EU rural development policy-making [18].
In addition to this, a recommendation is given with respect to the publication of ex-post national/regional evaluation reports. We suggest its issue timely and jointly online in the EC or ENRD webpage, ideally in English, for contributing to increase knowledge sharing across MS and transparency around the ex-post evaluation processes of these programmes.
6. Conclusions
This paper explores the use of counterfactual analysis to estimate RDP socioeconomic impacts in seven 2007–2013 RDP ex-post evaluations. The reviewed reports show that a wide range of methodological approaches (e.g., interviews, econometrics approaches, I/O models) have been employed to quantify RDP socioeconomic impacts on economic growth, employment creation and labour productivity through counterfactual analysis.
The analysis carried out, focused on assessing the methodologies and databases employed to address the estimation of programme socioeconomic impacts, provides two main findings. The first finding is that there is no suitable counterfactual method to assess ex-post socioeconomic impacts according to evaluation standard’s requirements, not even the recommended PSM-DiD. Data availability and certain methodological assumptions arise as limiting factors. Also, certain constraints regarding the evaluation resources (e.g., expertise, time, budget) may limit the applicability of rigorous approaches. However, after reviewing all the involved factors affecting the evaluation processes, micro-econometric approaches using FADN database seem to stand out as the most suitable methodologies to address RDP impact estimation via counterfactual analysis. Nevertheless, limitations arising from the use of this approach, especially with respect to data constraints (i.e., partial RDP and sectoral coverage, small samples), should be taken into account. In addition, it is recommended to complement the quantitative evaluation with qualitative approaches to better understand the impacts of the programmes. The second finding is that information provided by individual RDP ex-post evaluations seems limited to assess the impacts of EU rural development policy as a whole. The variety of undertaken methodological approaches, together with differences in the input data employed, hamper the comparison of impacts of individual RDPs, as well as their aggregation. These difficulties may condition the provision of solid conclusions for policy makers on the implementation of the rural development policy at EU level. Moreover, the overlap between programming periods hamper to obtain useful insights from the RDP ex-post evaluations for policy-making in a timely manner.
In the end, a set of suggestions are pointed out. Mainly, we recommend the use of advanced counterfactual approaches to provide statistical evidence of programme impacts as well as the adaptation of RDP evaluation standards to facilitate the assessment of the rural development policy at EU level.
Author Contributions
J.C. and M.B. conceived and designed the research; J.C. performed the review of the evaluations; J.C. and P.M. analysed the processed information; J.C. wrote the paper; M.B. supervised the work; M.B. and P.M. reviewed the final manuscript.
Funding
The work described in this paper has been conducted within the project SYNERCAP (2013–2016 R&D National Plan, ECO2015-64438-R, funded by MINECO/ERDF).
Conflicts of Interest
The authors declare no conflict of interest.
Appendix A
Table A1.
Summary of main reported socioeconomic impacts across RDP ex-post evaluation reports.
Table A1.
Summary of main reported socioeconomic impacts across RDP ex-post evaluation reports.
| CEQ1—To What Extent Has the RDP Contributed to the Growth of the Whole Rural Economy? | CEQ2—To What Extent Has the RDP Contributed to Employment Creation? | |||||
|---|---|---|---|---|---|---|
| Disaggregation of impacts | I1-Economic growth (Gross Value Added) | I3-Labour productivity (€/Full-Time Equivalent (FTE) job) | Disaggregation of impacts | I2-Employment creation (FTE jobs) | ||
| Values and units | Values and units | |||||
| Mainland—Portugal | - | 1,536.0 M€ | 3% | Measure 311 | 4,482 FTE jobs | |
| Measure 312 | 2,417 FTE jobs | |||||
| Total | 7,000 FTE jobs | |||||
| Tourism | 25.0% | |||||
| Restoration sector | 13.7% | |||||
| Retail trade | 10.0% | |||||
| Leisure activities | 5.0% | |||||
| Castilla y Leon—Spain | - | 1,045.1 M PPS | 421.5 PPS/FTE | - | 24.571 FTE jobs | |
| Malta | - | 8.9 M PPS | 1,853.0 €/FTE | - | 3.6 FTE jobs | |
| (enterprise average) | ||||||
| Romania | Axis 1 | No quantified | No quantified | Measure 313 | Youth | 20% |
| Axis 3 | 151.0 M€ | Females | 61% | |||
| LEADER axis | 237,000.0 lei | Measure 312 | Youth | 890 FTE jobs | ||
| Females | 2,034 FTE jobs | |||||
| Scotland | - | 2,800.0 M£ | 37,000.0 £/FTE | - | 26,000 FTE jobs | |
| Ireland | Wide economy | 2,337.0 M€ | No quantified | Wide economy | 6,466 FTE annual jobs | |
| Agricultural sector | 163.5 M€ | Agricultural sector | 643 FTE annual jobs | |||
| Murcia—Spain | Agricultural sector | 11.8 M€ | 290.0 €/FTE | Agriculture | 60 FTE jobs | |
| Agroindustry sector | 1.7 M€ | 396.2 €/FTE | Agroindustry | 98.7 FTE jobs | ||
Source: Own elaboration.
References
- European Commission. Evaluating EU Expenditure Programmes: A Guide. Ex Post and Intermediate Evaluation, 1st ed.; Office for Official Publications of the European Communities: Luxembourg, 1997; ISBN 92-827-9436-9. Available online: https://publications.europa.eu/en/publication-detail/-/publication/742ed190-3961-45cd-ad34-e4d4b73bd3e7/language-en (accessed on 26 November 2018).
- European Commission. Evaluating EU Activities: A Practical Guide for the Commission Services; Office for Official Publications of the European Communities: Luxembourg, 2004; ISBN 92-894-7928-0. Available online: http://ec.europa.eu/smart-regulation/evaluation/docs/eval_activities_en.pdf (accessed on 4 December 2018).
- European Commission. Strengthening the Foundations of Smart Regulation—Improving Evaluation; Communication from the Commission to the European Parliament, the Council, the European Economic and Social Committee and the Committee of the Regions [COM(2013) 686 final]; European Commission: Brussels, Belgium, 2 October 2013; Available online: http://ec.europa.eu/smart-regulation/docs/com_2013_686_en.pdf (accessed on 6 December 2018).
- European Commission. Better Regulation Guidelines; Commission Staff Working Document [SWD(2017) 350]; European Commission: Brussels, Belgium, 7 July 2017; Available online: https://ec.europa.eu/info/sites/info/files/better-regulation-guidelines.pdf (accessed on 29 November 2018).
- Papadopoulou, E.; Papalexiou, C.; Hasanagas, N. Participatory evaluation of rural development programmes: A qualitative approach in the case of modernisation of agricultural holdings in Greece. Reg. Sci. Inq. J. 2012, 4, 81–94. [Google Scholar]
- European Commission. Guidelines for the Mid-term Evaluation of Rural Development Programmes 2000–2006 Supported from the European Agricultural Guidance and Guarantee Fund; DOC, STAR VI/43517/02; Commission of the European Communities: Brussels, Belgium, 2002; Available online: https://ec.europa.eu/agriculture/sites/agriculture/files/rural-development-previous/2000-2006/docs/eval2_en.pdf (accessed on 28 November 2018).
- European Commission. Rural Development 2007–2013—Handbook on Common Monitoring and Evaluation Framework. Guidance Document; Directorate General for Agriculture and Rural Development: Brussels, Belgium, 2006; Available online: https://ec.europa.eu/agriculture/sites/agriculture/files/rural-development-previous/2007-2013/docs/document_en.pdf (accessed on 06 November 2018).
- European Evaluation Network for Rural Development. Guidelines on the Mid-term Evaluation of the Rural Development Programmes; European Commission—Agriculture and Rural Development: Brussels, Belgium, 2009; Available online: http://enrd.ec.europa.eu/enrd-static/fms/pdf/6A65BD6F-CB22-6660-7E91-321F04E742E2.pdf (accessed on 23 November 2018).
- European Evaluation Network for Rural Development. Capturing the Success of Your RDP: Guidelines for the ex Post Evaluation of 2007–2013 RDPs; European Commission: Brussels, Belgium, 2014; Available online: http://ec.europa.eu/agriculture/evaluation/guidelines/2007-2013-ex-post_en.pdf (accessed on 12 November 2018).
- European Commission. Assessing RDP Achievements and Impacts in 2019. Part IV—Technical Annex; Directorate-General for Agriculture and Rural Development—Unit C.4; European Commission: Brussels, Belgium, 2018; Available online: https://enrd.ec.europa.eu/evaluation/publications/assessing-rdp-achievements-and-impacts-2019_en (accessed on 7 December 2018).
- Michalek, J. Counterfactual Impact Evaluation of EU Rural Development Programmes—Propensity Score Matching Methodology Applied to Selected EU Member States. Volume 1: A Micro-level Approach; Publications Office of the European Union: Luxembourg, 2012. [Google Scholar]
- Leeuw, F.L.; Vaessen, J. Impact Evaluations and Development: NONIE Guidance on Impact Evaluation; Network of Networks on Impact Evaluation: Washington, DC, USA, 2009; ISBN 1-60244-120-0. Available online: http://documents.worldbank.org/curated/en/411821468313779505/pdf/574900WP0Box351BLIC10nonie1guidance.pdf (accessed on 22 November 2018).
- Loi, M.; Rodrigues, M. A Note on the Impact Evaluation of Public Policies: The Counterfactual Analysis; Publications Office of the European Union: Luxembourg, 2012; Available online: http://publications.jrc.ec.europa.eu/repository/bitstream/JRC74778/lbna25519enn.pdf (accessed on 18 November 2018). [CrossRef]
- Kantor. Ex-post Evaluation of Rural Development Programmes 2000–2006; Kantor Management Consultants and Institute for Rural Development Research (IfLS): Athens, Greece, 2012; Available online: https://ec.europa.eu/agriculture/sites/agriculture/files/evaluation/rural-development-reports/2012/ex-post-evaluation-rdp-2000-2006/fulltext_en.pdf (accessed on 9 october 2018).
- European Evaluation Network for Rural Development. Methodological Assessment of Mid-term Evaluation Reports of 2007–2013 Rural Development Programmes; European Commission: Brussels, Belgium, March 2012; Available online: https://ec.europa.eu/agriculture/sites/agriculture/files/evaluation/guidelines/2007-2013-ex-post_en.pdf (accessed on 28 October 2018).
- Vidueira, P.; Rivera, M.; Mesa, B.; Díaz-Puente, J.M. Mid-Term Impact Estimation on Evaluations of Rural Development Programs. Procedia-Soc. Behav. Sci. 2015, 191, 1596–1600. [Google Scholar] [CrossRef]
- European Court of Auditors. Can the Commission and the Member States Show that EU Budget Allocated to the Rural Development Policy Is Well Spent? Publications Office of the European Union: Luxembourg, 2013. Available online: https://publications.europa.eu/en/publication-detail/-/publication/5f439781-0432-4473-8e91-c1697bd475f7/language-en (accessed on 28 October 2018). [CrossRef]
- Andersson, A.; Höjgård, S.; Rabinowicz, E. Evaluation of results and adaptation of EU Rural Development Programmes. Land Use Policy 2017, 67, 298–314. [Google Scholar] [CrossRef]
- European Economic and Social Committee. Ex Post Evaluation of Rural Development Programmes 2007–2013; European Economic and Social Committee: Brussels, Belgium, 2017; Available online: http://webapi.eesc.europa.eu/documentsanonymous/EESC-2017-00690-00-00-RI-TRA-en.docx (accessed on 10 November 2018).
- European Commission. Rural Development in the European Union—Statistical and Economic Information—Report 2008; European Union, Directorate-General for Agriculture and Rural Development: Brussels, Belgium, 2008; Available online: https://ec.europa.eu/agriculture/sites/agriculture/files/statistics/rural-development/2008/rd_report_2008.pdf (accessed on 10 October 2018).
- European Network for Rural Development. RDP Public Expenditures. Available online: https://enrd.ec.europa.eu/policy-in-action/rural-development-policy-in-figures/rdp-monitoring-indicator-tables/financial-and-physical-indicators_en (accessed on 18 January 2019).
- Terluin, I.J.; Roza, P. Evaluation Methods for Rural Policy; LEI—Wageningen UR: Wageningen, The Netherlands, 2010; ISBN 978-90-8615-423-4. Available online: http://edepot.wur.nl/138098 (accessed on 24 October 2018).
- European Evaluation Network for Rural Development. Working Paper on Approaches for Assessing the Impacts of the Rural Development Programmes in the Context of Multiple Intervening Factors; Agriculture and Rural Development, European Commission: Brussels, Belgium, 2010; Available online: https://www.reterurale.it/downloads/documenti/monitoraggio/WP-Impacts_final_friendly.pdf (accessed on 27 October 2018).
- Khandker, S.R.; Koolwal, G.B.; Samad, H.A. Handbook on Impact Evaluation: Quantitative Methods and Practices; World Bank Publications: Washington, DC, USA, 2009. [Google Scholar] [CrossRef]
- European Commission. Design and Commissioning of Counterfactual Impact Evaluations. A Practical Guidance for ESF Managing Authorities; Publications Office of the European Union: Luxembourg, 2013. [Google Scholar] [CrossRef]
- Gertler, P.J.; Martinez, S.; Premand, P.; Rawlings, L.B.; Vermeersch, C.M. Impact Evaluation in Practice, 2nd ed.; World Bank Publications: Washington, DC, USA, 2016. [Google Scholar] [CrossRef]
- Morton, M. Applicability of impact evaluation to cohesion policy. In An Agenda for a Reformed Cohesion Policy. A Place-based Approach to Meeting European Union Challenges and Expectations; Economics and Econometrics Research Institute (EERI): Brussels, Belgium, 2009; Available online: https://ec.europa.eu/regional_policy/archive/policy/future/pdf/4_morton_final-formatted.pdf (accessed on 04 December 2018).
- Colen, L.; Gomez y Paloma, S.; Latacz-Lohmann, U.; Lefebvre, M.; Préget, R.; Thoyer, S. Economic experiments as a tool for agricultural policy evaluation: Insights from the European CAP. Can. J. Agric. Econ. 2016, 64, 667–694. [Google Scholar] [CrossRef]
- Jacob, R.; Zhu, P.; Somers, M.A.; Bloom, H. A Practical Guide to Regression Discontinuity; MDRC: New York, NY, USA, 2012; Available online: https://www.mdrc.org/sites/default/files/RDD%20Guide_Full%20rev%202016_0.pdf (accessed on 18 November 2018).
- Imbens, G.W.; Lemieux, T. Regression discontinuity designs: A guide to practice. J. Econom. 2008, 142, 615–635. [Google Scholar] [CrossRef]
- Pellegrini, G.; Terribile, F.; Tarola, O.; Muccigrosso, T.; Busillo, F. Measuring the effects of European Regional Policy on economic growth: A regression discontinuity approach. Reg. Sci. 2013, 92, 217–233. [Google Scholar] [CrossRef]
- Giua, M. Spatial discontinuity for the impact assessment of the EU regional policy: The case of Italian objective 1 regions. J. Reg. Sci. 2017, 57, 109–131. [Google Scholar] [CrossRef]
- Heinrich, C.; Maffioli, A.; Vazquez, G. A Primer for Applying Propensity-Score Matching; Inter-American Development Bank: Washington, DC, USA, 2010; Available online: https://pdfs.semanticscholar.org/c1af/121ce5a7d52075722b87a5f012da83dc5502.pdf (accessed on 20 November 2018).
- Kirchweger, S.; Kantelhardt, J. The dynamic effects of government-supported farm-investment activities on structural change in Austrian agriculture. Land Use Policy 2015, 48, 73–93. [Google Scholar] [CrossRef]
- Michalek, J. Counterfactual Impact Evaluation of EU Rural Development Programmes—Propensity Score Matching Methodology Applied to Selected EU Member States. Volume 2: A Regional Approach; Publications Office of the European Union: Luxembourg, 2012. [Google Scholar] [CrossRef]
- Pufahl, A.; Weiss, C.R. Evaluating the effects of farm programmes: results from propensity score matching. Eur. Rev. Agric. Econ. 2009, 36, 79–101. [Google Scholar] [CrossRef]
- Udagawa, C.; Hodge, I.; Reader, M. Farm level costs of Agri-environment measures: The impact of entry level stewardship on cereal farm incomes. J. Agric. Econ. 2014, 65, 212–233. [Google Scholar] [CrossRef]
- Arata, L.; Sckokai, P. The impact of agri-environmental schemes on farm performance in five EU member states: A DID-matching approach. Land Econ. 2016, 92, 167–186. [Google Scholar] [CrossRef]
- D’Alberto, R.; Zavalloni, M.; Raggi, M.; Viaggi, D. AES Impact Evaluation with Integrated Farm Data: Combining Statistical Matching and Propensity Score Matching. Sustainability 2018, 10, 4320. [Google Scholar] [CrossRef]
- Medonos, T.; Ratinger, T.; Hruska, M.; Spicka, J. The assessment of the effects of investment support measures of the Rural Development Programmes: The case of the Czech Republic. Agris on-line Pap. Econ. Inform. 2012, 4, 35. [Google Scholar]
- Hazners, J.; Benga, E.; Veveris, A. Evaluation of Latvian Rural Development Programme Measures with Propensity Score Matching. In Recent Advances in Environmental Sciences and Financial Development, Proceedings of the 2nd International Conference on Environment, Energy, Ecosystems and Development (EEEAD 2014), Athens, Greece, 28–30 November 2014; Europment: Sofia, Bulgaria, 2014; ISBN 978-1-61804-255-2. Available online: http://www.inase.org/library/2014/athens/ENVEC.pdf#page=57 (accessed on 19 February 2019).
- Michalek, J.; Ciaian, P.; Kancs, D.A. Investment crowding out: Firm-level evidence from northern Germany. Reg. Stud. 2016, 50, 1579–1594. [Google Scholar] [CrossRef]
- Cagliero, R.; Cisilino, F.; Scardera, A. Evaluating Rural Development Programmes Using FADN Data. Rete Rurale Nazionale 2007–2013; Ministero delle Politiche Agricole Alimentari e Forestali: Roma, Italy, September 2011; Available online: https://www.researchgate.net/profile/Federica_Cisilino/publication/263620520_Evaluating_Rural_Development_Programmes_Using_FADN_Data/links/0c96053b6590e7df07000000/Evaluating-Rural-Development-Programmes-Using-FADN-Data.pdf (accessed on 25 November 2018).
- Kuhfuss, L.; Subervie, J. Do European Agri-environment Measures Help Reduce Herbicide Use? Evidence from Viticulture in France. Ecol. Econ. 2018, 149, 202–211. [Google Scholar] [CrossRef]
- Britz, W.; Witzke, H. CAPRI Model Documentation 2014. Available online: http://www.capri-model.org/docs/capri_documentation.pdf (accessed on 16 October 2018).
- Schroeder, L.A.; Gocht, A.; Britz, W. The impact of pillar II funding: Validation from a modelling and evaluation perspective. J. Agric. Econ. 2015, 66, 415–441. [Google Scholar] [CrossRef]
- Monsalve, F.; Zafrilla, J.E.; Cadarso, M.Á. Where have all the funds gone? Multiregional input-output analysis of the European Agricultural Fund for Rural Development. Ecol. Econ. 2016, 129, 62–71. [Google Scholar] [CrossRef]
- EKOS. Ex-Post Evaluation of the Scotland Rural Development Programme 2007–2013; Scottish Government: Edinburgh, UK, January 2017. Available online: https://www.gov.scot/binaries/content/documents/govscot/publications/report/2017/01/ex-post-evaluation-scotland-rural-development-programme-2007-2013/documents/00515117-pdf/00515117-pdf/govscot%3Adocument (accessed on 22 November 2018).
- Laporta, L.; Martins, H.; da Silva Vieira, R.; Alves, M.; Santos, J.; Teixeira, R.; Morais, T.; Ferreira, G.; Godinho, R. Relatório Final da Avaliação Ex-post do Programa de Desenvolvimento Rural do Mainlande 2007–2013 (ProDeR); Domingos, T., Oliveira das Neves, A., Marta-Pedroso, C., Eds.; Estudo encomendado pela Autoridade de Gestão do ProDeR; Instituto Superior Técnico, Instituto de Estudos Sociais e Económicos e Instituto Politécnico de Bragança: Bragança, Portugal, 2016. [Google Scholar]
- Red2Red Consultores. Informe de Evaluación Expost Programa de Desarrollo Rural de la Región de Murcia 2007–2013; Red2Red Consultores S.L.: Madrid, Spain, December 2016; Available online: https://pdr.carm.es/documents/6218363/10665425/Informe_EvaluacionExpostPDR-RM2007-2013.pdf/39b2bda7-28c5-412d-a998-dda96d7d5816 (accessed on 27 November 2018).
- ACZ Consulting and T33. Ex-Post Evaluation Study of the National Rural Development Programme 2007–2013; ACZ Consulting SRL: Craiova, Romania, April 2017; Available online: http://www.madr.ro/docs/dezvoltare-rurala/studii/Ex-post-evaluation-of-NRDP-2007-2013-EN.pdf (accessed on 11 November 2018).
- KPMG. Ex Post Evaluation of the Rural Development Programme of Malta (2007–2013); KPMG Advisory Ltd.: Budapest, Hungary, April 2017. Available online: https://eufunds.gov.mt/en/EU%20Funds%20Programmes/European%20Agricultural%20Fund/Documents/MC/Malta_RDP_19_4_17_ex_post_evaluation.pdf (accessed on 12 November 2018).
- Indecon. Ex-Post Evaluation of the Rural Development Programme Ireland (2007–2013); Indecon International Economic Consultants in association with the Countryside and Community Research Institute (University of Gloucestershire): Dublin, Ireland, January 2017. Available online: https://www.agriculture.gov.ie/media/migration/ruralenvironment/ruraldevelopment/strategiesandprogrammes/ExPostEvaluationRDPIreland20072013%20160617.pdf (accessed on 13 November 2018).
- Fundación General de la Universidad de Valladolid (FGUVA). Informe de Evaluación ex-post del Programa de Desarrollo Rural de Castilla y León 2007–2013—Tomo I; FGUVA: Valladolid, Spain, December 2016; Available online: https://www.mapa.gob.es/en/desarrollo-rural/temas/programas-ue/tomo1_informe_definitivo_cl_tcm38-380374.pdf (accessed on 29 October 2018).
- Grealis, E.; O’Donoghue, C. The Bio-Economy Input Output Model: Development and Uses; Teagasc Rural Economy Research Centre: Galway, Ireland, September 2015; Available online: https://www.teagasc.ie/media/website/publications/2014/Economic_Impact_of_the_Irish_Bioeconomy.pdf (accessed on 13 October 2018).
- European Commission. CAP Implementation: Flexibility Given to Member States—State of Play and Perspectives; Publications Office of the European Union: Luxembourg, 2017; Available online: http://www.europarl.europa.eu/RegData/etudes/STUD/2017/601975/IPOL_STU(2017)601975_EN.pdf (accessed on 19 January 2019). [CrossRef]
- European Commission. Rural Development in the European Union. Statistical and Economic Information. Report 2013; Directorate-General for Agriculture and Rural Development: Brussels, Belgium, December 2013; Available online: https://ec.europa.eu/agriculture/sites/agriculture/files/statistics/rural-development/2013/full-text_en.pdf (accessed on 20 January 2019).
- López, L.A.; Monsalve, F.; Zafrilla, J.E. Análisis Input-Output de la eficacia de la Política Europea de Desarrollo Rural 2007–2013: Propuesta metodológica y resultados para Castilla-La Mancha. Estudios de economía aplicada 2011, 29, 8–23. [Google Scholar]
- Red2Red Consultores. Evaluación Intermedia Programa de Desarrollo Rural FEADER de la región de Murcia 2007–2013; Red2Red Consultores S.L.: Madrid, Spain, December 2010; Available online: https://ec.europa.eu/agriculture/sites/agriculture/files/rural-development-previous/2007-2013/docs/countries/mte-rep-es-murcia_es_.pdf (accessed on 21 January 2019).
- Adi Associates Environmental Consultants Ltd. Rural Development Programme for Malta 2007–2013. Mid-term Evaluation Report; Adi Associates Environmental Consultants Ltd.: San Gwann, Malta, November 2010; Available online: https://ec.europa.eu/agriculture/sites/agriculture/files/rural-development-previous/2007-2013/docs/countries/mte-rep-mt_en.pdf (accessed on 20 January 2019).
- European Commission. The Monitoring and Evaluation Framework for the Common Agricultural Policy 2014–2020; Publications Office of the European Union: Luxembourg, 2015; ISBN 978-92-79-43025-1. Available online: https://www.agriculture.gov.ie/media/migration/ruralenvironment/ruraldevelopment/ruraldevelopmentprogramme2014-2020/CAPMonEvalInformBooklet030615.pdf (accessed on 21 January 2019).
- European Commission. Technical Handbook on the Monitoring and Evaluation Framework of the Common Agricultural Policy 2014–2020; Directorate-General for Agriculture and Rural Development: Brussels, Belgium, October 2015; Available online: http://ec.europa.eu/transparency/regexpert/index.cfm?do=groupDetail.groupDetailDoc&id=21095&no=3 (accessed on 19 January 2019).
- European Commission. Rural Development 2014–2020—Country Files. Various Fiches (Online). Available online: https://ec.europa.eu/agriculture/rural-development-2014-2020/country-files_en (accessed on 21 January 2019).
- Matthews, A. Member State CAP Allocations and Progress on the MFF (Online). 16 October 2018. Available online: http://capreform.eu/member-state-cap-allocations-and-progress-on-the-mff/ (accessed on 21 January 2019).
- European Commission. How to Apply for Microdata? European Commission: Luxembourg, September 2018; Available online: https://ec.europa.eu/eurostat/documents/203647/771732/How_to_apply_for_microdata_access.pdf (accessed on 20 January 2019).
- Poppe, K.; Vrolijk, H. Microdata: A critical source for policy evaluation. EuroChoices 2018, 17, 28–35. Available online: https://onlinelibrary.wiley.com/doi/epdf/10.1111/1746-692X.12169 (accessed on 20 January 2019). [CrossRef]
- European Commission. Cost of and Good Practices for FADN Data Collection. Final Report; Publications Office of the European Union: Luxembourg, 2015; Available online: https://ec.europa.eu/agriculture/sites/agriculture/files/external-studies/2015/cost-good-practices-fadn/final-report_en.pdf (accessed on 21 January 2019). [CrossRef]
© 2019 by the authors. Licensee MDPI, Basel, Switzerland. This article is an open access article distributed under the terms and conditions of the Creative Commons Attribution (CC BY) license (http://creativecommons.org/licenses/by/4.0/).