Profit Distribution Model for Construction Supply Chain with Cap-and-Trade Policy


College of Architecture and Urban-Rural Planning, Sichuan Agricultural University, Chengdu 611830, China
*
Author to whom correspondence should be addressed.
†
These authors contributed equally to this work.
Sustainability 2019, 11(4), 1215; https://doi.org/10.3390/su11041215
Submission received: 23 January 2019
/
Revised: 18 February 2019
/
Accepted: 19 February 2019
/
Published: 25 February 2019
(This article belongs to the Special Issue How Better Decision-Making Helps to Improve Sustainability - Part II)
Abstract
:Cap-and-trade has become one of the most widely used carbon emission limitation methods in the world. Its constraints have a great impact on the carbon emission reduction decisions and production operations of supply chain enterprises, as well as profit distribution. In the construction supply chain, there are few studies on the profit distribution and emission reduction decisions considering cap-and-trade policy. This paper investigates the profit distribution model of a two-echelon construction supply chain consisting of a general contractor and a subcontractor with cap-and-trade policy. Using game theory and Shapley value method, the optimal emission reduction decisions and profit distribution under three cooperation modes of pure competition, co-opetition, and pure cooperation are obtained, respectively. The research shows that the profits of the construction supply chain are increasing in pure competition, co-opetition, and pure cooperation scenarios, and the emission reduction amount of the construction supply chain in the case of pure cooperation is greater than that of pure competition and co-opetition. The carbon emission reduction amount under the co-opetition scenario is not always greater than that under the pure competition scenario, which depends on the emission reduction cost coefficient relationship of general contractor and subcontractor. When the cost coefficient of emission reduction of the general contractor is less than that of the subcontractor, the emission reduction amount under pure competition is larger than that under co-opetition. A numerical study is carried out to verify the conclusions and illustrated the profits of the supply chain decreased with the increase of carbon emission reduction cost coefficient, and had nothing to do with the emission reduction efficiency of enterprises.
1. Introduction
With the rapid development of the global economy, the greenhouse effect is increasingly serious and it brings about global warming, extreme weather, rising sea level, and so on [1,2]. The emission of excessive greenhouse gases (GHG), especially carbon dioxide, is one of the main causes of global warming. Under the background of international climate politics, promoting the development of energy conservation and emission reduction and sticking to low-carbon development are important policies for all countries hoping to carry out sustainable development strategies. According to the United Nations Intergovernmental Panel on Climate Change (IPCC), the construction industry has consumed 40% of the world’s energy and released 36% of the CO2, which has become one of the three largest greenhouse gas emission sources in the world [3]. Since the construction industry plays such a major role in global environment degradation, controlling and reducing GHG emissions has become one of its major tasks [4]. Apart from the development of GHG emission reduction technologies and new energy technologies, more and more researchers follow with interest the optimization of the supply chain operation strategies to reduce GHG emissions [2].
Cap-and-trade policy is one of the four major emission reduction methods proposed in the Kyoto Protocol, which can achieve the goals of energy conservation and emission reduction through government control and market regulation. The cap-and-trade method is one of the most prevalent emission regulation mechanisms worldwide [5]. Carrying out cap-and-trade policy, from a standpoint of the environment, it can improve air quality and mitigate climate change, and from the perspective of the economy, it can reduce the costs of emission reduction and promote low-carbon transition. With the implementation of the policy, construction enterprises also face challenges in terms of decision-making (increasing profits and reducing carbon emission), decision variables (such as emission reduction efforts, carbon trading price and so on), and decision environment (the limitation of capacity, money, and carbon caps) that are becoming increasingly complex. Cap-and-trade policy can achieve stated environmental outcomes, but sometimes it will lead to profit degradation of some enterprises in the construction supply chain and serious profit differentiation of enterprises with a large gap in green technology. These problems will destroy the stability of the cooperation of the construction supply chain enterprises and reduce the enthusiasm for production of construction enterprises. This paper addresses questions about how to make emission reduction decisions and how to make reasonable profit distribution among construction supply chain enterprises under a cap-and-trade policy, so that we can understand how a cap-and-trade policy can influence the decision-making strategies and profit distribution proportions among construction supply chain enterprises.
A profit distribution mechanism is an important guarantee mechanism to maintain supply chain cooperation and a key factor to ensure an enterprise’s enthusiasm for production. Many researchers have conducted in-depth research on profit distribution of the supply chain in many industries, such as smart phone supply chain [6], industrial supply chain [7], charcoal commodity supply chain [8], etc. Under different supply chain research backgrounds, researchers consider different distribution elements, such as ability, contribution, investment, risk sharing, and so on [9,10], and they will adopt different profit distribution mechanisms, for instance, modified Shapley method, the TOPSIS method, game theory, and contract theory [11,12,13]. These studies are profound and enlightening. However, there are few systematic studies on the impact of cooperation modes on a supply chain’s decision-making, especially in the field of construction supply chain under the constraints of cap-and-trade policy. In different cooperation modes, different members have different decision-making positions, divergent objectives, and fragmented approaches, which will affect the final decisions of the supply chain. Therefore, to provide a theoretical basis for the management of a construction supply chain, it is necessary to discuss the differences of the supply chain in different cooperation modes.
The objectives of this paper are to solve the optimal emission reduction decisions and profit distribution of enterprises in the supply chain under the constraints of cap-and-trade policy in different cooperation modes. Therefore, in this paper, we set up profit distribution models under the constraints of cap-and-trade policy in three scenarios—pure competition, co-opetition, and pure cooperation. In this way, it cannot only achieve the profit goals of enterprises, but also achieve the goal of reducing emissions by the government. At the same time, we systematically compare the difference of the optimal decisions and the optimal profits of enterprises under different cooperation scenarios, which provides a theoretical basis for the decision-making of enterprises and governments.
The contributions of this paper are mainly embodied in three aspects:
- (1)
- A complete profit distribution model of construction supply chain in pure competition, co-opetition, and pure cooperation under cap-and-trade is constructed, and the optimal emission reduction decisions and profit distribution of construction enterprises are obtained.
- (2)
- Systematic comparison of the differences of emission reduction amount and profits of enterprises under three different cooperation modes, probing the reasons for the differences.
- (3)
- The impacts of emission reduction cost coefficient, emission reduction efficiency coefficient, and cap-and-trade policy’s constraints on the profits of construction supply chain.
The rest of this paper is presented as follows. In Section 2, a literature review is provided as our theoretical foundation. Section 3 describes the problems and establishes the basic models. Section 4 presents the analytical results in three different scenarios. Section 5 describes the comparison analysis. A numerical study is carried out to verify the conclusions in Section 6. Section 7 is the conclusion and future research prospect.
2. Literature Review
In this section, three main types of literature related to this paper are reviewed. First, we illustrated the related literature on the supply chain’s operation decisions under cap-and-trade policy. Secondly, the literature of the construction supply chain’s operation decisions is analyzed. Finally, we reviewed the related literature about profit distribution strategies in the supply chain.
2.1. Supply Chain Operation Decisions under Cap-and-Trade Policy
It is widely believed that the emission trading system is a necessary policy pillar of climate change mitigation [14], and there is much research on the combination of supply chain and cap-and-trade policy.
Some researchers focused on how to formulate or adjust cap-and-trade policy including determining the allocation of permits and trading price. Kollenberg and Taschini proposed a method which changes the allocation of permits based on the current bank of permits which figured out firms’ emissions control problem [15]. Jiang et al. found that generally the social optimum will not be touched in the cap-and-trade system, if the emission allocation of enterprises is lower than the optimal level. Finally, they proposed a hybrid quantity-price policy to help firms control quantity effectively [16]. Cao found the increasing of carbon trading price will lead to the increasing of carbon emission reduction. Moreover, the carbon trading prices do not always have a negative impact on manufacturers’ profits [17]. Xu et al. combined the equilibrium tactic with a cap-and-trade system, and proposed a bi-level multi-objective carbon emission model which could depict interrelationships of multiple stakeholders and resolve their conflicts [18].
Some other researchers pay close attention to the design or use of supply chain coordination contracts under cap-and-trade policy. Xu et al. found that the supply chain can be coordinated by wholesale price and cost sharing contracts. They made a conclusion that when the transaction price rises, the optimal output first decreases (increases) and then remains constant [19]. Xu et al. proposed a decision model of centralized and decentralized supply chain, and modified a revenue-sharing contract to coordinate the manufacturer and retailer [20]. Wang and Liu considered the contract design, under the carbon trading system, to realize supply chain coordination. They found upstream firms’ carbon reduction investment increases and the whole supply chain realizes Pareto improvement with the induction of the investment cost sharing contract [21].
There are a great many literatures concerned about the optimal production decisions and emission reduction decisions of enterprises under cap-and-trade policy [2,5,6]. Wang et al. developed a mathematical model to test the impact of cap-and-trade system on enterprise’s production planning and emission reduction strategy. The result shows that when the cost of low-carbon processing is greater than the potential opportunity income, enterprises tend to buy carbon subsidies from the carbon trading market, and vice versa [22]. Du et al. took a license supplier and a company as a model, and theoretically analyzed their optimal decisions in a cap-and-trade mechanism. In addition, they found it is possible to achieve the coordination of the supply chain [23]. Sun et al used Stackelberg model to study the forest scale and carbon emission reduction decisions of the supply chain under cap–and-trade policy [24]. Yoo and Cheong studied incentive mechanisms for quality improvement in a buyer-driven supply chain and developed two reward strategies, they showed that the reward with a target better enhances the overall profits performance [25].
Most of the above literatures considered the effect of cap-and-trade policy on supply chain operation decisions and focused more on the field of manufacturing enterprises. Few documents take the cap-and-trade policy into consideration in the construction supply chain.
2.2. Profit Distribution of Supply Chain
Profit distribution is a very important part of supply chain management. Some typical literature related to the profit distribution of supply chain is reviewed in this part.
Some scholars have studied how to allocate profits among different contracts in supply chain to achieve supply chain coordination. Song proposed a green supply chain model to run a study on revenue-sharing contracts comparing the common centralized control game model and the decentralized decision game model. Furthermore, they found the retailer-led revenue-sharing contract leads to higher greening level than the decentralized control condition [26]. Cachon and Lariviere proposed revenue-sharing contracts based on the condition that distributors buy the products from suppliers at a low wholesale price and allow suppliers to share supply chain sales revenue [27]. Zhang and Liu considered a two-member supply chain composing of one supplier and one retailer and established a profit division model based on Stackelberg games. They found that if the dominant enterprise abandons the dominant opportunities, their profits will decline, and the supply chain will also operate inefficiently [28]. Wei and Choi explored the wholesale pricing and profit-sharing scheme to coordinate supply chains under the mean– variance decision framework. In addition, they determined the proportion of profit distribution among enterprises [29]. Some other scholars established different mathematical model on profit distribution. Xu and Wang established a decision model of centralized and decentralized supply chain composed of a manufacturer and a retailer and explored the profit distribution of a CLSC (closed-loop supply chain) based on retail price and emission reduction dependent demand. The results demonstrated that profit distribution can coordinate members effectively [30]. Yu et al. obtained optimal inventory strategies for members under different information sharing scenarios. The research shows that in the decentralized supply chain, the increase of information sharing among members will lead to Pareto improvement of the performance of the whole supply chain [31]. Liu and Papageorgiou developed a mixed integer linear programming (MILP)-based, fair profit distribution framework and used proportional and maximum-minimum fairness criteria to define fair profit disposition [32]. With consideration of the elements of corporate social responsibility, Ding et al. studied supply chain for pollution reduction with collaborative investments. Furthermore, they solved the problem of profit distribution in supply chains that meet sustainable constraints [33]. Patra explored a two-member supply chain composing of the manufacturer and the service provider, and considered the profit distribution among the enterprises [6].
Most of the above literature on profit distribution on supply chain is concentrated in the manufacturing industry and few consider the constraints of cap-and-trade policy; the exploration of construction supply chain is rare.
2.3. Construction Supply Chain Operation Decisions for Multi-Echelon Supply Chains
In the early 1980s, Koskela applied the idea of the supply chain in manufacturing to construction industry, thus forming the prototype of construction supply chain management. Scholars have paid more attention to how to improve the operation efficiency of construction supply chain recently [34]. Errasti et al. proposed a cooperative model to improve cooperation [35]. Fugate and Sahin explored supply chain coordination mechanisms deeply including price, non-price, and flow coordination mechanisms and found that managers are more inclined to flow coordination mechanism than others [36]. Yang et al. put forward a new model combining improved Shapley method and the TOPSIS method to solve single-factor and multiple-factor profit distribution [13]. Lin et al. established an uncertain bi-level programming model based on multi-echelon supply chain solving their incentive mechanism and coordination [37]. Feng et al. proposed a new bi-level programming model with multiple objective optimization which can check up on intrinsic conflicts among decision makers [38]. Chen put forward a project network consisting of multiple concurrent projects to solve the coordination between supplier selection and project scheduling, motivated by a practical operation decision in the construction industry [39]. Selim and Arazlrem established a multi-objective linear programming model and applied fuzzy goal programming approaches to solve collaborative production–distribution planning problem in supply chain systems [40]. Furthermore, Zainal Abidin and Ingirige explored disruptions in a supply chain using pathogen metaphor to reflect internal hidden flaws and established appropriate strategies to prevent supply chain from disrupting. Moreover, some experts have studied the integration of information flow for making better construction supply chain operation decisions [41]. Irizarry et al. combined building information modeling (BLM) with geographic information systems (GIS) into a unique system following the trail of the supply chain status [42]. Čuš-Babič et al. proposed a theoretical model of information mapping to eliminate information gaps within the design, prefabrication, and on-site construction processes [43].
In the research of the operation decisions on the construction supply chain, the researchers paid more attention to the application of the traditional supply chain thought in the construction supply chain, examining how to realize the coordination of the supply chain, while few researchers have considered the influence of the cap-and-trade policy on its decision-making. Moreover, we discuss the differences of the supply chain in different cooperation modes.
All the above literature laid a foundation for the study of this paper. This paper studies the coordination and decision-making of the construction supply chain considering the constraints of cap-and-trade policy based on the general contracting model of construction. There are two main problems studied in this paper: (1) the joint enterprises in the construction supply chain and how to achieve optimal green decisions; and (2) which profit distribution strategy can coordinate the construction supply chain as much as possible under the cap-and-trade policy.
3. Model Description and Assumption
The research object of this paper is the system of a two-stage supply chain consisting of a general contractor and a subcontractor. In the general contracting project, the general contractor obtains the project by participating in bidding. After the successful bidding of the general contractor, the general contractor will sign the general contract with the proprietor, and then complete the whole process or several stages of the project according to the agreement of the contract. Generally speaking, few general contractors can complete the contract works independently. Therefore, the general contractor will subcontract part of its own content which is difficult to complete to some professional subcontractors to integrate and use external resources to improve the efficiency and competitiveness of the supply chain and create more benefits.
The general contracting construction supply chain is a typical core supply chain revolving around a general contractor with strong comprehensive strength. The general contractor plays a leading role in the supply chain, which is also associated with the proprietor and subcontractor, responsible for all the contents of the contracted project to the proprietor. As an independent economic entity, the general contractor and the subcontractor will take the maximum of their own profits as the decision-making goal. Under the constraints of the cap-and-trade policy, the general contractor and the subcontractor need to balance the incremental costs and gains of carbon emission reduction, to decide on the emission reduction efforts of enterprise. To motivate the contractor to achieve the goal of emission reduction, the proprietor will agree with the general contractor for an incentive to achieve the emission reduction goal in advance, and the general contractor will also assign a certain reward to the subcontractor to improve its emission reduction efforts. In this context, the general contractor needs to choose the appropriate allocation proportion to encourage the supply chain enterprises to increase emission reduction efforts to achieve emission reduction goals, and to coordinate the supply chain.
The following assumptions are made to develop the proposed model:
- (1)
- In the general contract signed by the proprietor and the general contractor, we assumed that the proprietor signs a contract with fixed total price and emission reduction bonuses with the general contractor to encourage contractor to achieve emission reduction, which is given by [44]. Among them, is the total contract price, and is the fixed total contract price of the general contractor given by the proprietor. In addition, is the final emission reduction bonuses of the general contractor given by proprietor.
- (2)
- Because is the emission reduction bonuses, it must be related to the amount of carbon emissions reduction. Similar to the simple linear incentive contract mentioned by Ward, we assume a linear relationship between the emission bonuses and the amount of emission reductions [45]. Parameter () is the bonuses coefficient of unit emission reduction negotiated by proprietor and general contractor in advance, which is given by . The , () offered above are the emission reduction amount of the unit construction area of general contractor and subcontractor. In addition, is construction areas.
- (3)
- In addition, are affected by the emission reduction efforts . With the increase of the investment in the reduction emission, the marginal cost of the carbon emission reduction will increase gradually, so the increase of the emission reduction will be slower. That is, carbon emission reduction amount is a continuous increasing convex function about emission reduction efforts , and the relationship of the two can be assumed as . is the emission reduction efficiency coefficient of enterprise , which is the indication about emission reduction technology, management ability and so on of enterprise . In addition, the bigger is, the higher the emission reduction efficiency of the enterprise is.
- (4)
- To achieve the goal of emission reduction, enterprises will increase the investment of emission reduction, upgrade the technology, adopt new equipment, and so on, to reduce the emission reduction of the unit construction area. The costs of emission reduction accelerated increase with the increase of the amount of emission reduction. Similar to the model of research and development cost adopted by many scholars in the field of product research and development [46], the cost of emission reduction of enterprise is assumed as . Among them is cost coefficient of emission reduction of enterprise . In addition, the bigger is, the more the cost of emission reduction is.
- (5)
- Under the constraints of cap-and-trade policy, we assumed that the government uses the benchmark-based emission method to allocate the quotas for the construction products, which means that the government establishes the carbon emission quotas according to the advanced carbon emission level of construction area [47]. When enterprises use up the free quotas allocated by the government, they need to purchase additional quotas from the carbon trading market to meet demand. Conversely, if the enterprises still have remainders after the completion of the construction products, the quotas can be sold for additional benefits. We assumed that the benchmark carbon emission of unit construction area in the construction industry (the advanced level in industry) is . the initial carbon emission of unit construction area is . If the construction area is s, and the transaction price of the carbon trading market is m, then carbon trading price of the supply chain after production is given as .
- (6)
- In the subcontract signed by the general contractor and the subcontractor, the general contractor will also give the subcontractor a fixed contract price at first. In addition, to encourage the subcontractor to increase the emission reduction efforts, the general contractor will give the subcontractor a certain bonus. At this time, the amount of bonus that the general contractor can dominate consists of two parts, which are the final reduction bonuses of general contractor given by proprietor t and f in the carbon trading market, and the total amount of the governable bonuses is (). When carbon trading price is positive, it is indicated that the carbon emissions from the supply chain exceed the free quotas from the government, and they need to buy quotas from the carbon trading market, and on the contrary to indicate that the enterprises still have surplus quotas at the end of production, which can be sold in the carbon trading market to gain extra income. The general contractor assigns part of its domination to the subcontractor for reward. Assuming the profit distribution proportion of subcontractor given by general contractor is , the total contract price of the subcontractor can be expressed as .
- (7)
- Supposing the fixed cost of general contractor and subcontractor are and , the profits of general contractor and subcontractor are and while the profits of supply chain is . Then we can draw their expression as
- (8)
- Supposing that the general contractor and the subcontractor are both risk neutral enterprises.
The symbols of the models in this paper are defined as Table 1.
4. Model Analysis and Solution
4.1. Pure Competition Model
In the case of pure competition decision-making, the general contractor and the subcontractor separately perform emission reduction investment. At this time, the relationship between general contractor and the subcontractor are the Stackelberg game model, in which the general contractor is the dominant one and it determines its own emission reduction efforts and the proportion of profit distribution aiming at maximizing its own profits. As a follower, the subcontractor decides the degree of its own emission reduction efforts after the general contractor’s decisions.
Proposition 1.
The optimal emission reduction efforts of general contractor and subcontractor under cap-and-trade policy in the pure competition decision-making condition are
Proposition 2.
The optimal profit distribution proportion λ of subcontractor given by the general contractor is
Proof.
First, we take the first-order derivative of Equation (2) with respect to and let the first derivative equal to 0 as follows
Then we can attain the optimal emission reduction efforts of subcontractor is
Substituting above into Equation (1) and then we take the first-order partial derivative of and respectively and let them equal to 0, constructing a simultaneous equation as follows
So, we can get the optimal emission reduction efforts of general contractor and the optimal proportion of bonuses are as follows
Because of parameters , , and are all greater than 0, we can easily know that .
□
In the case of pure competition decision-making, as the general contractor occupies the dominant position, the general contractor will account for all the bonuses from the view of maximizing its own profits that is, the proportion of bonuses allocated to the subcontractors is 0. At this time, the subcontractor refuses to pay the emission reduction efforts, and all the emission reduction investment will be paid by the general contractor, so it is difficult to achieve the emission reduction goals in practice. In a single cooperation, the decision behavior of the general contractor does make its own profit maximum, but such decision-making will lead to the subcontractor’s behavior that is not conducive to the realization of the construction goals, and destroy the cooperation between the general contractor and the subcontractor, which is not conducive to long-term cooperation.
4.2. Co-Opetition Model
In the case of co-opetition decision-making, the general contractor and the subcontractor separately perform emission reduction investment to decide their optimal emission reduction decisions, and then the general contractor and the subcontractor cooperatively decide the profit distribution proportion aiming at maximizing the profits of construction supply chain. It reflects the situation of the existing of competition (the general contractor and the subcontractor make a separate decision on the emission reduction efforts) and cooperation (the general contractor and the subcontractor cooperatively decide the proportion of the profit distribution).
Through the analysis of co-opetition decision-making, we can draw the following propositions:
Proposition 3.
The optimal emission reduction efforts of general contractor and subcontractor under cap-and-trade policy in the co-opetition decision-making condition are
Proof.
The general contractor determines its emission reduction efforts from the perspective of maximizing its profits. We take the first-order derivative of Equation (1) with respect to as follows
The subcontractor also determines its emission reduction efforts from the perspective of maximizing its profits. We take the first-order derivative of Equation (2) with respect to as follows
Here we can make , and then we can easily get the optimal emission reduction efforts , of general contractor and subcontractor from the perspective of maximizing their own profits. □
From Proposition 3 we can observe that the optimal emission reduction efforts of general contractor and subcontractor from the perspective of maximizing their own profits are proportional to the square of the profit distribution proportion, inversely proportional to the square of their own cost coefficient, and inversely proportional to the square of their own efficiency coefficient, and proportional to the square of the construction area. It shows that the higher the enterprise’s bonuses distribution proportion, the lower its own cost and the larger the construction area, the more the enterprise willing to pay on emission reduction efforts.
Proposition 4.
The optimal profit distribution proportion of subcontractor given by the general contractor in the co-opetition decision-making is
Proof.
Substituting , of Equations (7) and (8) to Equation (3) we can attain the expressions of the profits of the supply chain as follows
We take the first-order derivative of with respect to as follows
We make and then we can get result as Proposition 4.
□
Substituting Equations (7) and (8) and Equation (9) into Equations (1)–(3) we can attain the expressions of the profits of the general contractor, subcontractor, and the supply chain as follows
In the case of co-opetition decision-making, although the expressions of emission reduction efforts of the general contractor and the subcontractor are the same as that in the pure competition decision-making, because of the general contractor and the subcontractor cooperatively decide the profit distribution proportion, and the proportion is not 0 which means the actual emission reduction efforts are not the same. In this situation, the general contractor and the subcontractor work together to reduce the emission reduction and it is beneficial to the realization of the emission reduction goal.
Proposition 5.
The profit distribution proportion of subcontractor given by the general contractor is only related to their emission reduction cost coefficient in the co-opetition decision-making condition. In addition, the proportion is positively related to the cost coefficient of the general contractor and negatively related to the cost coefficient of the subcontractor.
Proof.
From Equation (9) we can get , , the proposition is proved. □
It can be seen that for the general contractor, the greater its cost coefficient of emission reduction is, the more it will be willing to give more incentives to the subcontractors to achieve the goals of reducing emissions and maximizing profits. For the subcontractor, the higher its own cost coefficient of emission reduction is, the less it hopes to get emission reduction incentives, to reduce emissions reduction costs and increase its profits.
4.3. Pure Cooperation Model
The general contractor and subcontractor make up a consortium, and they no longer take their own profits maximization as the decision-making objective. Instead, they take the maximization of supply chain profits as the decision-making goals. For the pure cooperation decision-making condition, we can get the following propositions:
Proposition 6.
The optimal emission reduction efforts of general contractor and subcontractor under cap-and-trade policy in the pure cooperation decision-making are
Proof.
In the profit expression of supply chain, by the second order derivatives of Equation (3) with respect to and , the resulting Hessian matrix of can be calculated by
It is obviously that and , that is the Hessian matrix of is a negative definite, and strictly joint concave in and . By solving the first-order partial derivative of with respect to and and let , we can easily get the Proposition 6. □
The optimal emission reduction efforts of each participant in the construction supply chain in the condition of pure cooperation decision-making are still inversely proportional to the square of the cost coefficient, which is inversely proportional to the square of the efficiency coefficient, and is directly proportional to the square of the construction area.
We substitute Equations (10) and (11) into Equation (3) and then get the expression of construction supply chain profits as follows:
Proposition 7.
Through the comparison of co-opetition model and cooperation model, we can find that the relationship of emission reduction efforts of participants in construction supply chain are .
Proof.
From the emission reduction efforts which were calculated above, we can attain that , and parameter satisfy , so we can get , that is, the relationship of emission reduction efforts is . □
It shows that the emission reduction efforts of cooperation model have increased compared to the co-opetition model from descriptions above. Therefore, the profits must be distributed reasonably to compensate for enterprises’ investment in emission reduction and make the condition of pure cooperation decision-making realized. Otherwise, if unfair profit distribution occurs, it will lead to the burst of cooperative relationships, which is not conducive to long-term strategic cooperation between enterprises. So, we introduce the common method of distribution of profits under the cooperative game scenario—Shapley value method.
Proposition 8.
The profits of the general contractor and subcontractor after the profit distribution by using the Shapley value method is
Proof.
Supposing that I = {1, 2, 3, … n} is an alliance which is formed by N participants, [I, v] is individual cooperative countermeasures while v is the characteristic function of the alliance. is the Shapley value of the alliance in which represents the revenue of participants I as follows [13]
In the above formula, v represents the revenue of alliance where T is a set including participant I. In addition, t represents the number of elements in set T while n is the number of participants of the alliance.
By using the above Shapley value method, we can get the profits expressions of the general contractor and the subcontractor as follows
There we substitute , , , into the formula above then we can get the results as Proposition 8. □
Through the comparison of the revenue functions of general contractor and subcontractor under different decision-making conditions we can get the following proposition:
Proposition 9.
The relationships of general contractor’s profits and subcontractor’s profits under cooperation model and co-opetition model are , , it shows that the profits of general contractor and subcontractor will be increased in the condition of pure cooperation decision-making compared to the condition of co-opetition. Therefore, the general contractor and the subcontractor are more willing to adopt a cooperative strategy.
Proof.
Through the revenue functions of general contractor and subcontractor described above, we can get that , it is obvious that , then we can get the conclusion as Proposition 9. □
5. Model Comparison
Under the three decision-making situations, the total emissions reduction amounts of construction supply chain are as follows:
Proposition 10.
The relationships of the total emission reduction amounts of construction supply chain under pure cooperation decision-making compared to that of complete competition and co-opetition decision-makings are .
Proof.
Through Equation (16) subtracts Equations (14) and (15) respectively, we get . Since , it is obvious that , . That is to prove the above Proposition 10. □
Through the above proposition, we find that the emission reduction of construction supply chain in the case of pure cooperation decision-making is greater than that of pure competition and co-opetition decision-makings, which means that pure cooperation decision-making has the best effect on emission reduction and is more conducive to achieving the emission reduction goal.
Proposition 11.
When , the relationship of the emission reduction of the construction supply chain between the situation of co-opetition and complete competition decision-making is ; When , the relationship of emission reduction is .
Proof.
Since , it is obvious that when , there is ; when , there is . □
Through the above proposition, we find that the amount of emission reduction of construction supply chain in the case of co-opetition decision-making is not always greater than that in the case of pure competition decision-making. When the emission reduction cost coefficient of the general contractor is smaller than that of the subcontractor (), it means that when the emission reduction efficiency coefficient of the general contractor is higher than that of the subcontractor, the general contractor tends to adopt a pure competition decision-making mode, which will increase the emission reduction and its own profits. This is because the general contractor enjoys the exclusive emission reduction bonuses in the case of a pure competition decision-making, and its own emission reduction cost is relatively low. When the general contractor’s emission reduction cost coefficient is higher than that of the subcontractor (), the general contractor will adopt the co-opetition decision-making mode, and share the emission reduction bonuses with the subcontractor to achieve the emission reduction goal and increase their respective profits which is due to the fact that the general contractor has low efficiency and high cost of emission reduction, so the general contractor will choose co-opetition decision-making mode in order to achieve the emission reduction goal and reduce the cost.
Proposition 12.
The relationships of the profits of the construction supply chain under the three decision-making situations are .
Proof.
Through the profits of the construction supply chain in the case of pure cooperation decision-making subtracts the profits in the case of complete competition and co-opetition decision-makings respectively, we get , . It is obvious that , . Through the profits of the construction supply chain in the case of co-opetition decision-making subtracts the profits in the case of complete competition decision-making, we get , It is obvious that . □
Through the above proposition, we find that the total profits of construction supply chain in the case of cooperative decision-making is greater than that under complete competition and co-opetition decision-makings. Combined with Proposition 9, we can see that the pure cooperation decision-making can achieve Pareto improvement in the profits of the general contractor, the subcontractor, and the construction supply chain. Therefore, the pure cooperation decision-making model is the most ideal decision-making model. We notice that the profits of construction supply chain are always greater than that under pure competition decision-making, while according to Proposition 11, the emission reduction of construction supply chain in the case of co-opetition decision-making is not always greater than that in pure competition decision-making. When , the general contractor invests emission reducing costs separately while the marginal cost of reducing the emission of the general contractor increases at a faster rate, the profits of construction supply chain will be reduced even though the emission reduction will be increased.
Construction industry is an important material production sector of the national economy, but also one of the industries with huge carbon emissions for many countries. Its development is related to the development of the whole national economy and the realization of low-carbon sustainable development strategy. To adapt to the low-carbon development, as well as the restriction of cap-and-trade policy on enterprises, the construction supply chain enterprises must make effective emission reduction decisions and profit distribution. Our research result provides important references for the management and practice of construction supply chain enterprises. Firstly, our propositions enable the construction supply chain enterprises obtain the optimal emission reduction decisions and profit distribution under the circumstances of pure competition, co-opetition, and pure cooperation. Secondly, our propositions show that the perfect cooperation mode is the pure cooperation mode. It has great benefits for both the profits of supply chain and emission reductions. In particular, the larger the building area, the higher the carbon trading price and the lower the carbon quotas, the more obvious the advantages of the cooperation mode. If pure cooperation cannot be adopted, enterprises should choose the cooperation modes and make corresponding emission reduction decisions according to their own emission reduction costs and efficiency.
6. Numerical Analysis
Through the above theoretical analysis, we obtain the optimal emission reduction decisions and profit distribution strategies of the supply chain enterprises under the conditions of pure competition, co-opetition, and pure cooperation decision-making. The strength of different enterprises is uneven, so the efficiency coefficient and the cost coefficient of emission reduction are unequal in different enterprises. These model parameters related to the strength of enterprises will have a certain impact on the decision-making of enterprises. In addition, the different carbon limit and carbon trading price will bring influence on the decision-making of supply chain enterprises under the constraints of cap-and-trade policy. The following examples are used to study the influence of the efficiency coefficient, the cost coefficient of emission reduction and the constraints of cap-and-trade policy on the decision-making of supply chain. Assuming that there is a construction with areas of , the initial carbon emission of unit construction area is , the benchmark of carbon emission of unit construction area in construction industry (the advanced level in industry) is , carbon trading price . Emission reduction incentive coefficient is , the fixed contract price signed by the proprietor and the general contractor is , the fixed contract price signed by the general contractor and the subcontractor is , the fixed cost of the general contractor is , and the fixed cost of the subcontractor is .
6.1. The Influence of Emission Reduction Cost Coefficient and Efficiency Coefficient of Emission Reduction on Supply Chain Decision
Through Table 2 and Table 3, we find that in the case of pure competition decision-making, because only the general contractor has paid emission reduction efforts, while the subcontractor does not pay efforts, there would be no emissions reduction award and cost, so the emissions reduction cost coefficient of the subcontractor will not impact on the profits of the general contractor and the supply chain. When the emission reduction cost coefficient of the general contractor increases, the general contractor will reduce the emission reduction efforts to ensure the maximum profits. As a result, the profits of itself and the whole supply chain will be reduced, but it will not affect the profits of subcontractors. Through Table 4 and Table 5, in the case of co-opetition decision-making, we can find that with the increase of the emission reduction cost coefficient of the contractor i (i = 1, 2), the emission reduction efforts of contractor i have decreased, while another contractor j (j = 1, 2) has increased its efforts to reduce emissions which means that contractors i will reduce its investment in order to ensure its own profits, and contractor j will increase the level of efforts to reduce emissions in exchange for increased allocation proportion of bonuses to increase its profits. It also can be seen that the allocation proportion of bonuses to subcontractors by the general contractor will increase with the increase of the investment cost coefficient of the general contractor, and decrease with the increase of the investment cost coefficient , which also strongly verifies the correctness of Proposition 2. Through Table 6 and Table 7, under the pure cooperation decision-making, with the increase of the emission reduction cost coefficient of the contractor i, the emission reduction efforts of contractor i will be reduced, and the efforts of contractor j will remain unchanged. It shows that when a contractor’s cost coefficient is increased and it reduce its emission reduction investment, the other contractor needs to maintain the efforts and investment in reducing emissions to maintain overall profits under cooperation model. We also can find that the profits of supply chain enterprises under pure cooperation decision-making is greater than that of in co-opetition condition, which verifies the correctness of Proposition 9.
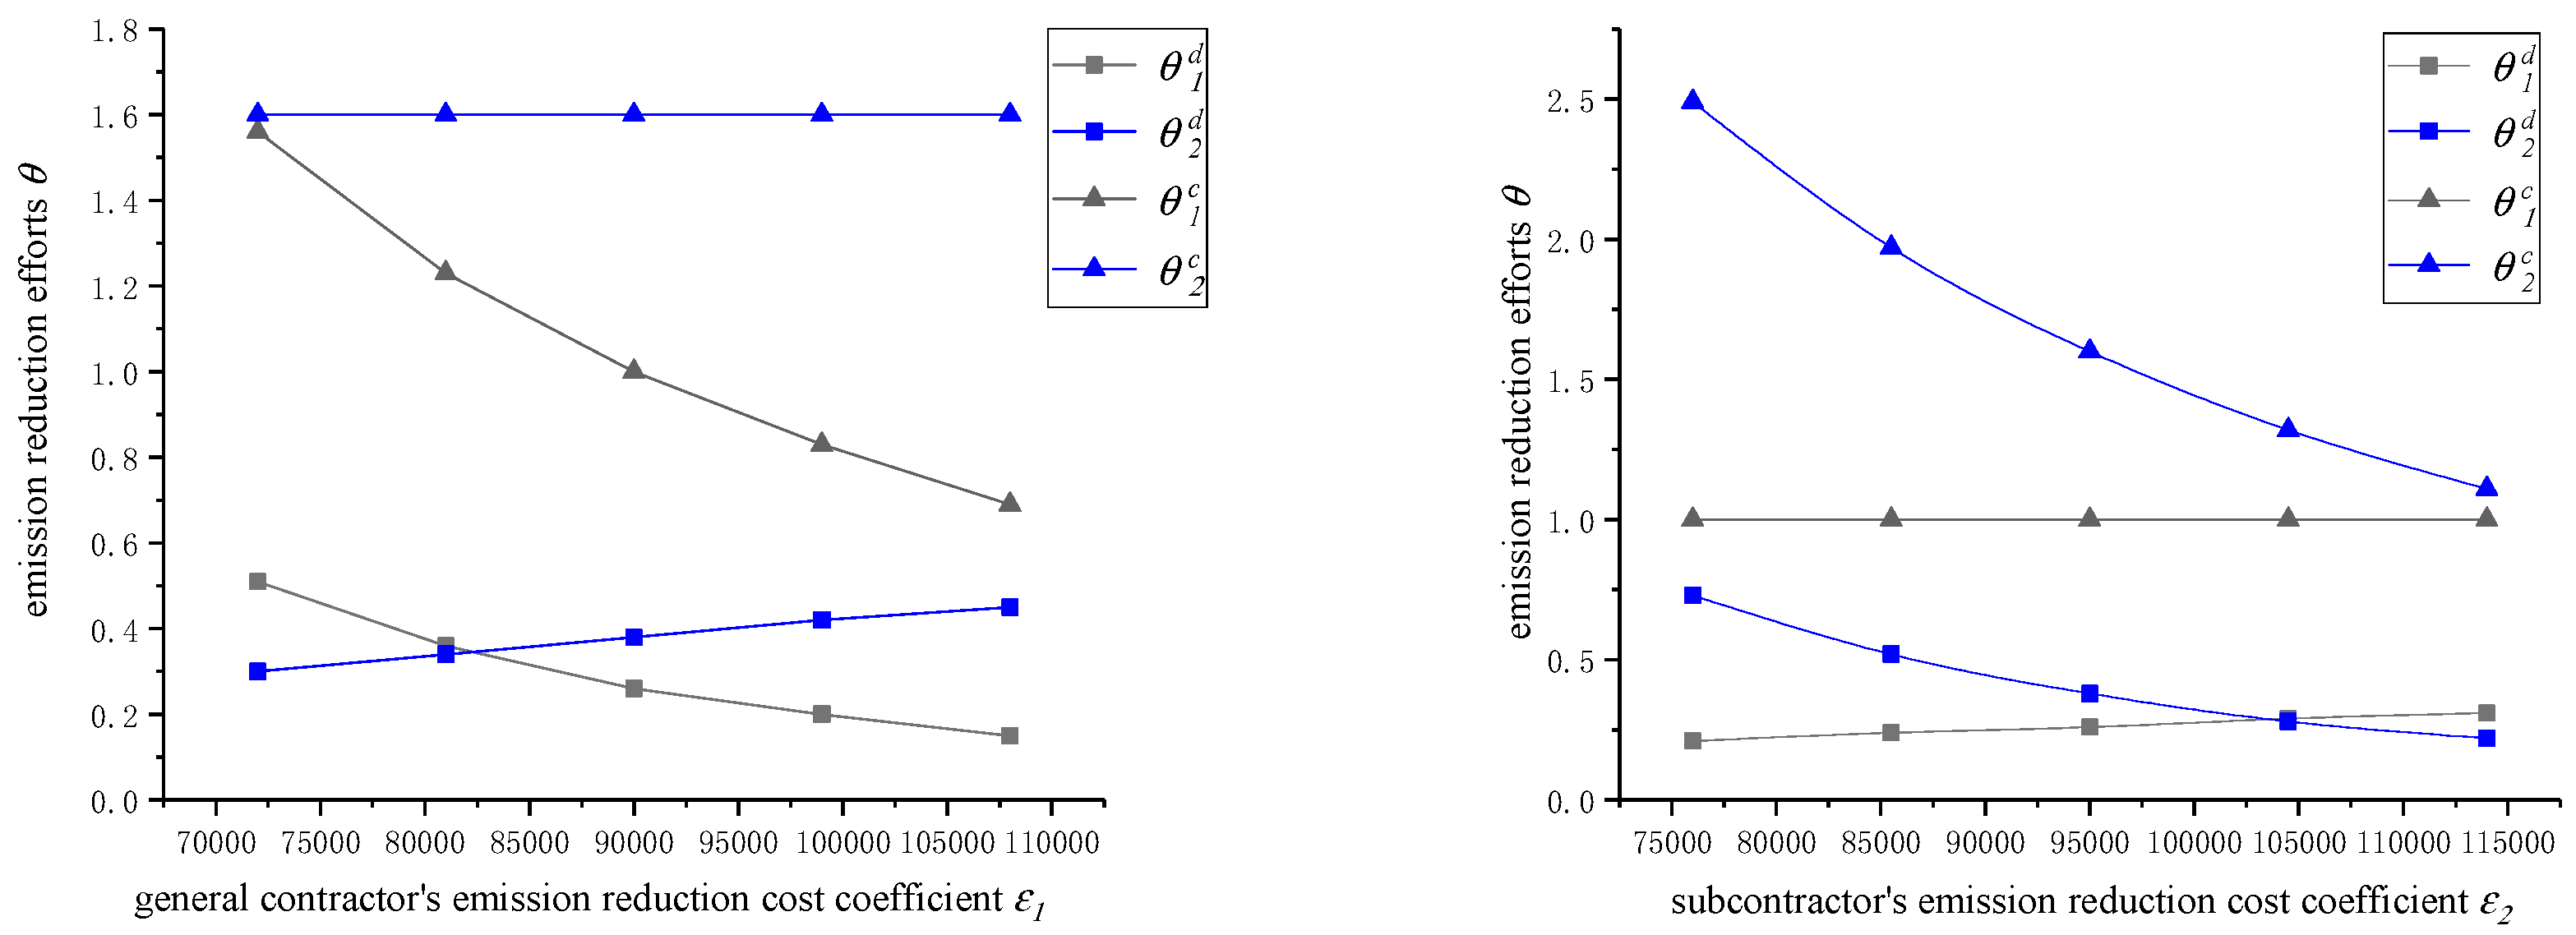
The relationship between the cost coefficient of the contractor and the emission reduction efforts in the context of co-opetition and pure cooperation decision-making is shown in Figure 1: As increases, we can see that and decrease, and increase slowly. Meanwhile, as increases, we can see that and increase slowly, and decrease rapidly.
Observation 1.
The contractor’s emission reduction efforts in a pure cooperation decision-making are more than twice as great as those in a co-opetition decision-making.
Observation 2.
The change degree of the contractor’s own emission reduction efforts caused by the change of the contractor’s own emission reduction cost coefficient is greater than that of the other contractor’s emission reduction efforts no matter what the decision situation is, which means that the contractor’s own emission reduction efforts are more sensitive to the emission reduction cost coefficient.
From Table 8, Table 9 and Table 10, we can see that in the case of co-opetition, pure cooperation, and pure competition decision-making, when (emission reduction efficiency coefficient of general contractor) increases, (the optimal emission reduction efforts of general contractor) decreases and (the optimal emission reduction efforts of subcontractor) remains constant. In contrast, From Table 11, in the case of pure competition decision-making, we find that when (emission reduction efficiency coefficient of subcontractor) increases, (the optimal emission reduction efforts of general contractor) and (the optimal emission reduction efforts of subcontractor) remains constant. Furthermore, through Table 12 and Table 13, in the case of co-opetition and pure cooperation decision-making, we find that when (emission reduction efficiency coefficient of subcontractor) increases, (the optimal emission reduction efforts of general contractor) remains constant and (the optimal emission reduction efforts of subcontractor) decreases.
Overall, Through Table 8, Table 9, Table 10, Table 11, Table 12 and Table 13, in the case of complete competition decision-making the emission reduction efforts of the general contractor will decrease with the increase of the its emission reduction efficiency coefficient, while the profits will not change. Since the subcontractor does not invest in emission reduction, the change in its efficiency coefficient has no impact on the efforts and profits of the general contractor. The profit distribution proportion has nothing to do with the emission reduction efficiency coefficient in either decision-making environment. In the case of obtaining the same profits, when one of enterprise’s emission reduction efficiency coefficient increases, it will reduce its emission reduction efforts to reduce its cost while the other party of enterprise will keep current emission reduction efforts to maintain its own profits level.
Under the pure cooperation decision-making condition, there will be a certain improvement no matter the profits of the enterprises or the supply chain, or the degree of the enterprises’ efforts to reduce emissions. Therefore, the enterprises in the construction supply chain are better to adopt the pure cooperation decision-making mode, to ensure that it can achieve the goal of reducing emissions and increase the profits of the enterprise. At the same time, the construction enterprises should keep innovating in production, accelerate technological transformation and innovation, and increase investment in green technology, to reduce the cost of emission reduction and expand their own profits due to the sensitivity of the enterprises’ emission reduction efforts to their own cost coefficient and efficiency coefficient.
6.2. The Impact of the Constraints of Cap-and-Trade Policy on Supply Chain’s Decision-Making
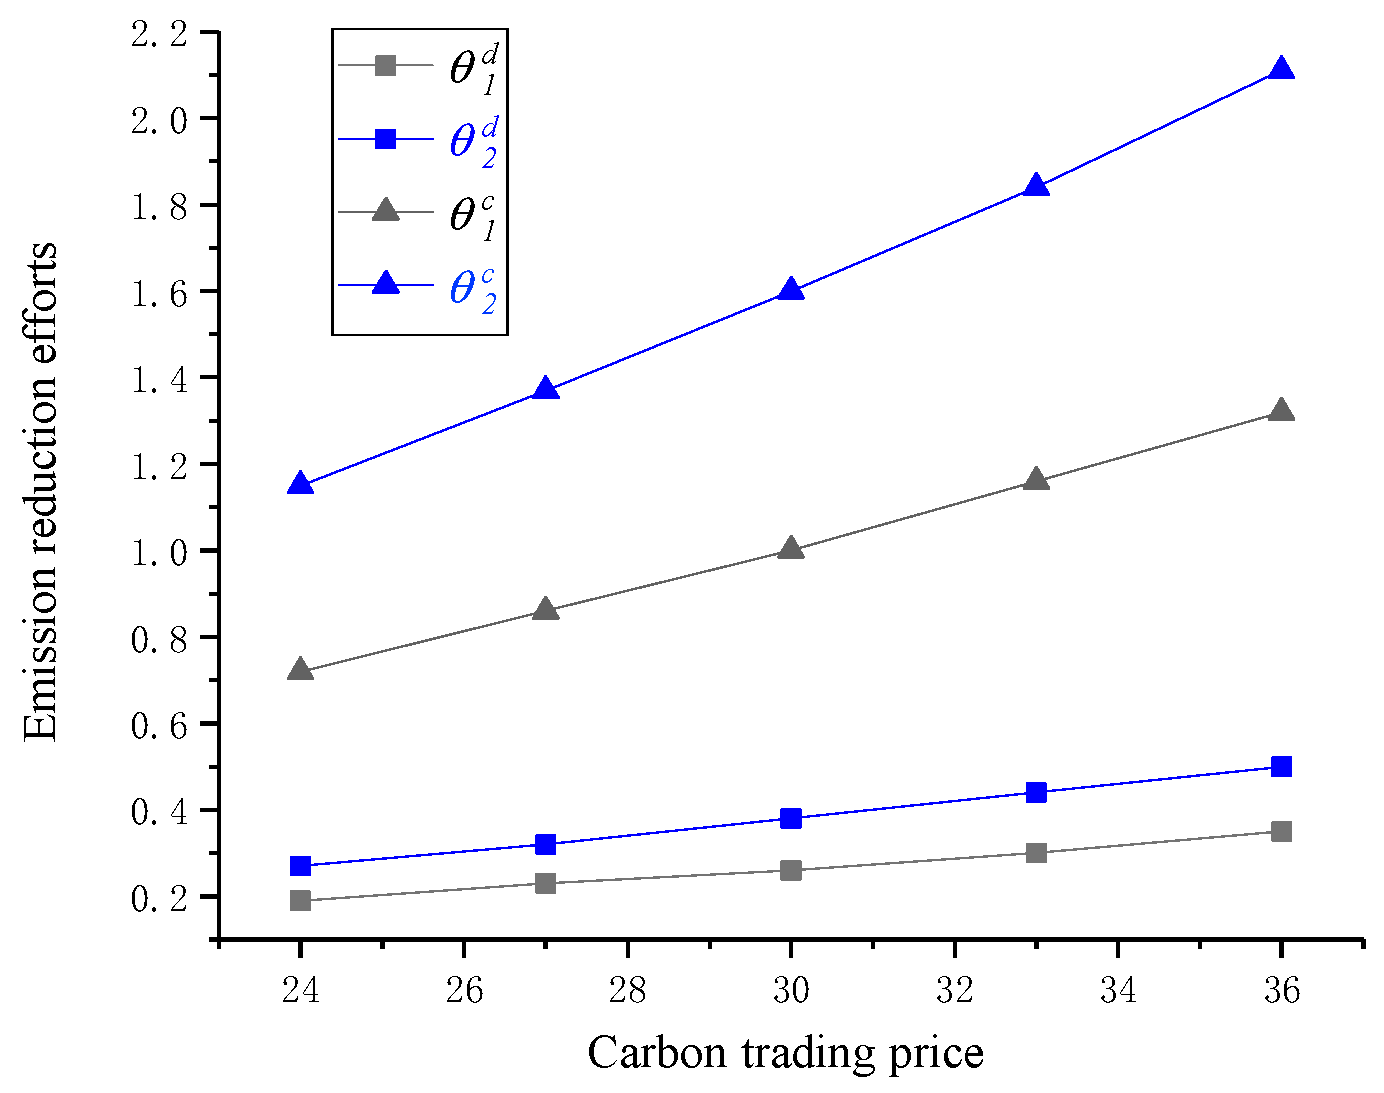
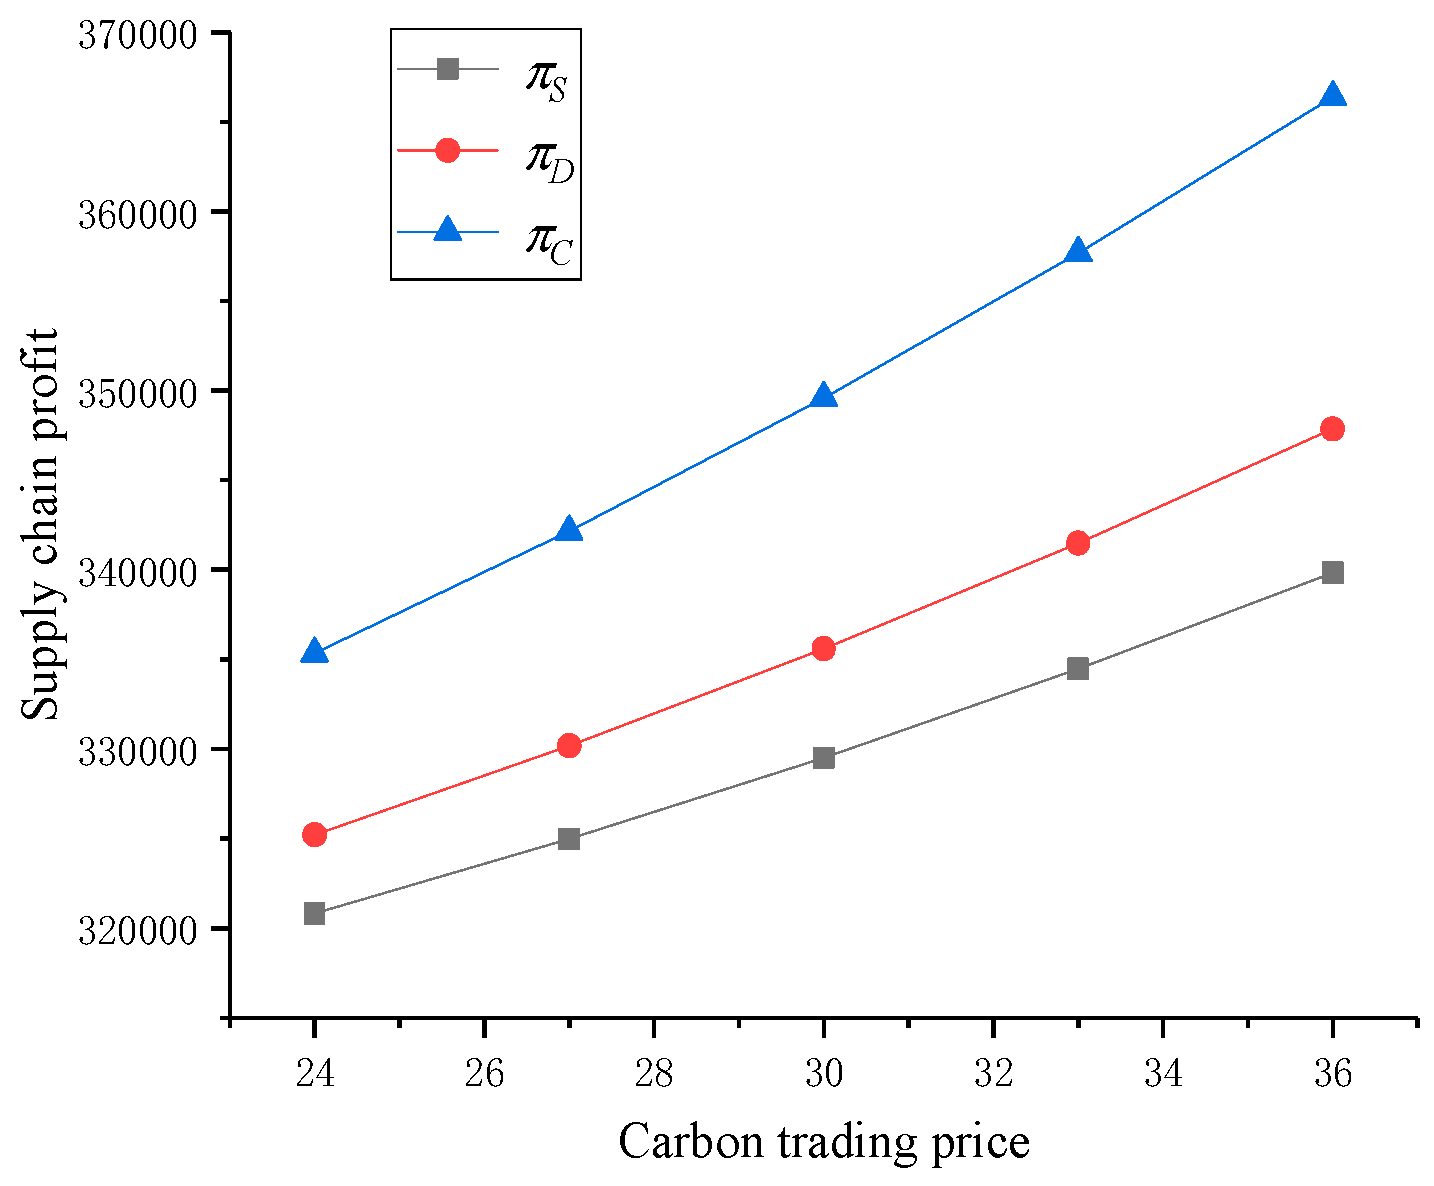
Through Table 14, as the price of carbon trading rises, the general contractor’s emission reduction efforts will increase to make more profits. Through Table 15 and Table 16 and Figure 2, as the carbon trading price rises, both the general contractor and the subcontractor will increase their investments in emission reduction efforts under co-opetition decision-making and pure cooperation decision-making. It means that when the cost of emission reduction remains the same, the increase in the price of carbon trading will lead to the increase of the profits of the supply chain, see Figure 3.
Based on the above propositions and Table 17, Table 18 and Table 19, we can see that the change of will not affect the emission reduction decisions of the enterprise no matter what situation is due to the benchmark carbon emission of unit construction area has no effect on the profits allocation proportion and emission reduction efforts. However, with the increase of , the profits of supply chain will increase, and the profits of supply chain node enterprises will also increase, and vice versa.
From the above, we can see that the government must formulate a reasonable carbon emission benchmark in the process of formulating cap-and-trade policy, and make full use of market regulation functions to realize the balance between maximizing incentives of the supply chain enterprises to reduce emissions and maintaining stable development of the construction industry.
7. Discussions and Conclusions
The cap-and-trade policy is an effective means for the government to achieve carbon emission reduction goals. There are some enlightening papers on the cap-and-trade policy; however, study of the impact of cooperation modes on the construction supply chain’s decision-making under the cap-and-trade policy is insufficient. To some extent, our paper fills the gap. Based on the literature above, we can find that different distribution elements are considered, and we choose some elements, such as contract price, reduction bonus, construction area, and so on, to meet the features of the construction industry. Moreover, compared to other profit distribution and the optimal emission reduction decision research mentioned above, we take three cooperation modes—pure competition, co-opetition, and pure cooperation—into consideration to solve the optimal emission reduction decisions and profit distribution of enterprises using game theory and Shapley value method, which is more systematic and representative.
In this paper, we construct a Stackelberg game model of profit distribution of construction supply chain in the case of a pure competition situation under the cap-and-trade policy. At the same time, we construct the profit distribution model with both competition and cooperation under co-opetition decision-making and the cooperative game model of pure cooperation decision-making. We have obtained the optimal emission reduction efforts and profit distribution of the general contractor and the subcontractor under each decision-making situation. It is concluded that the total profits of the supply chain under the situation of pure competition decision-making is lower than that under the situation of co-opetition and cooperation decision-making, and the construction goal is difficult to realize, so the enterprises in the construction supply chain should avoid adopting a strategy of pure competition. In the case of co-opetition decision-making, the lower the cost coefficient of emission reduction of the enterprise and the greater the proportion of profit that it can obtain, the higher the level of emission reduction efforts enterprise is willing to pay, and the lower, the reverse. In addition, the larger the scale of the building is, the more the enterprises are willing to increase investment in emission reduction due to the existence of the scale effect. The profit distribution proportion of the supply chain enterprise is only related to their cost coefficient of emission reduction. The higher the cost coefficient of enterprises, the more inclined the enterprises are willing to let the other party get more rewards, to maximize their incomes. In the case of pure cooperation decision-making, the relationship between the emission reduction efforts and the cost coefficient of emission reduction investment is the same as that of co-opetition decision-making. The difference is that the level of emission reduction efforts of enterprises has nothing to do with the proportion of profits. We find that enterprises’ emission reduction efforts are sensitive to their cost coefficient and efficiency coefficient.
Based on what is shown above, here are some suggestions for construction enterprises and government. For construction enterprises, they should keep innovating in production, accelerate technological transformation and innovation, and increase investment in green technology, to reduce the cost of emission reduction and increase their own profits. Therefore, supply chain enterprises should adopt cooperative strategies to ensure the realization of the construction goals while obtaining maximum profits. At the same time, the Shapley value method can be adopted to distribute the profit in the pure cooperation decision-making, which makes the profit distribution fairer and more reasonable. For government, they can improve construction firms’ emission reduction efforts by promoting the importance of carbon emission reduction to the public, because the more attention the public attaches to carbon emission reduction, the more efforts firms will make to reduce carbon emissions.
This paper considers the impact of cap-and-trade policy on the profit distribution of the supply chain of general contracting projects and enriches the research content of the construction supply chain. However, this paper only considers a two-stage supply chain consisting of a general contractor and a subcontractor, and this paper only focuses on the impacts of cap-and-trade policy on the profit distribution and emission reduction decisions. How to extend the profit distribution models of a two-stage construction supply chain under cap-and-trade policy to multi-level supply chain, and how to include other factors such as the human factor, the pressure of the commercial market, economic stability, and the productive environment into our models to make our work have more realistic significance value, will be the follow-up research directions of this paper.
Author Contributions
W.J. set up the framework of this paper; W.J. and W.L. wrote and revised the paper; W.L. and Q.X. collected the data and performed numerical analysis; All authors read and approved the final manuscript.
Funding
This research is supported by National Natural Science Foundation of China, grant number 71602134 and Research project of Education Department of Sichuan Province, grant number 17ZB0335.
Conflicts of Interest
All authors declare that they have no conflict of interest.
References
- Wang, Z.; Wang, C. How carbon offsetting scheme impacts the duopoly output in production and abatement: Analysis in the context of carbon cap-and-trade. J. Clean. Prod. 2015, 103, 715–723. [Google Scholar] [CrossRef]
- Jiang, W.; Chen, X. Optimal strategies for manufacturer with strategic customer behavior under carbon emissions-sensitive random demand. Ind. Manag. Data Syst. 2016, 116, 759–776. [Google Scholar] [CrossRef]
- IPCC. Contribution of Working Group I to the Third Assesment Report of the Intergovernmental Panel on Climate Change; IPCC: Geneva, Switzerland, 2001. [Google Scholar]
- Liu, S.; Tao, R.; Tam, C.M. Optimizing cost and CO2 emission for construction projects using particle swarm optimization. Habitat Int. 2013, 37, 155–162. [Google Scholar] [CrossRef]
- Li, G.; Zheng, H.; Ji, X.; Li, H. Game theoretical analysis of firms’ operational low-carbon strategy under various cap-and-trade mechanisms. J. Clean. Prod. 2018, 197, 124–133. [Google Scholar] [CrossRef]
- Patra, P. Distribution of profit in a smart phone supply chain under Green sensitive consumer demand. J. Clean. Prod. 2018, 192, 608–620. [Google Scholar] [CrossRef]
- Stein, H.D.; Ginevičius, R. The experimental investigation of the profit distribution in industrial supply chains with an outside option. Technol. Econ. Dev. Econ. 2010, 16, 487–501. [Google Scholar] [CrossRef]
- Agyei, F.K.; Hansen, C.P.; Acheampong, E. Profit and profit distribution along Ghana’s charcoal commodity chain. Energy Sustain. Dev. 2018, 47, 62–74. [Google Scholar] [CrossRef]
- Chauhan, S.S.; Proth, J. Analysis of a supply chain partnership with revenue sharing. Int. J. Prod. Econ. 2005, 97, 44–51. [Google Scholar] [CrossRef]
- Çanakoğlu, E.; Bilgiç, T. Analysis of a two-stage telecommunication supply chain with technology dependent demand. Eur. J. Oper. Res. 2007, 177, 995–1012. [Google Scholar] [CrossRef]
- Wang, X.; Liu, Z.; Chen, H. A composite contract for coordinating a supply chain with sales effort-dependent fuzzy demand. Int. J. Mach. Learn. Cybern. 2018, 2016, 1–17. [Google Scholar] [CrossRef]
- Zhu, L.; You, J. Moral hazard strategy and quality contract design in a two-echelon supply chain. J. Syst. Sci. Syst. Engi. 2011, 20, 70–86. [Google Scholar] [CrossRef]
- Yang, H.; Sun, X.; Liu, W.; Hao, J. Optimization of profit distribution method under multifactor in construction supply chain. J. Interdiscip. Math. 2017, 20, 1435–1440. [Google Scholar] [CrossRef]
- Stern, N. The economics of climate change. Am. Econ. Rev. 2008, 98, pp. 1–37. [Google Scholar] [CrossRef]
- Kollenberg, S.; Taschini, L. Emissions trading systems with cap adjustments. J. Environ. Econ. Manag. 2016, 80, 20–36. [Google Scholar] [CrossRef]
- Jiang, M.; Zhu, B.; Wei, Y.; Chevallier, J.; He, K. An intertemporal carbon emissions trading system with cap adjustment and path control. Energy Policy 2018, 122, 152–161. [Google Scholar] [CrossRef]
- Cao, K.; Xu, X.; Wu, Q.; Zhang, Q. Optimal production and carbon emission reduction level under cap-and-trade and low carbon subsidy policies. J. Clean. Prod. 2017, 167, 505–513. [Google Scholar] [CrossRef]
- Xu, J.; Qiu, R.; Lv, C. Carbon emission allowance allocation with cap and trade mechanism in air passenger transport. J. Clean. Prod. 2016, 131, 308–320. [Google Scholar] [CrossRef]
- Xu, X.; He, P.; Xu, H.; Zhang, Q. Supply chain coordination with green technology under cap-and-trade regulation. Int. J. Prod. Econ. 2017, 183, 433–442. [Google Scholar] [CrossRef]
- Xu, L.; Wang, C.; Zhao, J. Decision and coordination in the dual-channel supply chain considering cap-and-trade regulation. J. Clean. Prod. 2018, 197, 551–561. [Google Scholar] [CrossRef]
- Wang, F.; Liu, J. The Supply Chain Contract Design under Cap-and-Trade Mechanism with Free Riding. Front. Eng. Manag. 2015, 2, 277. [Google Scholar] [CrossRef]
- Wang, S.; Wan, L.; Li, T.; Luo, B.; Wang, C. Exploring the effect of cap-and-trade mechanism on firm’s production planning and emission reduction strategy. J. Clean. Prod. 2018, 172, 591–601. [Google Scholar] [CrossRef]
- Du, S.; Ma, F.; Fu, Z.; Zhu, L.; Zhang, J. Game-theoretic analysis for an emission-dependent supply chain in a ‘cap-and-trade’ system. Ann. Oper. Res. 2015, 228, 135–149. [Google Scholar] [CrossRef]
- Sun, M.; Peng, H.; Wang, S. Cost-Sharing Mechanisms for a Wood Forest Product Supply Chain under Carbon Cap-and-Trade. Sustainability 2018, 10, 4345. [Google Scholar] [CrossRef]
- Yoo, S.H.; Cheong, T. Quality improvement incentive strategies in a supply chain. Transp. Res. Part E Logist. Transp. Rev. 2018, 114, 331–342. [Google Scholar] [CrossRef]
- Song, H.; Gao, X. Green supply chain game model and analysis under revenue-sharing contract. J. Clean. Prod. 2018, 170, 183–192. [Google Scholar] [CrossRef]
- Cachon, G.P.; Lariviere, M.A. Supply Chain Coordination with Revenue-Sharing Contracts: Strengths and Limitations. Manag. Sci. 2005, 51, 30–44. [Google Scholar] [CrossRef]
- Guilei, Z.; Zhixue, L. A Stackelberg Game of Profit Division in Supply Chains with Dominant Firms. Syst. Eng. 2006, 24, 19–23. [Google Scholar]
- Wei, Y.; Choi, T. Mean–variance analysis of supply chains under wholesale pricing and profit sharing schemes. Eur. J. Oper. Res. 2010, 204, 255–262. [Google Scholar] [CrossRef]
- Xu, L.; Wang, C. Sustainable manufacturing in a closed-loop supply chain considering emission reduction and remanufacturing. Resour. Conserv. Recycl. 2018, 131, 297–304. [Google Scholar] [CrossRef]
- Yu, Z.; Hong, Y.; Cheng, T.C.E. Benefits of information sharing with supply chain partnerships. Ind. Manag. Data Syst. 2001, 101, 114–121. [Google Scholar] [CrossRef]
- Liu, S.; Papageorgiou, L.G. Fair profit distribution in multi-echelon supply chains via transfer prices. Omega 2017, 80, 77–94. [Google Scholar] [CrossRef]
- Ding, H.; Wang, L.; Zheng, L. Collaborative mechanism on profit allotment and public health for a sustainable supply chain. Eur. J. Oper. Res. 2018, 267, 478–495. [Google Scholar] [CrossRef]
- Koskela, L. Application of the New Production Philosophy to Construction. Phys. Lett. B 1992, 40, 181–184. [Google Scholar]
- Errasti, A.; Beach, R.; Oduoza, C.; Apaolaza, U. Close coupling value chain functions to improve subcontractor manufacturing performance. Int. J. Proj. Manag. 2009, 27, 261–269. [Google Scholar] [CrossRef]
- Fugate, B.; Sahin, F.; Mentzer, J.T. Supply Chain Management Coordination Mechanisms. J. Bus. Logist. 2011, 27, 129–161. [Google Scholar] [CrossRef]
- Lin, Y.; Guo, C.; Tan, Y. The incentive and coordination strategy of sustainable construction supply chain based on robust optimisation. J. Control Decis. 2018. [Google Scholar] [CrossRef]
- Feng, C.; Ma, Y.; Zhou, G.; Ni, T. Stackelberg game optimization for integrated production-distribution-construction system in construction supply chain. Knowl.-Based Syst. 2018, 157, 52–67. [Google Scholar] [CrossRef]
- Chen, W.; Lei, L.; Wang, Z.; Teng, M.; Liu, J. Coordinating supplier selection and project scheduling in resource-constrained construction supply chains. Int. J. Prod. Res. 2018, 56, 6512–6526. [Google Scholar] [CrossRef]
- Selim, H.; Araz, C.; Ozkarahan, I. Collaborative production–distribution planning in supply chain: A fuzzy goal programming approach. Transp. Res. Part E Logist. Transp. Rev. 2008, 44, 396–419. [Google Scholar] [CrossRef]
- Abidin, N.A.Z.; Ingirige, B. Identification of the “Pathogenic” Effects of Disruptions to Supply Chain Resilience in Construction. Procedia Eng. 2018, 212, 467–474. [Google Scholar] [CrossRef]
- Irizarry, J.; Karan, E.P.; Jalaei, F. Integrating BIM and GIS to improve the visual monitoring of construction supply chain management. Autom. Constr. 2013, 31, 241–254. [Google Scholar] [CrossRef]
- Čuš-Babič, N.; Rebolj, D.; Nekrep-Perc, M.; Podbreznik, P. Supply-chain transparency within industrialized construction projects. Comput. Ind. 2014, 65, 345–353. [Google Scholar] [CrossRef]
- Kovács, A. Types of Contract. In Enhancing Procurement Practices: Comprehensive Approach to Acquiring Complex Facilities and Projects; Springer: New York, NY, USA, 2004; pp. 201–243. [Google Scholar]
- Ward, S.; Chapman, C. Evaluating Fixed Price Incentive Contracts. Omega 1995, 23, 49–62. [Google Scholar] [CrossRef]
- Jose, G.M.M.; Nikolaos, G.; Vicente, O. Cooperative R&D with Endogenous Technology Differentiation. J. Econ. Manag. Strategy 2005, 2, 461–476. [Google Scholar]
- Groenenberg, H.; Blok, K. Benchmark-based emission allocation in a cap-and-trade system. Clim. Policy 2002, 1, 105–109. [Google Scholar] [CrossRef]
Figure 1.
Relationship between cost coefficient and emission reduction efforts .

Figure 2.
Relationship between carbon trading prices and emission reduction efforts.

Figure 3.
Relationship between carbon trading prices and supply chain profits.


Table 1.
Definitions of variables.
| Nomenclature | Definition |
|---|---|
| the total contract price of enterprise i (i = 1, 2; 1 represents general contractor, 2 represents subcontractor) | |
| the fixed contract price of enterprise i (i = 1, 2) | |
| the final reduction bonus of general contractor given by proprietor | |
| bonus coefficient of unit emission reduction | |
| construction area | |
| the emission reduction of the unit construction area of enterprise i (i = 1, 2) | |
| the emission reduction efficiency coefficient of enterprise i (i = 1, 2) | |
| emission reduction efforts of enterprise i (i = 1, 2) | |
| cost of emission reduction of enterprise i (i = 1, 2) | |
| cost coefficient of emission reduction of enterprise i (i = 1, 2) | |
| m | carbon trading price of each unit |
| f | the amount of carbon trading |
| the initial carbon emission of unit construction area | |
| the benchmark carbon emission of unit construction area in construction industry (the advanced level in industry) | |
| the profit distribution proportion of subcontractor given by general contractor |
Table 2.
The impact of emission reduction cost coefficient on the optimal decision of the general contractor under pure competition decision-making.
Table 2.
The impact of emission reduction cost coefficient on the optimal decision of the general contractor under pure competition decision-making.
| In the Case of Pure Competition Decision-Making | ||||||
|---|---|---|---|---|---|---|
| λ | ||||||
| 72,000 | 0 | 1.6 | 0 | 209,520 | 120,000 | 329,520 |
| 81,000 | 0 | 1.23 | 0 | 205,520 | 120,000 | 325,520 |
| 90,000 | 0 | 1 | 0 | 202,320 | 120,000 | 322,320 |
| 99,000 | 0 | 0.83 | 0 | 199,701.8 | 120,000 | 319,701.8 |
| 108,000 | 0 | 0.69 | 0 | 197,520 | 120,000 | 317,520 |
Table 3.
The impact of emission reduction cost coefficient on the optimal decision of the subcontractor under pure competition decision-making.
Table 3.
The impact of emission reduction cost coefficient on the optimal decision of the subcontractor under pure competition decision-making.
| In the Case of Pure Competition Decision-Making | ||||||
|---|---|---|---|---|---|---|
| λ | ||||||
| 76,000 | 0 | 1.5625 | 0 | 209,520 | 120,000 | 329,520 |
| 85,500 | 0 | 1.5625 | 0 | 209,520 | 120,000 | 329,520 |
| 95,000 | 0 | 1.5625 | 0 | 209,520 | 120,000 | 329,520 |
| 104,500 | 0 | 1.5625 | 0 | 209,520 | 120,000 | 329,520 |
| 114,000 | 0 | 1.5625 | 0 | 209,520 | 120,000 | 329,520 |
Table 4.
The impact of emission reduction cost coefficient on the optimal decision of the general contractor under co-opetition decision-making.
Table 4.
The impact of emission reduction cost coefficient on the optimal decision of the general contractor under co-opetition decision-making.
| In the Case of Co-Opetition Decision-Making | ||||||
|---|---|---|---|---|---|---|
| λ | ||||||
| 72,000 | 0.43 | 0.51 | 0.30 | 196,554.77 | 136,304.48 | 332,859.25 |
| 81,000 | 0.46 | 0.36 | 0.34 | 194,834.36 | 134,818.58 | 329,652.94 |
| 90,000 | 0.49 | 0.26 | 0.38 | 193,573.18 | 133,596.22 | 327,169.40 |
| 99,000 | 0.51 | 0.20 | 0.42 | 192,616.28 | 132,584.93 | 325,201.20 |
| 108,000 | 0.53 | 0.15 | 0.45 | 191,867.51 | 131,744.22 | 323,611.74 |
Table 5.
The impact of emission reduction cost coefficient on the optimal decision of the subcontractor under co-opetition decision-making.
Table 5.
The impact of emission reduction cost coefficient on the optimal decision of the subcontractor under co-opetition decision-making.
| In the Case of Co-Opetition Decision-Making | ||||||
|---|---|---|---|---|---|---|
| λ | ||||||
| 76,000 | 0.54 | 0.21 | 0.73 | 196,144.58 | 136,242.23 | 332,386.81 |
| 85,500 | 0.51 | 0.24 | 0.52 | 194,722.51 | 134,720.05 | 329,442.56 |
| 95,000 | 0.49 | 0.26 | 0.38 | 193,573.18 | 133,596.22 | 327,169.40 |
| 104,500 | 0.46 | 0.29 | 0.28 | 192,638.98 | 132,734.37 | 325,373.35 |
| 114,000 | 0.44 | 0.31 | 0.22 | 191,876.14 | 132,050.82 | 323,926.96 |
Table 6.
The impact of emission reduction cost coefficient on the optimal decision of the general contractor under pure cooperation decision-making.
Table 6.
The impact of emission reduction cost coefficient on the optimal decision of the general contractor under pure cooperation decision-making.
| In the Case of Pure Cooperation Decision-Making | |||||
|---|---|---|---|---|---|
| 72,000 | 1.56 | 1.60 | 204,315.25 | 144,064.96 | 348,380.21 |
| 81,000 | 1.23 | 1.60 | 202,198.00 | 142,182.21 | 344,380.21 |
| 90,000 | 1.00 | 1.60 | 200,578.59 | 140,601.62 | 341,180.21 |
| 99,000 | 0.83 | 1.60 | 199,296.69 | 139,265.34 | 338,562.03 |
| 108,000 | 0.69 | 1.60 | 198,251.75 | 138,128.46 | 336,380.21 |
Table 7.
The impact of emission reduction cost coefficient on the optimal decision of the subcontractor under cooperative decision-making.
Table 7.
The impact of emission reduction cost coefficient on the optimal decision of the subcontractor under cooperative decision-making.
| In the Case of Cooperation Decision-Making | |||||
|---|---|---|---|---|---|
| 76,000 | 1 | 2.49 | 203,951.80 | 144,049.46 | 348,001.26 |
| 85,500 | 1 | 1.97 | 202,107.12 | 142,104.67 | 344,211.79 |
| 95,000 | 1 | 1.60 | 200,578.59 | 140,601.62 | 341,180.21 |
| 104,500 | 1 | 1.32 | 199,302.22 | 139,397.61 | 338,699.83 |
| 114,000 | 1 | 1.11 | 198,229.08 | 138,403.76 | 336,632.84 |
Table 8.
The impact of emission reduction efficiency coefficient on the optimal decision under pure competition decision-making.
Table 8.
The impact of emission reduction efficiency coefficient on the optimal decision under pure competition decision-making.
| β1 | In the Case of Pure Competition Decision-Making | |||||
|---|---|---|---|---|---|---|
| λ | ||||||
| 0.64 | 0 | 2.44 | 0 | 209,520 | 120,000 | 329,520 |
| 0.72 | 0 | 1.93 | 0 | 209,520 | 120,000 | 329,520 |
| 0.80 | 0 | 1.56 | 0 | 209,520 | 120,000 | 329,520 |
| 0.88 | 0 | 1.29 | 0 | 209,520 | 120,000 | 329,520 |
| 0.96 | 0 | 1.09 | 0 | 209,520 | 120,000 | 329,520 |
Table 9.
The impact of emission reduction efficiency coefficient on the optimal decision under co-opetition decision-making.
Table 9.
The impact of emission reduction efficiency coefficient on the optimal decision under co-opetition decision-making.
| β1 | In the Case of Co-Opetition Decision-Making | |||||
|---|---|---|---|---|---|---|
| λ | ||||||
| 0.64 | 0.49 | 0.41 | 0.38 | 197,899.02 | 137,694.38 | 335,593.40 |
| 0.72 | 0.49 | 0.33 | 0.38 | 197,899.02 | 137,694.38 | 335,593.40 |
| 0.80 | 0.49 | 0.26 | 0.38 | 197,899.02 | 137,694.38 | 335,593.40 |
| 0.88 | 0.49 | 0.22 | 0.38 | 197,899.02 | 137,694.38 | 335,593.40 |
| 0.96 | 0.49 | 0.18 | 0.38 | 197,899.02 | 137,694.38 | 335,593.40 |
Table 10.
The impact of emission reduction efficiency coefficient on the optimal decision under pure cooperation decision-making.
Table 10.
The impact of emission reduction efficiency coefficient on the optimal decision under pure cooperation decision-making.
| β1 | In the Case of Pure Cooperation Decision-Making | ||||
|---|---|---|---|---|---|
| 0.64 | 1.56 | 1.60 | 204,904.43 | 144,699.78 | 349,604.21 |
| 0.72 | 1.23 | 1.60 | 204,904.43 | 140,601.62 | 349,604.21 |
| 0.80 | 1.00 | 1.60 | 204,904.43 | 144,699.78 | 349,604.21 |
| 0.88 | 0.83 | 1.60 | 204,904.43 | 144,699.78 | 349,604.21 |
| 0.96 | 0.69 | 1.60 | 204,904.43 | 144,699.78 | 349,604.21 |
Table 11.
The impact of the emission reduction efficiency coefficient on the optimal decision under pure competition decision-making.
Table 11.
The impact of the emission reduction efficiency coefficient on the optimal decision under pure competition decision-making.
| β2 | In the Case of Pure Competition Decision-Making | |||||
|---|---|---|---|---|---|---|
| λ | ||||||
| 0.48 | 0 | 1.56 | 0 | 209,520 | 120,000 | 329,520 |
| 0.54 | 0 | 1.56 | 0 | 209,520 | 120,000 | 325,520 |
| 0.60 | 0 | 1.56 | 0 | 209,520 | 120,000 | 329,520 |
| 0.66 | 0 | 1.56 | 0 | 209,520 | 120,000 | 329,520 |
| 0.72 | 0 | 1.56 | 0 | 209,520 | 120,000 | 329,520 |
Table 12.
The impact of the emission reduction efficiency coefficient on the optimal decision under co-opetition decision-making.
Table 12.
The impact of the emission reduction efficiency coefficient on the optimal decision under co-opetition decision-making.
| β2 | In the Case of Co-Opetition Decision-Making | |||||
|---|---|---|---|---|---|---|
| λ | ||||||
| 0.48 | 0.49 | 0.26 | 0.59 | 197,899.02 | 137,694.38 | 335,593.40 |
| 0.54 | 0.49 | 0.26 | 0.47 | 197,899.02 | 137,694.38 | 335,593.40 |
| 0.60 | 0.49 | 0.26 | 0.38 | 197,899.02 | 137,694.38 | 335,593.40 |
| 0.66 | 0.49 | 0.26 | 0.31 | 197,899.02 | 137,694.38 | 335,593.40 |
| 0.72 | 0.49 | 0.26 | 0.26 | 197,899.02 | 137,694.38 | 335,593.40 |
Table 13.
The impact of the emission reduction efficiency coefficient on the optimal decision under pure cooperative decision-making.
Table 13.
The impact of the emission reduction efficiency coefficient on the optimal decision under pure cooperative decision-making.
| β2 | In the Case of Pure Cooperation Decision-Making | ||||
|---|---|---|---|---|---|
| 0.48 | 1.00 | 2.49 | 204,904.43 | 144,699.78 | 349,604.21 |
| 0.54 | 1.00 | 1.97 | 204,904.43 | 144,699.78 | 349,604.21 |
| 0.60 | 1.00 | 1.60 | 204,904.43 | 144,699.78 | 349,604.21 |
| 0.66 | 1.00 | 1.32 | 204,904.43 | 144,699.78 | 349,604.21 |
| 0.72 | 1.00 | 1.11 | 204,904.43 | 144,699.78 | 349,604.21 |
Table 14.
The impact of different carbon trading prices on the optimal decision under pure competition decision-making.
Table 14.
The impact of different carbon trading prices on the optimal decision under pure competition decision-making.
| m | In the Case of Pure Competition Decision-Making | |||||
|---|---|---|---|---|---|---|
| λ | ||||||
| 24 | 0 | 1.13 | 0 | 200,826 | 120,000 | 320,826 |
| 27 | 0 | 1.34 | 0 | 204,970.5 | 120,000 | 324,970.5 |
| 30 | 0 | 1.56 | 0 | 209,520 | 120,000 | 329,520 |
| 33 | 0 | 1.81 | 0 | 214,474.5 | 120,000 | 334,474.5 |
| 36 | 0 | 2.07 | 0 | 219,834 | 120,000 | 339,834 |
Table 15.
The impact of different carbon trading prices on the optimal decision under co-opetition decision-making.
Table 15.
The impact of different carbon trading prices on the optimal decision under co-opetition decision-making.
| m | In the Case of Co-Opetition Decision-Making | |||||
|---|---|---|---|---|---|---|
| λ | ||||||
| 24 | 0.49 | 0.19 | 0.27 | 192,674.17 | 132,539.87 | 325,214.03 |
| 27 | 0.49 | 0.23 | 0.32 | 195,167.19 | 134,999.83 | 330,167.05 |
| 30 | 0.49 | 0.26 | 0.38 | 197,899.02 | 137,694.38 | 335,593.40 |
| 33 | 0.49 | 0.30 | 0.44 | 200,869.65 | 140,623.42 | 341,493.07 |
| 36 | 0.49 | 0.35 | 0.50 | 204,079.08 | 143,786.98 | 347,866.07 |
Table 16.
The impact of different carbon trading prices on the optimal decision under pure cooperation decision-making.
Table 16.
The impact of different carbon trading prices on the optimal decision under pure cooperation decision-making.
| m | In the Case of Pure Cooperation Decision-Making | ||||
|---|---|---|---|---|---|
| 24 | 0.72 | 1.15 | 197,735.56 | 137,601.28 | 335,336.8 |
| 27 | 0.86 | 1.37 | 201,161.19 | 140,993.86 | 342,155.1 |
| 30 | 1.00 | 1.60 | 204,904.43 | 144,699.78 | 349,604.2 |
| 33 | 1.16 | 1.84 | 208,965.27 | 148,719.04 | 357,684.3 |
| 36 | 1.32 | 2.11 | 213,343.73 | 153,051.64 | 366,395.4 |
Table 17.
The impact of the benchmark carbon emission of unit construction area on the optimal decision under pure competition decision-making.
Table 17.
The impact of the benchmark carbon emission of unit construction area on the optimal decision under pure competition decision-making.
| es | In the Case of Pure Competition Decision-Making | |||||
|---|---|---|---|---|---|---|
| λ | ||||||
| 0.62 | 0 | 1.56 | 0 | 201,096 | 120,000 | 321,096 |
| 0.70 | 0 | 1.56 | 0 | 205,308 | 120,000 | 325,308 |
| 0.78 | 0 | 1.56 | 0 | 209,520 | 120,000 | 329,520 |
| 0.86 | 0 | 1.56 | 0 | 213,732 | 120,000 | 333,732 |
| 0.94 | 0 | 1.56 | 0 | 217,944 | 120,000 | 337,944 |
Table 18.
The impact of the benchmark carbon emission of unit construction area on the optimal decision under co-opetition decision-making.
Table 18.
The impact of the benchmark carbon emission of unit construction area on the optimal decision under co-opetition decision-making.
| es | In the Case of Co-Opetition Decision-Making | |||||
|---|---|---|---|---|---|---|
| λ | ||||||
| 0.62 | 0.49 | 0.26 | 0.26 | 193,573.18 | 133,596.22 | 327,169.40 |
| 0.70 | 0.49 | 0.26 | 0.26 | 195,736.10 | 135,645.30 | 331,381.40 |
| 0.78 | 0.49 | 0.26 | 0.26 | 197,899.02 | 137,694.38 | 335,593.40 |
| 0.86 | 0.49 | 0.26 | 0.26 | 200,061.94 | 139,743.46 | 339,805.40 |
| 0.94 | 0.49 | 0.26 | 0.26 | 202,224.86 | 141,792.54 | 344,017.40 |
Table 19.
The impact of the benchmark carbon emission of unit construction area on the optimal decision under pure cooperation decision-making.
Table 19.
The impact of the benchmark carbon emission of unit construction area on the optimal decision under pure cooperation decision-making.
| es | In the Case of Pure Cooperation Decision-Making | ||||
|---|---|---|---|---|---|
| 0.62 | 1.00 | 1.11 | 200,578.59 | 140,601.62 | 341,180.21 |
| 0.70 | 1.00 | 1.11 | 202,741.51 | 142,650.70 | 345,392.21 |
| 0.78 | 1.00 | 1.11 | 204,904.43 | 144,699.78 | 349,604.21 |
| 0.86 | 1.00 | 1.11 | 207,067.35 | 146,748.87 | 353,816.21 |
| 0.94 | 1.00 | 1.11 | 209,230.26 | 148,797.95 | 358,028.21 |
© 2019 by the authors. Licensee MDPI, Basel, Switzerland. This article is an open access article distributed under the terms and conditions of the Creative Commons Attribution (CC BY) license (http://creativecommons.org/licenses/by/4.0/).
Share and Cite
MDPI and ACS Style
Jiang, W.; Lu, W.; Xu, Q. Profit Distribution Model for Construction Supply Chain with Cap-and-Trade Policy. Sustainability 2019, 11, 1215. https://doi.org/10.3390/su11041215
AMA Style
Jiang W, Lu W, Xu Q. Profit Distribution Model for Construction Supply Chain with Cap-and-Trade Policy. Sustainability. 2019; 11(4):1215. https://doi.org/10.3390/su11041215
Chicago/Turabian StyleJiang, Wen, Wenfei Lu, and Qianwen Xu. 2019. "Profit Distribution Model for Construction Supply Chain with Cap-and-Trade Policy" Sustainability 11, no. 4: 1215. https://doi.org/10.3390/su11041215
Note that from the first issue of 2016, this journal uses article numbers instead of page numbers. See further details here.