Measuring Consumer Preferences and Willingness to Pay for Coffee Certification Labels in Taiwan


1
Department of International Business, Chang Jung Christian University, No. 1, Changda Rd., Gueiren District, Tainan City 71101, Taiwan
2
Department of Applied Economics, National Chung Hsing University, No. 250, Kuo Kuang Rd., Taichung 40227, Taiwan
3
Department of Health Diet and Industry Management, Chung Shan Medical University, No. 110, Sec. 1, Jianguo N. Rd., Taichung City 40201, Taiwan
4
Department of Medical Management, Chung Shan Medical University Hospital, No. 110, Sec. 1, Jianguo N. Rd., Taichung City 40201, Taiwan
*
Author to whom correspondence should be addressed.
Sustainability 2019, 11(5), 1297; https://doi.org/10.3390/su11051297
Submission received: 8 December 2018
/
Revised: 28 January 2019
/
Accepted: 24 February 2019
/
Published: 1 March 2019
(This article belongs to the Special Issue Marketing of Sustainable Food and Drink)
Abstract
:Sustainability certification labels have become an important tool for aiding consumers in evaluating food safety, health concerns, and environmental friendliness. Few studies have explored the attributes of consumers’ environmental consciousnesses from the perspective of environmental concerns; hence, we focus on that lack. Our study contributes to the need to better understand consumer attention to sustainability information when making coffee certification attribute choices. We aimed to explore the importance that consumers attach to coffee certification attributes paid to these attributes while choosing and to willingness to pay (WTP). There were 650 questionnaires completed by those who had purchased coffee beans habitually in Taiwan; after factoring out the invalid questionnaires (i.e., those with omitted answers, incomplete answers, or those in which answers to all the questions received the same scale points were all deemed as invalid and removed), 568 valid ones were collected with a recovery rate of 87.4%. The results indicate that the respondents’ WTP attributes ranked from highest to lowest are traceability, organic, graded, environmentally friendly, and fair-trade certifications. This study provides insights into how consumers’ preferences relate to selection of coffee certification attributes.
1. Introduction
Coffee is a beverage consumed extensively and is the second most-traded commodity in the world (International Coffee Organization (ICO), 2018). A report on coffee issued by ICO (2017/18) [1] for the most recent fiscal year estimated worldwide coffee production at 159.6 billion cases, an increase of 1.2% over the 2016/17 fiscal year. In 2018, the Taiwan Beverage Association [2] highlighted that Taiwan’s coffee consumption grew at a compounded annual growth rate of 5.9% from 2013 to 2017. In 2017, total coffee consumption reached 36,000 metric tons. In 2015, coffee bean imports grew by 61% compared to 2011. Taiwanese drink 2.85 billion cups of coffee a year, averaging 122 cups of coffee per person, per year! The demand for coffee continues to rise. In addition, the value of coffee in Taiwan in 2016 included revenues of 18.8 billion new Taiwan dollars (NTD) (1 NTD = 0.033 USD) from chain stores and 23 billion NTD from cafés. The total amount is about 66 billion NTD, and the average person drinks at least one cup of coffee per day, marking the annual growth in Taiwan’s demand for coffee.
Coffee retailers, and consumers alike have begun to advocate more environmentally friendly production methods and encourage the coffee industry as a whole to use them. Moreover, they likewise promote profitable operating models for coffee producers within a context of environmental awareness, social benefits, and global sustainable development reflections [3,4,5]. The coffee market has begun to introduce certification labels, such as those provided by fair trade, Rainforest Alliance, U.S. certified organic, and UTZ (UTZ Certified is a program and a label for sustainable farming, which covers good agricultural practices, farm management, and the environment) along with the trends of increasing certification label programs for coffee producers and moving toward multiple certifications [6]. Coffee packaging usually has several certification labels [7], which are important for consumers in evaluating food health, safety, and eco-friendliness [8].
As consumer demand for safe and healthy food has increased over time, studies on the subject of consumers’ attitudes toward products bearing certification labels have been undertaken. Johe and Bhullar [9] found that when organic products feature an organic certification label, a consumer’s purchasing intention increases. Batte et al. [10] indicated that organic food certification and labeling increases consumers’ purchasing intentions and concurs that these foods are also relatively safe and secure. Addor and Grazioli [11] proposed that a product traceability not only increases the value added but also makes it more trustworthy, and at the same time protects consumer’s rights with an official seal of quality assurance. With organic labels on products, they will be considered more appealing and popular than unlabeled products [12,13]. A study by Moser [14] suggested that German consumers tend to purchase foods in the actual production location or in the general region, as they are transported for a short distance, thus reducing their impact on the environment. Laureti and Benedetti [15] researched Italian consumers’ purchases of environmentally friendly foods. The results indicate that Italian consumers who are concerned about animal welfare, soil pollution, and deforestation are more likely to purchase organic products. According to a study by Bernard et al. [16], eco-friendly labels indeed increase consumers’ purchasing intention. Chen and Huang [17] indicate that product traceability reduces consumers’ uncertainty about the product and increases their purchasing intention.
Moreover, product choice involved consumer perceptions, expectations, social, and psychological factors, financial conditions, and intrinsic/extrinsic product characteristics [18]. Samoggia and Riedel indicate that the key determinants for coffee consumption are personal preferences, economic attributes, product attributes, the context of consumption, socio-demographic factors, and coffee sustainability [19]. Schäufele and Hamm indicate that consumers who had the highest expenditure shares for organic wine showed strong pro-environmental attitudes and a preference for sustainable products [20]. However, for the low-income consumer cluster, the price of organic wine seemed to be an effective barrier despite their positive attitudes toward environmentalism. Chen, Chen and Tung explored consumer behavior of the intention to purchase green products, which includes environmental attitudes, product attitudes, social influence, and perceived monetary value positively affected purchase intention [21].
Price is a determining factor, and is a primary extrinsic factor affecting purchase intention [22]. Ling [23] noted that green products (i.e., environmentally friendly products) are more expensive because of their production processes, which are costlier—from raw materials to certifications. Therefore, price is the most significant barrier to green purchasing consumption behavior [24]. Research by Laureiro and Lotade [25] explores consumers’ willingness to pay (WTP) for three certified sustainable coffees, which includes fair-trade, shade-grown, and organic coffee certifications. The results suggest that U.S. consumers were willing to pay a premium of $0.22 cents/pound over the regular price of $6.50 per pound for fair-trade coffee. The same study also estimated price premiums of $0.20 and $0.16 per pound, respectively, for shade-grown and organic coffees. There is also research that explores which quality attributes influence consumers’ WTP for premium coffee [26,27,28,29], the results of which found that coffee tastings, premium coffee fairs, country of origin, variety, elevation at the place of origin, and the ranking of sustainability certification labels have had positive impacts on WTP for premium coffee.
As previously mentioned, existing research on certified coffee has focused on fair-trade labels, for example, Hainmueller et al. [30], explore consumer demand for fair-trade labels in detail. Koppel and Schulze [31] explore the determinants of consumers’ WTP for fair-trade products, yet few studies assess consumers’ trade-offs between fair trade and sustainability and organic certification [28,32], or fair-trade and shade-grown coffee. Therefore, in addition to distinguishing the attributes of each coffee certification, i.e., fair-trade, organic, environmentally friendly, and traceability, this study incorporates the coffee grading system and adds in a consumer’s WTP for coffee certification.
In evaluating consumers’ WTP for certified coffee, there is no true open market valuation for goods with non-market value. Therefore, it must be measured with non-market valuation methods. Common non-market evaluation methods can be separated into two types: revealed preference (RP) and stated preference (SP). RP is a direct survey of actual choice behavior or outcomes in the target market. Its common evaluation methods include the travel cost method and the hedonic price model (HPM). The SP method can be used to obtain preference data by investigating the results that have not yet occurred in the target market, including the contingent valuation method (CVM) and the choice experiment method (CEM). The CVM is a questionnaire survey that inquires the respondents’ maximum WTP or WTP for an improvement to the environment or resource protection measure [33,34,35,36,37], or willingness to accept (WTA) [34,37,38], characterized by an understanding of consumer preferences and ways of estimating respondents’ WTP or WTA for non-market goods. For example, Egyptian consumers’ WTP for low-carbon labeled products [39]; Thai consumers’ WTP for organic products [40]; consumer preference and WTP for certified Atlantic salmon, [41]; Taiwanese consumers’ perception of, and WTP for, certified organic fresh milk [42]. However, certain biases may affect the CVM, which includes the respondents’ need to consider their personal interests, causing them to deliberately conceal their true preference for non-market goods, leading to over- or under-valuation caused by “strategic bias.” When a separate inquiry is made with other related goods, the “embedding effect” results in an evaluation of the two estimates. The differences in questionnaire design, the “information content effect” caused by a lack of explanatory information and alternatives provided by the research subject. Additionally, when utilizing the “dual boundary dichotomous choice” approach, the respondent may be biased with respect to a particular research subject. The subjective method of ignoring the actual content and the “acquiescence bias” that leads to a tendency to respond similarly to all questions; the “bidding games” that set a starting price for the good, leading to the respondents’ evaluation being based on a “starting point bias” [43,44]. In recent years, CEM has gradually become an important evaluation tool for the measurement of non-market value [45].
The biggest difference between CEM and the contingent valuation method (CVM) is that CVM can only treat goods for value analysis “holistically,” while CEM can be used to differentiate and analyze the multiple attributes of goods or services provided [46]. Because of the multiple attributes and levels of assessment capability of CEM, different alternatives are combined for important characteristics related to non-market goods or services. A choice set is selected through varying hypothetical scenarios, allowing respondents to choose appropriate alternatives based on their own personal preferences, while avoiding biases in the assessment [47,48]. Hanley et al. [49] suggest that CEM is the most commonly used method for estimating product attributes. CEM can simulate real-life purchasing conditions and evaluate multiple attributes, which is useful for assessing the relationship between alternatives [50]. Due to the foregoing advantages, CEM has been widely used in non-market value evaluation recently. For example, research by Thøgersen and Nielsen [51] explores whether the use of carbon footprint labels displayed as traffic lights in CEM will affect consumers’ choice of ground coffee or not. The results show that (1) the greater the use of the carbon footprint labels, the higher the consumer’s attention to the environment; and (2) that color does increase the effectiveness of carbon labeling. Risius et al. [52] explore consumer perceptions of sustainable aquaculture and assess their preferences for sustainable aquaculture products; Lombardi et al. [53] explore whether product information influences consumer attitudes toward environmentally friendly, carbon-neutral milk; Aoki et al. [54] examine Japanese and Thai consumers’ preferences for cheap American rice; research by Paci et al. [55] explore consumers acceptance of fresh fish burgers and WTP. Torquati et al. [56] used a discrete choice experiment to explore consumers acceptance of a new food product and WTP. Wang, et al. [57] used CEM to investigate 844 Chinese consumers’ WTP for pork that was characterized by four attributes: (1) food safety certification labels, (2) location-of-origin, (3) “free from veterinary drug residues” label, and (4) price. CEM, since it can use simple, current attributes to make consumers aware about the situation and integrate more realistic combinations of attributes, this study uses CEM to explore consumers’ WTP for certified coffee.
The aim of this study is to explore consumer choice behavior for sustainable certified coffee alternatives focusing on how consumers process product attributes when faced with a choice of coffee certification alternatives. Using a choice experiment to estimate the non-use values of coffee certification alternatives. The study is divided into four parts. In Part 1, we study consumers’ preferences and WTP based on choice behavior for coffee. In Part 2, we study the relationship between stated attribute importance, including sustainability labels and price. In Part 3, we utilize CEM and infer from it the consumption attributes of consumer preference for coffee certification attributes, along with their willingness to pay, through the random utility model (RUM). In Part 4, the results outlined above are provided to the government or interested organizations as a referential basis for strategic policy, or for encouraging market-based certification alternatives.
2. Materials and Methods
2.1. The Construction of Utility Function Model for the Preference of Coffee Label Certification
First, the “coffee certification attribute utility model” was constructed for this project utilizing CEM. Second, multinomial Logit (MNL), and random parameter Logit (RPL) models, created to estimate the utility function of certification label preferences. MNL provides an analysis benchmark that can be used to assess only the mean preference of respondents because the parameters of all respondents are assumed to be fixed. Therefore, this study analyzes preferences and WTP values of respondents with different backgrounds (sex, age, education, marital status and income) based on the RPL model.
CEM is a standard RUM. Therefore, it is used to explore the MWTP of all attributes and levels [58] (Shoyama et al., 2013). In the binary model, the utility of the nth respondent is assumed to be the various options that he faces ), and the options are used to maximize the utility, as shown in Equation (1-1):
where represents the attribute of the nth respondent facing the ith option, represents the observable part of the utility function, and represents the residual item, i.e., the unobservable part.
This study intends to explore preference differences and WTP of respondents from different social and economic backgrounds considering various attributes and levels. Therefore, the RPL model is used for analysis. The overall utility of the RPL model is represented as:
where is the utility coefficient of observable variable and respondent characteristic , and represents the respondent’s preference; and is the residual item.
To estimate the relative importance of all attributes in the product in terms of value, it is assumed that the degrees of various attributes in the alternative plan j remain the same. Then the marginal change of the WTP of the kth attribute can be given by Equation (1-3).
2.2. Preference Selection of Coffee Certification Attributes
When coffee certification attributes undergo a process of selection, those most relevant for coffee certification must be selected as representative. It is, however, necessary to avoid selecting excess attributes that make the questionnaire difficult to answer and that, in turn, affect the accuracy of the resulting analysis. This study collated the relevant literature and found that the country of origin, variety, altitude of origin, and sustainability certification labels have a positive effect on the price of premium coffee [26,27,28,29]. Due to the many factors affecting the price of coffee, this study only discusses the coffee certification attributes. Therefore, this study selected five representative coffee certification attributes, namely fair-trade, organic, environmental friendliness, grades, and traceability. The attributes and levels of coffee certifications are indicated in Table 1.
2.3. Choice Sets for Coffee Certification Attributes and Levels
To facilitate respondents answering the questionnaire, this study reduced the 160 () combinations to 12 combinations of alternative scheme, and one current situation scheme through an orthogonal design. After the current situation scheme was included in each group’s choice set, each one contained two alternative schemes with random numerical labels and one current situation scheme. Each questionnaire contained three choice sets drawn from it, for a total of 22 versions of the questionnaire. Through the design process and combination of the aforementioned choice set, the statistical efficiency of the choice set design was improved. Therefore, after finalizing the total number of samples, each respondent could randomly select a version of the questionnaire to fill out.
2.4. Survey Design
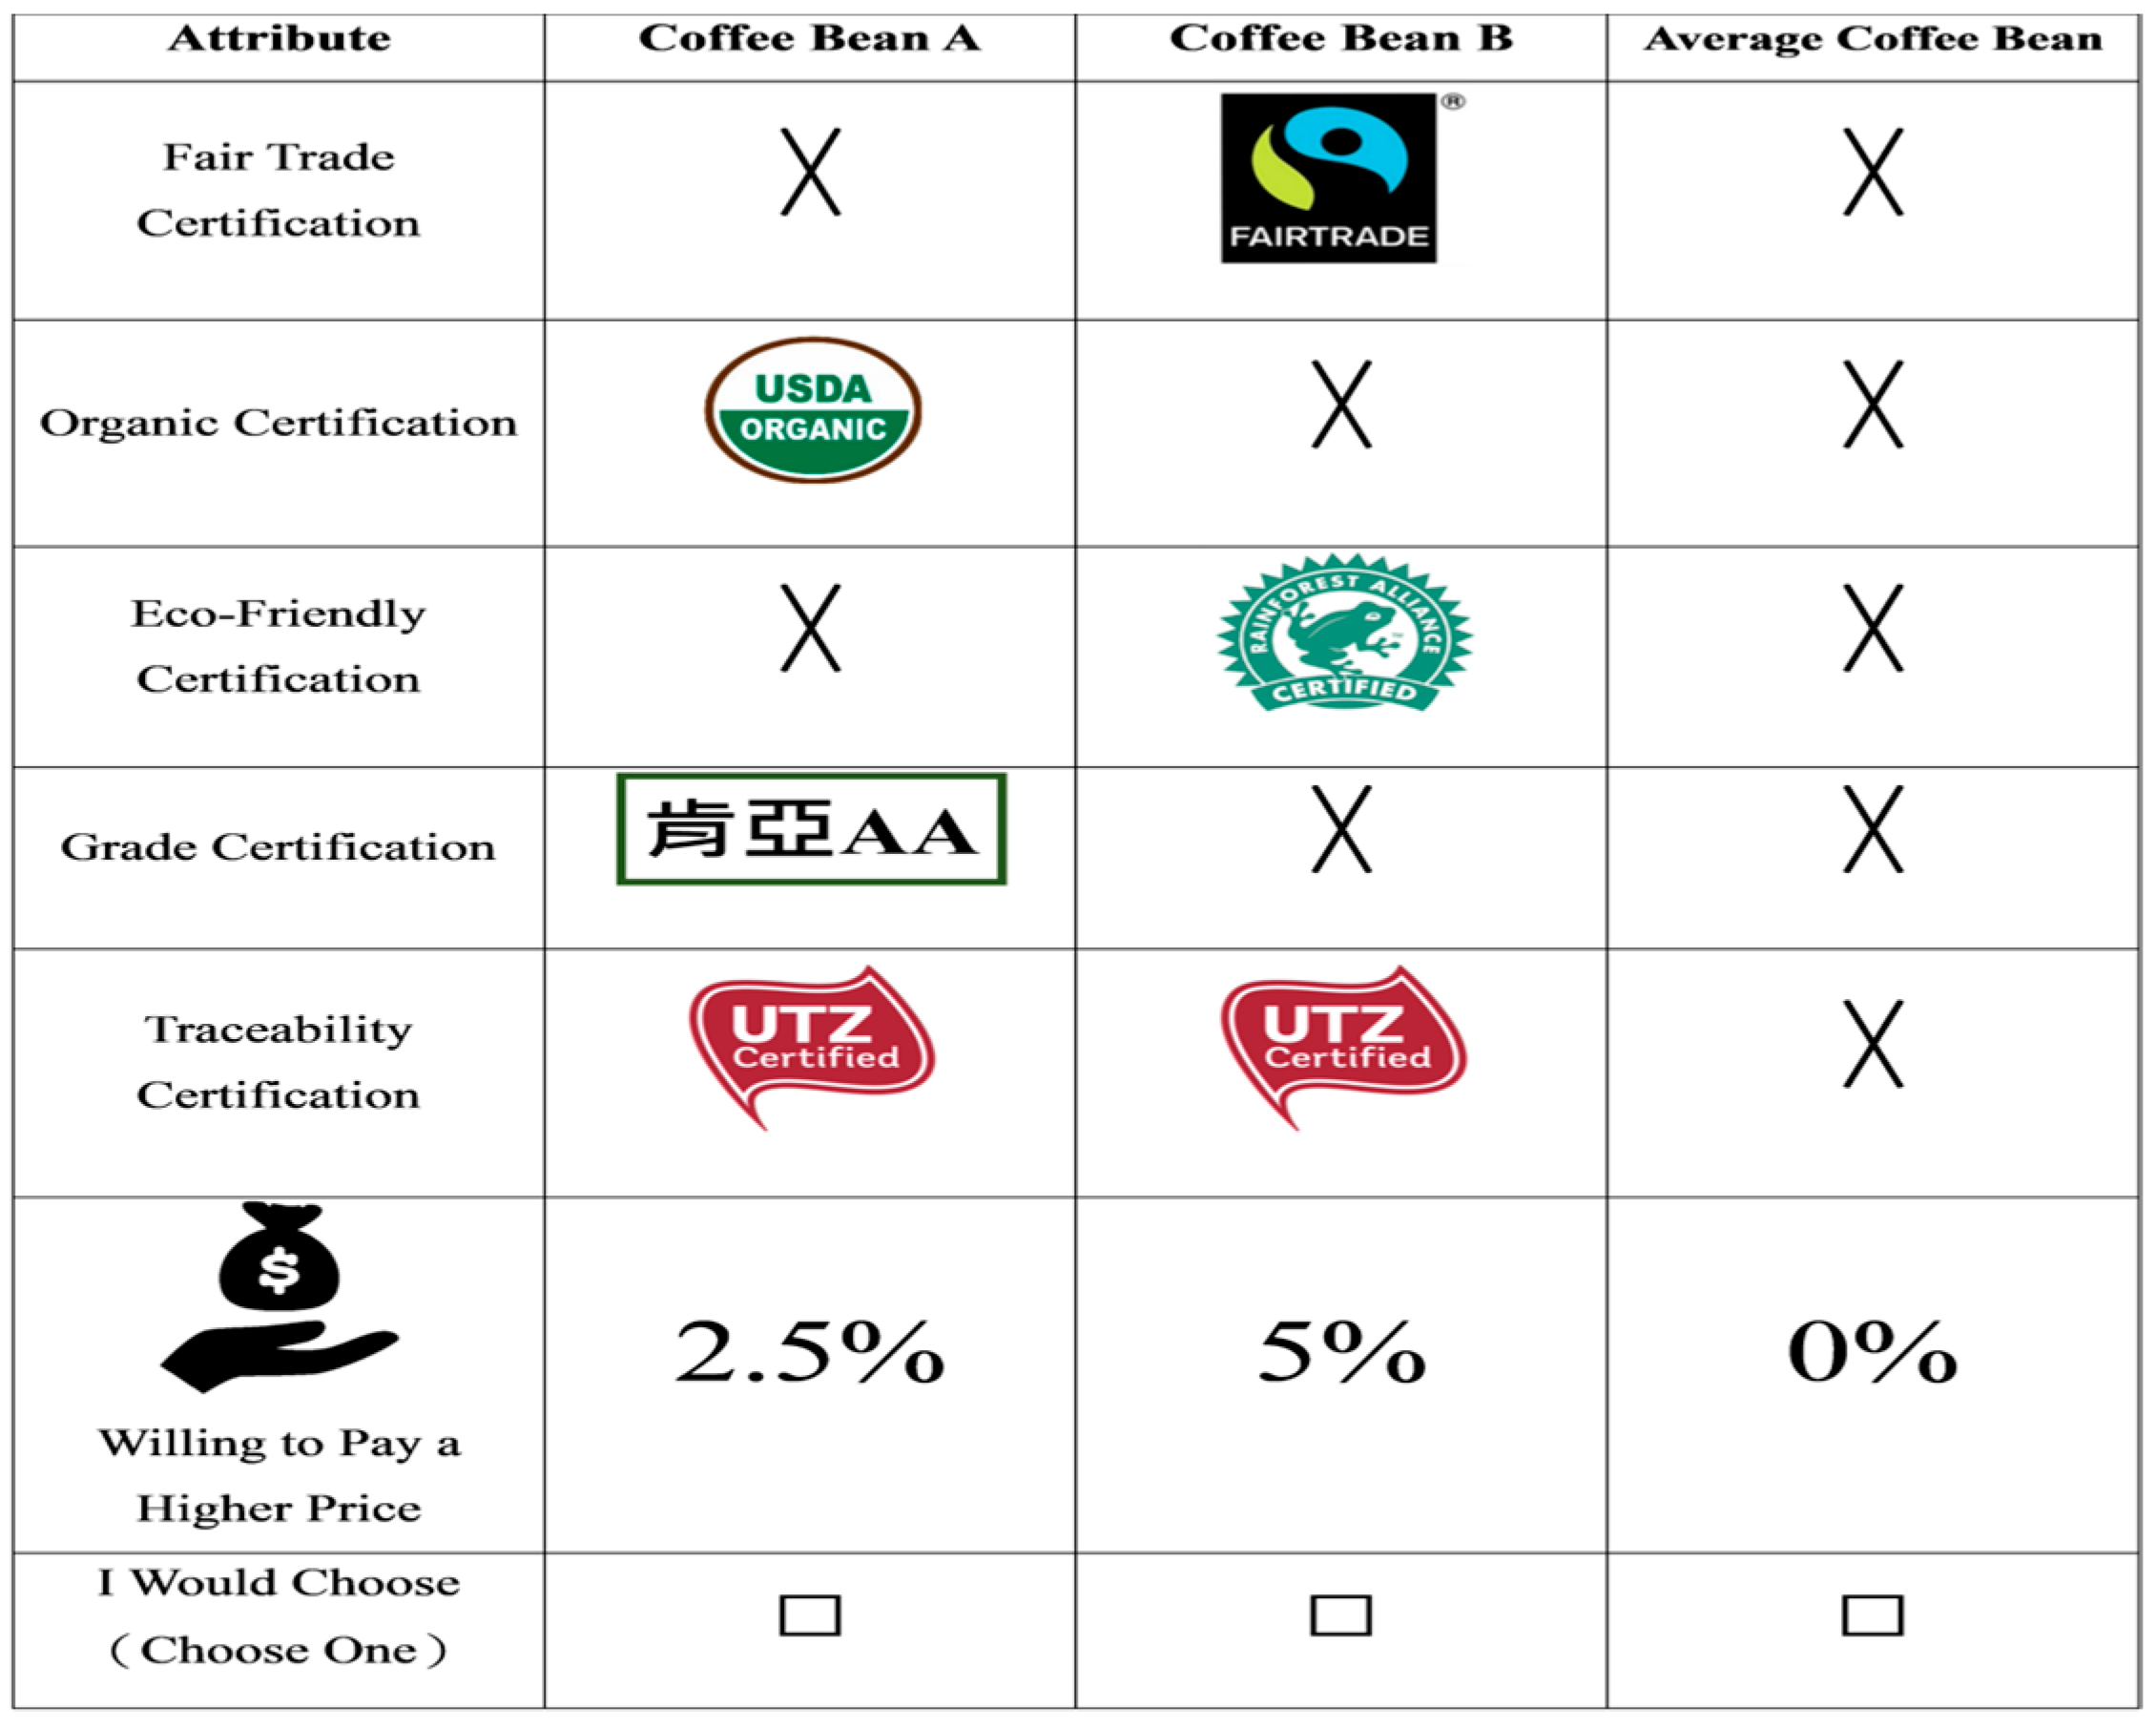
The formal questionnaire is directed at “consumers who have purchased coffee beans in the past six months” and is divided into three parts, the first is the respondents’ level of emphasis on the five coffee certification attributes and their coffee bean purchasing habits. The second part assumes that the respondents are willing to buy coffee products. Besides generic coffee beans (with no certifications), product offerings also include, fair-trade, organic, environmentally friendly, grade, and traceability certified products. The characteristics of the beans, together with their WTP, give the respondents choices (as shown in Figure 1). The third part examines the socioeconomic background data of the respondents, including gender, age, education level, marital status, and average monthly salary.
2.5. Sample Size and Composition
To understand the consumption preferences for coffee certification attributes, this study utilized the purposive sampling method to distribute paper questionnaires through personal interviews. First, the study conducted a pre-test questionnaire, with the aim of understanding consumers’ willingness to increase the price of sustainability certified coffee. The questionnaires were issued from 1 February 2018 to 20 February 2018 to consumers who have their own coffee habits and had purchased coffee beans in the past six months. During the first stage, 210 questionnaires were issued, out of which 186 were valid, and the effective questionnaire recovery rate was 88.57%. After consumers’ WTP higher price of coffee certification was understood, a formal questionnaire was issued between 1 March 2018 and 30 June 2018, to those consumers who had purchased coffee beans in coffee shops or cafés. A total of 650 questionnaires were distributed. After the invalid ones were excluded, 568 valid questionnaires were accumulated. The effective questionnaire recovery rate was 87.4%. In terms of the socioeconomic background of the respondents, the majority were male (54.1%). The largest concentration was in the 46–55 age range (accounting for 31.2%), followed by 36–45 (22.2%), indicating that consumers of the middle-aged group purchased coffee beans more habitually than consumers of other ethnic groups. In terms of educational level, the proportion of respondents with a university education was highest (accounting for 57.2%). In terms of the respondents’ marriage status, most respondents are married (65.3%). Lastly, in terms of the average monthly salary of individuals, 30,001–50,000 yuan (34.5%) was reported by the largest number of individuals, the second largest group fell into the 50,001–70,000-yuan range (25.7%), followed by the cohort making under 30,000 yuan (20.8%).
3. Results
3.1. The Importance Attached to the Certification Attributes
Based on the content of the questionnaire, consumers were asked to arrange each certification attribute according to their preference on a scale from 1→5; with 1 being worth 5 points, 2 worth 4 points, and so on. Averaging the scores for respondents’ valuations for each individual attribute resulted in traceability having the highest score with (4.95 points), followed by organic certification (3.70 points), grade certifications (2.75 points), and environmentally friendly certifications (2.19 points) and, finally, fair-trade certifications (1.41 points).
3.2. Multinomial Logit (MNL) Analysis Results
A coffee certification attribute utility model was established in this study that was based on the random utility function (1-1), to understand consumers’ purchasing preferences for coffee products. The definition of Uij is the coffee product selections that the i respondent was given different attributes and select the utility of the j program. The corresponding utility function is as follows: (4):
where i = 1, 2, 3, …, 568, means the total number of samples is 568; j = 1, 2, 3, …, 13, means the 13 selections of coffee certification attributes.
The (4) formula is used to estimate the coefficient value of each attribute variable through the multinomial Logit (MNL) model of NLOGIT 5.0, and then the coefficient value is substituted back into (1-4) to find each attribute. For the average of the WTP, at higher-price attributes, the results are summarized in Table 2. To analyze the consumer’s preference for coffee with certification attributes, it is evident from the results in Table 2 that the sign of each attribute variable coefficient value is the same as the expected symbol of the institution. The coefficient values of fair trade (FTC), organic (ORG), environmentally friendly (EF), graded (GR), and traceability (PE) certifications are all positive, and thus it can be inferred that the aforementioned attribute level for each additional unit increases consumer utility. The coefficient value of the willingness to purchase limit (FUND) attribute is negative, implying that for each additional price level, consumer utility will be reduced, which complies with expected consumer economic behavior, where maximum utility should be achieved with the lowest cost.
3.3. Random Parameter Logit (RPL) Analysis Results
Since multinomial logit (MNL) assumes that the parameters in the respondents are fixed, the average preference of the respondents is evaluated, while the RPL is based on the attribute parameters of the respondents taking the form of a normal distribution, where the differences in preferences for the coffee certification attributes can be evaluated. The empirical results in Table 3 suggest that the evaluation results of MNL and RPL are similar. Respondents prefer products with certification labels. The respondents have positive and significant preferences for traceability, organic, grade, environmentally friendly certifications, as well as fair-trade certification. The WTP attributes are fair-trade (2.59%), organic (5.32%), environmentally friendly (3.68%), grade (4.09%), and traceability (6.48%). The results of this analysis contrast with those of Loureiro and Lotade [25], who found that consumers are willing to pay higher prices for fair-trade certified coffee. Janssen and Hamm [59] pointed out that there are issues with the third-party certified product labels containing information asymmetry, and label recognition. In contrast, common and familiar certification labels are more effective. Therefore, this study presumes that the difference in results are due to the fact that the fair-trade certification is unfamiliar to Taiwanese consumers. Consequently, respondents revealed lower preferences for that certification. However, the preferences for the traceability, organic certification, and graded certification were higher in Taiwan.
3.4. Investigation into the WTP Discrepancy for Certified Coffee in Respondents of Differing Socioeconomic Backgrounds
Through RPL, each respondent’s preference for each attribute can be obtained. The discrepancy in the random variables of WTP value is discussed based on the respondents’ social class backgrounds and consumption habits. The results are displayed in Table 4. WTP for grade-certified coffee ranked highest with the age 65 and over demographic (4.10%); those with a master’s degree or higher ranked significantly higher than other educational demographics in their preference for certified organic (5.59%) and graded (4.10%) coffees. Respondents with monthly incomes above 90,000 yuan in income had the highest amount of WTP for grade-certified coffee (4.13%).
As an overall observation, respondents with higher academic credentials had higher WTP for coffee with the certified organic label—results which are identical to Kavoosi Kalashami et al. [60]. It was also pointed out in the aforementioned study that the more educated consumers have a higher degree of preference for organic vegetables. Respondents with higher age, education, and income have higher WTP for coffee with the grade certification. Past studies on environmental issues and WTP showed significant differences in terms of income. For example, Zhao et al. [61] explored consumer perceptions and purchase intentions for carbon footprint-certified products. The research on WTP suggests that occupation and income have a significant effect on WTP for products carrying the carbon footprint label; however, the results of the present research differed quite significantly in terms of highest education level attained.
4. Discussion
This study provides insights into how consumer preference selection is affected by coffee certification attributes. Attention to sustainability labels on food products is a necessary precursor to processing the information leading to informed sustainable product choices.
First, the results indicate that the most important coffee certification attribute is traceability, followed by organic, graded, environmentally friendly and, finally, fair-trade certification. Next, evaluating coffee certifications with MNL and RPL revealed significant preferences. The respondents’ WTP attributes ranked from highest to lowest were traceability, organic, graded, environmentally friendly, and fair-trade certifications. This study used the RPL analysis to show that respondents have a positive preference for traceability, organic, graded, environmentally friendly, and fair-trade certifications. Respondents with higher education have a higher WTP for the certified organic label [62,63,64]. Older and more educated respondents with higher incomes had a higher WTP for coffee bearing the graded certification label [64,65].
Second, the findings confirm a number of observations from previous research. First, it is evident from the results that the most highly valued coffee certification attributes for consumers are traceability and organic certifications, with less value being placed on fair trade. The results of this analysis are different from those of Sepúlveda et al. [66], which indicated that consumers in Spain and Colombia valued fair-trade certifications most. One might plausibly presume that this difference existed in the Taiwanese case because the product certifications most often seen at present are traceability, organic, and grade. The role and effect of fair-trade certifications are relatively unclear to Taiwan’s consumers, perhaps resulting in the discrepancy in ratings.
Third, in terms of the individual attribute levels of the coffee certifications, the above five attribute levels are significant at the 1% significance level, indicating that they might significantly affect Taiwanese consumers’ choices, and is congruent with prior research [26,27,28,29]. Country of origin, variety, elevation at the point of origin, and sustainability certification labels all have a positive effect on consumer WTP. Indeed, when the 1% significance level of alternative specific constant (ASC) is a negative number, as it was in this study, it indicates that the respondents prefer to choose coffee beans bearing certification labels.
5. Conclusions
5.1. Managerial Implications
Based on the foregoing analysis, consumers prefer coffee products with pertinent certification markings and clear sources and are willing to pay more to purchase them. In response to consumer preference for production history and organic certification, it is recommended that the government make its certification process more transparent to reassure the consumer. In terms of grade certifications, there is currently no clear grading system in the Republic of China (Taiwan). It is hoped that markets, as they have elsewhere [67], will generate a comprehensive grading system be established based on the quality of coffee beans and clear markings be placed on the outer packaging to aid consumers during purchase as a referential basis. This study postulates that the reason certain consumers do not have a significant preference over environmentally friendly and fair-trade certifications may be due to less familiarity, or that they believe such certifications are not relevant to them. In fact, sustainable development should not be limited to Taiwan’s common organic and traceability certifications, but more comprehensive development should be undertaken in this regard. Therefore, likewise, it is recommended that the government promote the environmentally friendly and fair-trade certifications in addition to improving the situation of producers and maintaining ecological standards for a clean and safe environment, which is more conducive to consumer’s purchasing needs [68]. On the part of the manufacturers, it is recommended that, when these kinds of coffee products are sold, the description of the outer package of the product should be emphasized, or an instruction manual of the product in question may be placed in the store, permitting consumers to learn the differences between certified and general products in order to improve consumer trust and further increase their WTP and purchasing intentions.
5.2. Limitations and Future Research
There were certain limitations in the process of this research. Expanding its scope in the future, should make its structure completer and more comprehensive. This paper puts forth the following recommendations for research conclusions and limitations:
- This study mainly discusses coffee products in the form of coffee beans, but there are many types of coffee, including commercially available 3-in-1 coffee, filter-type coffee, and packaged coffee drinks. It is recommended that follow-up studies should compare the differences between the various types of coffees.
- This study only sets five coffee certification attributes, but there are many other coffee-related attributes that could be added, such as the degree of bean roast or kosher certifications, to better understand the consumer’s WTP a premium and the preferences for different attributes.
- This study only discussed the consumer side, thus the results only reflect the current consumer preferences for coffee certification and WTP. Follow-up research can explore the industry level to better understand the coffee-related certification attributes as well as the views of different participants in the process, and then compare the differences from there.
Author Contributions
The three coauthors contributed together to the completion of this article. C.-C.L., the first author, analyzed the data and drafted the manuscript; C.-W.C. contributed to reviewing and revising the literature; and H.-S.C. acted as corresponding author throughout the revision and submission process.
Funding
This research did not receive any specific grant from funding agencies in the public, commercial, or not-for-profit sectors.
Acknowledgments
First of all, I would like to express my deepest gratitude to Wan-Chieh Chen, who provided the statistics used in my thesis. Second, I would like to express my heartfelt thanks to all the experts who have taken the time to review this article and provide valuable comments.
Conflicts of Interest
The authors declare no conflict of interest.
References
- International Coffee Organization. Coffee Market Report. Available online: http://www.ico.org (accessed on 5 August 2018).
- Taiwan Beverage Association. Black Gold Business Opportunity: Taiwan’s Hot Drink Coffee Market Observation. Available online: http://www.bia.org.tw/zh-tw/news-43055/%E9%BB%91%E9%87%91%E5%95%86%E6%A9%9F-%E8%87%BA%E7%81%A3%E7%86%B1%E9%A3%B2%E5%92%96%E5%95%A1%E5%B8%82%E5%A0%B4%E4%B9%8B%E8%A7%80%E5%AF%9F.html (accessed on 12 August 2018).
- Giovannucci, D. Sustainable Coffee Survey of the North American Specialty Coffee Industry; North American Publishing Commission for Environmental Cooperation: Quebec, QC, Canada, 2001. [Google Scholar]
- Giovannucci, D.; Potts, J.; Killian, B.; Wunderlich, C.; Schuller, S.; Soto, G.; Schroeder, K.; Vagneron, I.; Pinard, F. Seeking Sustainability: COSA Preliminary Analysis of Sustainability Initiatives in the Coffee Sector; Committee on Sustainability Assessment: Winnipeg, MB, Canada, 2008. [Google Scholar]
- Taylor, P.L. In the market but not of it: fair trade coffee and forest stewardship council certification as market-based social change. World Dev. 2005, 33, 129–147. [Google Scholar] [CrossRef]
- Pierrot, J.; Giovannucci, D.; Kasterine, A. Trends in the Trade of Certified Coffees; International Trade Centre: Geneva, Switzerland, 2010. [Google Scholar]
- Grieg-Gran, M. From Bean to Cup: How Consumer Choice Impacts on Coffee Producers and the Environment; Consumers International: London, UK, 2005. [Google Scholar]
- Van Loo, E.J.; Caputo, V.; Nayga, R.M.; Seo, H.S.; Zhang, B.; Verbeke, W. Sustainability labels on coffee: consumer preferences, willingness-to-pay and visual attention to attributes. Ecol. Econ. 2015, 118, 215–225. [Google Scholar] [CrossRef]
- Johe, M.H.; Bhullar, N. To buy or not to buy: the roles of self-identity, attitudes, perceived behavioral control and norms in organic consumerism. Ecol. Econ. 2016, 128, 99–105. [Google Scholar] [CrossRef]
- Batte, M.T.; Hooker, N.H.; Haab, T.C.; Beaverson, J. Putting their money where their mouths are: consumer willingness to pay for multi-ingredient, processed organic food products. Food Policy 2007, 32, 145–159. [Google Scholar] [CrossRef]
- Addor, F.; Grazioli, A. Geographical indications beyond wines and spirits. J. World Intellect. Prop. 2002, 5, 865–897. [Google Scholar] [CrossRef]
- Apaolaza, V.; Hartmann, P.; Echebarria, C.; Barrutia, J.M. Organic label’s halo effect on sensory and hedonic experience of wine: A pilot study. J. Sens. Stud. 2017, 32, e12243. [Google Scholar] [CrossRef]
- Lee, W.C.J.; Shimizu, M.; Kniffin, K.M.; Wansink, B. You taste what you see: Do organic labels bias taste perceptions? Food Qual. Prefer. 2013, 29, 33–39. [Google Scholar] [CrossRef]
- Moser, A.K. Consumers’ purchasing decisions regarding environmentally friendly products: an empirical analysis of German consumers. J. Retail. Consum. Serv. 2016, 31, 389–397. [Google Scholar] [CrossRef]
- Laureti, T.; Benedetti, I. Exploring pro-environmental food purchasing behaviour: An empirical analysis of Italian consumers. J. Clean. Prod. 2018, 172, 3367–3378. [Google Scholar] [CrossRef]
- Bernard, Y.; Bertrandias, L.; Elgaaied-Gambier, L. Shoppers’ grocery choices in the presence of generalized eco-labelling. Int. J. Retail Distrib. Manag. 2015, 43, 448–468. [Google Scholar] [CrossRef]
- Chen, M.F.; Huang, C.H. The impacts of the food traceability system and consumer involvement on consumers’ purchase intentions toward fast foods. Food Control 2013, 33, 313–319. [Google Scholar] [CrossRef]
- Hersleth, M.; Monteleone, E.; Segtnan, A.; Næs, T. Effects of evoked meal contexts on consumers’ responses to intrinsic and extrinsic product attributes in dry-cured ham. Food Qual. Prefer. 2015, 40, 191–198. [Google Scholar] [CrossRef] [Green Version]
- Samoggia, A.; Riedel, B. Coffee consumption and purchasing behavior review: Insights for further research. Appetite 2018, 129, 70–81. [Google Scholar] [CrossRef] [PubMed]
- Schäufele, I.; Hamm, U. Organic wine purchase behaviour in Germany: Exploring the attitude-behaviour-gap with data from a household panel. Food Qual. Prefer. 2018, 63, 1–11. [Google Scholar] [CrossRef]
- Chen, C.-C.; Chen, C.-W.; Tung, Y.-C. Exploring the consumer behavior of intention to purchase green products in belt and road countries: An empirical analysis. Sustainability 2018, 10, 854. [Google Scholar] [CrossRef]
- Ares, G.; Giménez, A.; Deliza, R. Influence of three non-sensory factors on consumer choice of functional yogurts over regular ones. Food Qual. Prefer. 2010, 21, 361–367. [Google Scholar] [CrossRef]
- Ling, C.Y. Consumers’ purchase intention of green products: an investigation of the drivers and moderating variable, Elixir. Int. J. Mark. Manag. 2013, 57A, 14503–14509. [Google Scholar]
- Gleim, M.R.; Smith, J.S.; Andrews, D.; Cronin, J.J. Against the green: A multi-method examination of the barriers to green consumption. J. Retail. 2013, 89, 44–61. [Google Scholar] [CrossRef]
- Loureiro, M.L.; Lotade, J. Do fair trade and eco-labels in coffee wake up the consumer conscience? Ecol. Econ. 2005, 53, 129–138. [Google Scholar] [CrossRef]
- De Pelsmacker, P.; Driesen, L.; Rayp, G. Do consumers care about ethics? Willingness to pay for fair-trade coffee. J. Consum. Aff. 2005, 39, 363–385. [Google Scholar] [CrossRef]
- Donnet, M.L.; Weatherspoon, D.D.; Hoehn, J.P. What adds value in specialty coffee? Managerial implications from hedonic price analysis of Central and South American e-auctions. Int. Food Agribus, Manag. Rev. 2007, 10, 1–18. [Google Scholar]
- Cranfield, J.; Henson, S.; Northey, J.; Masakure, O. An assessment of consumer preference for fair trade coffee in Toronto and Vancouver. Agribusiness 2010, 26, 307–325. [Google Scholar] [CrossRef]
- Teuber, R.; Herrmann, R. Towards a differentiated modeling of origin effects in hedonic analysis: An application to auction prices of specialty coffee. Food Policy 2012, 37, 732–740. [Google Scholar] [CrossRef]
- Hainmueller, J.; Hiscox, M.J.; Sequeira, S. Consumer demand for fair trade: evidence from a multistore field experiment. Rev. Econ. Stat. 2015, 97, 242–256. [Google Scholar] [CrossRef]
- Koppel, H.; Schulze, G.G. The importance of the indirect transfer mechanism for consumer willingness to pay for fair trade products—evidence from a natural field experiment. J. Consum. Policy 2013, 36, 369–387. [Google Scholar] [CrossRef]
- Langen, N. Are ethical consumption and charitable giving substitutes or not? Insights into consumers’ coffee choice. Food Qual. Prefer. 2011, 22, 412–421. [Google Scholar] [CrossRef]
- Carson, R.T. Contingent valuation: A practical alternative when prices aren’t available. J. Econ. Perspect. 2012, 26, 27–42. [Google Scholar] [CrossRef]
- Guo, X.; Liu, H.; Mao, X.; Jin, J.; Chen, D.; Cheng, S. Willingness to pay for renewable electricity: A contingent valuation study in Beijing, China. Energy Policy 2014, 68, 340–347. [Google Scholar] [CrossRef]
- Johnston, R.J.; Boyle, K.J.; Adamowicz, W.; Bennett, J.; Brouwer, R.; Cameron, T.A.; Hanemann, W.M.; Hanley, N.; Ryan, M.; Scarpa, R.; et al. Contemporary guidance for stated preference studies. J. Assoc. Environ. Resour. Econ. 2017, 4, 319–405. [Google Scholar] [CrossRef]
- Mergenthaler, M.; Weinberger, K.; Qaim, M. Consumer valuation of food quality and food safety attributes in Vietnam. Rev. Agric. Econ. 2009, 31, 266–283. [Google Scholar] [CrossRef]
- Sun, C.; Yuan, X.; Yao, X. Social acceptance towards the air pollution in China: evidence from public’s willingness to pay for smog mitigation. Energy Policy 2016, 92, 313–324. [Google Scholar] [CrossRef]
- Tisdell, C.; Wilson, C.; Swarna Nantha, H. Contingent valuation as a dynamic process. J. Soc. Econ. 2008, 37, 1443–1458. [Google Scholar] [CrossRef]
- Mostafa, M.M. Egyptian consumers’ willingness to pay for carbon-labeled products: A contingent valuation analysis of socioeconomic factors. J. Clean. Prod. 2016, 135, 821–828. [Google Scholar] [CrossRef]
- Sriwaranun, Y.; Gan, C.; Lee, M.; Cohen, D.A. Consumers’ willingness to pay for organic products in Thailand. Int. J. Soc. Econ. 2015, 42, 480–510. [Google Scholar] [CrossRef] [Green Version]
- Zaikin, A.A.; McCluskey, J.J. Consumer preferences for new technology: apples enriched with antioxidant coatings in Uzbekistan. Agric. Econ. 2013, 44, 513–521. [Google Scholar] [CrossRef]
- Huang, C.H.; Lee, C.H. Consumer willingness to pay for organic fresh milk in Taiwan. China Agric. Econ. Rev. 2014, 6, 198–211. [Google Scholar] [CrossRef]
- Carson, R.T.; Flores, N.E.; Meade, N.F. Contingent valuation: controversies and evidence. Environ. Resour. Econ. 2001, 19, 173–210. [Google Scholar] [CrossRef]
- Choi, A.S.; Ritchie, B.W.; Papandrea, F.; Bennett, J. Economic valuation of cultural heritage sites: A choice modeling approach. Tour. Manag. 2010, 31, 213–220. [Google Scholar] [CrossRef]
- Rudd, M.A. National values for regional aquatic species at risk in Canada. Endanger. Species Res. 2009, 6, 239–249. [Google Scholar] [CrossRef] [Green Version]
- Kinghorn, N.; Willis, K. Valuing the components of an archaeological site: an application of choice experiment to Vindolanda, Hadrian’s Wall. J. Cult. Herit. 2008, 9, 117–124. [Google Scholar] [CrossRef]
- Burton, M.; Rigby, D.; Young, T.; James, S. Consumer attitudes to genetically modified organisms in food in the UK. Eur. Rev. Agric. Econ. 2001, 28, 479–498. [Google Scholar] [CrossRef]
- Hoyos, D. The state of the art of environmental valuation with discrete choice experiments. Ecol. Econ. 2010, 69, 1595–1603. [Google Scholar] [CrossRef]
- Hanley, N.; Mourato, S.; Wright, R.E. Choice modelling approaches: A superior alternative for environmental valuatioin? J. Econ. Surv. 2001, 15, 435–462. [Google Scholar] [CrossRef]
- Lusk, J.L.; Roosen, J.; Fox, J.A. Demand for beef from cattle administered growth hormones or fed genetically modified corn: A comparison of consumers in France, Germany, the United Kingdom, and the United States. Am. J. Agric. Econ. 2003, 85, 16–29. [Google Scholar] [CrossRef]
- Thøgersen, J.; Nielsen, K.S. A better carbon footprint label. J. Clean. Prod. 2016, 125, 86–94. [Google Scholar] [CrossRef] [Green Version]
- Risius, A.; Janssen, M.; Hamm, U. Consumer preferences for sustainable aquaculture products: evidence from in-depth interviews, think aloud protocols and choice experiments. Appetite 2017, 113, 246–254. [Google Scholar] [CrossRef] [PubMed]
- Lombardi, G.V.; Berni, R.; Rocchi, B. Environmental friendly food: Choice experiment to assess consumer’s attitude toward “climate neutral” milk: The role of communication. J. Clean. Prod. 2017, 142, 257–262. [Google Scholar] [CrossRef]
- Aoki, K.; Akai, K.; Ujiie, K. A choice experiment to compare preferences for rice in Thailand and Japan: the impact of origin, sustainability, and taste. Food Qual. Prefer. 2017, 56, 274–284. [Google Scholar] [CrossRef]
- Paci, F.; Danza, A.; Del Nobile, M.A.; Conte, A. Consumer acceptance and willingness to pay for a fresh fish-burger: A choice experiment. J. Clean. Prod. 2018, 172, 3128–3137. [Google Scholar] [CrossRef]
- Torquati, B.; Tempesta, T.; Vecchiato, D.; Venanzi, S. Tasty or sustainable? The effect of product sensory experience on a sustainable new food product: an application of discrete choice experiments on Chianina tinned beef. Sustainability 2018, 10, 2795. [Google Scholar] [CrossRef]
- Wang, J.; Ge, J.; Ma, Y. Urban Chinese consumers’ willingness to pay for pork with certified labels: A discrete choice experiment. Sustainability 2018, 10, 603. [Google Scholar] [CrossRef]
- Shoyama, K.; Managi, S.; Yamagata, Y. Public preferences for biodiversity conservation and climate-change mitigation: a choice experiment using ecosystem services indicators. Land Use Policy 2013, 34, 282–293. [Google Scholar] [CrossRef]
- Janssen, M.; Hamm, U. Product labelling in the market for organic food: consumer preferences and willingness-to-pay for different organic certification logos. Food Qual. Prefer. 2012, 25, 9–22. [Google Scholar] [CrossRef]
- Kavoosi Kalashami, M.; Sadeghpour, H.; Allahyari, M.S.; Surujlal, J.; Ghorbandoust, M. Evaluation of urban consumer willingness to pay for organic leafy vegetables. Int. J. Veg. Sci. 2017, 23, 195–206. [Google Scholar] [CrossRef]
- Zhao, R.; Geng, Y.; Liu, Y.; Tao, X.; Xue, B. Consumers’ perception, purchase intention, and willingness to pay for carbon-labeled products: A case study of Chengdu in China. J. Clean. Prod. 2018, 171, 1664–1671. [Google Scholar] [CrossRef]
- Roitner-Schobesberger, B.; Darnhofer, I.; Somsook, S.; Vogl, C.R. Consumer perceptions of organic foods in Bangkok, Thailand. Food Policy 2008, 33, 112–121. [Google Scholar] [CrossRef]
- Yin, S.; Chen, M.; Chen, Y.; Xu, Y.; Zou, Z.; Wang, Y. Consumer trust in organic milk of different brands: The role of Chinese organic label. Br. Food J. 2016, 118, 1769–1782. [Google Scholar] [CrossRef]
- Xie, J.; Gao, Z.; Swisher, M.; Zhao, X. Consumers’ preferences for fresh broccolis: interactive effects between country of origin and organic labels. Agric. Econ. 2016, 47, 181–191. [Google Scholar] [CrossRef]
- Basu, A.K.; Hicks, R.L. Label performance and the willingness to pay for Fair Trade coffee: a cross-national perspective. Int. J. Consum. Stud. 2008, 470–478. [Google Scholar] [CrossRef]
- Sepúlveda, W.S.; Chekmam, L.; Maza, M.T.; Mancilla, N.O. Consumers’ preference for the origin and quality attributes associated with production of specialty coffees: results from a cross-cultural study. Food Res. Int. 2016, 89, 997–1003. [Google Scholar] [CrossRef]
- Cobin, J.M. Rare coin grading: A case of market-based regulation. Cato J. 2014, 34, 597–630. [Google Scholar]
- Wongprawmas, R.; Canavari, M. Consumers’ willingness-to-pay for food safety labels in an emerging market: The case of fresh produce in Thailand. Food Policy 2017, 69, 25–34. [Google Scholar] [CrossRef]
Figure 1.
Questionnaire model.


Table 1.
Coffee certification attributes and levels.
| Attributes | Levels | Number of Levels |
|---|---|---|
| Fair-trade certification | yes, no | 2 |
| Organic certification | yes, no | 2 |
| Eco-friendly certification | yes, no | 2 |
| Grade certification | yes, no | 2 |
| Traceability certification | yes, no | 2 |
| Price premium | 0, 2.5%, 5%, 7.5%, 10% | 5 |
Table 2.
Multinomial logit empirical estimation results.
| Attribute Variable | Coefficient | Estimated Value | t-Value |
|---|---|---|---|
| Alternative specific constant (ASC) | −0.532 | −3.01 *** | |
| Fair-trade certification (FTC) | α1 | 0.206 | 5.37 *** |
| Organic certification (ORG) | α2 | 0.453 | 9.84 *** |
| Eco-friendly certification (EF) | α3 | 0.311 | 7.06 *** |
| Grade certification (GR) | α4 | 0.340 | 8.92 *** |
| Product traceability (PE) | α5 | 0.550 | 11.89 *** |
| Premium price limit (FUND) | β | −0.084 | −6.07 *** |
| Log-likelihood | −1374.151 | ||
***, **, and * are significant at 1%, 5%, and 10%, respectively; alternative specific constant (ASC) for the status quo.
Table 3.
RPL results.
| Attribute and Level | Coefficient | t-Value | Standard Error | t-Value | WTP (%) |
|---|---|---|---|---|---|
| Alternative specific constant (ASC) | −0.734 | −3.80 *** | 0.739 | 5.09 *** | |
| Fair-trade certification (FTC) | 0.219 | 5.41 *** | 0.047 | 0.96 | 2.59 |
| Organic certification (ORG) | 0.449 | 9.68 *** | 0.110 | 2.18 ** | 5.32 |
| Eco-friendly certification (EF) | 0.311 | 6.99 *** | 0.006 | 0.11 | 3.68 |
| Grade certification GR) | 0.346 | 8.98 *** | 0.009 | 0.19 | 4.09 |
| Product traceability (PE) | 0.548 | 11.52 *** | 0.029 | 0.55 | 6.48 |
| Willingness to pay a premium (FUND) | −0.085 | −6.04 *** | |||
| Choice sets | 1203 | ||||
| Log-likelihood | −928.284 | ||||
| McFadden Pseudo R-squared | 0.272 | ||||
***, **, and * are significant at 1%, 5%, and 10%, respectively.
Table 4.
Investigation into the willingness to pay (WPT) discrepancy for certified coffee in respondents of different socioeconomic backgrounds.
Table 4.
Investigation into the willingness to pay (WPT) discrepancy for certified coffee in respondents of different socioeconomic backgrounds.
| Socioeconomic Background | n | FTC | ORG | EF | GR | PE | ||||||
|---|---|---|---|---|---|---|---|---|---|---|---|---|
| Mean | t-Value/ F-Value | Mean | t-Value/ F-Value | Mean | t-Value/ F-Value | Mean | t-Value/ F-Value | Mean | t-Value/ F-Value | |||
| Gender | Male | 296 | 2.455 | −0.163 | 5.326 | −0.388 | 3.679 | −1.206 | 4.089 | 1.126 | 6.567 | 1.616 |
| Female | 272 | 2.461 | 5.356 | 3.685 | 4.082 | 6.534 | ||||||
| Age | Under 25 | 66 | 2.425 | 1.212 | 5.349 | 0.259 | 3.686 | 1.099 | 4.059 | 1.925 * | 6.512 | 1.178 |
| 26–35 | 93 | 2.461 | 5.316 | 3.689 | 4.086 | 6.538 | ||||||
| 36–45 | 126 | 2.489 | 5.276 | 3.686 | 4.086 | 6.585 | ||||||
| 46–55 | 177 | 2.411 | 5.393 | 3.677 | 4.094 | 6.552 | ||||||
| 56–65 | 80 | 2.524 | 5.359 | 3.682 | 4.087 | 6.528 | ||||||
| Over 65 | 26 | 2.499 | 5.303 | 3.672 | 4.099 | 6.591 | ||||||
| Education | Middle School or Below | 30 | 2.443 | 1.115 | 5.074 | 3.399 ** | 3.688 | 0.259 | 4.058 | 3.094 ** | 6.479 | 1.934 |
| High School | 130 | 2.499 | 5.239 | 3.684 | 4.075 | 6.526 | ||||||
| University | 325 | 2.458 | 5.341 | 3.681 | 4.089 | 6.559 | ||||||
| Master’s Degree or Above | 83 | 2.397 | 5.595 | 3.684 | 4.101 | 6.583 | ||||||
| Marital Status | Married | 371 | 2.463 | 0.432 | 5.330 | −0.346 | 3.683 | 0.601 | 4.085 | −0.431 | 6.541 | −1.304 |
| Single | 197 | 2.448 | 5.359 | 3.681 | 4.088 | 6.569 | ||||||
| Income | Under 30,000 | 118 | 2.443 | 0.163 | 5.315 | 0.466 | 3.677 | 1.489 | 4.088 | 5.372 *** | 6.542 | 1.453 |
| 30,001–50,000 | 196 | 2.468 | 5.316 | 3.687 | 4.070 | 6.522 | ||||||
| 50,001–70,000 | 146 | 2.449 | 5.369 | 3.684 | 4.086 | 6.576 | ||||||
| 70,001–90,000 | 86 | 2.458 | 5.427 | 3.679 | 4.107 | 6.576 | ||||||
| Over 90,001 yuan | 22 | 2.504 | 5.163 | 3.665 | 4.133 | 6.584 | ||||||
***, **, and * are significant at 1%, 5%, and 10%, respectively.
© 2019 by the authors. Licensee MDPI, Basel, Switzerland. This article is an open access article distributed under the terms and conditions of the Creative Commons Attribution (CC BY) license (http://creativecommons.org/licenses/by/4.0/).
Share and Cite
MDPI and ACS Style
Liu, C.-C.; Chen, C.-W.; Chen, H.-S. Measuring Consumer Preferences and Willingness to Pay for Coffee Certification Labels in Taiwan. Sustainability 2019, 11, 1297. https://doi.org/10.3390/su11051297
AMA Style
Liu C-C, Chen C-W, Chen H-S. Measuring Consumer Preferences and Willingness to Pay for Coffee Certification Labels in Taiwan. Sustainability. 2019; 11(5):1297. https://doi.org/10.3390/su11051297
Chicago/Turabian StyleLiu, Chun-Chu, Chu-Wei Chen, and Han-Shen Chen. 2019. "Measuring Consumer Preferences and Willingness to Pay for Coffee Certification Labels in Taiwan" Sustainability 11, no. 5: 1297. https://doi.org/10.3390/su11051297
Note that from the first issue of 2016, this journal uses article numbers instead of page numbers. See further details here.