Partial Replacement of Fine Aggregate Using Water Purification Sludge in Producing CLSM

1
Department of Civil Engineering and Geomatics, Cheng Shiu University, No. 840, Chengching Rd., Niaosong District, Kaohsiung 83347, Taiwan
2
Center for Environmental Toxin and Emerging-Contaminant Research, Cheng Shiu University, No. 840, Chengching Rd., Niaosong District, Kaohsiung 83347, Taiwan
3
Super Micro Mass Research and Technology Center, Cheng Shiu University, No. 840, Chengching Rd., Niaosong District, Kaohsiung 83347, Taiwan
4
Department of Agribusiness Management, National Pingtung University of Science and Technology, No. 1, Shuefu Rd., Neipu, Pingtung 91201, Taiwan
*
Author to whom correspondence should be addressed.
Sustainability 2019, 11(5), 1351; https://doi.org/10.3390/su11051351
Submission received: 16 January 2019
/
Revised: 22 February 2019
/
Accepted: 27 February 2019
/
Published: 4 March 2019
(This article belongs to the Special Issue Sustainable Civil Engineering Materials)
Abstract
:This study investigated the mix design and engineering properties of controlled low-strength material (CLSM) by partial replacement of fine aggregate using water purification sludge (WPS). First, an investigation was performed at laboratory scale to assess the effects of the constituent materials and their quantities on the properties of the resulting CLSM. The Taguchi method of experimental design was used to determine optimal parameters for the mix design of CLSM. The parameters investigated included sludge content, water–binder ratio, slag content, accelerator agent content, and coarse aggregate content. Then, a cost analysis of a large-scale production CLSM containing WPS in a commercially available ready-mix concrete batching plant was performed. The results indicated that the water–binder ratio was the most significant factor that contributed to the target value (17.5 cm) of the tube flow of the mixture. The main contributions of experimental factors were water–binder ratio (78.00%), slag content (18.71%), accelerator agent content (2.41%), and sludge content (0.88%). Moreover, the strength of mixtures containing WPS was lower than that of mixtures without WPS. In particular, when the replacement percentage of fine aggregates with WPS was more than 20%, the strength was significantly reduced. The material cost per cubic meter of CLSM containing WPS is about NT$297.42 lower than that of ordinary CLSM, which can reduce the cost by 17.53%.
1. Introduction
Controlled low-strength material (CLSM), commonly called flowable fill, consists, in essence, of water, cementitious materials (cement and pozzolan), coarse and fine aggregates (or other by-products), and other chemical admixtures [1]. It is a self-compacting low-strength material with a flowable consistency that is primarily used as a backfill instead of a compacted fill in utility trenches or numerous applications [2]. Although the composition of CLSM is similar to concrete, the requirements for its constituent materials are not as strict as the production of concrete materials (as shown in Table 1 [3]), and many materials that are not suitable for ordinary concrete or do not conform to specifications can be used. As can be seen from Table 1, the amount of cement used in CLSM is usually small. Additionally, the coarse/fine aggregate ratio is also different. Especially for lower strength requirements, the water–binder ratio of CLSM is often greater than 1 (between 1 and 1.5), which is much higher than that of ordinary concrete (0.40 to 0.55). Furthermore, in the case of ordinary structural concrete, the coarse/fine aggregate ratio and cement content are relatively high. In particular, to form a dense structure and achieve the goal of high compressive strength, a water reducing agent is used to maintain good workability to reduce the amount of mixing water and reduce the water–binder ratio. In contrast, CLSM uses a large quantity of fine aggregate, a small amount of cement, and a large volumn of mixed water to form a relatively loose structure for the purpose of low strength. Essentially, the compressive strength of CLSM depends, primarily, on the materials used and their respective proportions in the mixture.
To promote the application of CLSM, the American Concrete Institute (ACI) and the American Society for Testing and Materials (ASTM) have established a number of standards and specifications [1,2,4,5,6,7]. For example, ACI Committee 229 defines a CLSM as a set of mixtures having a compressive strength of 8.28 MPa (1200 psi) or less at 28 days [1]. However, the desired engineering and performance properties of CLSM are different for various applications. Most CLSM applications currently require unconfined compressive strength with an upper limit of 2.07 MPa (300 psi) as a requirement to allow for future excavation of CLSM. Furthermore, given the needs of practical applications, considerable research results have been obtained in the mix design, initial setting time, stress–strain relationship, and durability of CLSM [8,9,10,11,12,13,14,15,16,17,18,19,20,21].
In general, in a typical CLSM mixture, the percentage of basic components (mass ratio) is as follows: fine aggregate (0.075–4.45 mm) or filler comprises about 80 to 85%, supplemental cementitious material comprises about 10 to 15%, cement comprises about 5 to 10%, and water consumption is 250 to 400 L/m3 [22,23]. In other words, filler makes up the major portion of a typical CLSM mixture. Among the fine aggregates, the most commonly used materials are sand for general concrete, while others are mixtures of crushed rock and sand, recycled aggregates, waste oyster shells, and industrial by-products [8,9,10,11,12,13,14,15,16,17,18,19,20,21]. Supplemental cementitious materials include fly ash, bottom ash, sawdust, etc. Industrial by-products include cement kiln dust, waste glass, waste foundry sand, slag, and electric arc furnace dust [8,9,10,11,12,13,14,15,16,17,18,19,20,21].
After raw water is subjected to procedures, such as coagulation, flocculation, sedimentation, filtration, and disinfection in a water treatment plant, it is used as tap water for the people’s livelihood [24,25]. In this process, to remove trace organic matter, fine turbidity or suspended solids (SS) in water, a coagulant, such as aluminum sulfate or polyaluminum chloride (PAC), must be added to the flash mixer. Larger floc is formed by appropriate agitation, and the heavier sedimentation gel feathers are removed by precipitation in the sedimentation pool, while the suspended floc and other substances that are not removed in the coagulation sediment are removed through the fast filter. The material within the fast filter is further backwashed and concentrated by gravity sedimentation in the sludge thickener and combined with the sludge within the sedimentation pool; the product is commonly referred to as water purification sludge (WPS). The term WPS encompasses all waste generated during the treatment of water in a water treatment plant. The properties of WPS generally depend on the quality of the raw water, and the treatment method applied [26]. In general, WPS contains large quantities of silicon, aluminum, and other oxides. After dehydration, a WPS cake is formed.
In the literature, there have been many reports on the physical and chemical characteristics of WPS that allow for the constructive utilization of WPS in various ways. The technology of recycling WPS cake can be divided into three categories [26,27,28,29,30,31,32,33,34,35,36,37,38,39,40]: (a) Residues of coagulant added in clean water sludge cakes are reused as wastewater treatment purposes; (b) simple drying, crushing, and granulating, as a mixture of soil, such as horticultural culture soil, planting soil, and other soil substrates; and (c) recycling technology through high-temperature completely dry or high-temperature sintering, as a substitute for cement raw materials, sintered brick, or paving and geotechnical engineering materials.
Generally, a water treatment plant using conventional processes produces large amounts of WPS. A study by Qasim et al. showed that the amount of WPS produced could reach 2% of the total volume of treated water [41]. From this point of view, the annual output of WPS is considerable. For example, in Taiwan, more than 200,000 metric tons of WPS cakes are produced each year. At present, sludge cakes in Taiwan are mostly treated in a reusable manner and need to comply with the relevant management regulations for reuse. WPS cakes should be explored for their feasibility and high economic value for the development and application of various building materials [39,40], especially. This will not only avoid secondary pollution but also convert waste into available resources. Given this, the present study aimed to investigate the mix design and engineering properties of CLSM by partial replacement of fine aggregate using WPS. The Taguchi method of experimental design was used to determine optimal parameters for the mix design of the CLSM mixture. The parameters investigated included sludge content, water–binder ratio, slag content, accelerator agent content, and coarse aggregate content. Additionally, range analysis and analysis of variance (ANOVA) were used to analyze the effects of the experimental factors on the performances of the tested mixtures.
2. Experimental Details
2.1. Materials
Materials used included cement, slag, WPS, coarse aggregates, fine aggregates, and accelerator agent. Local Type I Portland cement with a specific gravity of 3.15 and a fineness of 3420 cm2/g was used. Local slag with a specific gravity of 2.88 and a fineness of 5930 cm2/g was used. Fine aggregates were natural river sand, and coarse aggregates were crushed stones; their basic properties are shown in Table 2. Accelerator agent consisted of local products (in accordance with Chinese National Standards or the ASTM).
The WPS sample was taken from Fengyuan Water Purification Plant in Taichung City, Taiwan, and its main source of water is the Shigang reservoir, Central Taiwan. The collected WPS was first homogenized in the laboratory by the method of quartering, and the impurities were removed therefrom. The testing of the physical properties of WPS mainly included specific gravity, particle size analysis, and soil classification. The specific gravity, plasticity index, medium particle size, and composition of the WPS are shown in Table 3. Among them, the medium particle size is the median diameter or the medium value of the particle size distribution. The chemical composition of the WPS from the Fengyuan Water Purification Plant is shown in Table 4. As can be seen in Table 4, the primary chemical composition of the WPS included SiO2, Al2O3, and Fe2O3. Additionally, Figure 1 shows the mineral composition of a WPS sample. X-ray diffraction (XRD) patterns were recorded on a diffractometer (Rigaku, Japan) under the following experimental conditions: monochromatic 198 Cu Kα radiation with 1.541838 Å wavelengths in the 5–70° of 2θ range, a scan rate of 0.02° and 0.5 s per 199 steps, operating at 40 kV and 20 mA. By comparing the 2θ values and peak values obtained from the experiment with the Joint Committee on Powder Diffraction Standards (JCPDS) data card, it is possible to determine what the substance is. As can be seen from Figure 1, the sample contains quartz components and clay mineral components containing chlorite, illite, and feldspar.
Basically, the WPS is a neutral sludge (pH of about 7). Within this range, heavy metal materials are not easily eluted. Additionally, since the water quality of the WPS is clean and stable, and the coagulant added in the process of water purification is pure, the heavy metal content of the sludge is not high. Table 5 shows the toxicity characteristic leaching procedure (TCLP) results of the WPS, together with the limits for each of the regulated elements. It can be seen from Table 5 that the dissolution values of the nine heavy metals in the WPS are far below the legal standards; these are attributed to general industrial waste. Therefore, the WPS can be identified as a stable and harmless inorganic sludge.
2.2. Test Variables and Experimental Design
Depending on the application field, the important characteristics that a CLSM must have are different. Furthermore, CLSMs contain a large number of materials that are outside the traditional specifications. Therefore, there is currently no standard mix design for CLSM that can be accepted unanimously. However, the proportion of an ingredient in a CLSM mixture is governed by the required performance of the CLSM in two states, namely the plastic and the hardened states. The mix design for CLSM is made by mixing cementitious materials, aggregates, and water in a design ratio. If necessary, chemical admixture or mineral admixture is used to ensure that the CLSM meets the requirements of fluidity, setting time, and low strength.
Given the above, this study first conducted a laboratory-scale investigation to assess the effects of the composition on the properties of the resulting CLSM. In terms of performance testing for CLSM, the test variables (i.e., experimental control factor) included sludge content, water–binder ratio, slag content, accelerator agent content, and coarse aggregate content. The levels of each factor and performance parameter for test mixtures are shown in Table 6. Under five factors and four levels per factor, if a comprehensive test is conducted, the scale of the test will be quite large (45 experimental combinations), which will lead to very large-scale experiments, long hours of work, and high costs. Therefore, the Taguchi method of experimental design was used to determine optimal parameters for the mix design of CLSM [42,43,44,45]. An orthogonal array L16(45) was adopted for test mixtures, which consisted of five controllable four-level factors (Table 7). Afterward, a cost analysis of a large-scale production CLSM containing WPS was carried out.
2.3. Mix Proportions and Casting of Specimens
The amount of each constituent material of the tested mixtures was calculated according to the experimental combination of the orthogonal arrays, as shown in Table 8. The test mixtures were mixed using a horizontal twin-shaft concrete mixer. Before mixing, aggregates were cured indoors until the required saturated surface-dry condition was reached, while WPS was treated as a dry state. The cementitious material, WPS, fine aggregates, and coarse aggregates were then evenly mixed, and water and accelerator agent were then added to obtain a homogeneous consistency. After the mixing was completed, the fresh properties of the mixture were measured and recorded. Immediately, cylindrical specimens (100 mm in diameter and 200 mm in height) were cast for the compressive strength test. After the specimens were cast, they were covered with a wet hessian and polyethylene sheets overnight for 24 h. Then, all specimens were demolded and placed in a water bath within the laboratory until the day before the mechanical test. The water bath temperature was maintained at 23 ± 2 °C.
2.4. Test Methods and Data Analysis
All mixtures were evaluated for tube flow, unit weight, air content, maximum ball-drop indentation diameter, and compressive strength. The flowability (tube flow) of the mixture was measured using ASTM D 6103 [6]. Tube flow testing was performed immediately after mixing. This procedure was developed specifically to quantify the flow characteristics of flowable CLSM. The test consisted of filling an open cylinder with slurry, lifting the cylinder, and measuring the diameter of the forming spread. The flow cylinder ought to have a length of 150 mm and an inner diameter of 76 mm. The tube flow was the average value of two flow diameters measured in mutually perpendicular directions. The unit weight and air content of the fresh mixture were measured using ASTM D 6023 [4]. To determine suitability for load application, the ball drop test was conducted according to ASTM D6024 [5]. The test involved dropping a steel ball, and the ball drop impact tester was placed over the specimen. This was repeated five times on the surface of the specimen, and then the average diameter of the indentation was measured. If this diameter is 7.6 cm or less then the material can have backfill or pavement placed over it. The compressive strengths of the hardened mixture were measured at curing ages of 7 and 28 days, respectively. Three specimens from each mixture were tested for compressive strength. The preparation and testing of the mixture specimens were in accordance with ASTM D 4832 [7].
The signal-to-noise ratio (S/N ratio) for each control factor is often used to evaluate the impact of each selected factor on the performance characteristics being studied [42]. The S/N ratio (η) is calculated by the mean squared deviation (MSD) [46]. Any experiment aims to work out the highest possible S/N ratio for the result. In general, if the S/N ratio is expressed in decibels (dB), it can be defined by a logarithm based on the MSD around the target value. In general, there are three categories of objective function, as follows [46]:
where n is the number of repetitions or observations; yi is the observed data; and y0 is the nominal value desired.
In this study, the objective functions of the mixture specimens were set separately according to engineering requirements. The objective function of fresh unit weight was a smaller-the-better type, while the objective function of air content and 7-day compressive strength was a larger-the-better type. As for tube flow, maximum ball-drop indentation diameter, and 28-day compressive strength, the objective function was of nominal-the-better type. ANOVA was used to detect the optimization of the observed values. This was accomplished by separating the total variability of the S/N ratios into contributions by each of the process parameters and the error [47,48].
3. Results and Discussion
3.1. Fresh Properties of Tested Mixtures
When considering CLSM as a construction material, some important properties must be evaluated in the fresh stage. Therefore, this study carefully selected performance parameters required for the fresh stage. These parameters included tube flow, unit weight, air content, and maximum ball-drop indentation diameter, which were used to evaluate the fresh properties of mixtures using WPS. Table 9 shows the experimental results of mixture specimens and the corresponding S/N ratios using Equations (1)–(3).
3.1.1. Tube Flow
The flowability of CLSM can directly affect productivity and human resource requirements for placing the material. According to ASTM D 6103 [6], the value of tube flow should be between 20 and 30 cm. However, the tube flow of a CLSM is usually established by the specifying organization, and will vary depending on how it is used. To meet the engineering requirements of CLSM in Taiwan (i.e., 15–20 cm), the target value of tube flow of the mixture specimens was set to 17.5 cm. It was observed that mixture constituents affected the tube flow of mixture specimens. As shown in Table 9, the tube flow data of each fresh mixture ranged from 7.0 to 26.0 cm, which falls in the low to high flowability class in line with the ACI committee 229R report [1]. Among these, the M1, M5, M9, M10, and M13 mixes had the smallest tube flow (7.0 cm), and the M4 mix had the highest tube flow (26.0 cm). Additionally, for some mixtures, a tube flow of 15 cm was achievable. The tube flow of the M15 mix was 15.5 cm, and its value was closer to the target value of tube flow.
As mentioned previously, the Taguchi method of experimental design was orthogonal. Therefore, the effect of each parameter used might be separated at totally different levels. Taking the sludge content as an example, the mean S/N ratio at levels 1, 2, 3, and 4 was calculated by averaging the S/N ratios of experiments M1–M4, M5–M8, M9–M12, and M13–M16, respectively. Similarly, the mean S/N ratio of other parameters at each level can be calculated. The effect of each selected factor on the performance characteristic investigated is described in detail below.
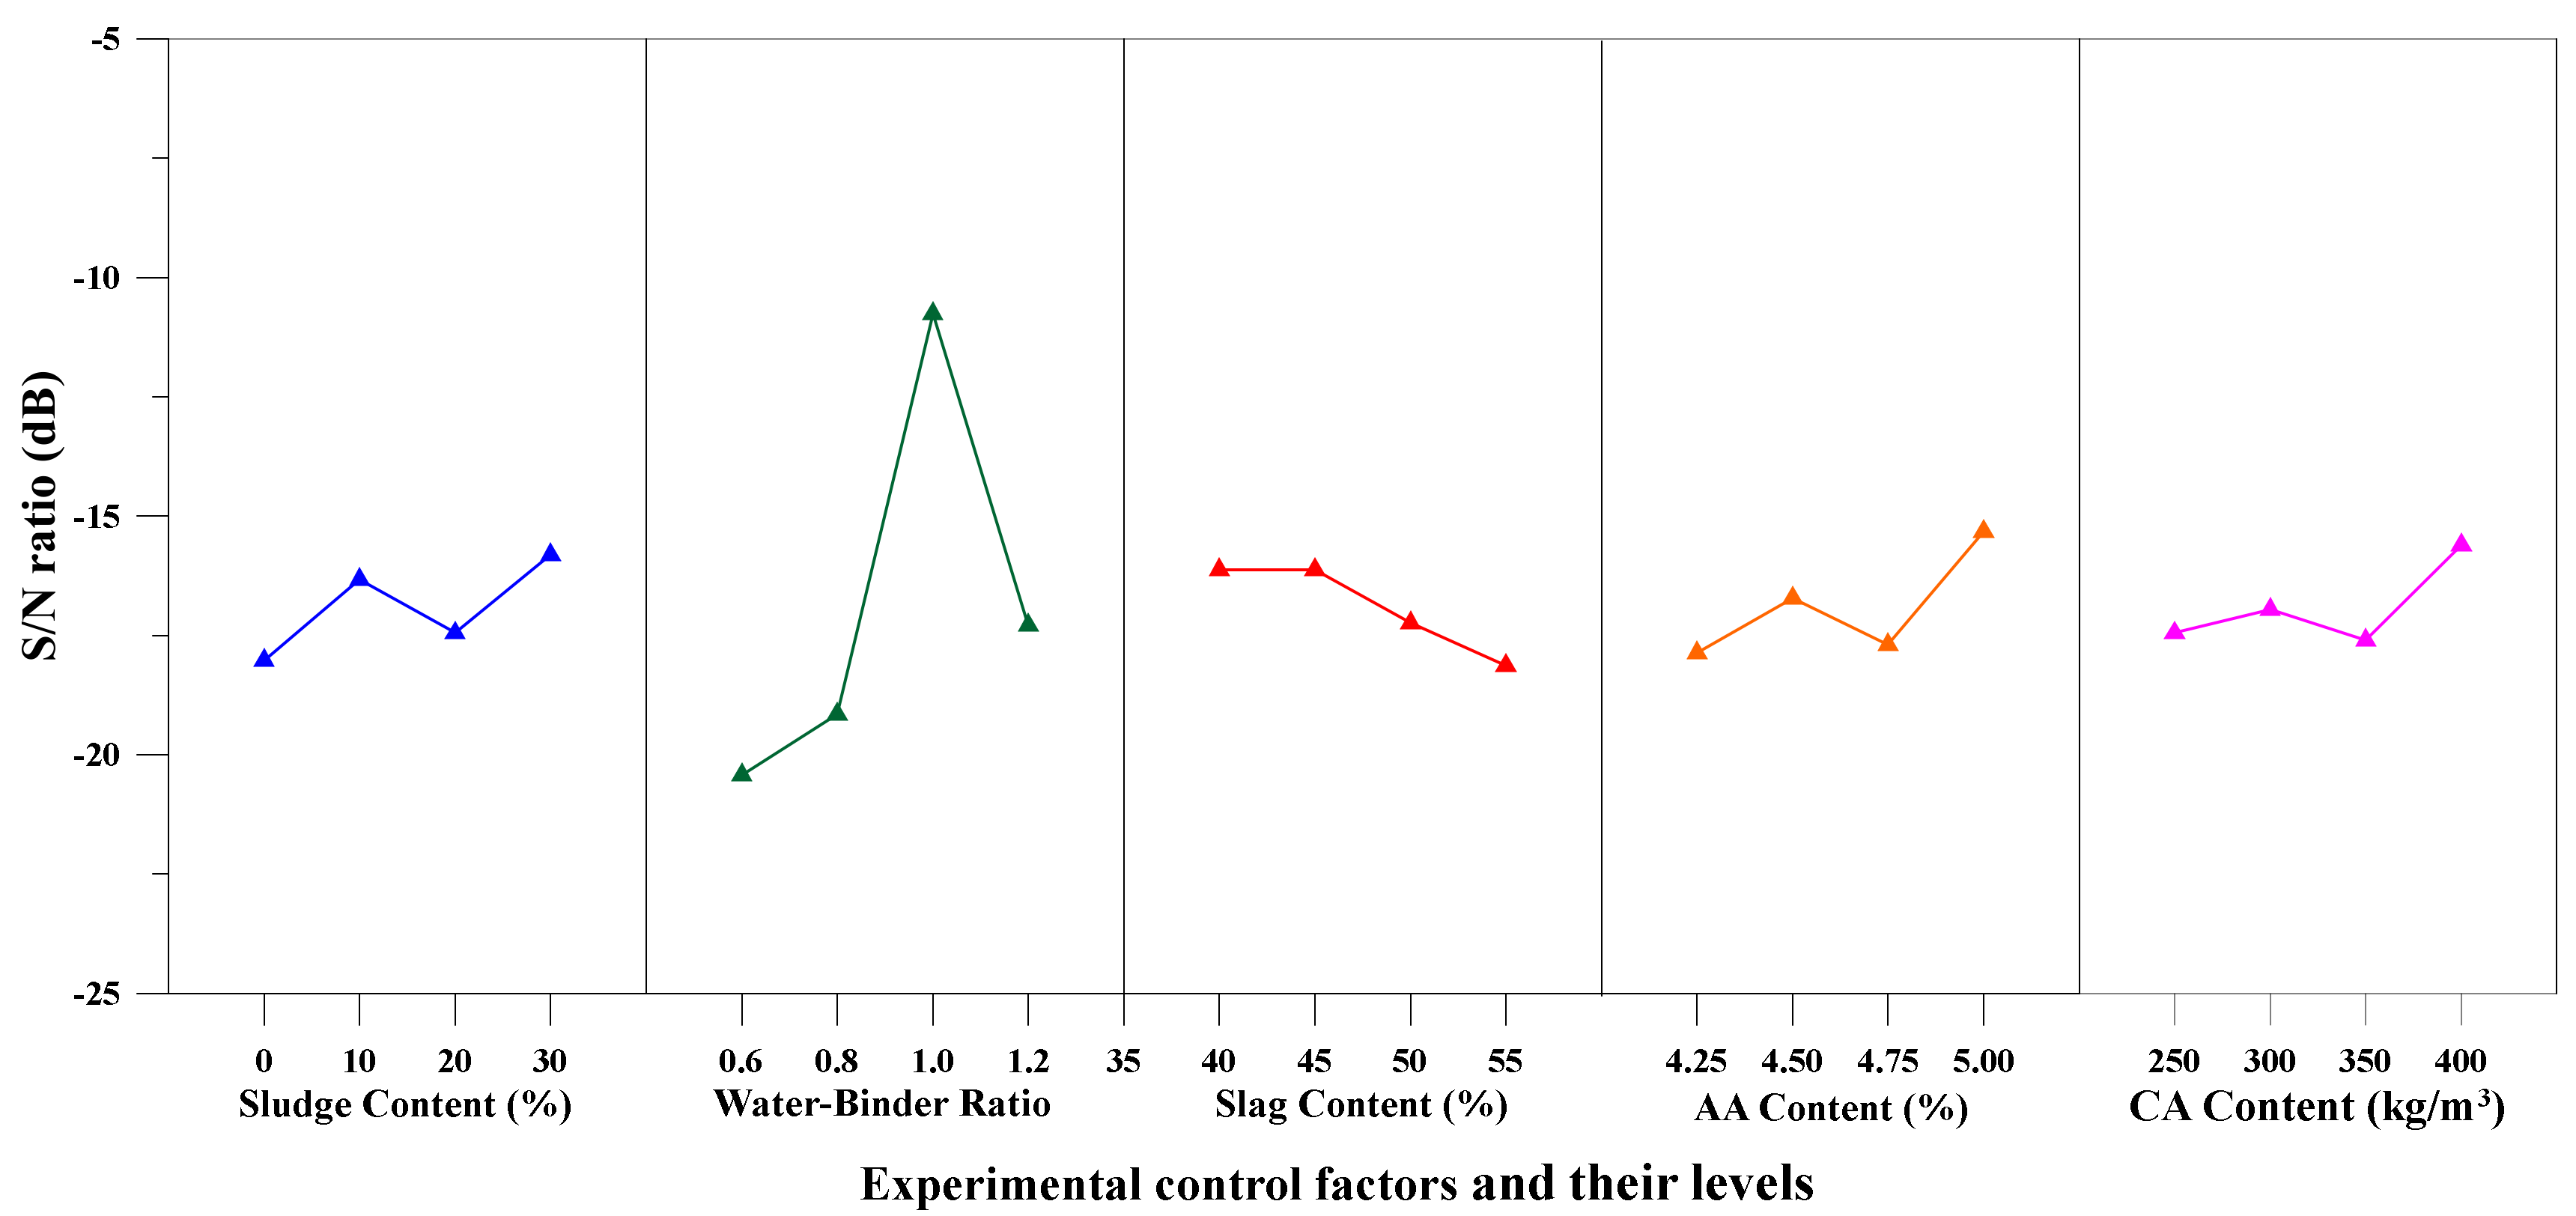
Table 10 lists the mean S/N ratio at each level of the parameters for tube flow, while Figure 2 shows the S/N response graph for tube flow. As can be seen from Table 10, delta represents the difference between the maximum data and the minimum data in level 1 to level 4. The larger the delta data, the greater the influence of the level change of the factor on the experimental index, the more important the factor. According to Equation (3), the larger the S/N ratio, the smaller the variance of tube flow around the desired value (i.e., nominal-the-better). From Table 10 and, it can be seen that the water–binder ratio was the most important factor affecting the responses; the maximum value of the response was on the third level of the water–binder ratio. However, the degree of influence of each factor on the test results cannot be calculated with precise quantities, and a criterion cannot be recommended to evaluate whether or not the examined factors are significant. Given this, a statistical method—ANOVA—was used to further explore the test results. The results of the ANOVA of tube flow are given in Table 11. Furthermore, the F value and P value were acquired at a confidence level of 95%, and the percentage of contribution of each parameter was calculated. The water–binder ratio was the most significant factor that contributed to the target value (17.5 cm) of the tube flow of the mixture. The main contributions of the factors were: water–binder ratio (78%), slag content (18.71%), accelerator agent content (2.41%), and sludge content (0.88%). Thus, according to the S/N ratio and the results of the ANOVA analysis, the best combination of parameters and their levels for achieving nominal tube flow is A4B3C1D4E1, i.e., sludge content at level 4, water–binder ratio at level 3, slag content at level 1, accelerator agent content at level 4, and coarse aggregate content at level 1.
3.1.2. Unit Weight
Table 9 presents the fresh unit weight of the different tested mixtures. As shown in Table 9, the unit weight of each fresh mixture ranged from 1994 to 2324 kg/m3, which is within the range of normal CLSM reported by ACI Committee 229 [1]. Among them, the M15 mix had the smallest unit weight (1994 kg/m3), and the M1 mix had the highest unit weight (2324 kg/m3). The low unit weight mixtures may be used as a lightweight fill. This fill can be applied to reduce the load on buried structures and underlying soils or fills.
Table 12 shows the mean S/N ratio at each level of the parameters for unit weight. As shown in Equation (1), the larger the S/N ratio, the smaller the variance of unit weight around the desired value. From Table 12, it can be seen that the water–binder ratio was the most important factor affecting the responses; the maximum value of the response was at the fourth level of the water–binder ratio. Moreover, Table 12 shows that the fresh unit weight of tested mixtures decreased with the increase of sludge content and water–binder ratio. The reason for this is that water has the lowest density among all materials, the higher the water–binder ratio, the higher the water content, the lower the unit weight. Taking the M12 and M13 mixes as examples, the water–binder ratio, water content, and unit weight of the M12 mix were 1.2, 300 kg/m3, and 2015 kg/m3, respectively, while the water–binder ratio, water content, and unit weight of the M13 mix were 0.6, 150 kg/m3, and 2172 kg/m3, respectively. The results of the ANOVA analysis of unit weight are given in Table 13. As can be seen from Table 13, the water–binder ratio was the most significant factor that contributed to the unit weight of the mixture. The main contributions of these factors were: water–binder ratio (63.42%), slag content (23.61%), sludge content (8.62%), and accelerator agent content (4.35%). Thus, according to the S/N ratio and the results of the ANOVA analysis, the best combinations of parameters and their levels for achieving minimum unit weight are A4B4C1D2E1 or A4B4C1D4E3, i.e., sludge content at level 4, water–binder ratio at level 4, slag content at level 1, accelerator agent content at level 2 or at level 4, and coarse aggregate content at level 1 or level 3.
3.1.3. Air Content
The effects of different constituent materials and quantities on the air content of mixture specimens were evaluated. As shown in Table 9, the air content of each fresh mixture ranged from 1.0 to 7.5%. Among them, the M9 mix had the smallest air content (1.0%), and the M6 mix had the highest air content (7.5%).
Table 14 shows the mean S/N ratio at each level of the parameters of air content. As shown in Equation (2), the larger the S/N ratio, the smaller the variance of air content around the desired value (i.e., larger-the-better). From Table 14, it can be seen that the slag content was the most important factor affecting the responses; the maximum value of the response was on the first level of the slag content. The results of the ANOVA analysis of air content are given in Table 15. As can be seen from Table 15, the slag content was the most significant factor that contributed to the air content of the mixture. The main contributions of the factors were: slag content (59.66%), water–binder ratio (19.75%), sludge content (11.22%), and accelerator agent content (9.37%). Thus, according to the S/N ratio and the results of the ANOVA analysis, the best combination of parameters and their levels for achieving maximum air content is A2B2C1D2E3.
3.1.4. Maximum Ball-Drop Indentation Diameter
The ball-drop test was used to evaluate the suitability of load applications on CLSM in accordance with ASTM D6024 [5]. If the diameter of the ball-drop indentation is 7.6 cm or less, it means that the tested mixture has sufficient load carrying capacity. Therefore, the target value of the indentation diameter of the mixture specimens was set to 7.6 cm. Table 9 presents the maximum ball-drop indentation diameter of the different tested mixtures. As shown in Table 9, the indentation diameter of each fresh mixture ranged from 3.68 to 10.90 cm. Among them, the M1 mix had the smallest indentation diameter (3.68 cm), and the M12 mix had the largest indentation diameter (10.90 cm).
Table 16 shows the mean S/N ratio at each level of the parameters for indentation diameter. As shown in Equation (3), the larger the S/N ratio, the smaller the variance of indentation diameter around the desired value (i.e., nominal-the-better). From Table 16, it can be seen that the water–binder ratio was the most important factor affecting the responses; the maximum value of the response was on the second level of the water–binder ratio. The results of the ANOVA analysis of tube flow are given in Table 17. As can be seen from Table 15, the water–binder ratio was the most significant factor that contributed to the target value (7.6 cm) of the indentation diameter of the mixture. The main contributions of the factors were: water–binder ratio (41.25%), slag content (36.97%), coarse aggregate content (17.64%), and sludge content (4.13%). Therefore, according to the S/N ratio and the results of the ANOVA analysis, the best combination of parameters and their levels for achieving nominal indentation diameter is A3B2C3D3E3.
3.2. Compressive Strength of Tested Mixtures
In addition to the properties in the fresh stage, the compressive strength of a CLSM material is very important in the late hardened stage. Therefore, 7-day and 28-day compressive strengths of the hardened mixtures were measured to evaluate the mechanical properties of CSLM for various applications. Among them, the 7-day strength was used to check the minimum strength requirements for performance criteria, and the 28-day intensity was used to regulate the maximum strength limit required for long-term excavation. From the results of the compressive strength of Table 9, it can be seen that experimental studies using mixtures of different constituent materials and combinations have covered the practical range from excavatable CLSM to non-excavatable CLSM.
3.2.1. Seven-Day Compressive Strength
After concrete specimens were cast, to ensure their strength development, curing was required to maintain the required moisture and temperature conditions. The strength of concrete specimens depended mainly on the hydration reaction. Therefore, water played a key role, especially the amount used. Essentially, the strength of the concrete specimen increased when less water–binder ratio was used to make concrete. It can be seen from Table 9 that the 7-day compressive strength of the tested mixtures was between 0.14 and 28.37 MPa. Among them, the M9 mix had the lowest 7-day compressive strength (0.14 MPa), and the M1 mix had the highest 7-day compressive strength (28.37 MPa). From a CLSM perspective, several of the mixtures were of relatively high strength at seven days. However, for some mixtures, the specimens were found to have a strength below 1 MPa. Taking the proportions of the M13 and M14 mixes as examples, the amount of cement was lower, and the amount of WPS was higher, resulting in a strength of less than 1 MPa at 28 days of age. However, these concretes can be used in the field of low strength demand.
Table 18 shows the mean S/N ratio at each level of the parameters for 7-day compressive strength. As shown in Equation (2), the larger the S/N ratio, the smaller the variance of air content around the desired value (i.e., larger-the-better). From Table 18, it can be seen that the sludge content was the significant factor in controlling 7-day compressive strength; the maximum value of the response was at the lowest level of the sludge content. Additionally, Table 18 shows that the 7-day compressive strength of tested mixtures decreased with the increase of sludge content and slag content. The results of the ANOVA analysis for 7-day compressive strength are given in Table 19. The sludge content was the most significant factor that contributed to the 7-day compressive strength of the tested mixtures. The main contributions of the factors were: sludge content (82.12%), slag content (12.82%), coarse aggregate content (2.65%), accelerator agent content (1.57%), and water–binder ratio (0.83%). As a result, according to the S/N ratio and the results of the ANOVA evaluation, the best combination of parameters and their levels for achieving the maximum 7-day compressive strength is A1B4C1D1E3.
3.2.2. 28-Day Compressive Strength
To meet the specifications for CLSM strength in Taiwan, the target value of 28-day compressive strength of the mixture specimens was set to 8.28 MPa. It can be seen from Table 9 that the 28-day compressive strength of the tested mixtures was between 0.49 and 34.66 MPa. Among them, the M14 mix had the lowest 28-day compressive strength (0.49 MPa), and the M1 mix had the highest 28-day compressive strength (34.66 MPa). From a CLSM perspective, several of the mixtures were of relatively high strength at 28 days and had exceeded the upper limit of ACI Committee 229 and Taiwan specifications (8.28 MPa) [49]. However, for some mixtures, the specimens were found to have a strength below 2.07 MPa, as a requirement to allow for future excavation of CLSM. Furthermore, the strengths of mixtures containing WPS were lower than those of mixtures without WPS. In particular, when the replacement percentage of fine aggregates with WPS was more than 20%, the strength was significantly reduced.
Table 20 shows the mean S/N ratio at each level of the parameters for 28-day compressive strength. As shown in Equation (3), the larger the S/N ratio, the smaller the variance of compressive strength around the desired value (i.e., nominal-the-better). From Table 20, it can be seen that the sludge content was the significant factor in controlling 28-day compressive strength; the maximum value of the response was on the third level of the sludge content. Similarly, in the case of the M12 and M13 mixes, the sludge content and 28-day compressive strength of the M12 mix were 20% and 8.69 MPa, respectively, while the sludge content and 28-day compressive strength of the M13 mix were 30% and 0.59 MPa, respectively. According to ACI Committee 229 [1], the 28-day compressive strength of CLSM is 8.28 MPa or lower. Therefore, the M13-M16 mixes met the requirements of CLSM. In other words, among the four sludge contents in this study, the test results with a sludge content of 30% can meet the requirements of CLSM. The higher substitution rate can make the compressive strength meet the demand, and also provide greater reuse for WPS. Additionally, most CLSM applications currently require an unconfined compressive strength limit of 2.1 MPa for future excavation. From this point of view, the M13 and M14 mixes can be used as excavatable or removable CLSM, and the M15 and M16 mixes can be used as non-excavatable or non-removable CLSM.
The results of the ANOVA analysis for compressive strength are given in Table 21. As can be seen from Table 21, the sludge content was the most significant factor that contributed to the target value (8.28 MPa) of the 28-day compressive strength of the mixture. The main contributions of the factors were: sludge content (38.65%), water–binder ratio (32.74%), slag content (16.67%), and coarse aggregate content (11.95%). Thus, according to the S/N ratio and the results of the ANOVA analysis, the best combination of parameters and their levels for achieving nominal 28-day compressive strength is A3B4C2D1E3.
3.3. Cost Analysis of Large-Scale Production Controlled Low-Strength Material (CLSM) with Water Purification Sludge (WPS)
After evaluating the effects of the constituent materials and their quantities on the properties of the resulting CLSM at laboratory scale, a cost analysis of a large-scale production CLSM containing WPS in a commercially available ready-mix concrete batching plant was performed. After comprehensive consideration of mechanical properties, renewable resource utilization, and economy, the following mix design of the large-scale production CLSM containing WPS was selected: water–binder ratio of 1.0, replacement of 45% cement with slag, replacement of 30% fine aggregates with WPS, and a coarse aggregate content of 350 kg/m3. The mix has a lower cement content and a higher volume of WPS, and its mechanical properties can meet the requirements of CLSM.
Table 22 shows the unit prices of the materials required for the production of CLSM. Among them, the WPS is a general industrial waste. At present, the sludge treatment fee of the Taiwan Water Company is about NT$400–600 per metric ton, so the unit price of WPS in Table 22 is NT$-0.5 per kg; the negative sign in front of the price indicates that the cost that can be reduced. The material cost analysis of ordinary CLSM and CLSM containing WPS is shown in Table 23. Among them, the material cost per cubic meter of ordinary CLSM is about NT$1696.99, and the material cost per cubic meter of CLSM containing WPS is NT$1399.57. From this point of view, the material cost per cubic meter of CLSM containing WPS is about NT$297.42 lower than that of ordinary CLSM, which can reduce the cost by 17.53%. In terms of the economy, using WPS to produce CLSM is indeed quite competitive. In the early stage of promotion, if the Taiwan Water Company took the lead in adopting this CLSM in the water pipeline project, it would induce the industry to produce CLSM with WPS. Therefore, it has a positive effect on promoting the diversification and reuse of WPS.
4. Conclusions
This study presented an application of the Taguchi optimization technique for determining the mix design and engineering properties of CLSM containing WPS. The results indicated that the Taguchi method provides a simple, systematic, and efficient methodology for optimizing parameters for CLSM design, and drastically reduces the number of tests. Based on the above experimental results and analysis, the following conclusions were drawn:
- The water–binder ratio was the most significant factor that contributed to the target value (17.5 cm) of the tube flow of the mixture. The main contributions of the factors were: water–binder ratio (78.00%), slag content (18.71%), accelerator agent content (2.41%), and sludge content (0.88%).
- The water–binder ratio was the most significant factor that contributed to the target value (7.6 cm) of the indentation diameter of the mixture. The main contributions of the factors were: water–binder ratio (41.25%), slag content (36.97%), coarse aggregate content (17.64%), and sludge content (4.13%).
- Experimental studies of mixtures using different constituent materials and their combinations covered the practical range from excavatable CLSM to non-excavatable CLSM. The strengths of mixtures containing WPS were lower than those of mixtures without WPS. In particular, when the replacement percentage of fine aggregates with WPS was more than 20%, the strength was significantly reduced.
- The material cost per cubic meter of CLSM containing WPS is about NT$297.42 lower than that of ordinary CLSM, which can reduce the cost by 17.53%.
Author Contributions
C.-W.T. designed the experiments and performed the experiments. C.-K.C. analyzed the data (ANOVA) and wrote part of the paper.
Funding
The authors express their gratitude and sincere appreciation to the Ministry of Science and Technology, Taiwan, for financing this research work.
Acknowledgments
The authors are grateful to the Department of Civil Engineering of National Chung-Hsing University for providing experimental equipment and technical support.
Conflicts of Interest
The authors declare no conflict of interest.
References
- 229R-13 Report on Controlled Low-Strength Materials; ACI Committee 229; American Concrete Institute: Farmington Hills, MI, USA, 2013.
- Standard Practice for Sampling Freshly Mixed Controlled Low-Strength Material; ASTM D5971/D5971M-16; ASTM International: West Conshohocken, PA, USA, 2016; Available online: www.astm.org (accessed on 20 February 2018).
- Study on the Application of Controlled Low-Strength Materials in Civil Engineering; Construction and Planning Agency, Ministry of the Interior: Taiwan, China, 2002.
- Standard Test Method for Density (Unit Weight), Yield, Cement Content, and Air Content (Gravimetric) of Controlled Low-Strength Material (CLSM); ASTM D6023-16; ASTM International: West Conshohocken, PA, USA, 2016; Available online: www.astm.org (accessed on 20 February 2018).
- Standard Test Method for Ball Drop on Controlled Low Strength Material (CLSM) to Determine Suitability for Load Application; ASTM D6024/D6024M-16; ASTM International: West Conshohocken, PA, USA, 2016; Available online: www.astm.org (accessed on 20 February 2018).
- Standard Test Method for Flow Consistency of Controlled Low Strength Material (CLSM); ASTM D6103/D6103M-17; ASTM International: West Conshohocken, PA, USA, 2017; Available online: www.astm.org (accessed on 20 February 2018).
- Standard Test Method for Preparation and Testing of Controlled Low Strength Material (CLSM) Test Cylinders; ASTM D4832-16e1; ASTM International: West Conshohocken, PA, USA, 2016; Available online: www.astm.org (accessed on 20 February 2018).
- Adaska, W.S. Controlled low strength materials. Concr. Int. 1997, 19, 41–43. [Google Scholar]
- Funston, J.J.; Krell, W.C.; Zimmer, F.V. Flowable fly ash, a new cement stabilized backfill. Civ. Eng. ASCE 1984, 4, 22–26. [Google Scholar]
- Howard, A.K.; Hitch, A.K.J.L. (Eds.) The Design and Application of Controlled Low Strength Material (Flowable Fill); ASTM STP 1331; ASTM: West Conshohocken, PA, USA, 1998. [Google Scholar]
- Naik, T.R.; Kraus, R.N.; Siddique, R. Controlled low-strength materials containing mixtures of coal ash and new pozzolanic materials. ACI Mater. J. 2003, 100, 208–215. [Google Scholar]
- Folliard, K.J.; Du, L.; Trejo, D. Effects of curing conditions on strength development of controlled low-strength material. ACI Mater. J. 2003, 100, 230–250. [Google Scholar]
- Lachemi, M.; Hossain, K.M.A.; Shehata, M.; Thaha, W. Controlled low strength materials incorporating cement kiln dust from various sources. Cem. Concr. Compos. 2008, 30, 381–392. [Google Scholar] [CrossRef]
- Shon, C.S.; Mukhopadhyay, A.K.; Saylak, D.; Zollinger, D.G.; Mejeoumov, G.G. Potential use of stockpiled circulating fluidized bed combustion ashes in controlled low strength material (CLSM) mixture. Constr. Build. Mater. 2010, 24, 839–847. [Google Scholar] [CrossRef]
- Lin, W.T.; Weng, T.L.; Cheng, A.; Chao, S.J.; Hsu, H.M. Properties of Controlled Low Strength Material with Circulating Fluidized Bed Combustion Ash and Recycled Aggregates. Materials 2018, 11, 715. [Google Scholar] [CrossRef] [PubMed]
- Kuo, W.T.; Gao, Z.C. Engineering Properties of Controlled Low-Strength Materials Containing Bottom Ash of Municipal Solid Waste Incinerator and Water Filter Silt. Appl. Sci. 2018, 8, 1377. [Google Scholar] [CrossRef]
- Wu, H.; Huang, B.; Shu, X.; Yin, J. Utilization of solid wastes/byproducts from paper mills in Controlled Low Strength Material (CLSM). Constr. Build. Mater. 2016, 118, 155–163. [Google Scholar] [CrossRef]
- Park, S.M.; Lee, N.K.; Lee, H.K. Circulating fluidized bed combustion ash as controlled low-strength material (CLSM) by alkaline activation. Constr. Build. Mater. 2017, 156, 728–738. [Google Scholar] [CrossRef]
- Jang, J.G.; Park, S.M.; Chung, S.; Ahn, J.W.; Kim, H.K. Utilization of circulating fluidized bed combustion ash in producing controlled low-strength materials with cement or sodium carbonate as activator. Constr. Build. Mater. 2018, 159, 642–651. [Google Scholar] [CrossRef]
- Kuo, W.T.; Wang, H.Y.; Shu, C.Y.; Su, D.S. Engineering properties of controlled low-strength materials containing waste oyster shells. Constr. Build. Mater. 2013, 46, 128–133. [Google Scholar] [CrossRef]
- Mneina, A.; Solimanb, A.M.; Ahmed, A.; El Naggar, M.H. Engineering properties of controlled low-strength materials containing treated oil sand waste. Constr. Build. Mater. 2018, 159, 277–285. [Google Scholar] [CrossRef]
- TFHRC. Coal Fly Ash—User Guideline—Flowable Fill; Turner Fairbank Highway Research Center, US Department of Transportation, FHWA: Mclean, VA, USA, 2004. [Google Scholar]
- U.S. Dept. of Transportation. User Guidelines for Waste and By-Product Materials in Pavement Construction; Report No. FHWA-RD-97-148; Federal Highway Administration: Washington, DC, USA, 1997.
- Lin, T.T. The Feasibility Study of Manufacturing Eco Cement by Using Sludge as Raw Cement Materials. Master’s Thesis, Environmental Engineering Research Institute, National Central University, Taiwan, China, 2006. [Google Scholar]
- Ahmad, T.; Ahmad, K.; Alam, M. Characterization of water treatment plant’s sludge and its safe disposal options. Procedia Environ. Sci. 2016, 35, 950–955. [Google Scholar] [CrossRef]
- Ahmad, T.; Ahmad, K.; Alam, M. Sustainable management of water treatment sludge through 3‘R’ concept. J. Clean. Prod. 2016, 124, 1–13. [Google Scholar] [CrossRef]
- Ahmad, T.; Ahmad, K.; Ahad, A.; Alam, M. Characterization of water treatment sludge and its reuse as coagulant. J. Environ. Manag. 2016, 182, 606–611. [Google Scholar] [CrossRef] [PubMed]
- Guan, X.H.; Chen, G.H.; Shang, C. Re-use of water treatment works sludge to enhance particulate pollutant removal from sewage. Water Res. 2005, 39, 3433–3440. [Google Scholar] [CrossRef] [PubMed]
- Keeley, J.; Jarvis, P.; Judd, S.J. An economic assessment of coagulant recovery from water treatment residuals. Desalination 2012, 287, 132–137. [Google Scholar] [CrossRef]
- Nair, A.T.; Ahammed, M.M. The reuse of water treatment sludge as a coagulant for post-treatment of UASB reactor treating urban wastewater. J. Clean. Prod. 2015, 96, 272–281. [Google Scholar] [CrossRef]
- Yang, Y.; Tomlinson, D.; Kennedy, S.; Zhao, Y.Q. Dewatered alum sludge: A potential adsorbent for phosphorus removal. Water Sci. Technol. 2006, 54, 207–213. [Google Scholar] [CrossRef] [PubMed]
- Basta, N.; Dayton, E.A. Characterization of drinking water treatment residuals for use as a soil substitute. Water Environ. Res. 2001, 73, 52–57. [Google Scholar]
- Huang, C.; Pan, J.R. Mixing water treatment residual with excavation waste soil in brick and artificial aggregate-making. J. Environ. Eng. ASCE 2005, 131, 272–277. [Google Scholar] [CrossRef]
- Chiang, K.Y.; Chou, P.H. Lightweight bricks manufactured from water treatment sludge and rice husks. J. Hazard. Mater. 2009, 171, 76–82. [Google Scholar] [CrossRef] [PubMed]
- El-Didamony, H.; Khalil, K.A.; Heikal, M. Physico-chemical and surface characteristics of some granulated slag-fired drinking water sludge composite cement pastes. HBRC J. 2014, 10, 73–81. [Google Scholar] [CrossRef]
- Kizinievic, O.; Zurauskiene, R.; Kizinievic, V.; Zurauskas, R. Utilisation of sludge waste from water treatment for ceramic products. Constr. Build. Mater. 2013, 41, 464–473. [Google Scholar] [CrossRef]
- Huang, C.H.; Wang, S.Y. Application of water treatment sludge in the manufacturing of lightweight aggregate. Constr. Build. Mater. 2013, 43, 174–183. [Google Scholar] [CrossRef]
- Yen, L.A. Evaluation on Characteristics of Coagulation Sludge and Reuses of Dewatering Sludge Cake from Water Treatment Plant. Master’s Thesis, Environmental Engineering Research Institute, National Central University, Taiwan, China, 2009. [Google Scholar]
- Razak, H.; Abdul Naganathan, S.; Abdul Hamid, S.N. Performance appraisal of industrial waste incineration bottom ash as controlled low-strength material. J. Hazard. Mater. 2009, 172, 862–867. [Google Scholar] [CrossRef] [PubMed]
- Wang, L.; Zou, F.; Fang, X.; Tsang, D.C.W.; Poon, C.S.; Leng, Z.; Baek, K. A novel type of controlled low strength material derived from alum sludge and green materials. Constr. Build. Mater. 2018, 165, 792–800. [Google Scholar] [CrossRef]
- Qasim, S.; Motley, E.; Zhu, G. Water Works Engineering; Prentice Hall: New Delhi, India, 2006. [Google Scholar]
- Taguchi, G. Introduction to Quality Engineering: Designing Quality into Products and Processes; Asian Productivity Organization: Tokyo, Japan, 1987. [Google Scholar]
- Roy, R.K. A Primer on the Taguchi Method, Competitive Manufacturing Series; Van Nostrand Reinhold: New York, NY, USA, 1990. [Google Scholar]
- Phadke, M.S. Quality Engineering Using Robust Design; Prentice Hall: Englewood Cliffs, NJ, USA, 1989. [Google Scholar]
- Montgomery, D.C. Design and Analysis of Experiments; Wiley: New York, NY, USA, 2005. [Google Scholar]
- Neville, A.M. Properties of Concrete; Longman: Harlow, UK, 1994. [Google Scholar]
- Chen, H.J.; Chang, S.N.; Tang, C.W. Application of the Taguchi method for optimizing the process parameters of producing lightweight aggregates by incorporating tile grinding sludge with reservoir sediments. Materials 2017, 10, 1294. [Google Scholar] [CrossRef] [PubMed]
- Tang, C.W. Properties of fired bricks by incorporating TFT-LCD waste glass powder with reservoir sediments. Sustainability 2018, 10, 2503. [Google Scholar] [CrossRef]
- Construction Outline Specification, Chapter 03377: Controlled Low-Strength Backfill Materials; Public Construction Commission of the Executive Yuan: Taiwan, China, 2007.
Figure 1.
X-ray diffraction (XRD) diffractograms of water purification sludge (WPS).

Figure 2.
Signal-to-noise (S/N) response graph for tube flow of tested mixtures.


Table 1.
Comparison of the composition of controlled low-strength material (CLSM) and ordinary concrete [3].
Table 1.
Comparison of the composition of controlled low-strength material (CLSM) and ordinary concrete [3].
| Raw Material | CLSM | Ordinary Concrete |
|---|---|---|
| Cement Binder (kg/m3) | 100–200 | 250–450 |
| Pozzolanic Material (kg/m3) | 50–100 | 0–100 |
| Water (kg/m3) | 200–450 | 180–220 |
| Water–Binder Ratio | >1 | 0.4–0.55 |
| Coarse Aggregate (kg/m3) | 200–400 | 700–1100 |
| Fine Aggregate (kg/m3) | 1280–1480 | 700–1000 |
| Admixture | Accelerator Agent, Foaming Agent, | Water Reducing Agent, Superplasticizers |
Table 2.
Physical property of aggregates.
| Type | Specific Gravity (SSD) * | Water Absorption (%) (SSD) | Unit Weight (Dry-Rodded) (kg/m3) | FM |
|---|---|---|---|---|
| Fine Aggregate | 2.63 | 1.31 | - | 2.93 |
| Coarse Aggregate | 2.60 | 1.20 | 1620 | - |
Notes: * SSD = saturated surface-dry condition; FM = fineness modulus.
Table 3.
Physical test results of water purification sludge (WPS).
| Sample | Specific Gravity | PI | Medium Particle Size D50 (mm) | Composition (Weight %) | |||
|---|---|---|---|---|---|---|---|
| Gravels (>4.75 mm) | Sands (4.75–0.075 mm) | Silts (0.075–0.005 mm) | Clays (<0.005 mm) | ||||
| WPS | 2.60 | 13 | 0.010 | 0 | 12 | 56 | 32 |
Note: PI = Plasticity index.
Table 4.
Chemical composition of WPS.
| Sample | Chemical Compositions (Weight %) | ||||||||
|---|---|---|---|---|---|---|---|---|---|
| SiO2 | Al2O3 | Fe2O3 | CaO | MgO | K2O | Na2O | SO3 | Total | |
| WPS | 62.3 | 22.0 | 11.0 | 2.62 | 1.10 | 0.79 | 0.08 | 0.11 | 100 |
Table 5.
Toxicity characteristic leaching procedure (TCLP) test results.
| Sample and Code | Heavy Metals (mg/L) | Note | ||||||||
|---|---|---|---|---|---|---|---|---|---|---|
| As | Pb | Cu | Ba | Se | Cd | Cr | Cr6+ | Hg | ||
| WPS | 0.005 | 0.08 | 0.051 | 8.41 | 0.003 | <MDL | 0.048 | <MDL | <MDL | Raw materials |
| EPA Regulations NIEA R201.15C | <5 | <5 | <15 | <100 | <1 | <1 | <5 | 2.5 | 0.2 | The standard for hazardous industrial wastes, EPA, Taiwan. |
Note: MDL = Method Detect Limit. EPA Regulations NIEA R201.15C = Waste toxicity characteristics dissolution procedure, Environmental Protection Administration, Taiwan.
Table 6.
Parameters and design levels for test mixtures.
| Parameter (Experimental Control Factor) | Levels of Parameter | Performance Parameter | |||
|---|---|---|---|---|---|
| 1 | 2 | 3 | 4 | ||
| Sludge Content, A (%) | 0 | 10 | 20 | 30 | Tube Flow (cm) |
| Water–Binder Ratio, B | 0.6 | 0.8 | 1.0 | 1.2 | Air Content (%) |
| Slag Content, C (%) | 40 | 45 | 50 | 55 | Fresh Unit Weight (kg/m3) |
| Accelerator Agent Content, D (%) | 4.25 | 4.50 | 4.75 | 5.00 | Maximum Ball-Drop Indentation Diameter (cm) |
| Coarse Aggregate Content, E (kg/m3) | 400 | 350 | 300 | 250 | Compressive Strength (MPa) |
Table 7.
Orthogonal array (L16(45)) for test mixtures.
| Experiment Number | Parameter (Level) | ||||
|---|---|---|---|---|---|
| Sludge Content (%) | Water–Binder Ratio | Slag Content (%) | AA Content (%) | CA Content (kg/m3) | |
| M1 | 0 (1) * | 0.6 (1) | 40 (1) | 4.25 (1) | 400 (1) |
| M2 | 0 (1) | 0.8 (2) | 45 (2) | 4.50 (2) | 350 (2) |
| M3 | 0 (1) | 1.0 (3) | 50 (3) | 4.75 (3) | 300 (3) |
| M4 | 0 (1) | 1.2 (4) | 55 (4) | 5.00 (4) | 250 (4) |
| M5 | 10 (2) | 0.6 (1) | 45 (2) | 4.75 (3) | 250 (4) |
| M6 | 10 (2) | 0.8 (2) | 40 (1) | 5.00 (4) | 300 (3) |
| M7 | 10 (2) | 1.0 (3) | 55 (4) | 4.25 (1) | 350 (2) |
| M8 | 10 (2) | 1.2 (4) | 50 (3) | 4.50 (2) | 400 (1) |
| M9 | 20 (3) | 0.6 (1) | 50 (3) | 5.00 (4) | 350 (2) |
| M10 | 20 (3) | 0.8 (2) | 55 (4) | 4.75 (3) | 400 (1) |
| M11 | 20 (3) | 1.0 (3) | 40 (1) | 4.50 (2) | 250 (4) |
| M12 | 20 (3) | 1.2 (4) | 45 (2) | 4.25 (1) | 300 (3) |
| M13 | 30 (4) | 0.6 (1) | 55 (4) | 4.50 (2) | 300 (3) |
| M14 | 30 (4) | 0.8 (2) | 50 (3) | 4.25 (1) | 250 (4) |
| M15 | 30 (4) | 1.0 (3) | 45 (2) | 5.00 (4) | 400 (1) |
| M16 | 30 (4) | 1.2 (4) | 40 (1) | 4.75 (3) | 350 (2) |
Note: * The numbers in parentheses indicate the level of the factor. AA = accelerator agent; CA = coarse aggregate.
Table 8.
Mix proportions of test mixtures.
| Experiment Number | W/B | W (kg/m3) | C (kg/m3) | Slag (kg/m3) | AA (kg/m3) | CA (kg/m3) | FA (kg/m3) | Sludge (kg/m3) |
| M1 | 0.60 | 150 | 150.0 | 100.0 | 10.63 | 400 | 1454 | 0 |
| M2 | 0.80 | 200 | 137.5 | 112.5 | 11.25 | 350 | 1372 | 0 |
| M3 | 1.00 | 250 | 125.0 | 125.0 | 11.88 | 300 | 1285 | 0 |
| M4 | 1.20 | 300 | 112.5 | 137.5 | 12.50 | 250 | 1199 | 0 |
| M5 | 0.60 | 150 | 137.5 | 112.5 | 11.88 | 250 | 1436 | 160 |
| M6 | 0.80 | 200 | 150.0 | 100.0 | 12.50 | 300 | 1278 | 142 |
| M7 | 1.00 | 250 | 112.5 | 137.5 | 10.63 | 350 | 1108 | 123 |
| M8 | 1.20 | 300 | 125.0 | 125.0 | 11.25 | 400 | 950 | 106 |
| M9 | 0.60 | 150 | 125.0 | 125.0 | 12.50 | 350 | 1190 | 298 |
| M10 | 0.80 | 200 | 112.5 | 137.5 | 11.88 | 400 | 1044 | 261 |
| M11 | 1.00 | 250 | 150.0 | 100.0 | 11.25 | 250 | 1075 | 269 |
| M12 | 1.20 | 300 | 137.5 | 112.5 | 10.63 | 300 | 929 | 232 |
| M13 | 0.60 | 150 | 112.5 | 137.5 | 11.25 | 300 | 1074 | 460 |
| M14 | 0.80 | 200 | 125.0 | 125.0 | 10.63 | 250 | 1023 | 439 |
| M15 | 1.00 | 250 | 137.5 | 112.5 | 12.50 | 400 | 829 | 355 |
| M16 | 1.20 | 300 | 150.0 | 100.0 | 11.88 | 350 | 778 | 334 |
Notes: W/B = water–binder ratio; W = water; C = cement; AA = accelerator agent; CA = coarse aggregate; FA = fine aggregate.
Table 9.
Experimental results and signal-to-noise (S/N) ratio of tested mixtures.
| Experiment Number | Experimental Results | S/N Ratio (dB) | ||||||||||
|---|---|---|---|---|---|---|---|---|---|---|---|---|
| Tf (cm) | AC (%) | Uw (kg/m3) | Di (cm) | 7-day fc’ (MPa) | 28-day fc’ (MPa) | Tf | AC | Uw | Di | 7-day fc’ | 28-day fc’ | |
| M1 | 7.0 | 3.3 | 2324 | 3.68 | 28.37 | 34.66 | −20.42 | 10.37 | −67.32 | −11.87 | 29.06 | −28.43 |
| M2 | 7.5 | 5.5 | 2159 | 4.72 | 21.68 | 28.37 | −20.00 | 14.81 | −66.69 | −9.19 | 26.72 | −26.06 |
| M3 | 22.0 | 2.0 | 2207 | 7.77 | 16.66 | 20.93 | −13.06 | 6.02 | −66.88 | 15.39 | 24.43 | −22.04 |
| M4 | 26.0 | 2.0 | 2097 | 9.84 | 11.24 | 16.37 | −18.59 | 6.02 | −66.43 | −7.00 | 21.02 | −18.16 |
| M5 | 7.0 | 2.9 | 2278 | 5.62 | 1.12 | 16.51 | −20.42 | 9.25 | −67.15 | −5.93 | 0.98 | −18.31 |
| M6 | 11.0 | 7.5 | 2069 | 7.54 | 8.25 | 15.56 | −16.26 | 17.50 | −66.32 | 24.44 | 18.33 | −17.24 |
| M7 | 22.0 | 5.0 | 2151 | 8.68 | 1.63 | 22.89 | −13.06 | 13.98 | −66.65 | −0.67 | 4.24 | −23.29 |
| M8 | 23.5 | 4.0 | 2054 | 9.23 | 7.38 | 11.77 | −15.56 | 12.04 | −66.25 | −4.24 | 17.36 | −10.86 |
| M9 | 7.0 | 1.0 | 2247 | 6.32 | 0.14 | 20.88 | −20.42 | 0.00 | −67.03 | −2.14 | −17.08 | −22.01 |
| M10 | 7.0 | 3.5 | 2092 | 7.40 | 0.21 | 12.46 | −20.42 | 10.88 | −66.41 | 13.98 | −13.56 | −12.42 |
| M11 | 14.0 | 6.4 | 2019 | 7.70 | 0.43 | 11.38 | −10.88 | 16.12 | −66.10 | 20.00 | −7.33 | −9.83 |
| M12 | 25.5 | 5.0 | 2015 | 10.90 | 2.52 | 8.69 | −18.06 | 13.98 | −66.09 | −10.37 | 8.03 | 7.74 |
| M13 | 7.0 | 4.0 | 2172 | 7.00 | 0.21 | 0.59 | −20.42 | 12.04 | −66.74 | 4.44 | −13.56 | −17.72 |
| M14 | 7.6 | 3.2 | 2131 | 7.46 | 0.32 | 0.49 | −19.91 | 10.10 | −66.57 | 17.08 | −9.90 | −17.83 |
| M15 | 15.5 | 6.0 | 1994 | 9.10 | 0.23 | 7.08 | −6.02 | 15.56 | −65.99 | −3.52 | −12.77 | −1.58 |
| M16 | 24.5 | 5.3 | 1965 | 9.72 | 0.17 | 5.03 | −16.90 | 14.49 | −65.87 | −6.53 | −15.39 | −10.24 |
Note: Tf = tube flow; AC = air content; Uw = fresh unit weight; Di = maximum ball-drop indentation diameter; 7-day fc’ = 7-day compressive strength; 28-day fc’ = 28-day compressive strength.
Table 10.
S/N response table for tube flow of tested mixtures.
| Parameter | Mean S/N Ratio (η, Unit: dB) | Delta (Max. η − Min. η) | Rank | |||
|---|---|---|---|---|---|---|
| Level 1 | Level 2 | Level 3 | Level 4 | |||
| Sludge Content, A (%) | −18.02 | −16.33 | −17.45 | −15.81 | 2.204 | 3 |
| Water–Binder Ratio, B | −20.42 | −19.15 | −10.76 | −17.28 | 9.666 | 1 |
| Slag Content, C (%) | −16.12 | −16.13 | −17.24 | −18.13 | 2.009 | 4 |
| Accelerator Agent Content, D (%) | −17.87 | −16.72 | −17.70 | −15.32 | 2.543 | 2 |
| Coarse Aggregate Content, E (kg/m3) | −15.61 | −17.60 | −16.95 | −17.45 | 1.990 | 5 |
Table 11.
Analysis of variance and F test for tube flow of tested mixtures.
| Parameter | Sum of Squares (SSZ) | Degrees of Freedom | Variance (MSZ) | F Value (FZ) | Percentage of Contribution (PZ) | p Value |
|---|---|---|---|---|---|---|
| Sludge Content, A (%) | 12.23 | 3 | 4.08 | 1.24 | 0.88 | 0.43192 |
| Water–Binder Ratio, B | 221.38 | 3 | 73.79 | 22.47 | 78.00 | 0.01474 * |
| Slag Content, C (%) | 11.32 | 3 | 3.77 | 1.15 | 18.71 | 0.45562 |
| Accelerator Agent Content, D (%) | 16.40 | 3 | 5.47 | 1.66 | 2.41 | 0.34368 |
| Coarse Aggregate Content, E (kg/m3) | 9.85 | 3 | 3.28 | 1.00 | 0.00 | 0.5 |
| All Other/Error | 9.85 | 3 | 3.28 | |||
| Total | 271.18 | 15 | 90.39 | 100 |
Note: * represents significance.
Table 12.
S/N response table for fresh unit weight of tested mixtures.
| Parameter | Mean S/N Ratio (η, Unit: dB) | Delta (Max. η − Min. η) | Rank | |||
|---|---|---|---|---|---|---|
| Level 1 | Level 2 | Level 3 | Level 4 | |||
| Sludge Content, A (%) | −66.83 | −66.59 | −66.41 | −66.29 | 0.537 | 2 |
| Water–Binder Ratio, B | −67.06 | −66.50 | −66.41 | −66.16 | 0.902 | 1 |
| Slag Content, C (%) | −66.40 | −66.48 | −66.68 | −66.56 | 0.280 | 3 |
| Accelerator Agent Content, D (%) | −66.66 | −66.44 | −66.58 | −66.44 | 0.215 | 4 |
| Coarse Aggregate Content, E (kg/m3) | −66.50 | −66.56 | −66.50 | −66.56 | 0.069 | 5 |
Table 13.
Analysis of variance and F test for fresh unit weight of tested mixtures.
| Parameter | Sum of Square (SSZ) | Degree of Freedom | Variance (MSZ) | F Value (FZ) | Percentage of Contribution (PZ) | p Value |
|---|---|---|---|---|---|---|
| Sludge Content, A (%) | 0.66 | 3 | 0.22 | 42.03 | 23.61 | 0.00597 * |
| Water–Binder Ratio, B | 1.74 | 3 | 0.58 | 111.21 | 63.42 | 0.00142 * |
| Slag Content, C (%) | 0.17 | 3 | 0.06 | 10.98 | 8.62 | 0.03990 ** |
| Accelerator Agent Content, D (%) | 0.13 | 3 | 0.04 | 8.56 | 4.35 | 0.05559 |
| Coarse Aggregate Content, E (kg/m3) | 0.02 | 3 | 0.01 | 1.00 | 0.00 | 0.5 |
| All Other/Error | 0.02 | 3 | 0.01 | |||
| Total | 2.73 | 15 | 0.91 | 100 |
Note: * represents significance; ** represents sub-significance.
Table 14.
S/N response table for air content of tested mixtures.
| Parameter | Mean S/N Ratio (η, Unit: dB) | Delta (Max. η − Min. η) | Rank | |||
|---|---|---|---|---|---|---|
| Level 1 | Level 2 | Level 3 | Level 4 | |||
| Sludge Content, A (%) | 9.30 | 13.19 | 10.25 | 13.05 | 3.888 | 4 |
| Water–Binder Ratio, B | 7.91 | 13.32 | 12.92 | 11.63 | 5.408 | 2 |
| Slag Content, C (%) | 14.62 | 13.40 | 7.04 | 10.73 | 7.579 | 1 |
| Accelerator Agent Content, D (%) | 12.11 | 13.75 | 10.16 | 9.77 | 3.982 | 3 |
| Coarse Aggregate Content, E (kg/m3) | 12.21 | 10.82 | 12.39 | 10.37 | 2.012 | 5 |
Table 15.
Analysis of variance and F test for air content of tested mixtures.
| Parameter | Sum of Square (SSZ) | Degree of Freedom | Variance (MSZ) | F Value (FZ) | Percentage of Contribution (PZ) | p Value |
|---|---|---|---|---|---|---|
| Sludge Content, A (%) | 46.57 | 3 | 15.52 | 3.86 | 11.22 | 0.14828 |
| Water–Binder Ratio, B | 72.82 | 3 | 24.27 | 6.03 | 19.75 | 0.08709 |
| Slag Content, C (%) | 135.22 | 3 | 45.07 | 11.21 | 59.66 | 0.03879 * |
| Accelerator Agent Content, D (%) | 40.89 | 3 | 13.63 | 3.39 | 9.37 | 0.17139 |
| Coarse Aggregate Content, E (kg/m3) | 12.07 | 3 | 4.02 | 1.00 | 0.00 | 0.5 |
| All Other/Error | 12.07 | 3 | 4.02 | |||
| Total | 307.57 | 15 | 102.52 | 100 |
Note: * represents significance.
Table 16.
S/N response table for ball-drop indentation diameter of tested mixtures.
| Parameter | Mean S/N Ratio (η, Unit: dB) | Delta (Max. η − Min. η) | Rank | |||
|---|---|---|---|---|---|---|
| Level 1 | Level 2 | Level 3 | Level 4 | |||
| Sludge Content, A (%) | −3.17 | 3.40 | 5.37 | 2.87 | 8.533 | 4 |
| Water–Binder Ratio, B | −3.88 | 11.58 | 7.80 | −7.04 | 18.613 | 1 |
| Slag Content, C (%) | 6.51 | −7.25 | 6.52 | 2.69 | 13.773 | 2 |
| Accelerator Agent Content, D (%) | −1.46 | 2.75 | 4.23 | 2.94 | 5.684 | 5 |
| Coarse Aggregate Content, E (kg/m3) | −1.41 | −4.63 | 8.47 | 6.03 | 13.105 | 3 |
Table 17.
Analysis of variance and F test for ball-drop indentation diameter of tested mixtures.
| Parameter | Sum of Squares (SSZ) | Degrees of Freedom | Variance (MSZ) | F Value (FZ) | Percentage of Contribution (PZ) | p Value |
|---|---|---|---|---|---|---|
| Sludge Content, A (%) | 162.72 | 3 | 54.24 | 2.22 | 4.13 | 0.26470 |
| Water–Binder Ratio, B | 965.95 | 3 | 321.98 | 13.19 | 41.25 | 0.03108 * |
| Slag Content, C (%) | 507.29 | 3 | 169.10 | 6.93 | 36.97 | 0.07308 ** |
| Accelerator Agent Content, D (%) | 73.23 | 3 | 24.41 | 1.00 | 0.00 | 0.5 |
| Coarse Aggregate Content, E (kg/m3) | 455.05 | 3 | 151.68 | 6.21 | 17.64 | 0.08394 |
| All Other/Error | 73.23 | 3 | 24.41 | |||
| Total | 2164.25 | 15 | 721.42 | 100 |
Note: * represents significance; ** represents sub-significance.
Table 18.
S/N response table for the 7-day compressive strength of tested mixtures.
| Parameter | Mean S/N Ratio (η, Unit: dB) | Delta (Max. η − Min. η) | Rank | |||
|---|---|---|---|---|---|---|
| Level 1 | Level 2 | Level 3 | Level 4 | |||
| Sludge Content, A (%) | 25.31 | 10.23 | −7.48 | −12.90 | 38.209 | 1 |
| Water–Binder Ratio, B | −0.15 | 5.40 | 2.15 | 7.75 | 7.901 | 4 |
| Slag Content, C (%) | 6.17 | 5.74 | 3.71 | −0.46 | 6.629 | 5 |
| Accelerator Agent Content, D (%) | 7.86 | 5.80 | −0.88 | 2.38 | 8.740 | 3 |
| Coarse Aggregate Content, E (kg/m3) | 5.02 | −0.38 | 9.31 | 1.19 | 9.685 | 2 |
Table 19.
Analysis of variance and F test for the 7-day compressive strength of tested mixtures.
| Parameter | Sum of Squares (SSZ) | Degrees of Freedom | Variance (MSZ) | F Value (FZ) | Percentage of Contribution (PZ) | p Value |
|---|---|---|---|---|---|---|
| Sludge Content, A (%) | 3640.70 | 3 | 1213.57 | 33.03 | 82.12 | 0.00848 * |
| Water–Binder Ratio, B | 146.04 | 3 | 48.68 | 1.33 | 0.83 | 0.41014 |
| Slag Content, C (%) | 110.21 | 3 | 36.74 | 1.00 | 12.82 | 0.5 |
| Accelerator Agent Content, D (%) | 177.66 | 3 | 59.22 | 1.61 | 1.57 | 0.35258 |
| Coarse Aggregate Content, E (kg/m3) | 224.32 | 3 | 74.77 | 2.04 | 2.65 | 0.28654 |
| All Other/Error | 110.21 | 3 | 36.74 | |||
| Total | 4298.92 | 15 | 1432.97 | 100 |
Note: * represents significance.
Table 20.
S/N response table for the 28-day compressive strength of tested mixtures.
| Parameter | Mean S/N Ratio (η, Unit: dB) | Delta (Max. η − Min. η) | Rank | |||
|---|---|---|---|---|---|---|
| Level 1 | Level 2 | Level 3 | Level 4 | |||
| Sludge Content, A (%) | −23.67 | −17.43 | −9.13 | −11.84 | 14.543 | 1 |
| Water–Binder Ratio, B | −21.61 | −18.39 | −14.19 | −7.88 | 13.738 | 2 |
| Slag Content, C (%) | −16.43 | −9.55 | −18.18 | −17.90 | 8.632 | 4 |
| Accelerator Agent Content, D (%) | −15.45 | −16.12 | −15.75 | −14.75 | 1.367 | 5 |
| Coarse Aggregate Content, E (kg/m3) | −13.32 | −20.40 | −12.31 | −16.03 | 8.085 | 3 |
Table 21.
Analysis of variance and F test for 28-day compressive strength of tested mixtures.
| Parameter | Sum of Square (SSZ) | Degree of Freedom | Variance (MSZ) | F Value (FZ) | Percentage of Contribution (PZ) | p Value |
|---|---|---|---|---|---|---|
| Sludge Content, A (%) | 497.80 | 3 | 165.93 | 123.32 | 38.65 | 0.00122 * |
| Water–Binder Ratio, B | 422.28 | 3 | 140.76 | 104.61 | 32.74 | 0.00156 * |
| Slag Content, C (%) | 196.84 | 3 | 65.61 | 48.76 | 16.67 | 0.00481 * |
| Accelerator Agent Content, D (%) | 4.04 | 3 | 1.35 | 1.00 | 0.00 | 0.5 |
| Coarse Aggregate Content, E (kg/m3) | 156.70 | 3 | 52.23 | 38.82 | 11.95 | 0.00670 ** |
| All Other/Error | 4.04 | 3 | 1.35 | |||
| Total | 1277.65 | 15 | 425.88 | 100 |
Note: * represents significance; ** represents sub-significance.
Table 22.
Unit price of CLSM materials.
| C (NT$/kg) | Slag (NT$/kg) | W (NT$/kg) | AA (NT$/kg) | CA (NT$/kg) | FA (NT$/kg) | Sludge (NT$/kg) | WRA (NT$/kg) |
|---|---|---|---|---|---|---|---|
| 2.5 | 1.3 | 0 | 20 | 0.6 | 0.7 | −0.5 | 15 |
Notes: C = cement; W = water; AA = accelerator agent; CA = coarse aggregate; FA = fine aggregate; WRA = water reducing agent.
Table 23.
Cost Analysis of CLSM.
| Type of CLSM | W/B | Binder (kg/m3) | W (kg/m3) | AA (kg/m3) | CA (kg/m3) | FA (kg/m3) | Sludge (kg/m3) | WRA (kg/m3) | Unit Price (NT$/m3) | |
|---|---|---|---|---|---|---|---|---|---|---|
| C | Slag | |||||||||
| CLSM-1 | 1.20 | 100.0 | 150.0 | 300 | 12.50 | 350 | 1089 | 0 | 2.00 | 1696.99 |
| CLSM-2 | 1.00 | 137.5 | 112.5 | 250 | 12.50 | 350 | 864 | 370 | 2.00 | 1399.57 |
Notes: CLSM-1 = ordinary CLSM; CLSM-2 = CLSM containing WPS; W/B = water–binder ratio; W = water; C = cement; AA = accelerator agent; CA = coarse aggregate; FA = fine aggregate; WRA = water reducing agent.
© 2019 by the authors. Licensee MDPI, Basel, Switzerland. This article is an open access article distributed under the terms and conditions of the Creative Commons Attribution (CC BY) license (http://creativecommons.org/licenses/by/4.0/).
Share and Cite
MDPI and ACS Style
Tang, C.-W.; Cheng, C.-K. Partial Replacement of Fine Aggregate Using Water Purification Sludge in Producing CLSM. Sustainability 2019, 11, 1351. https://doi.org/10.3390/su11051351
AMA Style
Tang C-W, Cheng C-K. Partial Replacement of Fine Aggregate Using Water Purification Sludge in Producing CLSM. Sustainability. 2019; 11(5):1351. https://doi.org/10.3390/su11051351
Chicago/Turabian StyleTang, Chao-Wei, and Chiu-Kuei Cheng. 2019. "Partial Replacement of Fine Aggregate Using Water Purification Sludge in Producing CLSM" Sustainability 11, no. 5: 1351. https://doi.org/10.3390/su11051351
Note that from the first issue of 2016, this journal uses article numbers instead of page numbers. See further details here.