Exploring Urban Expansion and Socioeconomic Vitality Using NPP-VIIRS Data in Xia-Zhang-Quan, China


1
Key Laboratory of Urban Environment and Health, Institute of Urban Environment, Chinese Academy of Sciences, Xiamen 361021, China
2
University of Chinese Academy of Sciences, Beijing 100049, China
*
Author to whom correspondence should be addressed.
Sustainability 2019, 11(6), 1739; https://doi.org/10.3390/su11061739
Submission received: 18 February 2019
/
Revised: 17 March 2019
/
Accepted: 18 March 2019
/
Published: 22 March 2019
(This article belongs to the Special Issue Urban Sprawl and Sustainability)
Abstract
:Studying the spatiotemporal evolution of urban expansion in the Xia-Zhang-Quan metropolitan area (XZQ) is of crucial importance, to effectively guide coordinated development and industrial adjustment during urbanization. Based on National Polar Partnership-Visible Infrared Imaging Radiometer Suite (NPP-VIIRS) data this study used an analytical method of irregular spatial grids to explore and evaluate the dynamics of urban spatial expansion and urban socioeconomic vitality in XZQ between 2013 and 2017. The results show that the gulf-type urban development strategy of Xiamen has played a key role in the integration and development of XZQ. The urban area increased by 20–30% and increased intensity of socioeconomic activities was demonstrated by observed increases in the total brightness of urban nighttime light. Due to its unique advantages in the agricultural industries, Zhangzhou made significant economic progress during 2013–2017. At the same time, driven by spatial processes in Xiamen, areas such as the Zhangzhou Port Area and Longhai also achieved significant progress. This is also the case in Quanzhou and thus, collectively there is evidence of multi-polar growth. Jinjiang and Shishi effectively utilized coastal port economy development advantages to play a key role in the integration and development of XZQ. There were both commonalities and differences in terms of the characteristics of spatial expansion in different cities of XZQ. In summary, this study provides evidence to support further promotion of coordinated development in XZQ, and with appropriate caveats these findings could also be transferred to other urban agglomerations.
1. Introduction
Urbanization is characterized by dramatic expansion of urban land and urban population growth, with concomitant anthropogenic stressors contributing to widespread environmental changes [1,2,3]. Rapid urbanization has caused various environmental problems, including pollution, resource shortages, stresses on energy supplies, reduced biodiversity, and so on [4,5]. Globally, 55% of the world’s population were living in urban areas in 2018 and the proportion is expected to increase to 68% by 2050, with most of the increase in developing countries [6,7]. In the context of global urbanization and economic globalization, the megalopolises of the world have begun merging toward “super-urban agglomerations.” These trends clearly indicate that urban agglomerations are becoming an important way to increase regional competitiveness, as well as a novel approach to promote economic development, and coordinate environmentally sustainable socioeconomic development by integrating resources on regional scales [8,9,10]. Therefore, focusing on the effective planning and management of urban growth in urban agglomerations and understanding the mechanisms that drive urbanization have become increasingly crucial for national sustainable development.
Analyses of the processes and dynamic characteristics of urban expansion are important, so as to understand urban agglomeration and metropolitan development under the guidance of integrated development strategies. Hitherto, studies of the dynamic characteristics of urban expansion have mainly been based on high-resolution remote sensing data in the form of Landsat TM images [3,11,12,13,14,15,16], socioeconomic data [17,18,19], and observed regional temperature data [2]. In recent years, nighttime light remote sensing has become a particular focus. Nighttime light remote sensing is suitable for large-scale dynamic monitoring of urban land expansion during the process of urbanization, and thus plays an important role in understanding global and regional urbanization processes [20,21]. In addition, compared to ordinary remote sensing images, nighttime light remote sensing images can more accurately reflect human activities, and a large number of studies have shown that nighttime light is highly correlated with Gross Domestic Product(GDP). Therefore, nighttime light can also be used to characterize the level of socioeconomic development in a region [22,23,24]. However, it can be seen from the relevant literature that most nighttime light remote sensing data have been used to separately study urban expansion [25,26,27] or socioeconomic phenomena [24,28,29,30,31]. It is more common to use multi-source data to study the relationship between urban expansion and socioeconomic activities [32]. Moreover, there are few comparisons of urban growth patterns between different-size cities in urban agglomerations [33]. Therefore, this paper attempted to use nighttime light remote sensing data to simultaneously analyze and evaluate the dynamics of urban spatial expansion and urban socioeconomic vitality, and compare urban expansion patterns among different cities, so as to provide a basis for the coordinated development of urban agglomerations.
There are currently three main types of lighting data: Defense Meteorological Satellite Program -Operational Linescan System (DMSP-OLS) data (spatial resolution, 5km at nadir; temporal resolution of version 4 dataset, yearly) [34], National Polar Partnership-Visible Infrared Imaging Radiometer Suite (NPP-VIIRS) data (spatial resolution, 742 m; temporal resolution of VIIRS Day/Night Band products, daily) [35] and Luojia 1-01 data (spatial resolution, 130 m; available period, June, 2018–present) [36]. Since Croft [37] first used DMSP-OLS to extract data from urban built-up areas in 1978, the feasibility of using lighting data for urban dynamic monitoring and research has been effectively shown in different regions on different scales [27,38,39,40,41]. In spite of this, NPP-VIIRS lighting remote sensing data has higher spatial resolution, a wider radiation range, and better sensitivity to low light [34]. In addition, scholars have revealed that NPP-VIIRS data is more accurate than DMSP-OLS data in terms of urban land extraction [35,42,43]. Further, NPP-VIIRS offers more data compared to Luojia 1-01, so it was selected as the data source in this study.
In the existing literature, the expansion intensity index (EII) is often used to characterize the intensity of urbanization [44,45]. However, EII only reflects the urbanization intensity of a predetermined research area to a certain extent and does not allow for comparisons between different time periods and spaces. Therefore, to compare urban expansion on different temporal and spatial scales, this study chose urban spatial expansion ability to assess urban spatial expansion intensity. In addition, to analyze the directional characteristics of urban land expansion, this study adopted the irregular grid division method combining the eight-direction division method and the equally spaced concentric circles division method [46] to describe the azimuth differentiation pattern of the expansion of construction land, and reveal the spatial characteristics of construction land as a function of distance.
Based on NPP-VIIRS lighting data and yearbook statistics, the urban built-up area in the Xia-Zhang-Quan metropolitan area was extracted. Next, the spatial distribution characteristics of lighting data and the socioeconomic vitality in this area were also analyzed. The aim of this study was to clarify the characteristics of urban expansion during the urbanization process of the Xia-Zhang-Quan metropolitan area, thus providing a basis for decision-making regarding the integration of cities. The remainder of the paper is arranged as follows. The second part introduces the main data sources and methods. The third part presents the spatial and temporal dynamics of urban expansion and socioeconomic development in the Xia-Zhang-Quan metropolitan area. The fourth part conatins a discussion of the results of the analysis, while the fifth part of the paper offers conclusions, limitations, and future research ideas.
2. Materials and Methods
2.1. Overview of the Research Area
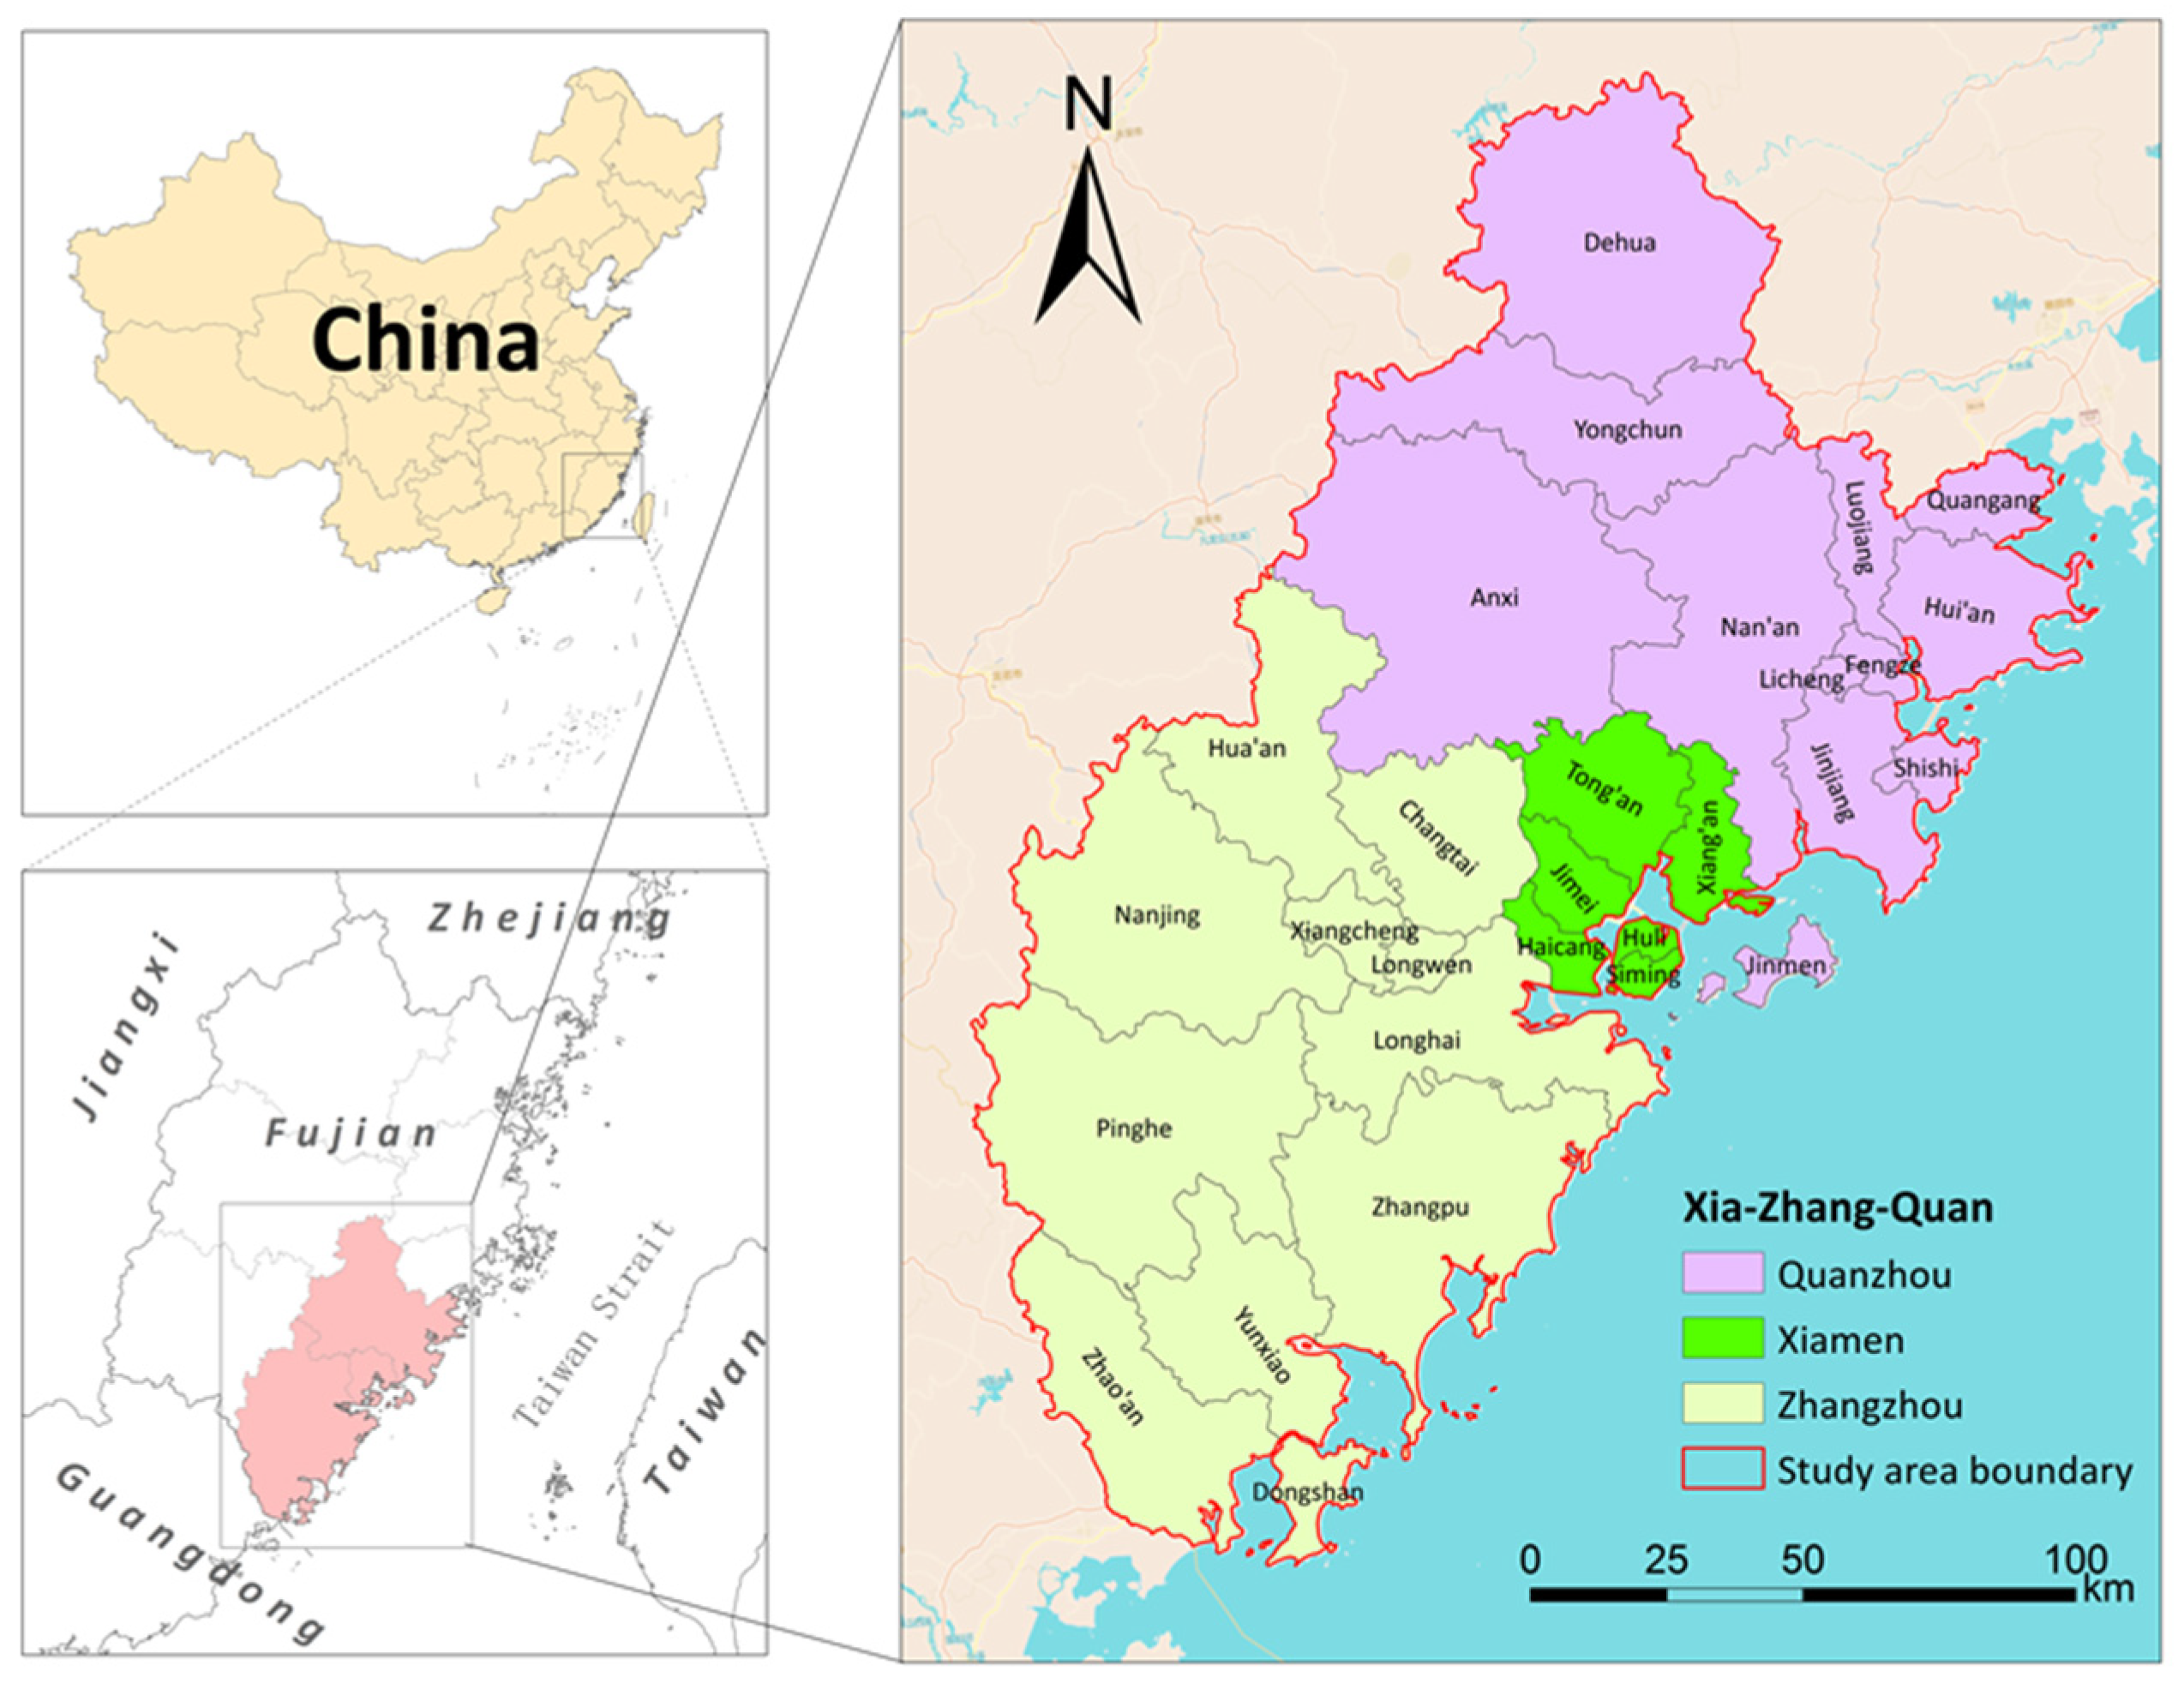
The Xia-Zhang-Quan metropolitan area (also called the Hokkien Golden Triangle or the Hokkien Triangle) includes Xiamen City, Zhangzhou City, and Quanzhou City, as well as counties under the jurisdiction of these cities (due to data availability issues, this study does not consider Jinmen County). The Xia-Zhang-Quan metropolitan area is located in the coastal area of Southeast Fujian (116°53′21″–119°01′38″E, 23°33′20″–25°56’45″N) (Figure 1). According to the 2018 Statistical Yearbook of Xiamen City, Zhangzhou City, and Quanzhou City, the city of Xiamen has a land area of 1700.61 square kilometers, with a regional GDP of 435.172 billion yuan in 2017 and a permanent resident population of 4.01 million. The land area, regional GDP in 2017, and permanent resident population of Quanzhou City were 11,015 square kilometers, 754.783 billion yuan, and 8.65 million, respectively. The land area, regional GDP in 2017, and permanent resident population of Zhangzhou City were 12,882.27 square kilometers, 352.853 billion yuan, and 5.1 million, respectively. Xiamen, Zhangzhou, and Quanzhou are geographically adjacent, with similar languages, cultures, and customs. Personnel exchanges among these three cities are frequent, and their economic development and market systems are closely related. In addition, with the continuous advancement of urbanization and the integration of transportation networks in these three cities, the size of their urban areas is expanding continuously. As a result, the economic spaces and boundaries among these three cities are becoming increasingly blurred, while the systems underlying joint construction and sharing among them are being constantly adapted, leading to increased integration of their industries, spaces, and societies. In July 2011, the first joint meeting of the Chinese Communist Party and the government committees of the integrated Xia-Zhang-Quan metropolitan area officially launched the process of integrated urbanization for these three cities. Since then, integrated development in the Xia-Zhang-Quan metropolitan area has become the basic direction for city planning and construction. In 2012, the three cities jointly compiled a document entitled “Overall Planning for the Integrated Development of the Xia-Zhang-Quan Metropolitan Area” [47], which covers the three municipalities of Xiamen, Zhangzhou, and Quanzhou (including 12 towns and communities in Nan’an City). The aim of this plan was to build a metropolitan area with a core area of 7772 square kilometers, equivalent to seven times the area of Hong Kong. The document proceeds along six major domains, that is, history and culture, regional space, characteristic resources, transportation facilities, industry, and social connections, to establish a spatial pattern of “one core, six districts and three zones”. At the same time, it is clearly stated that the Xia-Zhang-Quan metropolitan area is expected to achieve a high degree of integration with regard to industry, space, and society by 2020. Due to differences among these three cities in terms of their locations, resource endowments, taxation policies, industrial structures, and quality of economic development, they will play distinct roles in the future development of the Xia-Zhang-Quan metropolitan area. Therefore, it is important to coordinate the development processes of these three cities. To achieve this goal, integration during the construction process of the metropolitan area must proceed by thoroughly studying empirical realities in these three cities. The results of this effort will play an important role in guiding and promoting future sustainable development in the Xia-Zhang-Quan metropolitan area.
2.2. Data Source
Nighttime light remote sensing data were obtained from the first version of the monthly average radiation composite image dataset (hereinafter referred to as the NPP-VIIRS) produced from the nighttime light data acquired by Earth Observation Group of NOAA’s National Centers for Environmental Information (NCEI) in the United States using the Day/Night band (DNB) of the Visible Infrared Imaging Radiometer Suite (VIIRS) equipped on the Suomi National Polar Partnership (Suomi-NPP). These data were preprocessed to remove effects from stray light, lightning, lunar illumination, and clouds [48]. The spatial resolution is 742 m, and the digital number (DN) value of each pixel represents the radiance of night light in units of nano-Watts/cm2/sr [35]. To eliminate the ‘blooming’ problem of nighttime light data, many solutions have been proposed. Among these methods, the thresholding technique is commonly used to extract data from urban areas. This technique not only can shrink nighttime light to converge on the actual urban built-up area, but also can attenuate the effect of small settlement patches [25]. Therefore, this method was adopted in this study. The dataset was processed to obtain the yearly average nighttime light product for 2013, 2015, and 2017 (Figure 2) by taking the average of the 12 monthly products in each year. Further, additional data used in this study were derived from the statistical yearbooks of Xiamen City, Zhangzhou City, Quanzhou City, and Fujian province.
2.3. Urban Built-up Area Extraction Method
To a certain extent, the urban built-up area reflects the size of the urbanized area in a city. The urban built-up area refers to the area in a municipal administrative zone that has undergone core development and construction of municipal public facilities. Previous studies have shown that higher intensity lighting is associated with a higher probability that the corresponding area is an urban built-up area [49]. Based on the trend of rapid urbanization in China in recent years, it can be assumed that most urban built-up areas are continuously increasing in size, that is, urban patches appearing in a lighting image taken during an earlier period will likely be retained in lighting images of the same area during a later period. Based on this assumption, a threshold value was set in this study using the dichotomy method and continuously adjusted by comparing the size of the extracted urban built-up area with statistical data, until the total size of the urban built-up area extracted based on the lighting data at a specific threshold value was closest to the size indicated by those statistical data. The specific threshold value determined using this approach was then considered as the most appropriate threshold value for the extracted urban built-up area of the city in that specific year. This study used the image data obtained by the Day/Nighttime band of the NPP-VIIRS, as well as the statistical yearbook for the corresponding year, to extract the urban built-up areas in Xiamen, Zhangzhou, and Quanzhou in 2013, 2015, and 2017. The data obtained were then used as the fundamental input for the analysis of urbanization.
2.4. Spatial Expansion Ability Analysis
In the existing literature, the expansion intensity index (EII) is often used to characterize the intensity of urbanization. EII refers to the percentage of expanded area of urban land use in the total land area of a spatial unit during the study period [44,45]. The larger the EII value, the faster the urban expansion. However, EII only reflects the urbanization intensity of a predetermined research area to a certain extent and does not allow for comparisons between different time periods and spaces. First of all, from a temporal perspective, as the level of urbanization in a given region continues to increase, the proportion of urban land use will also continue to increase, and the area available for future expansion in the region will decrease continuously. Therefore, even if the magnitude of urban spatial expansion remains the same in two time periods, this study suggests that the spatial expansion ability in the latter period will be higher. Secondly, from a spatial perspective, two research areas of nearly equal size are distinct because of differences in their basic topography and landforms. Therefore, if a grid in one research area contains features such as mountains, bodies of water, ecological wetlands, and basic farmland, with no urban expansion ability, then accurate identification of urban expansion intensity in this area must consider the impact of these features. Therefore, to compare urban expansion on different temporal and spatial scales, this study chose urban spatial expansion ability to assess urban spatial expansion intensity.
This study aimed to measure the regional integration ability of Xiamen, Zhangzhou, and Quanzhou in the integration process of the Xia-Zhang-Quan metropolitan area by comparing the process characteristics of spatial expansion; thus the spatial expansion ability of each city was used to characterize its corresponding characteristics. Spatial expansion ability refers to the percentage of expanded urban land use in the remaining area of expandable construction land in a region within a certain time interval. As the level of urbanization in a city increases, the spatial expansion ability of that city decreases until it reaches zero. The equation for the spatial expansion ability of a city is as follows:
where MAIt ~t+n is the spatial expansion ability in the study period, MUPt+n and MUPt are the areas of urban construction land use in years t + n and t, respectively, and MTP is the area of available construction land remaining in the research area in year t. The remaining available construction land refers to the area remaining for future development after areas of used construction land and unusable land, such as mountains and bodies of water, are subtracted from the study area.
2.5. Spatial Expansion Type Analysis
There are three main types of urban land expansion: infilling, edge expansion, and outlying (Figure 3). In infilling expansion, newly added construction land is mostly surrounded by existing urban land and thus grows within the original urban land. Edge expansion refers to the outward expansion of new urban land along the edges of original urban land. In outlying expansion, newly added urban land is separated from original urban land and undergoes development relatively independently from the original urban land. In this paper, the urban growth type index (UGTI) [50,51] was used to distinguish different types of urban land expansion. The UGTI was calculated as follows:
where R refers to the UGTI, Lc represents the length of the edge shared by the newly added urban land and the original urban land, and L refers to the perimeter of the newly added urban land. When R > 0.5, more than 50% of the newly added construction land is surrounded by original urban land and thus infilling expansion is achieved. When 0 < R ≤ 0.5, at most 50% of the newly added construction land is surrounded by original urban land, and thus edge expansion is achieved. When R = 0, the newly added construction land is not connected with original construction land and thus outlying expansion is achieved.
2.6. Spatial Expansion Direction Analysis
To analyze the directional characteristics of urban land expansion, this study adopted the irregular grid division method, combining the eight-direction division method and the equally spaced concentric circles division method [46]. The eight-direction division method refers to the fact that the research area is divided into eight quadrants The core zone of the study area is the center, the East-West direction is the horizontal axis, and the North-South direction is the vertical axis. The equally spaced concentric circles division method is a ring layer analysis method based on buffer analysis. Multiple circular buffers are established with equal radius in the selected city center, which are superimposed with the land use layers in various periods to analyze the ring structure characteristics of urban construction land. By combining the two methods to quantitatively analyze urban land expansion dynamics in the grid composed of different directions and different distance circles from the city center, the azimuth differentiation pattern of the expansion of construction land can be described and the spatial characteristics of construction land dynamics as a function of distance can also be revealed.
3. Results
3.1. Dynamic Temporal and Spatial Analysis of Urban Spatial Expansion
3.1.1. Expansion of Urban Land Use in the Three Cities
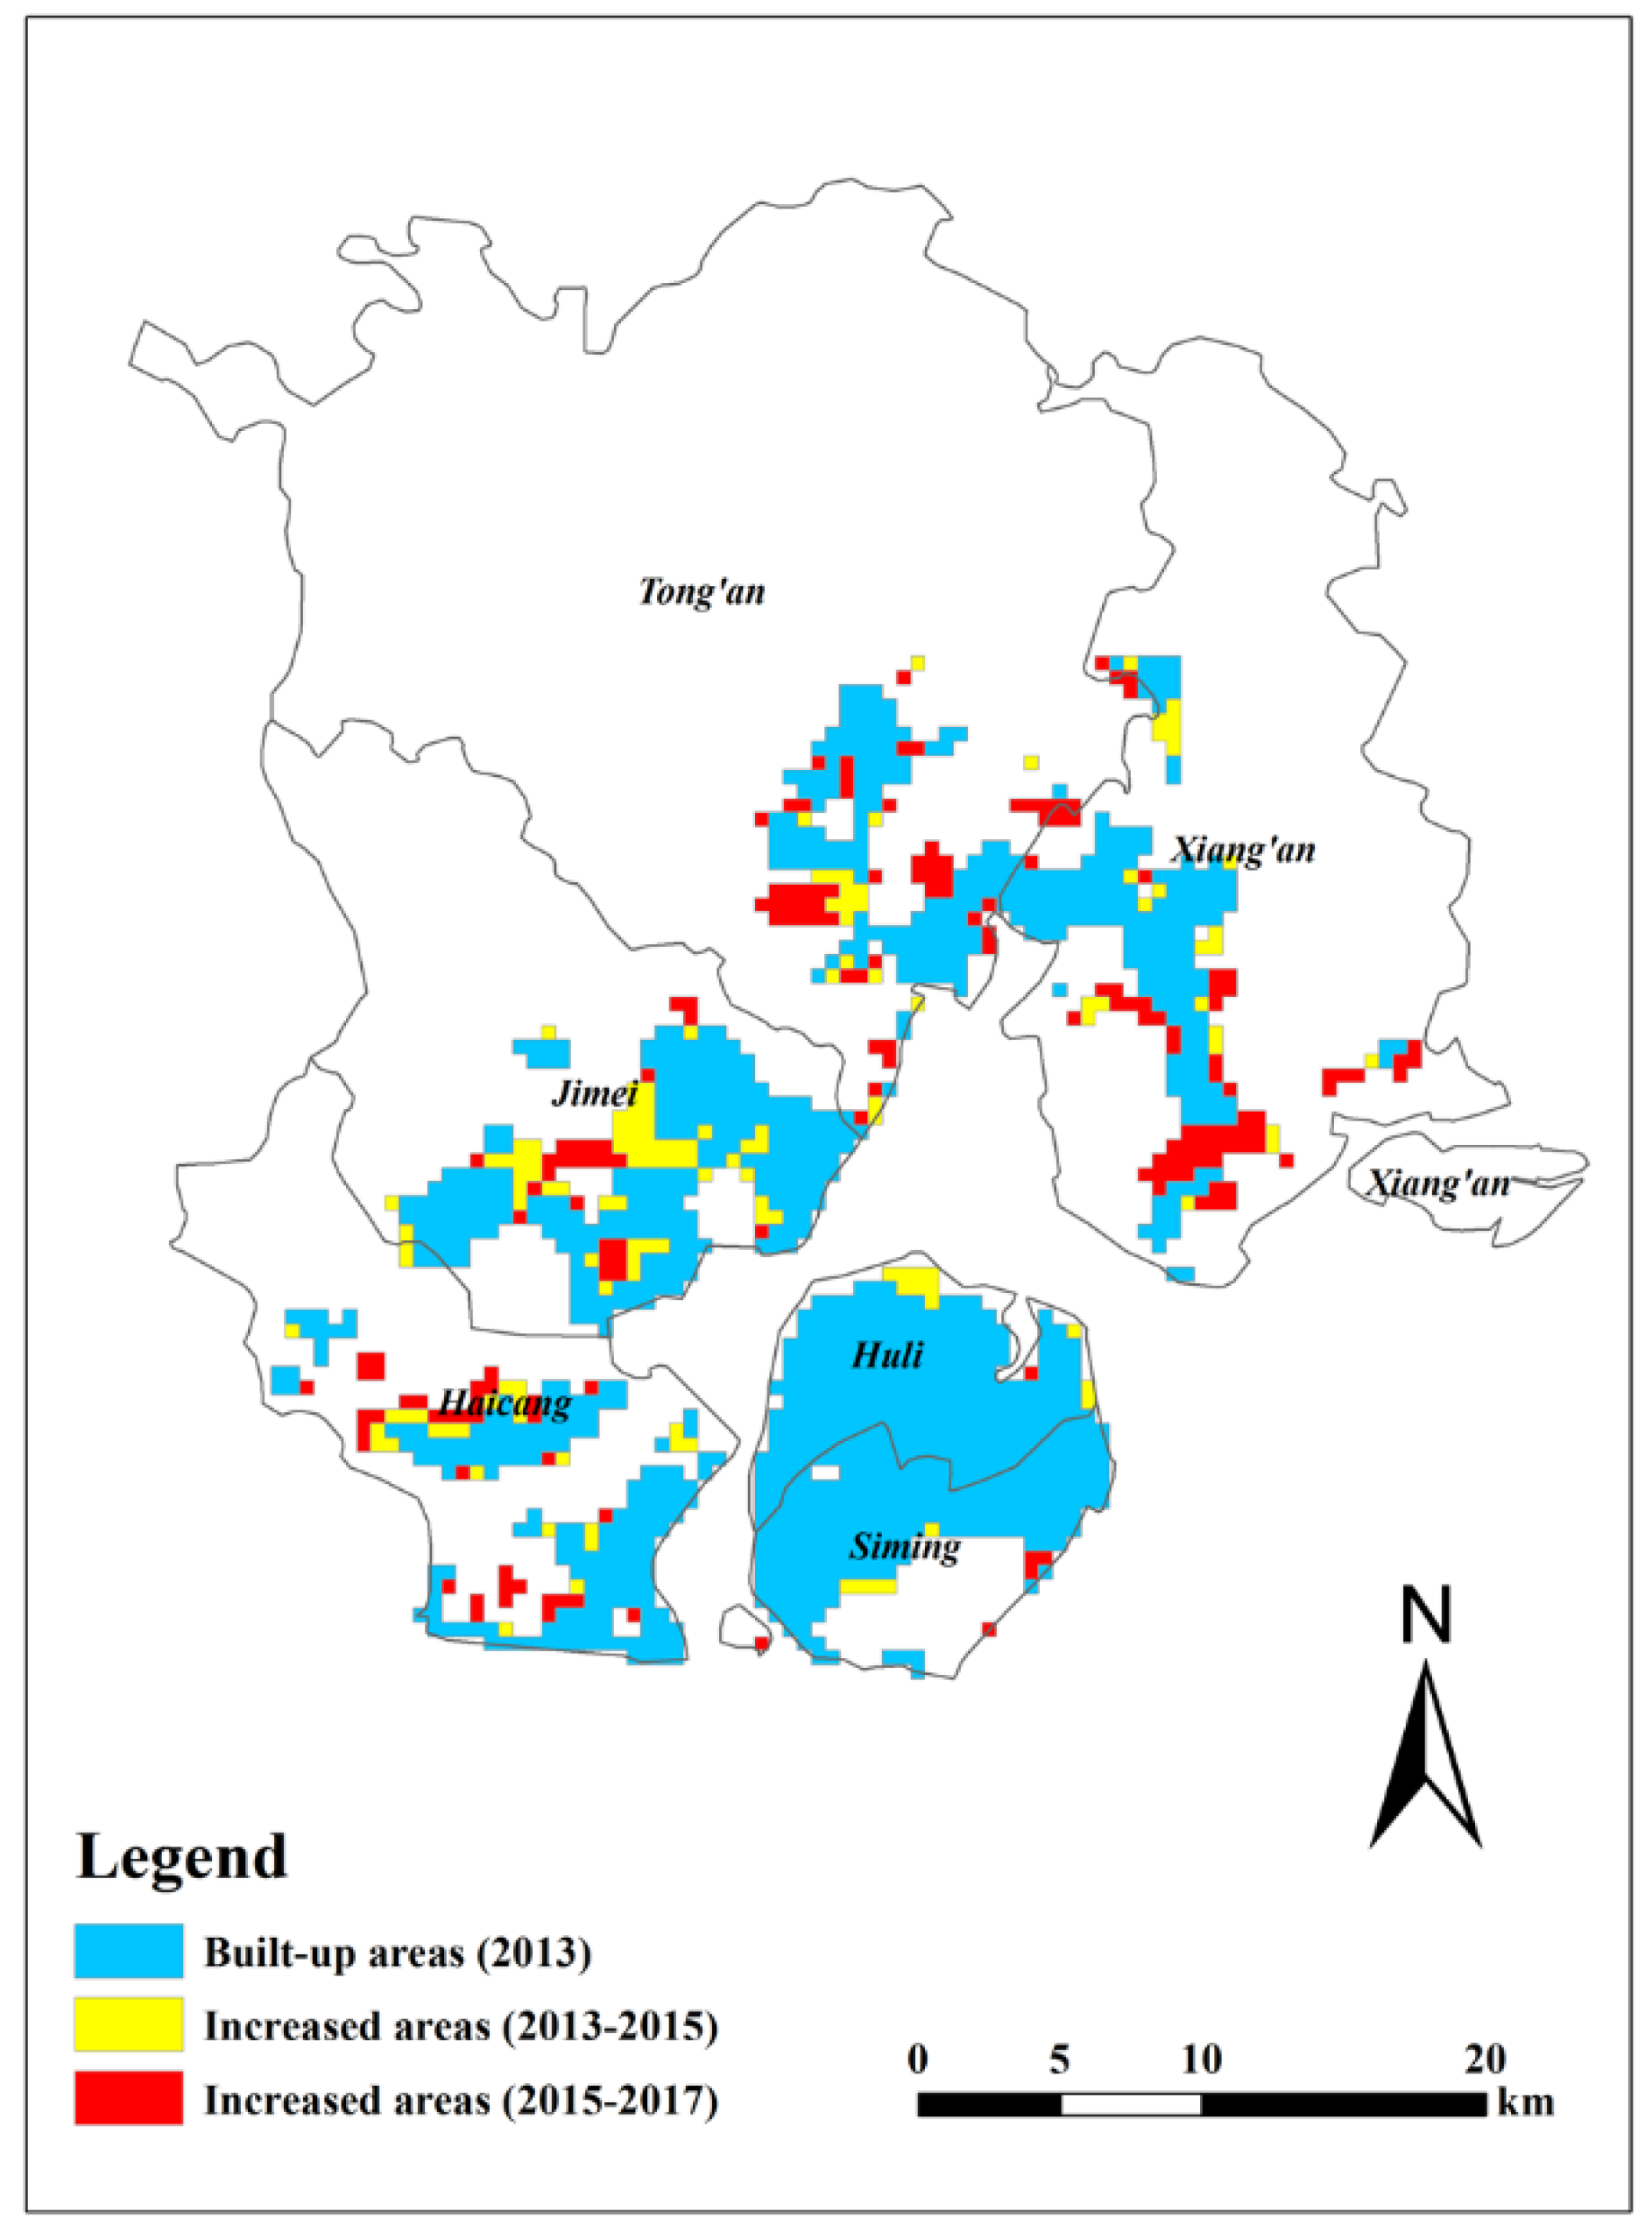
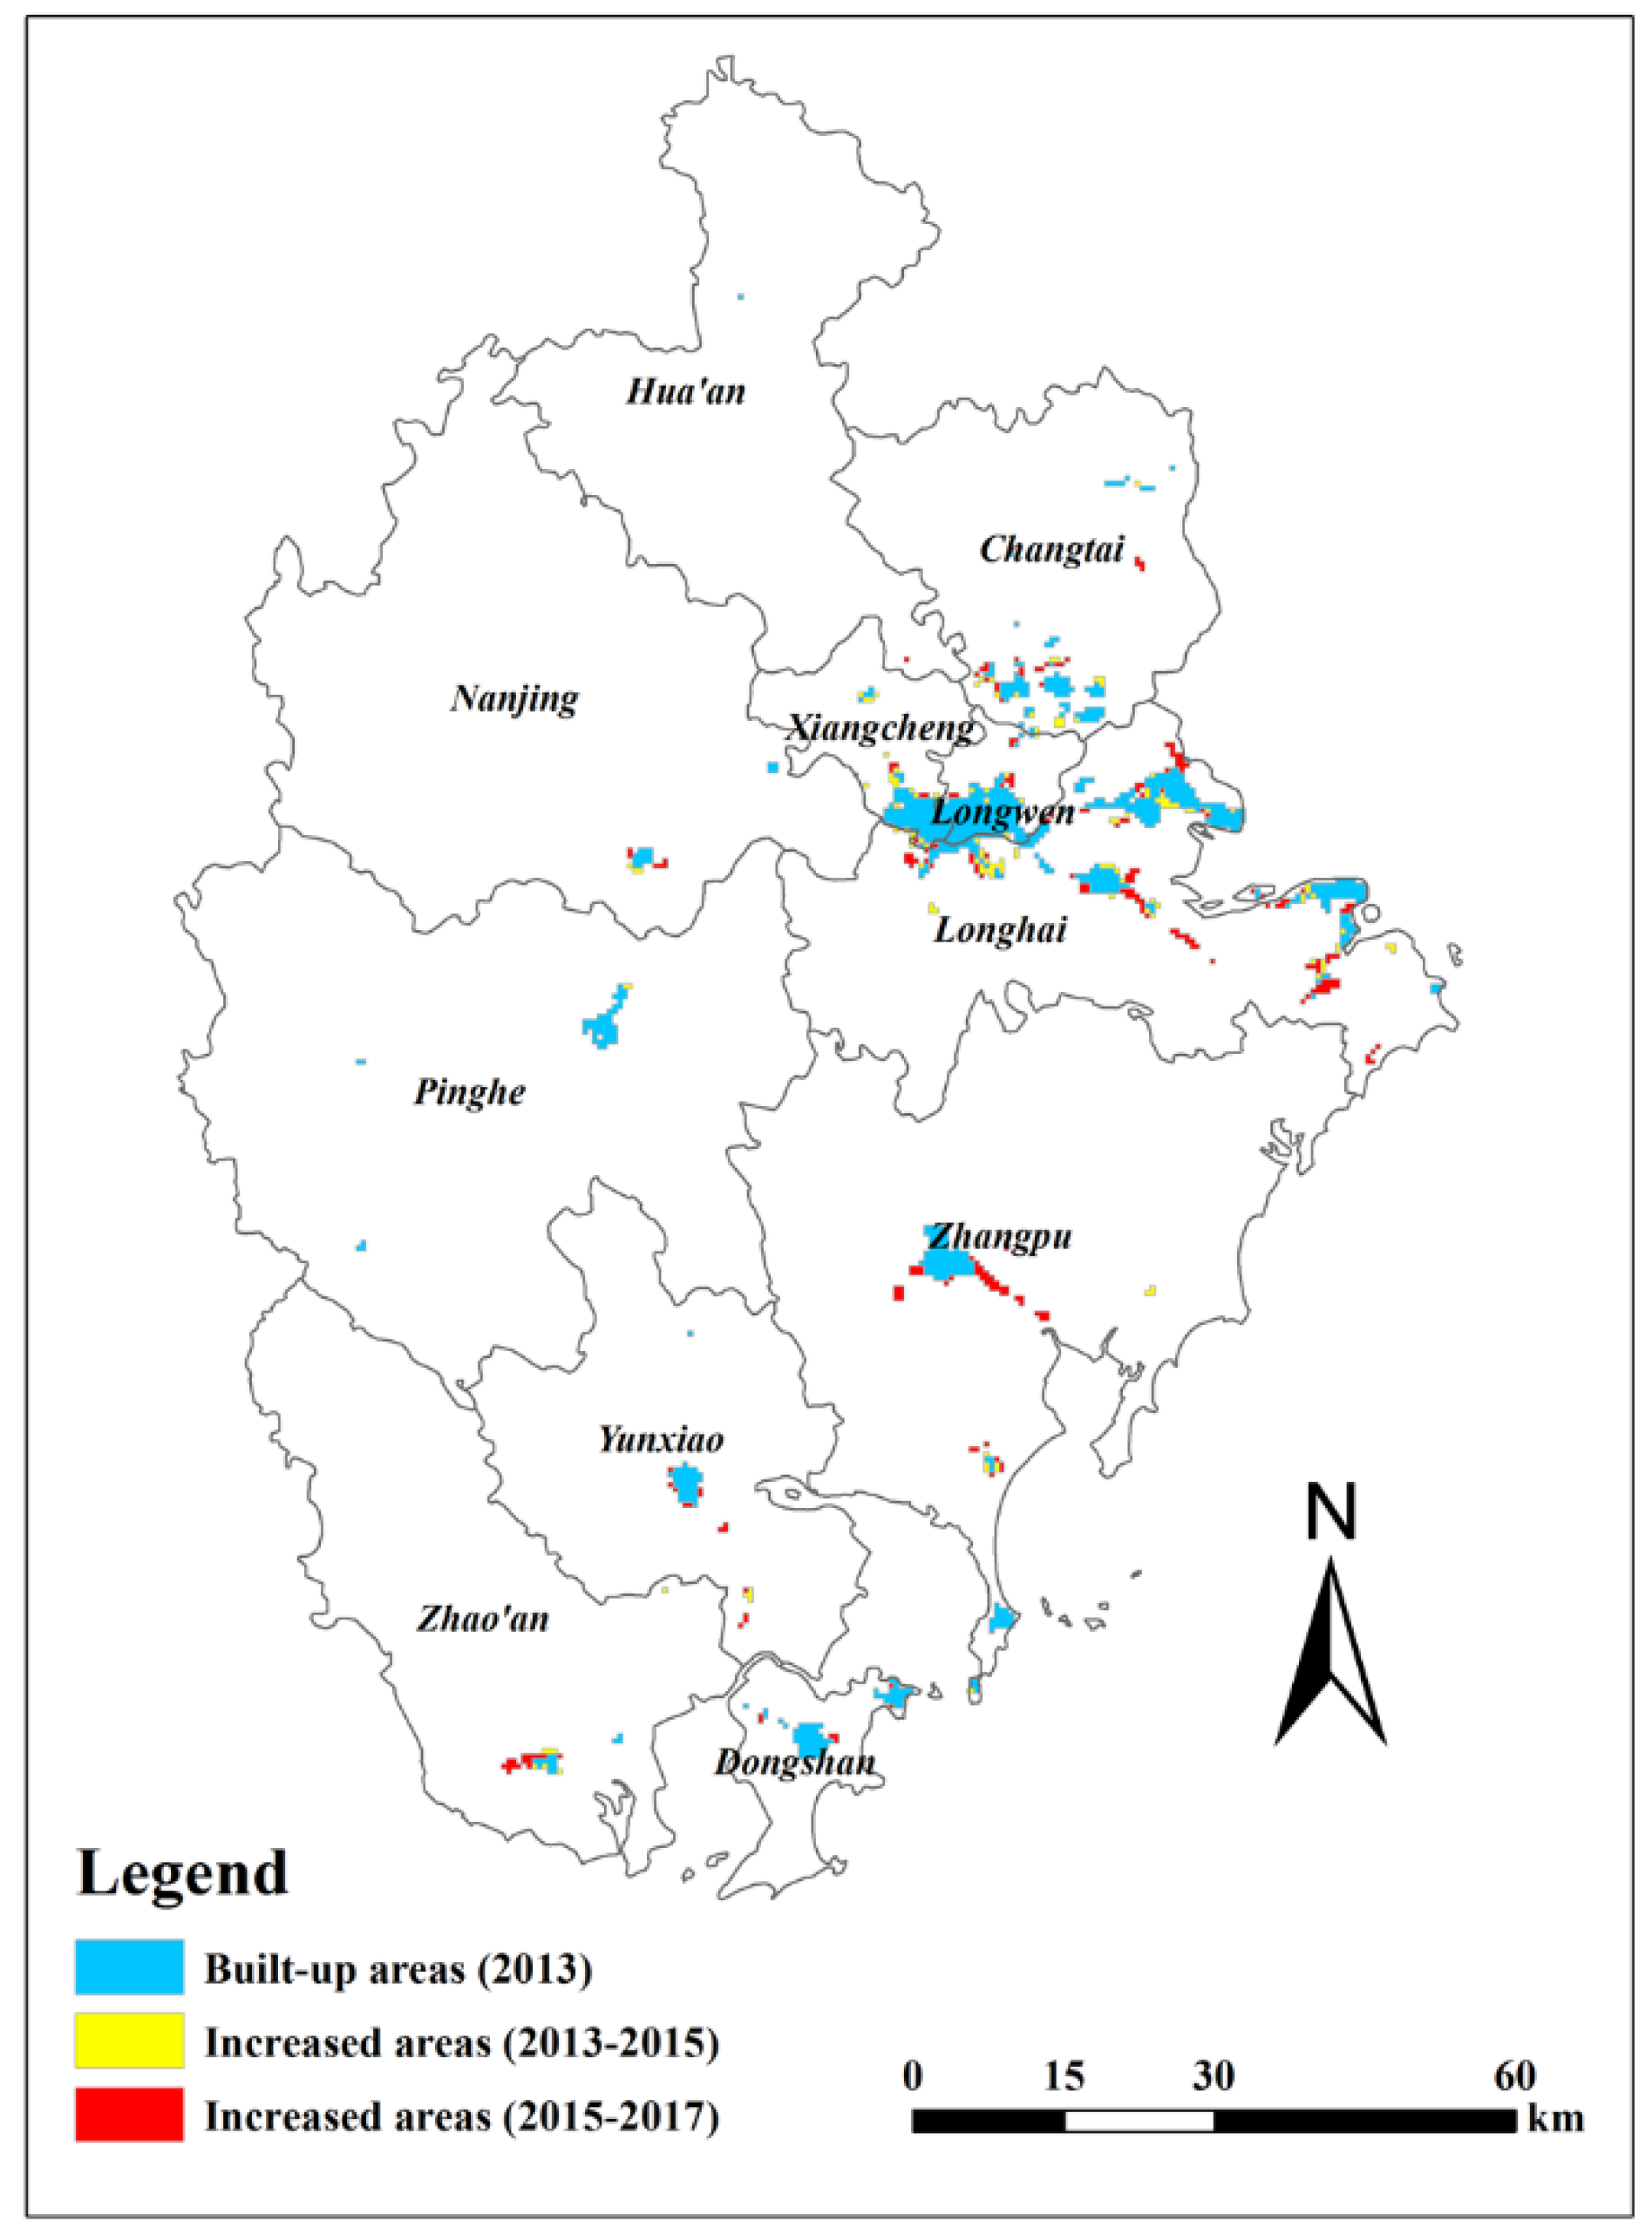
Based on the NPP-VIIRS nighttime light data and the statistical yearbooks of Xiamen, Quanzhou, and Zhangzhou, this study extracted the urban land in the municipal districts of the three cities using a dichotomy method, and compared the results with data in the statistical yearbooks [27,52] to determine overall accuracy of the methodology (Table 1, Table 2 and Table 3). The overall accuracy was found to be acceptable and the results reflected the development of these regional cities. According to the obtained threshold value, the spatial pattern of the urban built-up area in each city of the Xia-Zhang-Quan metropolitan area was extracted (Figure 4, Figure 5 and Figure 6).
It can be seen that the urban expansion of Xiamen is mainly concentrated in off-island areas (Haicang, Jimei, Tongan, and Xiang ‘an), which is related to the bay-type city construction strategy implemented by Xiamen, and it indicates that the sub-centers are starting to develop (Figure 4). Urban expansion in Zhangzhou has proceeded relatively slowly, which is mainly related to Zhangzhou’s strategy for industrial development. In addition, urban expansion in Zhangzhou is concentrated in the core area and areas close to Xiamen, suggesting that the integrated development strategy is being pursued (Figure 5). In Quanzhou (Figure 6), urban expansion has been mainly concentrated in coastal areas and areas close to Xiamen, and this is reflective of the port advantage of Quanzhou, the industrial layout of the real economy, and the integrated development strategy.
3.1.2. Analysis of the Spatial Expansion Ability of Urban Land
This study first focused on the locations of the municipal governments of Xiamen, Zhangzhou, and Quanzhou. Using the East-West direction as the horizontal axis and the North-South direction as the vertical axis, each city was divided into 8 quadrants. The land in Xiamen, Zhangzhou, and Quanzhou was divided based on distance from the core zone of each city using irregular grids to analyze the fundamental characteristics of urban expansion in these three cities more accurately. Subsequently, according to the slope requirements for the selection of urban and rural construction land specified in the “Norms for Vertical Planning of Urban and Rural Construction Land” (CJJ 83-2016), the minimum requirement, that is, “the slope of residential land should be less than 25%”, was selected as the upper limit to extract the suitable areas of construction land in the Xia-Zhang-Quan area using Digital Elevation Model (DEM) images. Next, according to existing urban construction land use in 2013 and 2015, the remaining available construction land was calculated for each corresponding year. In addition, based on the division of Xiamen, Zhangzhou, and Quanzhou using eight directions and equally spaced concentric circles (the radius values in Xiamen, Zhangzhou, and Quanzhou are 10 km, 25 km, and 25 km respectively) pivoted on the administrative centers of these three cities, the spatial placement of remaining available construction land was clarified (Figure 7 and Figure 8). On this basis, the characteristics of the urban expansion ability of Xiamen, Zhangzhou, and Quanzhou at different placement locations in 2013–2015 and 2015–2017 were calculated separately using a computation method (Figure 9 and Figure 10). The results of this analysis clarify the integration ability and fundamental spatial patterns of Xiamen, Zhangzhou, and Quanzhou in the integration and development of the Xia-Zhang-Quan metropolitan area.
During 2013–2015, the areas with the greatest urban spatial expansion ability in Xiamen were mainly distributed in the 0–10 km area of the Northern-Northeastern region and the 10–20 km area of the Northern-Northwestern region (Figure 9). These results are mainly due to the concentrated development of the Wuyuanwan area in 2013–2015 and the construction of Jimei New City, which are manifestations of the major strategy adopted by Xiamen to transform from an island-type city to a bay-type city, as well as important measures that were implemented to actively promote the coordinated development of Xiamen, Zhangzhou, and Quanzhou. At the same time, in Xiamen there was unequivocal urban spatial expansion in the 0-20km area of the Northwest-West and Southwest regions (Figure 9). These results are closely related to the opening of the Xiamen-Zhangzhou Bridge, as well as the construction and development of the Zhangzhou Port Area. During 2013–2015, the areas with the greatest urban spatial expansion ability in Zhangzhou were mainly distributed in the Northern-Southeastern region (Figure 9) and showed a strong trend of development and integration with Xiamen. Such results also fully reflect the basic principles and policies implemented to promote the coordinated development of Xiamen, Zhangzhou, and Quanzhou. In Quanzhou, the land available for construction was mainly concentrated in the Northwestern-Western region. However, during 2013–2015, the regions in Quanzhou with an urban spatial expansion ability greater than 20% were mainly concentrated in the Jinjiang and Shishi cities in the Western-Southern region (Figure 9). This result is partly due to the development of the coastal economy and the support of local characteristic industries, which have further promoted the spatial integration of Xiamen, Zhangzhou, and Quanzhou.
During 2015–2017, by virtue of increasing regional coordination and integration of infrastructure construction, the trend of integration among Xiamen, Zhangzhou, and Quanzhou became more obvious. The focus of urban spatial expansion in Xiamen further shifted to outside of the island, and the areas with strong urban expansion ability were also mainly distributed in the Northeastern and Southwestern regions (Figure 10). In particular, expansion in the Northeastern region was mainly caused by the opening of municipal infrastructure elements, increasing occupancy of commercial buildings, and comprehensive development in Tong’an New City and Xiang’an New City. Expansion in the Southwestern region was mainly due to the development and construction of Maluanwan New City in Haishu District. Furthermore, Zhangzhou was still a city with a relatively low ability for regional integration. In addition, the spatial expansion ability of Zhangzhou was generally below 10% (Figure 10), at least partly because of Zhangzhou’s strategy for industrial development and the spatial radiation capacity of its core area. However, during 2015–2017, Quanzhou showed a strong trend of regional integration and development, and the urban spatial expansion ability in its Southwestern region (mainly the cities of Jinjiang and Shishi) exceeded 50% (Figure 10). These findings are mainly due to the development of the coastal port economy of Quanzhou and the high-speed train network between Xiamen and Quanzhou.
In short, analysis suggests that the spatial expansion and integration abilities of the three cities were constantly strengthening. The gradual transition of Xiamen from an island-type city to a bay-type city allowed it to carry out better spatial integration and develop industrial connections with Zhangzhou and Quanzhou. For Zhangzhou, its regional integration and development with Xiamen was mainly reflected by economic development in the port area located in the Southeastern region of Zhangzhou and promoted by industrial radiation from its Eastern region. Quanzhou showed a strong trend of regional integration and development in the implementation of the integrated development strategy for Xiamen, Zhangzhou, and Quanzhou. In particular, Jinjiang and Shishi cities in Southwest Quanzhou have gradually integrated with the urban developments in the Tongan and Xiang’an districts of Xiamen. Industrial radiation from Jinjiang Airport also increased the integration ability of Xiamen-Quanzhou during implementation of the integrated development strategy.
3.1.3. Analysis of the Spatial Expansion Type of Urban Land
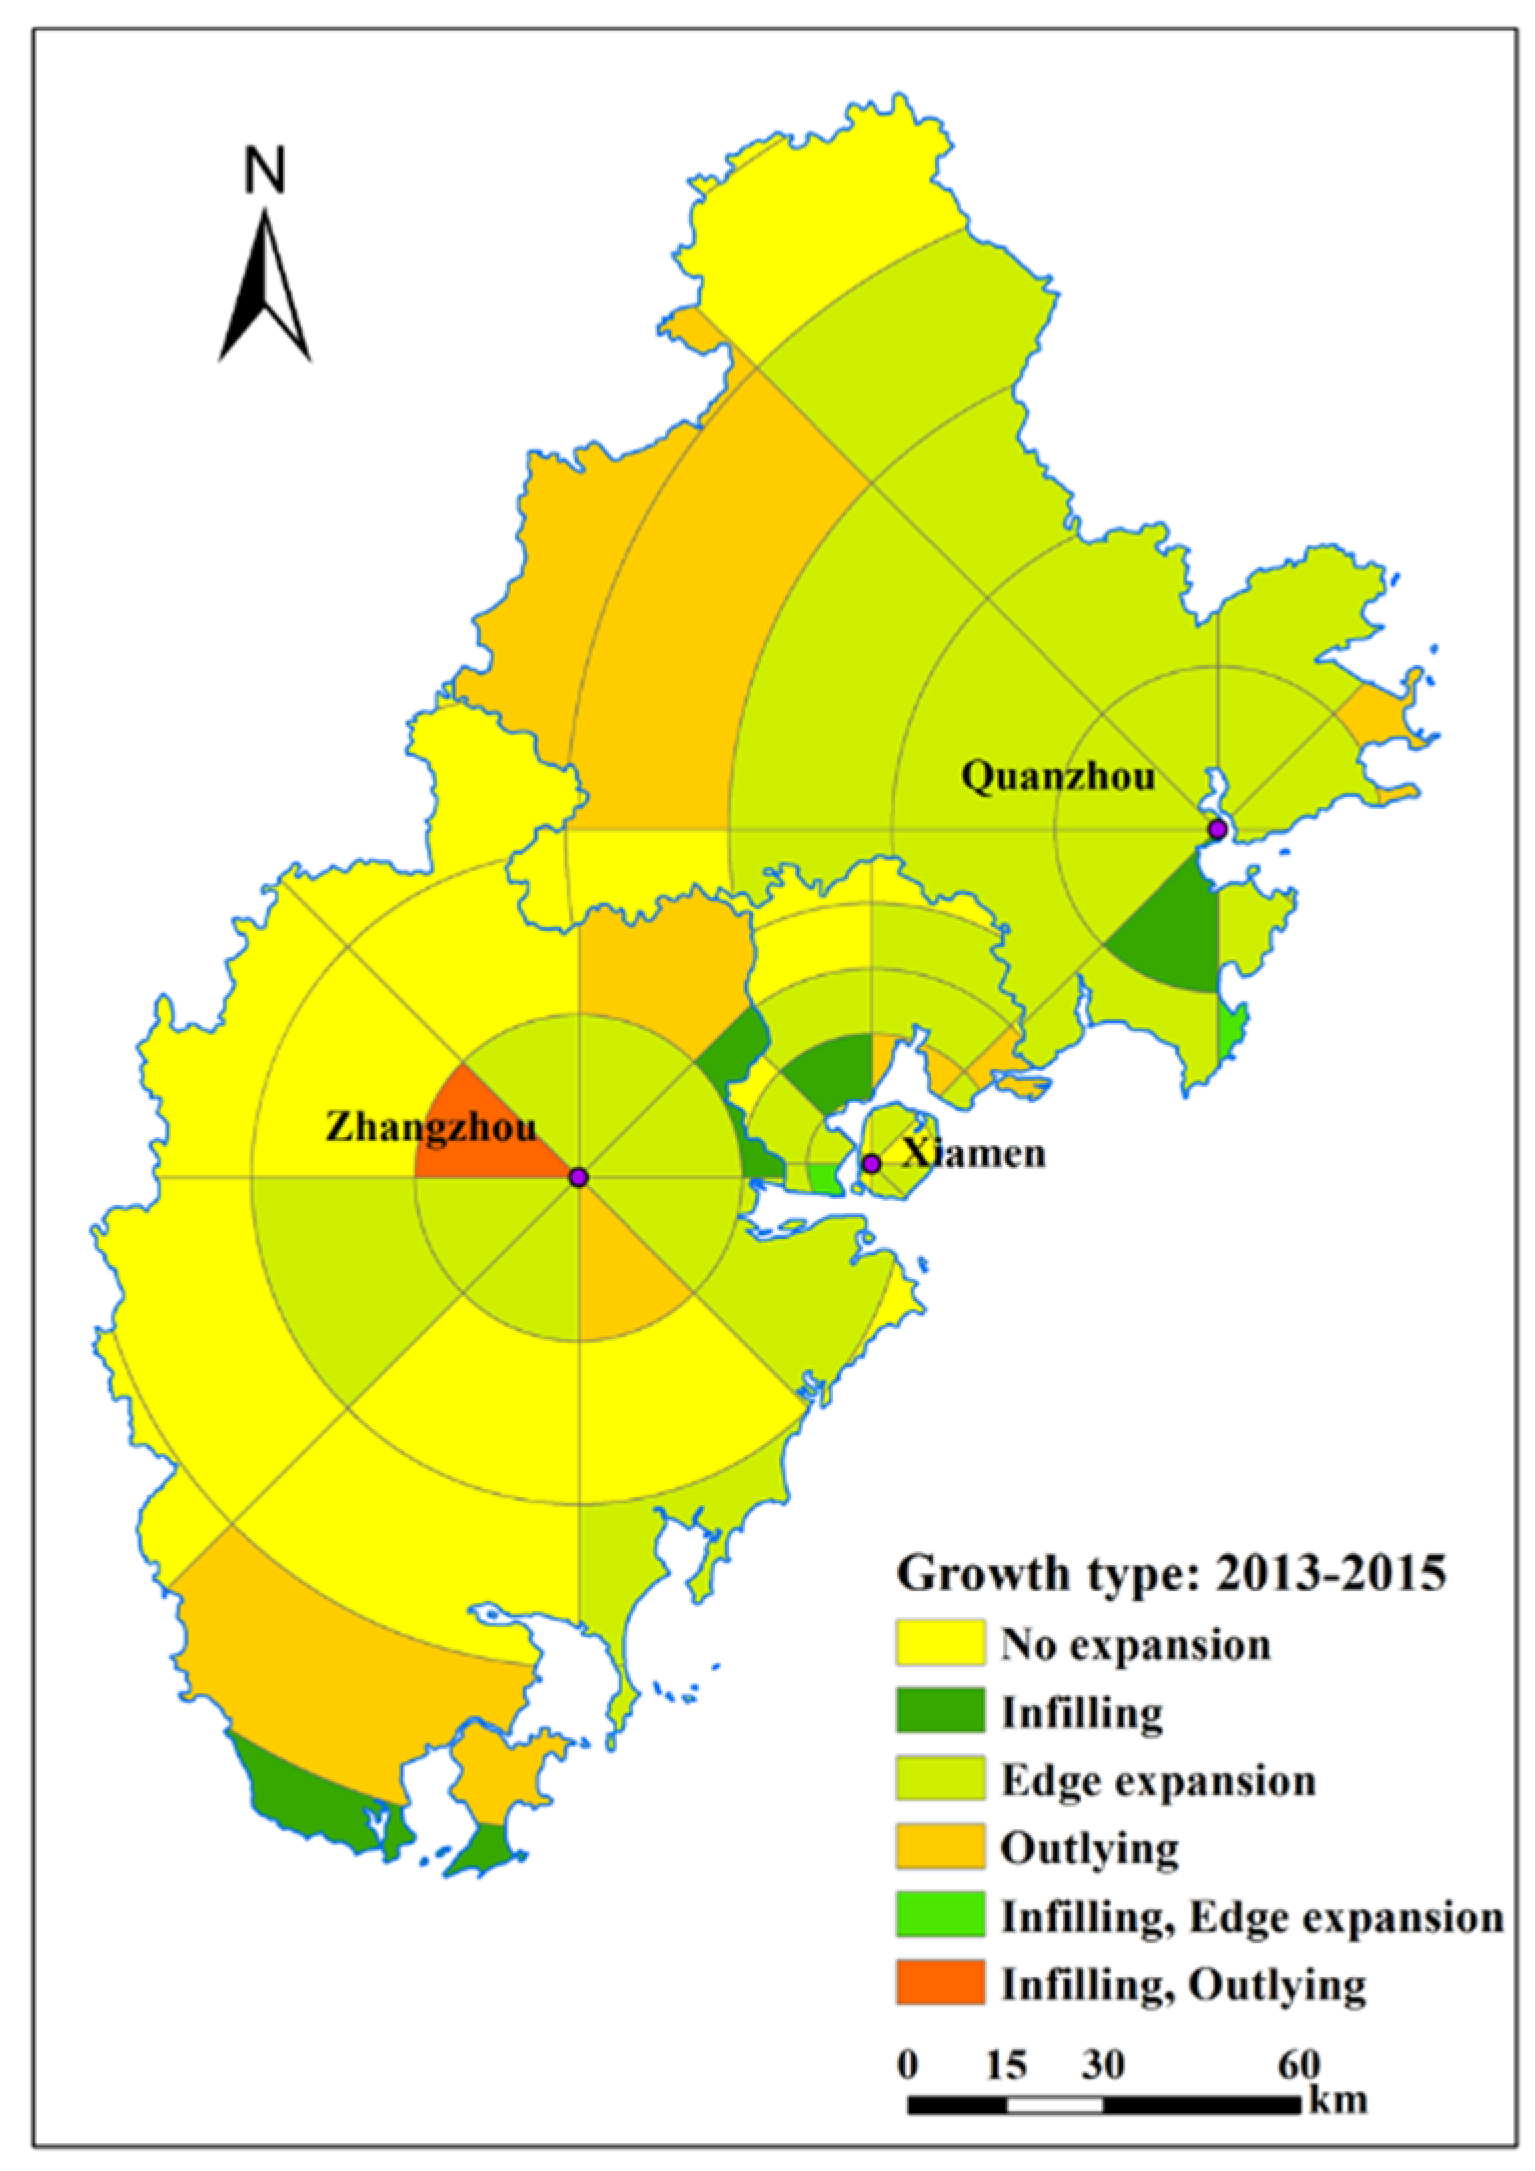
During 2013–2015, most land expansion in Xiamen was edge expansion, with the expansion area accounting for 50.3% of the total growth area, but there were also obvious regional differences (Figure 11). The 10–20 km area in North-Northwest Xiamen was dominated by infilling expansion, and the area of expansion was approximately 12.25 km2. In addition, edge expansion was mainly concentrated in the Northeastern-Northern and Northwestern-Western regions, with an area of expansion of approximately 13.28 km2. Furthermore, Xiamen had relatively low ability for outlying expansion, with an area of expansion of approximately 2.56 km2 (Table 4). Most land expansion in Zhangzhou was edge expansion, but its spatial expansion capacity in the Western region was extremely limited (Figure 11). Furthermore, edge expansion mainly occurred in the Southeastern-Southern region of Zhangzhou, which was mainly related to economic development of the Zhangzhou Port and the opening of the Xiamen-Zhangzhou Bridge, both of which have driven development in the surrounding land (Table 4). The spatial radiation ability in the expansion and integration of Quanzhou was relatively strong, primarily because of the relatively high level of economic development in Jinjiang and Shishi cities under the jurisdiction of Quanzhou; this economic development has generated multiple growth poles that have achieved a pattern of synergistic development in Quanzhou (Figure 11). Nevertheless, Quanzhou was still dominated by edge expansion covering most of the areas under its jurisdiction. In particular, edge expansion in the Western-Southwestern region of Quanzhou reached an area of 33.38 km2, while edge expansion in the Northeastern-Northern region of Quanzhou reached an area of 20.06 km2, primarily because of the construction of infrastructure projects such as Jinjiang Airport and Jinjiang High-Speed Railway Station, as well as economic growth along the path of the high-speed railway. In contrast, infilling expansion in Quanzhou was mainly distributed in its Southwestern-Southern region and had an area of 24.58 km2, which was in an advanced stage of urbanization development. Infilling expansion in Quanzhou was mainly manifested as improvements and upgrades to urban infrastructure, as well as renovation and expansion of the old city (Figure 11).
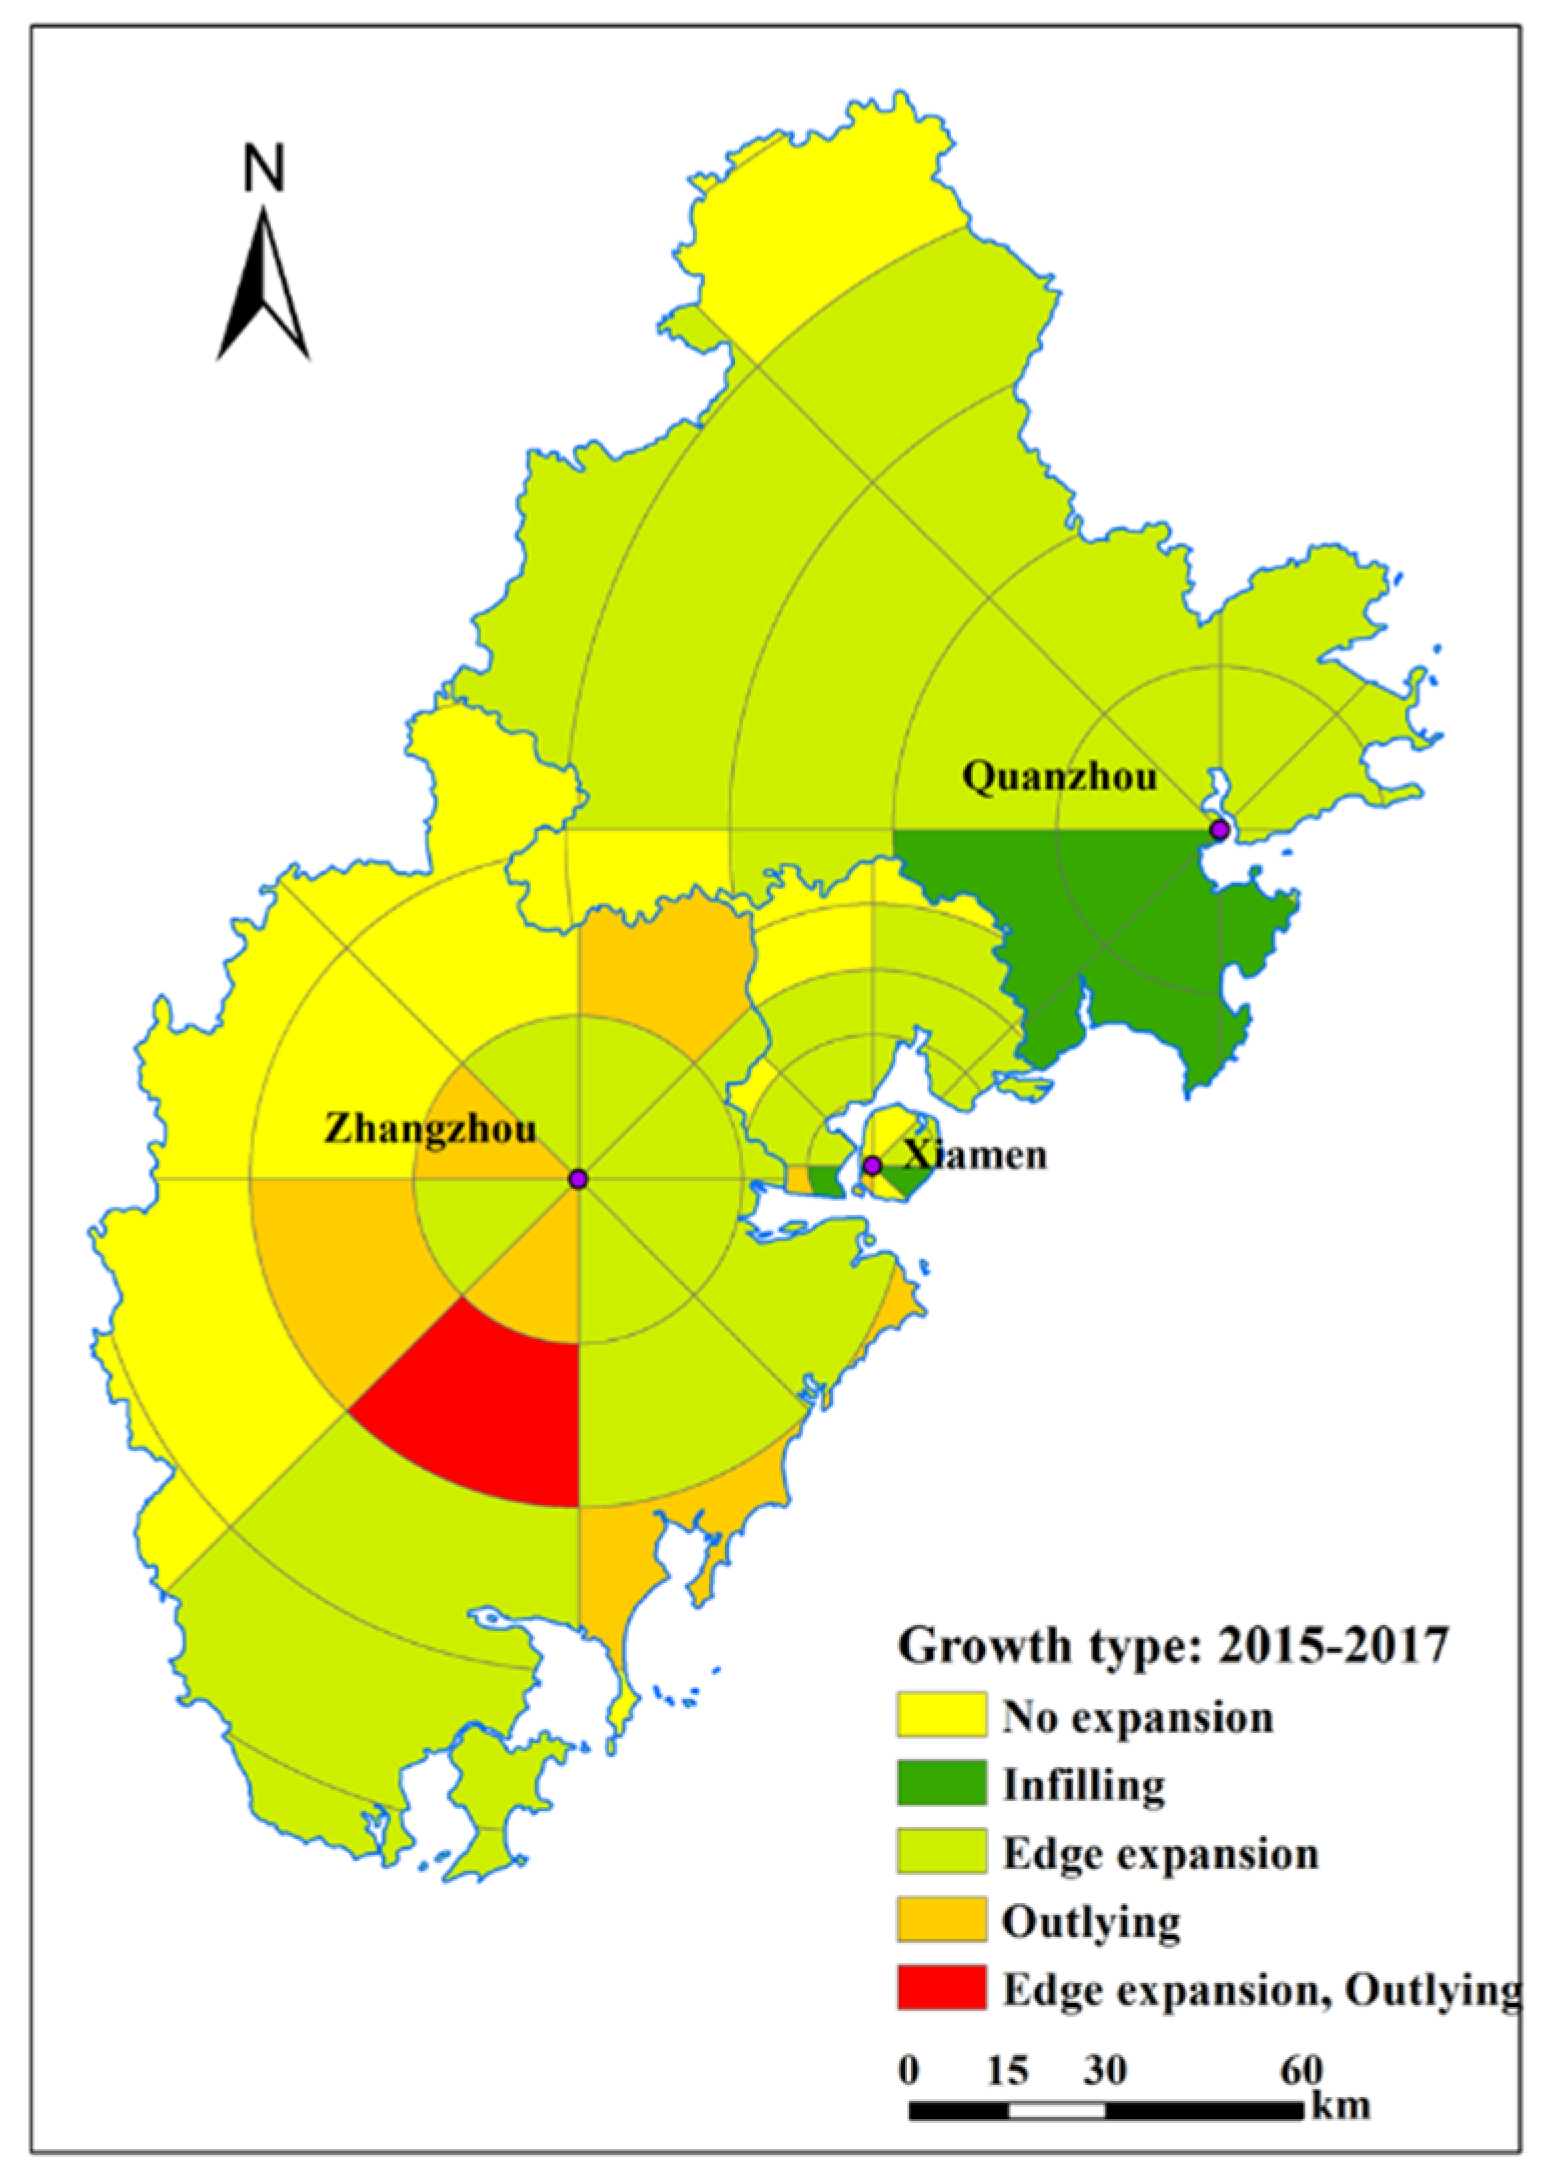
During 2015–2017, most land expansion in Xiamen was edge expansion (Figure 12), which reflected Xiamen’s development strategy to transform into a bay-type city. In addition, development in the island’s outer bay area accelerated significantly. With the completion of Tongan New City, Xiang’an New City, and Jimei New City, as well as the comprehensive development of the Maluanwan area and improvement in its infrastructure facilities, the Bay Area economy has become the future growth pole of Xiamen. In particular, land expansion in the Northern region of Xiamen was mainly based on edge expansion, with an area of approximately 30 km2 (Table 5). The radiation effect generated by the edge expansion capacity in the Northwestern region of Xiamen was the most obvious effect. Because the Southern part of Xiamen was already a highly urbanized area, there was no potential area for edge expansion. Most land expansion in Zhangzhou was edge expansion. In addition, the spatial expansion capacity in the Western part of Zhangzhou was extremely limited, and thus its land expansion was mainly outlying expansion (Figure 12), while edge expansion was mainly distributed in the Eastern region of Zhangzhou. In particular, edge expansion in Southeast-East Zhangzhou reached an area of 14.66 km2, which accounted for 35.9% of the total area of edge expansion. This result was mainly due to the economic development of the Zhangzhou port and the opening of the Xiamen-Zhangzhou Bridge, both of which drove residential development and productive activities in surrounding regions (Table 5). The spatial radiation ability in Quanzhou’s urban expansion and integration was relatively strong, primarily because of the relatively high level of economic development in Jinjiang and Shishi cities under the jurisdiction of Quanzhou, which created multiple growth poles (Figure 12). Land expansion in Quanzhou was mainly infilling and edge expansion. Infilling expansion was principally distributed in the Southern region (Jinjiang, Shishi), with an area of 165.52 km2, whereas edge expansion covered almost all areas under the jurisdiction of Quanzhou except for the Southeastern region, which was restricted by limited space due to its proximity to the coast. All other regions in Quanzhou underwent edge expansion on a relatively large scale (Table 5). The existence of multiple growth poles, such as Jinjiang and Shishi, in the Southwestern part of Quanzhou at least partly explains why this city showed the most obvious integration trend in the integrated development of Xiamen, Zhangzhou, and Quanzhou. This feature of Quanzhou could also become a new highlight in the future integration of Xiamen, Zhangzhou and Quanzhou.
3.2. Spatiotemporal Evolution of Urban Socioeconomic Dynamics
Based on a spatial grid analysis of changes in total light intensity in the Xia-Zhang-Quan metropolitan area from 2013 to 2017, this study analyzed the characteristics of spatial and temporal changes in urban socioeconomic development according to the level of urban spatial expansion.
During 2013–2015, the areas showing the highest socioeconomic activity in Xiamen were mainly distributed in the 10–20 km area of its Northern-Northwestern region. This result was related to the comprehensive construction of Jimei New City and the construction of new infrastructure in Xiamen during 2013–2015. In Zhangzhou, the areas showing the highest socioeconomic activity were mainly distributed in the 0–25 km area of its Eastern-Southeastern region. This result was related to the concentrated growth of regional socioeconomic activity brought about by the development and construction of Jiaomei New City and Jiulong New City during the same period. In Quanzhou, the areas showing the highest socioeconomic activity were mainly concentrated in the 0–25km area in its Southeastern region. These results show that Jinjiang and Shishi cities greatly promoted regional socioeconomic integration among Xiamen, Zhangzhou, and Quanzhou from 2013–2015 (Figure 13).
During 2015–2017, the areas showing the highest socioeconomic activity in Xiamen were mainly concentrated in the 10–20 km grid of its Northern-Northwestern region, which was also the core area of Jimei New City. The development strategy of Xiamen as a bay-type city was directly manifested by the consecutive launch of relevant municipal supporting infrastructure in 2015, the development of business centers, such as Xinglin Bay Business Center and Phase III of Software Park, in hotspot areas of socioeconomic activity, and the formation of an atmosphere conducive to business. Such activities also served as an important link in the coordinated development of Xiamen, Zhangzhou, and Quanzhou. In addition, the 20–30 km grid located in the Northern-Northeastern region of Xiamen showed the highest socioeconomic activity in 2015–2017. This result was mainly related to the continuous development of Tongan New City and Xiang’an New City, and in particular to the infrastructure and commercial housing construction associated with this development. Indeed, the construction and use of relevant infrastructure and commercial buildings in Tongan New City and Xiang’an New City have greatly promoted socioeconomic activity in the region and helped to integrate relevant regions in Xiamen and Quanzhou. Compared with Xiamen and Quanzhou, socioeconomic activity in Zhangzhou was relatively weak. Moreover, regional differences in socioeconomic activity in Zhangzhou were relatively weak in all directions. Areas with relatively high socioeconomic activity were mainly concentrated in the Southeastern region of Zhangzhou. This result can principally be explained in terms of the opening of the Xiamen-Zhangzhou Bridge and the development of Zhangzhou Port. During 2015–2017, the areas with the strongest socioeconomic activity in Quanzhou were still mainly concentrated in Jinjiang and Shishi cities in the Southeastern region. This result is reasonably consistent with the GDP of various counties and towns in Quanzhou during 2015–2017. In particular, the GDP growth rates of Jinjiang and Shishi were both greater than 10%, rendering Jinjiang and Shishi them the key areas in the integration and development of the Xia-Zhang-Quan metropolitan area. At the same time, the Western-Northwestern region of Quanzhou exhibited socioeconomic activities with a strong radiation effect. This result was mainly due to the regional urban economic development of commercial, residential, office and public buildings, which were constructed as a result of the transit-oriented development (TOD) model brought about by the construction of transportation infrastructure, including high-speed rail stations such as Quanzhou East Station and Quanzhou Station (Figure 14).
From the perspective of the overall spatial pattern of socioeconomic changes in the Xia-Zhang-Quan metropolitan area, enhanced socioeconomic activities were located in off-island areas of Xiamen and the areas close to Xiamen, which showed that the integrated development strategy in the Xia-Zhang-Quan metropolitan area is constantly being implemented. In addition, by comparing changes in total light intensity with spatial expansion dynamics, the spatial distribution of socioeconomic changes is not consistent with that of spatial expansion type, but consistent with that of spatial expansion ability. It is also noteworthy that there was a similar spatial arrangement between socioeconomic changes and spatial expansion type in the no expansion type regions; because they are mostly remote and relatively underdeveloped mountainous areas, lighting changes in these areas are not substantively affected by urban expansion.
4. Discussion
4.1. Analysis of Factors Influencing Urban Expansion
By consulting relevant literature, it can be summarized that the driving forces of urban expansion mainly include the natural eco-environment, accessibility, socioeconomic development, neighborhood factors, relevant planning and policies [53,54,55]. The socioeconomic factor, as one of the important driving factors, is discussed here. Previous studies have shown that rapid economic development can promote urban expansion [56,57]. This finding is also well supported by this paper. By comparing changes in total light intensity with spatial expansion ability (Figure 8 vs Figure 13, Figure 9 vs Figure 14), there is a good correlation between light intensity and urban expansion. Regions with significantly increased total brightness also have strong urban expansion ability, indicating that regional economic development greatly promotes urban expansion. For example, the areas showing the highest socioeconomic activity in Xiamen were mainly distributed in the 10–20 km area of its Northern-Northwestern region, the corresponding urban expansion ability is also relatively strong. This can be explained in terms of the comprehensive construction of Jimei New City and the construction of new infrastructure in Xiamen.
In contrast to developed countries, rapid urbanization in China is not only paralleled by economic growth but also significantly shaped by administrative means or government policy [58]. The Xia-Zhang-Quan metropolitan area is no exception in this respect. As a special economic zone, Xiamen attracts national and regional attention, enjoys obvious resource advantages, and rapid and priority economic development. As integrated development strategies for cities are being implemented, the radiation effect of Xiamen has become prominent, which can be seen from the urban expansion and changes in socioeconomic activities in the transition zone between cities. In addition, the “Overall planning of Xiamen city (2011–2020)” document illuminates a strategy of “trans-island development”, striving to build a cluster of bay-type city with “one island, one belt and multi-center”. Under the guidance of this policy, it can seen that urban expansion in Xiamen has gradually shifted from Xiamen island to off-island areas (Haicang, Jimei, Tongan, and Xiang ‘an), and the socioeconomic activities in the off-island areas have significantly increased (Figure 14).
The trajectories of urban expansion reflected the economic development and policy scenarios. As cities’ integrated development strategies are being implemented, the rapid development of social economy and policy support effectively promotes the process of urbanization in the Xia-Zhang-Quan metropolitan area. From the overall spatial pattern of urban land expansion, the regional spatial structure shows a shrinking trend, administrative boundaries are becoming blurred, and cross-regional cooperation and development are highlighted. Of course, it must be noted that urban development in inner land areas is still slow. In the future, the construction of transportation infrastructure should be further strengthened to promote local economic development. At the same time, the three cities must adopt measures suiting local conditions and define their own functions, so as to make their respective advantages complementary to each other and jointly promote the integrated development of the Xia-Zhang-Quan metropolitan area.
4.2. Accurate Identification and Application of Socio-economic Vitality based on Nighttime Light Data
VIIRS nighttime light data are highly accurate and not subject to excessive interference from human subjective factors that affect the visual interpretation of results from conventional satellite imagery. In addition, since these data are not affected by price levels, they are especially suitable for observing economic activity in different regions over long periods of time. Therefore, as compared to traditional statistical data that are prone to bias, nighttime light data acquired by satellites provide relatively robust economic information. However, many scholars have performed similar research using the same global nighttime light data and reached different conclusions about the real GDP growth rate in China. Such differences may be caused by the following two factors. First, when using global nighttime light data, it is necessary to calibrate, synthesize, and repair relevant data to eliminate data “noise” caused by old satellites and sensor aging. However, due to the different techniques and methods used for handling data “noise”, different conclusions may be reached by different scholars when they use data to estimate the GDP performance of a country. Secondly, the intensity of nighttime light is derived from nighttime economic activities. However, the level of nighttime economic activity is closely related to economic and social factors such as industrial structure, tradition, and culture, leading to poor comparability when nighttime light intensity is used as a measure to evaluate the level of economic development in different regions. In fact, accurate estimation of GDP growth rates and economic prosperity is a complex issue, and these estimations cannot be performed accurately using only one or two simple indicators. In a country like China with unbalanced regional development, it is important to be cautious and careful when the satellite nighttime light data of different regions are summarized to estimate the GDP growth rate.
5. Conclusions
In this study, the dynamics of urban spatial expansion and urban socioeconomic development vitality of the Xia-Zhang-Quan metropolitan area were analyzed between 2013–2017 based on urban nighttime light data. The following key conclusions were reached. (1) Xiamen plays a key role in the integrated development of the Xia-Zhang-Quan metropolitan area. Since Xiamen made a comprehensive commitment to build a bay-type city with “one island, one belt and multi-center”, that city has fully implemented its development strategy to optimize its structure on the island, expand its development as a bay-type city, enhance the economic strength of its hinterland, and promote development in its surrounding areas. (2) Quanzhou shows the strongest trend of integration in the process of urban expansion in the Xia-Zhang-Quan metropolitan area. This is mainly attributed to the spatial advantage in Quanzhou’s multi-polar growth. (3) In the urban expansion of the Xia-Zhang-Quan metropolitan area, Zhangzhou lacks strength in its spatial expansion and socioeconomic vitality primarily because of its industrial structure. (4) The trajectories of urban expansion reflect the economic development and policy scenarios. Findings obtained from nighttime light data could, to some extent, provide a basis for coordinated development of urban agglomerations.
In summary, simultaneously analyzing urban expansion and socioeconomic development vitality in urban agglomerations based on nighttime light data can, to some extent, reveal the spatial processes and driving factors of regional spatial integration, industrial synergy and socioeconomic development. Such analysis could help government decision makers identify shortcomings, fill gaps, and develop more inclusive and effective development policies from the perspective of metropolitan areas. Due to the lack of sufficient data on built-up areas in the statistical yearbooks utilized herein, the accuracy of urban built-up area extraction is affected to some extent. In the future, it will be necessary to adopt new methods or combine other auxiliary data to further improve the accuracy of results and thus the applicability of policy recommendations.
Author Contributions
Y.J. conceived and performed the research; S.Z. conceived and maked valuable comments and suggestions on the writing and revision of the paper; S.S. participated in data collection and processing. All authors have read and approved this manuscript.
Acknowledgments
This research was funded by the Science and Technology Service Programs of the Chinese Academy of Sciences (Grant No.Y7I0051G30) and National Science and Technology Support Program (Grant No. 2016YFC0501101). The authors are grateful to Jingzhu Zhao at the Institute of Urban Environment, Chinese Academy of Sciences and three anonymous referees for their insightful comments and suggestions.
Conflicts of Interest
The authors declare no conflict of interest.
References
- Wu, J. Urban ecology and sustainability: The state-of-the-science and future directions. Landsc. Urban Plan. 2014, 125, 209–221. [Google Scholar] [CrossRef]
- Wang, C.; Wang, Z.H. Projecting population growth as a dynamic measure of regional urban warming. Sustain. Cities Soc. 2017, 32, 357–365. [Google Scholar] [CrossRef]
- Sun, Y.; Zhao, S. Spatiotemporal dynamics of urban expansion in 13 cities across the Jing-Jin-Ji Urban Agglomeration from 1978 to 2015. Ecol. Indic. 2018, 87, 302–313. [Google Scholar] [CrossRef]
- He, C.; Liu, Z.; Tian, J.; Ma, Q. Urban expansion dynamics and natural habitat loss in China: A multiscale landscape perspective. Glob. Chang. Biol. 2014, 20, 2886–2902. [Google Scholar] [CrossRef] [PubMed]
- Jiang, Y.; Sun, S.; Wang, Y.; Zheng, S. Niche Evolution of China’s Provincial Social–Economic–Natural Complex Ecosystems, 2005–2015. Sustainability 2018, 10, 2824. [Google Scholar] [CrossRef]
- Bloom, D.E. 7 Billion and Counting. Science 2011, 333, 562–569. [Google Scholar] [CrossRef] [PubMed]
- United Nations. World Urbanization Prospects: The 2018 Revision; United Nations: New York, NY, USA, 2018. [Google Scholar]
- Fang, C.; Yu, D. Urban agglomeration: An evolving concept of an emerging phenomenon. Landsc. Urban Plan. 2017, 162, 126–136. [Google Scholar] [CrossRef]
- Gao, X.; Xu, Z.; Niu, F.; Long, Y. An evaluation of China’s urban agglomeration development from the spatial perspective. Spat. Stat. 2017, 21, 475–491. [Google Scholar] [CrossRef]
- Nagy, J.; Benedek, J.; Ivan, K. Measuring Sustainable Development Goals at a Local Level: A Case of a Metropolitan Area in Romania. Sustainability 2018, 10, 3962. [Google Scholar] [CrossRef]
- Hua, L.; Li, X.; Tang, L.; Yin, K.; Zhao, Y. Spatio-temporal dynamic analysis of an island city landscape: A case study of Xiamen Island, China. Int. J. Sustain. Dev. World Ecol. 2010, 17, 273–278. [Google Scholar] [CrossRef]
- Peng, W.; Wang, G.; Zhou, J.; Zhao, J.; Yang, C. Studies on the temporal and spatial variations of urban expansion in Chengdu, western China, from 1978 to 2010. Sustain. Cities Soc. 2015, 17, 141–150. [Google Scholar] [CrossRef] [Green Version]
- Kantakumar, L.N.; Kumar, S.; Schneider, K. Spatiotemporal urban expansion in Pune metropolis, India using remote sensing. Habitat Int. 2016, 51, 11–22. [Google Scholar] [CrossRef]
- Gupta, S.; Islam, S.; Hasan, M.M. Analysis of impervious land-cover expansion using remote sensing and GIS: A case study of Sylhet sadar upazila. Appl. Geogr. 2018, 98, 156–165. [Google Scholar] [CrossRef]
- Vu, T.-T.; Thy, P.T.M.; Nguyen, L.Đ. Multiscale remote sensing of urbanization in Ho Chi Minh city, Vietnam—A focused study of the south. Appl. Geogr. 2018, 92, 168–181. [Google Scholar] [CrossRef]
- Simwanda, M.; Murayama, Y. Spatiotemporal patterns of urban land use change in the rapidly growing city of Lusaka, Zambia: Implications for sustainable urban development. Sustain. Cities Soc. 2018, 39, 262–274. [Google Scholar] [CrossRef]
- Fang, C. The urbanization and urban development in China after the reform and opening-up. Econ. Geogr. 2009, 29, 19–25. [Google Scholar]
- Gu, C.; Pang, H. Evolution of Chinese Urbanization Spaces: Kernel spatial approach. Sci. Geogr. Sin. 2009, 29, 10–14. [Google Scholar]
- Yang, K.; Zhang, S.; Luo, Y.; Xu, Q.; Qu, L. The widening urbanization gap between the Three Northeast Provinces and the Yangtze River Delta under China’s economic reform from 1984 to 2014. Int. J. Sustain. Dev. World Ecol. 2018, 25, 262–275. [Google Scholar] [CrossRef]
- Xu, M.; He, C.; Liu, Z.; Dou, Y. How did urban land expand in China between 1992 and 2015? A multi-scale landscape analysis. PLoS ONE 2016, 11, e0154839. [Google Scholar] [CrossRef]
- Li, D.; Li, X. An overview on data mining of nighttime light remote sensing. Acta Geod. Cartogr. Sin. 2015, 44, 591–601. [Google Scholar]
- Hu, K.; Qi, K.; Guan, Q.; Wu, C.; Yu, J.; Qing, Y.; Zheng, J.; Wu, H.; Li, X. A scientometric visualization analysis for night-time light remote sensing research from 1991 to 2016. Remote Sens. 2017, 9, 802. [Google Scholar] [CrossRef]
- Li, X.; Elvidge, C.; Zhou, Y.; Cao, C.; Warner, T. Remote sensing of night-time light. Int. J. Remote Sens. 2017, 38, 5855–5859. [Google Scholar] [CrossRef]
- Ma, T.; Zhou, C.; Pei, T.; Haynie, S.; Fan, J. Responses of Suomi-NPP VIIRS-derived nighttime lights to socioeconomic activity in China’s cities. Remote Sens. Lett. 2014, 5, 165–174. [Google Scholar] [CrossRef]
- Liu, L.; Leung, Y. A study of urban expansion of prefectural-level cities in South China using night-time light images. Int. J. Remote Sens. 2015, 36, 5557–5575. [Google Scholar] [CrossRef]
- Tan, M. Urban growth and rural transition in China based on DMSP/OLS nighttime light data. Sustainability 2015, 7, 8768–8781. [Google Scholar] [CrossRef]
- Liu, Z.; He, C.; Zhang, Q.; Huang, Q.; Yang, Y. Extracting the dynamics of urban expansion in China using DMSP-OLS nighttime light data from 1992 to 2008. Landsc. Urban Plan. 2012, 106, 62–72. [Google Scholar] [CrossRef]
- Li, X.; Xu, H.; Chen, X.; Li, C. Potential of NPP-VIIRS nighttime light imagery for modeling the regional economy of China. Remote Sens. 2013, 5, 3057–3081. [Google Scholar] [CrossRef]
- Florida, R.; Mellander, C.; Gulden, T. Global metropolis: Assessing economic activity in urban centers based on nighttime satellite images. Prof. Geogr. 2012, 64, 178–187. [Google Scholar] [CrossRef]
- Dai, Z.; Hu, Y.; Zhao, G. The suitability of different nighttime light data for GDP estimation at different spatial scales and regional levels. Sustainability 2017, 9, 305. [Google Scholar] [CrossRef]
- Doll, C.H.; Muller, J.-P.; Elvidge, C.D. Night-time imagery as a tool for global mapping of socioeconomic parameters and greenhouse gas emissions. Ambio 2000, 29, 157–163. [Google Scholar] [CrossRef]
- Seto, K.C.; Kaufmann, R.K. Modeling the drivers of urban land use change in the Pearl River Delta, China: Integrating remote sensing with socioeconomic data. Land Econ. 2003, 79, 106–121. [Google Scholar] [CrossRef]
- Tian, G.; Jiang, J.; Yang, Z.; Zhang, Y. The urban growth, size distribution and spatio-temporal dynamic pattern of the Yangtze River Delta megalopolitan region, China. Ecol. Model. 2011, 222, 865–878. [Google Scholar] [CrossRef]
- Elvidge, C.D.; Baugh, K.E.; Zhizhin, M.; Hsu, F.-C. Why VIIRS data are superior to DMSP for mapping nighttime lights. In Proceedings of the 35th Meeting of the Asia-Pacific Advanced Network, HI, USA, 13–16 January 2013; Asia Pacific Advanced Network Ltd.: Hong Kong, China, 2013. [Google Scholar]
- Dou, Y.; Liu, Z.; He, C.; Yue, H. Urban land extraction using VIIRS nighttime light data: An evaluation of three popular methods. Remote Sens. 2017, 9, 175. [Google Scholar] [CrossRef]
- Li, X.; Zhao, L.; Li, D.; Xu, H. Mapping Urban Extent Using Luojia 1-01 Nighttime Light Imagery. Sensors 2018, 18, 3665. [Google Scholar] [CrossRef]
- Croft, T.A. Nighttime Images of the Earth from Space. Sci. Am. 1978, 239, 86–98. [Google Scholar] [CrossRef]
- Elvidge, C.D.; Tuttle, B.T.; Sutton, P.C.; Baugh, K.E.; Howard, A.T.; Milesi, C.; Bhaduri, B.; Nemani, R. Global distribution and density of constructed impervious surfaces. Sensors 2007, 7, 1962–1979. [Google Scholar] [CrossRef]
- Eva, H.D.; Belward, A.S.; De Miranda, E.E.; Di Bella, C.M.; Gond, V.; Huber, O.; Jones, S.; Sgrenzaroli, M.; Fritz, S. A land cover map of South America. Glob. Chang. Biol. 2004, 10, 731–744. [Google Scholar] [CrossRef]
- Zhang, Q.; Seto, K.C. Mapping urbanization dynamics at regional and global scales using multi-temporal DMSP/OLS nighttime light data. Remote Sens. Environ. 2011, 115, 2320–2329. [Google Scholar] [CrossRef]
- Ju, Y.; Dronova, I.; Ma, Q.; Zhang, X. Analysis of urbanization dynamics in mainland China using pixel-based night-time light trajectories from 1992 to 2013. Int. J. Remote Sens. 2017, 38, 6047–6072. [Google Scholar] [CrossRef]
- Shi, K.; Huang, C.; Yu, B.; Yin, B.; Huang, Y.; Wu, J. Evaluation of NPP-VIIRS night-time light composite data for extracting built-up urban areas. Remote Sens. Lett. 2014, 5, 358–366. [Google Scholar] [CrossRef]
- Zhang, Q.; Wang, P.; Chen, H.; Huang, Q.; Jiang, H.; Zhang, Z.; Zhang, Y.; Luo, X.; Sun, S. A novel method for urban area extraction from VIIRS DNB and MODIS NDVI data: A case study of Chinese cities. Int. J. Remote Sens. 2017, 38, 6094–6109. [Google Scholar] [CrossRef]
- Hu, Z.; Du, P.; Guo, D. Analysis of Urban Expansion and Driving Forces in Xuzhou City Based on Remote Sensing. J. China Univ. Min. Technol. 2007, 17, 267–271. [Google Scholar] [CrossRef]
- Estoque, R.C.; Murayama, Y. Intensity and spatial pattern of urban land changes in the megacities of Southeast Asia. Land Use Policy 2015, 48, 213–222. [Google Scholar] [CrossRef]
- Aburas, M.M.; Ho, Y.M.; Ramli, M.F.; Ash’Aari, Z.H. Monitoring and assessment of urban growth patterns using spatio-temporal built-up area analysis. Environ. Monit. Assess. 2018, 190, 156. [Google Scholar] [CrossRef]
- The “Overall Planning for the Integrated Development of the Xia-Zhang-Quan Metropolitan Area” Emerged. Available online: http://www.taihainet.com/news/finance/jrxw/2012-10-23/966168.html (accessed on 27 February 2019).
- Baugh, K.; Hsu, F.-C.; Elvidge, C.D.; Zhizhin, M. Nighttime lights compositing using the VIIRS day-night band: Preliminary results. Proc. Asia-Pac. Adv. Netw. 2013, 35, 70–86. [Google Scholar] [CrossRef]
- He, C.; Li, J.; Chen, J.; Shi, P.; Chen, J.; Pan, Y.; Li, J.; Zhuo, L.; Toshiaki, I. The urbanization process of Bohai Rim in the 1990s by using DMSP/OLS data. J. Geogr. Sci. 2006, 16, 174–182. [Google Scholar] [CrossRef]
- Xu, C.; Liu, M.; Zhang, C.; An, S.; Yu, W.; Chen, J.M. The spatiotemporal dynamics of rapid urban growth in the Nanjing metropolitan region of China. Landsc. Ecol. 2007, 22, 925–937. [Google Scholar] [CrossRef]
- Sun, C.; Wu, Z.-F.; Lv, Z.-Q.; Yao, N.; Wei, J.-B. Quantifying different types of urban growth and the change dynamic in Guangzhou using multi-temporal remote sensing data. Int. J. Appl. Earth Obs. Geoinf. 2013, 21, 409–417. [Google Scholar] [CrossRef] [Green Version]
- Yang, R.; Luo, H.; Zhou, S.; Cheng, Y.; Chen, J.; Xiang, H.; Lei, X. Restoring and analyzing the space forming process of Chengdu-Chongqing urban agglomeration by using DMSP/OLS night-time light data. Geo-Inf. Sci. 2017, 19, 653–661. [Google Scholar]
- Shu, B.; Zhang, H.; Li, Y.; Qu, Y.; Chen, L. Spatiotemporal variation analysis of driving forces of urban land spatial expansion using logistic regression: A case study of port towns in Taicang City, China. Habitat Int. 2014, 43, 181–190. [Google Scholar] [CrossRef]
- Thapa, R.B.; Murayama, Y. Drivers of urban growth in the Kathmandu valley, Nepal: Examining the efficacy of the analytic hierarchy process. Appl. Geogr. 2010, 30, 70–83. [Google Scholar] [CrossRef]
- Li, X.; Zhou, W.; Ouyang, Z. Forty years of urban expansion in Beijing: What is the relative importance of physical, socioeconomic, and neighborhood factors? Appl. Geogr. 2013, 38, 1–10. [Google Scholar] [CrossRef] [Green Version]
- Wei, Y. Urban land use transformation and determinants of urban land use size in China. Geojournal 1993, 30, 435–440. [Google Scholar] [CrossRef]
- Gong, J.; Hu, Z.; Chen, W.; Liu, Y.; Wang, J. Urban expansion dynamics and modes in metropolitan Guangzhou, China. Land Use Policy 2018, 72, 100–109. [Google Scholar] [CrossRef]
- Liu, Y.; Yin, G.; Ma, L.J. Local state and administrative urbanization in post-reform China: A case study of Hebi City, Henan Province. Cities 2012, 29, 107–117. [Google Scholar] [CrossRef]
Figure 1.
Location of the study area.

Figure 2.
Nighttime light data for the Xia-Zhang-Quan metropolitan area in 2013, 2015, and 2017.

Figure 3.
Three types of growth in urban land use.

Figure 4.
Spatial patterns of urban built-up areas in Xiamen in different years.

Figure 5.
Spatial patterns of urban built-up areas in Zhangzhou in different years.

Figure 6.
Spatial patterns of urban built-up areas in Quanzhou in different years.

Figure 7.
The proportion of remaining construction land available in 2013.

Figure 8.
The proportion of remaining construction land available in 2015.

Figure 9.
Urban expansion ability of the three cities in 2013–2015.

Figure 10.
Urban expansion ability of the three cities in 2015–2017.

Figure 11.
Spatial expansion types of various cities in 2013–2015.

Figure 12.
Spatial expansion types of various cities in 2015–2017.

Figure 13.
Changes in total light intensity during 2013–2015.

Figure 14.
Changes in total light intensity during 2015–2017.


Table 1.
Comparison between the size of built-up areas in Xiamen extracted using the threshold value and that in the statistical data.
Table 1.
Comparison between the size of built-up areas in Xiamen extracted using the threshold value and that in the statistical data.
| Year | Threshold Value | Area in the Statistical Data(km2) | Extracted Area (km2) | Relative Error (%) |
|---|---|---|---|---|
| 2013 | 21.807 | 281.6 | 281.5 | 0.04 |
| 2015 | 22.305 | 317.1 | 317 | 0.03 |
| 2017 | 26.163 | 364.08 | 364 | 0.02 |
Table 2.
Comparison between the size of built-up areas in Zhangzhou extracted using the threshold value and that in the statistical data.
Table 2.
Comparison between the size of built-up areas in Zhangzhou extracted using the threshold value and that in the statistical data.
| Year | Threshold Value | Area in the Statistical Data (km2) | Extracted Area (km2) | Relative Error (%) |
|---|---|---|---|---|
| 2013 | 11.570 | 59.3 | 59.25 | 0.08 |
| 2015 | 13.674 | 65.65 | 65.5 | 0.23 |
| 2017 | 13.054 | 69.84 | 69.75 | 0.13 |
Table 3.
Comparison between the size of built-up areas in Quanzhou extracted using the threshold value and that in the statistical data.
Table 3.
Comparison between the size of built-up areas in Quanzhou extracted using the threshold value and that in the statistical data.
| Year | Threshold Value | Area in the Statistical Data (km2) | Extracted Area (km2) | Relative Error (%) |
|---|---|---|---|---|
| 2013 | 8.880 | 188.5 | 188.5 | 0 |
| 2015 | 8.610 | 206.5 | 206.5 | 0 |
| 2017 | 6.710 | 238 | 238 | 0 |
Table 4.
Types of urban expansion in Xiamen, Zhangzhou and Quanzhou during 2013–2015.
| Direction | Area of Various Types of Expansion in Xiamen (km2) | Area of Various Types of Expansion in Zhangzhou (km2) | Area of Various Types of Expansion in Quanzhou (km2) | ||||||
|---|---|---|---|---|---|---|---|---|---|
| Infilling Expansion | Edge Expansion | Outlying Expansion | Infilling Expansion | Edge Expansion | Outlying Expansion | Infilling Expansion | Edge Expansion | Outlying Expansion | |
| East-Northeast | 0.00 | 1.24 | 0.50 | 4.43 | 3.50 | 0.24 | 4.00 | 11.19 | 2.75 |
| Northeast-North | 1.25 | 8.03 | 2.06 | 0.32 | 1.25 | 0.75 | 5.30 | 20.06 | 0.50 |
| North-Northwest | 12.25 | 1.47 | 0.00 | 0.00 | 2.75 | 0.25 | 1.87 | 6.58 | 2.00 |
| Northwest-West | 0.75 | 5.25 | 0.00 | 0.25 | 0.00 | 0.25 | 5.50 | 15.17 | 2.75 |
| West-Southwest | 0.50 | 0.75 | 0.00 | 0.00 | 1.82 | 0.00 | 7.92 | 33.38 | 2.50 |
| Southwest-South | 0.00 | 0.00 | 0.00 | 0.82 | 2.18 | 1.25 | 24.58 | 19.70 | 2.82 |
| South-Southeast | 0.00 | 0.62 | 0.00 | 0.18 | 1.50 | 1.50 | 6.50 | 12.11 | 0.13 |
| Southeast-East | 0.25 | 0.38 | 0.00 | 1.25 | 8.25 | 1.76 | 0.00 | 0.73 | 0.00 |
Table 5.
Types of urban expansion in Xiamen, Zhangzhou and Quanzhou during 2015–2017.
| Direction | Area of Various Types of Expansion in Xiamen (km2) | Area of Various Types of Expansion in Zhangzhou (km2) | Area of Various Types of Expansion in Quanzhou (km2) | ||||||
|---|---|---|---|---|---|---|---|---|---|
| Infilling Expansion | Edge Expansion | Outlying Expansion | Infilling Expansion | Edge Expansion | Outlying Expansion | Infilling Expansion | Edge Expansion | Outlying Expansion | |
| East-Northeast | 0.00 | 7.47 | 1.25 | 1.00 | 7.22 | 0.25 | 4.79 | 36.09 | 11.31 |
| Northeast-North | 4.03 | 13.08 | 1.00 | 0.75 | 3.25 | 2.00 | 15.92 | 36.13 | 3.30 |
| North-Northwest | 2.97 | 6.66 | 0.00 | 0.00 | 1.07 | 0.25 | 3.72 | 17.99 | 3.00 |
| Northwest-West | 1.00 | 4.23 | 1.00 | 0.00 | 0.00 | 0.25 | 29.97 | 49.16 | 4.00 |
| West-Southwest | 1.00 | 1.02 | 1.00 | 0.00 | 0.75 | 1.00 | 61.78 | 19.47 | 0.00 |
| Southwest-South | 0.00 | 0.00 | 0.24 | 0.50 | 7.39 | 6.25 | 83.11 | 26.71 | 2.29 |
| South-Southeast | 0.00 | 0.00 | 0.00 | 1.00 | 6.52 | 3.25 | 20.63 | 7.21 | 0.00 |
| Southeast-East | 0.75 | 0.00 | 0.15 | 1.25 | 14.66 | 4.25 | 0.00 | 5.57 | 0.50 |
© 2019 by the authors. Licensee MDPI, Basel, Switzerland. This article is an open access article distributed under the terms and conditions of the Creative Commons Attribution (CC BY) license (http://creativecommons.org/licenses/by/4.0/).
Share and Cite
MDPI and ACS Style
Jiang, Y.; Sun, S.; Zheng, S. Exploring Urban Expansion and Socioeconomic Vitality Using NPP-VIIRS Data in Xia-Zhang-Quan, China. Sustainability 2019, 11, 1739. https://doi.org/10.3390/su11061739
AMA Style
Jiang Y, Sun S, Zheng S. Exploring Urban Expansion and Socioeconomic Vitality Using NPP-VIIRS Data in Xia-Zhang-Quan, China. Sustainability. 2019; 11(6):1739. https://doi.org/10.3390/su11061739
Chicago/Turabian StyleJiang, Yuantong, Shoukai Sun, and Shuanning Zheng. 2019. "Exploring Urban Expansion and Socioeconomic Vitality Using NPP-VIIRS Data in Xia-Zhang-Quan, China" Sustainability 11, no. 6: 1739. https://doi.org/10.3390/su11061739
Note that from the first issue of 2016, this journal uses article numbers instead of page numbers. See further details here.