Article

Analysis of Three-Dimensional Space Expansion Characteristics in Old Industrial Area Renewal Using GIS and Barista: A Case Study of Tiexi District, Shenyang, China

1
CAS Key Laboratory of Forest Ecology and Management, Institute of Applied Ecology, Chinese Academy of Sciences, No.72 Wenhua Road, Shenyang 110016, China
2
School of Architecture, Tianjin Chengjian University, No.26 Jinjing Road, Tianjin 300384, China
3
University of Chinese Academy of Sciences, No. 19 Yuquan Road, Beijing 100049, China
*
Author to whom correspondence should be addressed.
Sustainability 2019, 11(7), 1860; https://doi.org/10.3390/su11071860
Submission received: 2 February 2019 / Revised: 17 March 2019 / Accepted: 19 March 2019 / Published: 28 March 2019
(This article belongs to the Special Issue Urban Sprawl and Sustainability)

Abstract

:
With rapid urban development in China in the last two decades, 3D characteristics have been the main feature of urban morphology. Nevertheless, the vast majority of urban growth research has only focused on area expansion horizontally, with few studies conducted in a 3D perspective. In this paper, the characteristics of 3D expansion that occurred in Tiexi from 1997 to 2011 were evaluated based on geographic information system (GIS) tools, remote-sensing images, and Barista software. Landscape index, the spatiotemporal distribution of changes in buildings’ renewal modes and variations in city skylines as well as the relationship between number and size of high-rise buildings are the specific phenomena and data utilized to quantify the 3D urban expansion. The results showed that the average height of Tiexi increased by 0.69 m annually, the average urban capacity increased by 490.15 m3 annually, and space congestion degree increased by 0.11% annually. The average annual increase of the building evenness index was 36.43. The renewal area occupied up to 75.38% of the total area. The change of the skyline was more consistent with the east–west direction. The change in the south direction was significant, while in the north direction it was relatively slow. The overall shape of the city was that of a weak pyramid, with the angle of the top of the pyramid gradually becoming larger. The methods proposed in this paper laid a foundation for a wide range of study of 3D urban morphology changes.

1. Introduction

Urban renewal originated from the reconstruction of destroyed urban areas in western countries after World War II. With the integration of the global economy and the regional transfer of a production chain, urban renewal, which is mainly aimed at coping with economic recession and population reduction in old manufacturing center cities, has gradually become the main means for various countries’ urban renewal. One of the main modes of urban renewal is to demolish dilapidated houses that affect the overall function of the city and replace them with brand-new buildings and blocks, as New York, USA, does. The earliest urban renewal took place in the United Kingdom and the United States. From 1949 to 1972, the United States launched a large-scale nationwide renewal campaign. In the early stage, the focus was only on slum clearance, while in the middle stage, the focus was on the development of large-scale central business areas. In 1961, a study of 11 cities in the United States concluded that the urban renewal movement had not solved the slum problem, but had exacerbated the decline of central cities [1,2]. In the last 10 years, comprehensive urban governance has been the main task, and the Demonstration City Plan was implemented which included the dual renewal of physics and humanities. Efforts had been made to balance the contradiction between rational urban development and economic interests. Since 2000, urban renewal has become a global problem of urban development with the continuous upgrading of urban development in more parts of the world. More non-English-speaking countries are facing the need for urban renewal related to their development stages and historical backgrounds.
Changes in industrial structure, transformation of economic and trade modes, and the emergence of hi-tech industries have led to a gradual decline in traditional heavy industries in China, resulting in an urgent need to transform the functions of urban areas. China’s old industrial areas are facing a need for renovation and transformation, just as previously occurred in other parts of the world such as the Ruhr area (Germany), Barcelona’s industrial district (Spain), the cities of Detroit and Philadelphia (USA), and Manchester (England). The Ruhr industrial area serves as a good example of successful renovation. The Ruhr’s renovation strategy focused on reusing existing materials by changing the functions of established buildings, facilities and sites. In this way, the Ruhr still represents the history of its industrial past and simultaneously serves as an area for entertainment and living [3]. Therefore, the renewal of the Ruhr would not lead to a drastic three-dimensional expansion of the city. In contrast, the renovation of China’s old industrial areas currently operates in a different mode, mainly in terms of demolition and re-establishment. First, all sites in the old industrial areas are demolished and then the land is reconstructed into residential areas, business districts, or parks. Through this process of renovating old industrial areas in China, the landscape of newly built-up areas expands horizontally [4,5]. At the same time, the interior landscape of such areas change dramatically; the height of new buildings continues to increase, and remarkable vertical expansion occurs. As a result of the renewal process, the original urban landscape undergoes tremendous changes. Determining the various patterns and trends of development that occur in urban spaces during renewal facilitates the prediction of changes in urban space and possible problems during renewal. Such predictions can effectively guide the healthy and sustainable development of cities.
Urban space expansion generally includes both horizontal expansion and vertical expansion, which are important research topics [6]. Previous studies on urban spatial expansion focused on horizontal expansion using remote-sensing images and night lighting data, including urban growth patterns [7], urban land-use intensity [8], dynamic mechanisms of urban expansion [9,10], and predictions of urban expansion [11,12,13]. However, studying urban space expansion in horizontal direction (two dimensions) cannot completely explain three-dimensional (3D) variation in an urban landscape. Therefore, it is necessary to analyze urban expansion from a 3D perspective.
Acquiring appropriate data on urban spaces is the basis for 3D urban space expansion research. Rapid, highly accurate and automatic extraction of urban space 3D information has always been the focus of research on photogrammetry, remote sensing and computer vision [14]. Methods for automatic extraction of 3D information regarding buildings [15,16] from integration of multispectral/hyper spectral images [17,18], LiDAR [19] or SAR [20,21,22] became an emerging research focus. This 3D information have been effectively applied to analyzing 3D urban space [23]. Using shadow to measure height is the main method to automatically extract 3D information of trees and buildings for 3D urban. Various high-definition remote-sensing images provide great convenience for obtaining shadow information of buildings. A high level of professional knowledge is required for automatic 3D information extraction from these images because of complex image preprocessing and the establishment of regulation and reconstruction algorithms. Extraction accuracy cannot be guaranteed [24]. The automatic extraction of building polygons tends to omit some buildings and misclassify other objects as buildings (false positive pixels) because of the poor point density of LIDAR data [25]. An alternative technique for extracting 3D information from high-resolution satellite imagery is via monoplotting [26,27]. They extracted 3D spatial information from aerial images of terrain described by a digital elevation model (DEM). The extraction accuracy had been proven to be improved [28]. The process requires a lower level of professional knowledge than alternative processes but still achieves good extraction accuracy. Fortunately, Barista is a software package designed for extracting three-dimensional information from high-resolution satellite imagery via visual interpretation [29]. It can directly measure the building height and automatically calculate the building area, and form a 3D building model. Research on 3D urban space expansion has gradually developed from theoretical discussion [30] to quantitative description. The application of urban landscape indices to analyze and explore the driving forces for 3D urban expansion was studied. Building coverage ratio (BCR), floor area ratio (FAR), and other building density indicators of Houston were numerically and automatically derived from high-resolution airborne LiDAR data [4]. Taking Shanghai as an example, the changes of urban average height and built-up area were studied to represent the city’s vertical and horizontal increases respectively, and statistical methods were used to analyze the driving forces of urban expansion [6]. The indexes (average building height, landscape height standard deviation, floor area ratio, building shape coefficient and building coverage ratio, distribution evenness, space crowded degree) and spatial statistical analysis were used to study spatial landscape pattern characteristics of Shengyang at the three-dimensional scale [31,32]. Zhang extracted three-dimensional (3-D) building in-formation from Quickbird images to investigate the change of urban 3-D morphology [24]. These research efforts were based on vertical measurements, such as building heights, but did not include representations of the changes in space and time of urban landscapes in 3D.
Qin et al. and Shi et al. take Yangzhou and Shanghai as examples to analyze their three-dimensional spatial forms, respectively. At the same time, from the perspective of the characteristics and driving factors of urban three-dimensional spatial expansion, they analyze the mechanism of urban three-dimensional spatial forms expansion lacking a grasp of spatial distribution of architectural landscape [6,33]; Qiao et al. and Qin Jing used the deviation and sum of the three-dimensional urban gravity center respectively. The fractal dimension of urban morphology is used to quantitatively describe the expansion of urban three-dimensional spatial morphology [33,34]. Their results have shown notable differences in change patterns that the urban landscape went through among old industrial cities. They also found that the urbanization level was the main driving force for urban horizontal expansion, while the improvement of industrial structures was a key for vertical expansion. The research ranges from a single city to a group of megacities, even in the entire area of the country or the world. Previous studies have analyzed the expansion of Houston [4], Shanghai [6], Shenyang [31], Qingdao [24] and Dalian [35] using 3D landscape indices. Taubenböck et al. tracked the urbanization process of the Hong Kong–Shenzhen–Guangzhou mega-region with the use of spatial metrics [36]. Frolking et al. used DMSP/OLS nighttime light data for measuring horizontal urban growth and used Sea Winds micro wave back scatter power return data for detecting vertical urban growth in 100 cities worldwide [37]. There is a lack of combination of qualitative and quantitative methods to analyze the three-dimensional spatial and temporal characteristics of cities from multiple perspectives.
There are relatively few qualitative studies on three-dimensional urban expansion. Qiao et al. only studied the skyline and relationship between height and floor area of high-rise buildings in the central city of Nanjing [34]; Jun et al. compared the data of Dalian in 2003 and 2013 to study the spatial and temporal changes of the 3D urban pattern [35]. These could not fully reflect the urban 3D expansion characteristics.
The simulation and prediction of three-dimensional urban expansion is one area of research. The urban 3D extension model mainly draws upon the 3D cellular automata (CA) model (an improvement on the earlier 2D meta-packet CA model). Semboloni improved White’s two-dimensional CA model to three-dimensional CA model. The improved model made up for the defect that 2D CA model could not use discrete parameters to express the changing density and the situation of land for multiple use [38]. Bengguigui’s three-dimensional cellular automata (3DCA) model of urban space had simulated different stages of urban development with different parameters and offered reasonable explanations. Nevertheless, it did not visualize the model in three dimensions [39]. Based on the theory of self-organization in urban development, the urban growth simulating model using three-dimensional cellular automata (3DCA) proposed by Bengguigui was improved. The center distance parameter and the traffic distance parameter were added to the model. New three-dimensional urban growth models were set up: center distance model and transport distance model. Using such a model to simulate city’s three-dimensional growth approximated the real city’s expansion more than using Bengguigui’s model [40]. Taking a series of variables—accessibility, population density, building density and height into account, the “IF-THEN” rule base was designed to simulate the growth of buildings with different heights [41]. Recently, based on the spectral similarity-enhanced Markov chain random field cosimulation (SS-coMCRF) model for land cover post-classification [42,43], Zhang et al. further proposed an integrated framework for detecting both horizontal and vertical urban expansion to estimate vertical urban growth—the varied area of mid-rise or taller buildings (MTBs)—making it possible to gain some new insights into the urban expansion of megacities [44]. This growth model could reflect real urban 3D spatial expansion processes. The simulation accuracy needs to be improved, and at the same time, there is a lack of recognition of this form of urban expansion.
The landscape index has been used in urban planning since 1970s. The economic and technical indicators of urban planning plan adopt a 2D landscape index [45], instead of a 3D landscape index. Building height, density and volume ratio are the main requirements for buildings in the area of land use. Future urban planning should take the urban congestion, city skyline, relationship between height and floor area of high-rise buildings, and so on into account. A city’s strategic planning and reconstruction policy should be discussed and controlled from a 3D perspective. Tiexi District is a typical old industrial area in China and serves here as a model of old industrial area renewal. In this study, “Tiexi District” refers specifically to the Tiexi old industrial area. Urban space in Tiexi District has undergone significant changes owing to a series of urban renewal policies. We carried out preliminary research on the 3D expansion of urban space that occurred as a result of the renewal of Tiexi District and explored the features of this change as well as the patterns related to 3D space expansion. An in-depth understanding of three-dimensional expansion of urban space over time is essential for policy makers and city planners to conduct better city planning and urban sustainability research.

2. Study Area and Data Sources

2.1. Study Area

Tiexi District (41°45′ N–41°50′ N, 123°18′ E–123°23′ E), part of the core area of Shenyang, is located in the southwest area of downtown Shenyang, and has an area of 39.48 km2. Tiexi District is surrounded by the Shenyang–Shanhaiguan and Changchun–Dalian railways, with the railways serving as borders to the adjacent Heping District in the east, Yuhong District in the south and west, and Huanggu District in the north. With Jianshe Road as the dividing line, the residential area of Tiexi District is located in the south and industrial area in the north. Four ring roads encircle the center of Shenyang City. The first and second rings of Shenyang run through Tiexi, separating Tiexi into first-, second- and third-ring regions (Figure 1). Tiexi District had a population of 872,000. The regional GDP was RMB 22.84 billion. Fiscal revenue reached RMB 10 billion. The per capita disposable income of the town’s residents was RMB 22,925. The total floor area of per capita housing was 31.7 m2. Residing in south and producing in north was the initial urban pattern in Tiexi. There were nearly 300 industrial enterprises in about 50% of the area. Industrial structure was dominated by heavy industry and the equipment manufacturing industry, supplemented by light industry. However, since the 1980s, most factories had stopped production, workers had been laid off, and the economy had declined. Old Tiexi has become a typical representative of the decline of 120 old industrial cities in China. The urban landscape of Tiexi District was greatly changed by implementations of Retreat into Three and Move the East and Transform the West (METW) transformation strategies in 2002 and 2007.
Tiexi District has a long history of development, with colonial industry as the starting point of urban advancement. Tiexi District has been known as “the Eastern Ruhr” or “the Ruhr of the East” for its industrial heritage and significant contributions to China’s growth and progress. The formation and development of Tiexi District has been affected by industrial trends. Adjustments in industrial structures, implementation of regional policies, and institutional transformation have all influenced the development of the region. The area has undergone a gradual change from an industrial to a multi-functional city. In 1986, the renewal of Tiexi District, as China’s only regional pilot project for urban renovation, was included in the national reconstruction plan. In 2002 and 2007, the Retreat into Three and Move the East and Transform the West (METW) transformation strategies were respectively implemented to help renovate the area (Figure 2).
These policies involved relocating, transforming or closing down heavily polluting, high-energy-consuming and inefficient industrial enterprises in a focused, layered and time-phased fashion according to classifications based on pollution emissions. Through this process, the heavy industrial plants in Tiexi District were gradually relocated to the economic and technological development zone in the western part of Shenyang. By 2008, 254 enterprises had been relocated and 86,000 km2 of land area had been vacated. Furthermore, a total of 342 old and shanty communities were demolished between 2002 and 2008, which promoted the transformation and development of the area. The existing pattern of residences in the south and industrial plants in the north was gradually transformed as the entire area became dominated by residential land use. The functionality of the area switched from industrial to commercial and cultural and daily living; two new commercial areas were developed [46], and the urban layout was significantly altered. As a representative old industrial area, Tiexi District’s history, characteristics and experience of renewal can provide an important reference for its counterparts in China.

2.2. Data Sources

Our data sources included corrected 1:10,000 scale aerial photographs from 1997, and QuickBird panchromatic (0.61 m) and multi-spectral (2.44 m) images from 2002, 2005, 2008 and 2011. We also used a 1:10,000 scale topographic map, a 1:10,000 digital elevation model (DEM) generated in ArcGIS by digitizing contour lines from a 1:10,000 topographic map, a 1:11,000 chart of Tiexi District in 2011, and a Tiexi District planning map in 2003 from Shenyang Planning and Land Resources Bureau.
Additional 3D building information was extracted through four QuickBird images using Barista software version 3.2, co-developed by the University of Melbourne School of Geographic Information and the Center for Collaborative Research in Spatial Information [5]. The three-dimensional architectural data of the QuickBird images were extracted based on the Monoplotting technique in Barista software. One-pixel geo-positioning accuracy in planimetry and height obtained using two ground control points in the process of RPC bundle adjustment. The greater the off-nadir angles, the higher the geo-positioning accuracy in both planimetry and height. Open the building’s 3D information and 3D model files in ArcGIS and Autocad respectively for information statistics and further analysis. By comparing visual interpretations of building surfaces in aerial photos in ArcMap with the buildings in QuickBird images from 2002 and data from the Shenyang Urban Construction Archives, the 3D building information in 1997 was extracted. Using these data, we obtained building height information and established 3D models.
To test the accuracy of building height extraction, 166 buildings were randomly selected in the study area, including eight low-rise buildings (height ≤ 10 m), 82 multi-layer buildings (10 m < height ≤ 24 m) and 76 high-rise buildings (height > 24 m). We conducted site surveys with a laser altimeter and Contour XLRic (LaserCraft Corp., Norcross, GA, USA) laser range finder (10-cm precision), and then compared the predicted results with the measurement results. Verification results showed that actual error was around 2.3–2.8 m, with an accuracy of 85%.

3. Methodology

We analyzed 3D expansion of urban space through average building heights, floor area ratios, average building volume, the building evenness index, degree of congestion, city skylines, and variation in the relationship between high-rise building heights and floor area. Landscape indices are used to quantify the 3D expansion of the city; the variation of built-up patches can reflect the spatial and temporal changes of urban expansion; city skylines and the relationship between high-rise building heights and floor area reflect the overall shape of the city in terms of its urban expansion.

3.1. Landscape Index Analysis

Landscape indices are commonly used in landscape ecology analysis to represent highly concentrated landscape pattern information; these indices can effectively reflect overall variations as well as structural composition and spatial configuration of landscape patterns. The architectural landscape is an important element in urban spatial geographic information databases and a principal representative of urban material space. Changes in the urban architectural landscape greatly influence variations in urban landscape patterns and 3D expansion. To analyze changes in overall characteristics of 3D space expansion, we selected five indicators: one in 2D and four in 3D. The 2D indicator was the building evenness index (Table 1) [31]. The four 3D indicators were the average building height (Table 1) [31], floor area ratio (Table 1) [47], average volume (Table 1) [31] and degree of space congestion (Table 1) [31]. Average building height and floor area ratio were obtained in ArcGIS, while the average volume, building evenness index and degree of space congestion were calculated in Excel. The formula for calculating each indicator and its explanation are shown as follows.

3.2. Built-Up Land Patches

In urban renewal research, patches of built-up land are categorized into two types: newly built-up patches (converted from other land uses in the process of urban renewal) or transformed patches (structures re-built after the demolition of original buildings). We performed spatial overlay analysis of landscape type maps for 1997, 2002, 2005, 2008 and 2011 in ArcGIS to obtain a spatial distribution map of building landscape patches in different time periods and statistically analyze it. In ArcGIS, newly built-up patches and transformed patches were interpreted hierarchically. In the process of interpretation, patch area and other information were automatically saved in text files. The number and area of patches could be conveniently counted in the ArcGIS software (version 9.3, ESRI, Redlands, CA, USA). In this way, the renewal of built-up land patches was achieved in four periods: 1997–2002, 2002–2005, 2005–2008 and 2008–2011. The key contents of urban renewal (new or transformed), the pace of city’s renewal and its space distribution can be obtained from the updates of each period.

3.3. City Skylines

City skylines, as a material reflection of city life, provide a comprehensive impression of a city’s uneven buildings and its overall urban layout. Different cities have different skylines, which reflect their unique character. City skylines are one of the most typical and vivid expressions of urban space [33]. City skylines usually refer to the skyline viewed from a certain direction at a certain location in the city. In essence, skylines are not the result of prior planning, but gradually take shape through the process of urban development. Skylines at a certain angle can vividly reflect the 3D form of a city from one side. Studying skylines over time can reveal patterns of change in 3D urban forms from one side [35]. In this study, a “city skyline” refers to a silhouette of urban structures projected using a single color and infinite background. City skylines were obtained using AutoCAD’s 3D view through Barista interpretation of 3D building information. This method reflects differences in terrain height and can thus accurately express the dimensions of city skylines. In this study, the north–south direction skyline and the east–west north–south direction skyline were selected. The skyline in north-south direction is the projection on the vertical plane perpendicular to east-west direction that all the buildings from east and west of the city created through the center. It is the same with the skyline in the east–west direction. When it is the north–south skyline, the distance between a building’s projection and the center represents the distance between the building and the center from a north–south direction, and it is the same when it comes to the east–west direction.
Classification of building types was made according to building height. According to the relevant provisions of Residential Design Code (GB 50096-2011), Official Building Design Specifications (JGJ 67-2006), Design of Civil Buildings (GB 50352-2005) and High-Rise Building Fire Protection Design Specification (GB 50045-2005), buildings in this study were divided into single-story building (height ≤ 5 m), low-rise building (5 m < height ≤ 10 m), multi-story building (10 m < height ≤ 24 m), mid-rise building (24 m < height ≤ 50 m), high-rise building (50 m < height ≤ 100 m), super high-rise building (height > 100 m). This paper studied the distribution of the last four types of buildings which had an impact on the composition of the city skyline. The average of the distance of the projections of each type of buildings on the north–south vertical plane and the east–west vertical plane to the urban central point were counted. By comparing the variation of distance between the center and different types of buildings in different periods the regulation of buildings’ space transformation can be obtained, which reflects its impact on city’s skyline. The vertical distances between the closest point between each building and two vertical planes to two vertical planes were calculated in ArcGIS. The average distances between each type of building and two vertical planes were obtained in Excel.

3.4. Relationship between Height and Floor Area of High-Rise Buildings

3D urban space was put forward by Yu Z. and Wu Z. in 2008, based on two kinds of urban expansion forms [48]. One develops built-up area with the height of buildings unchanged, and the other where the remaining the built-up area is the same but building height is increasing constantly. The urban expansion form of Tiexi belongs to the second one.
The expansion of 3D urban space is characterized by three stages according to the relationship between building area and height: the weak pyramid stage, balanced pyramid stage, and the top stage (Figure 3). The weak pyramid stage represents an early form of urban development, with a less dense population, lower-rise buildings throughout most of the built-up area and intense development (with taller buildings) only in the urban center. In this case, the urban form takes the shape of a weak pyramid. As a city develops, it expands both horizontally and vertically, with an increasingly large built-up area and taller buildings throughout. The ratio of buildings of different heights tends to be proportional and stable. At this point, the city’s form is represented by a balanced pyramid. During the top stage, city development in the horizontal direction is restricted owing to land scarcity, and thus expansion in the vertical direction continues to increase. In this stage, the urban form takes the shape of a domed roof, with increasingly tall building heights and higher building density [34]. At this stage, any mismanagement in planning would cause serious problems.
A balanced pyramid would be the best shape for a city to develop, and the worst would be the dome-roof shape [48]. When a city expands three dimensionally, it reduces the occupation of limited land area in urban, resolves the severe tension in land use, and improves the efficiency of land use at the same time, accommodating more urban elements within the same amount of land space. The balanced pyramid would be the perfect shape in the case of efficiently easing traffic congestion, solving related problems over environment protection and the improvement of living quality. However, when building development in urban goes beyond the limit of balanced pyramid stage, city becomes crowded with skyscrapers, and people’s tolerance towards the living environment will up to the limit. Overall, balanced pyramid is the ideal three-dimensional shape for a city to be, taking sustainable urban development in a long run into consideration.
Based on 3D information about urban structures, we collected statistics on average building height and building area using different height categories and generated figures showing building area versus building height, with building area on the horizontal axis, and building height on the vertical axis. Total building areas of different height categories are displayed along the vertical axis. The height category was mainly based on the height range of the buildings.

4. Results

4.1. Analyzing Indices

Overall, average building height (AH) showed an increasing trend from 1997 to 2011, growing from 9.74 to 19.34 m, with an average annual increase of 0.69 m. Floor area ratio (FAR), average volume (AV), building evenness index (BEI) and space congestion degree (SCD) also increased over the study period (Table 2). The number of FAR increased from 0.87 in 1997 to 1.58 in 2011 with an average annual growth of 0.05. AV also increased from 10,695.81 m in 1997 to 17,557.92 m in 2011, increasing by an average of 490.15 m3 per year. These changes indicate that average building height and volume increased, meaning that Tiexi District increased its urban capacity as a result of renewal. BEI increased from 347.17 in 1997 to 857.24 in 2011, with annual increase 36.43, an indication of increasingly uneven distribution of urban construction and aggregation of large and small buildings. SCD increased from 1.86 in 1997 to 3.38 in 2011, with an annual increase of 0.11%, meaning that congestion in 3D space increased significantly. From 2002 to 2005, FAR, AV, BEI and SCD declined slightly, probably as a result of massive demolition of industrial buildings and shanty communities. During this period, the number of low-rise buildings decreased rapidly, and the construction of new buildings lagged behind the demolition of old buildings. Thus, 2002–2005 was the most dramatic period of urban renewal, and the period with the greatest urban renewal efforts during the study.

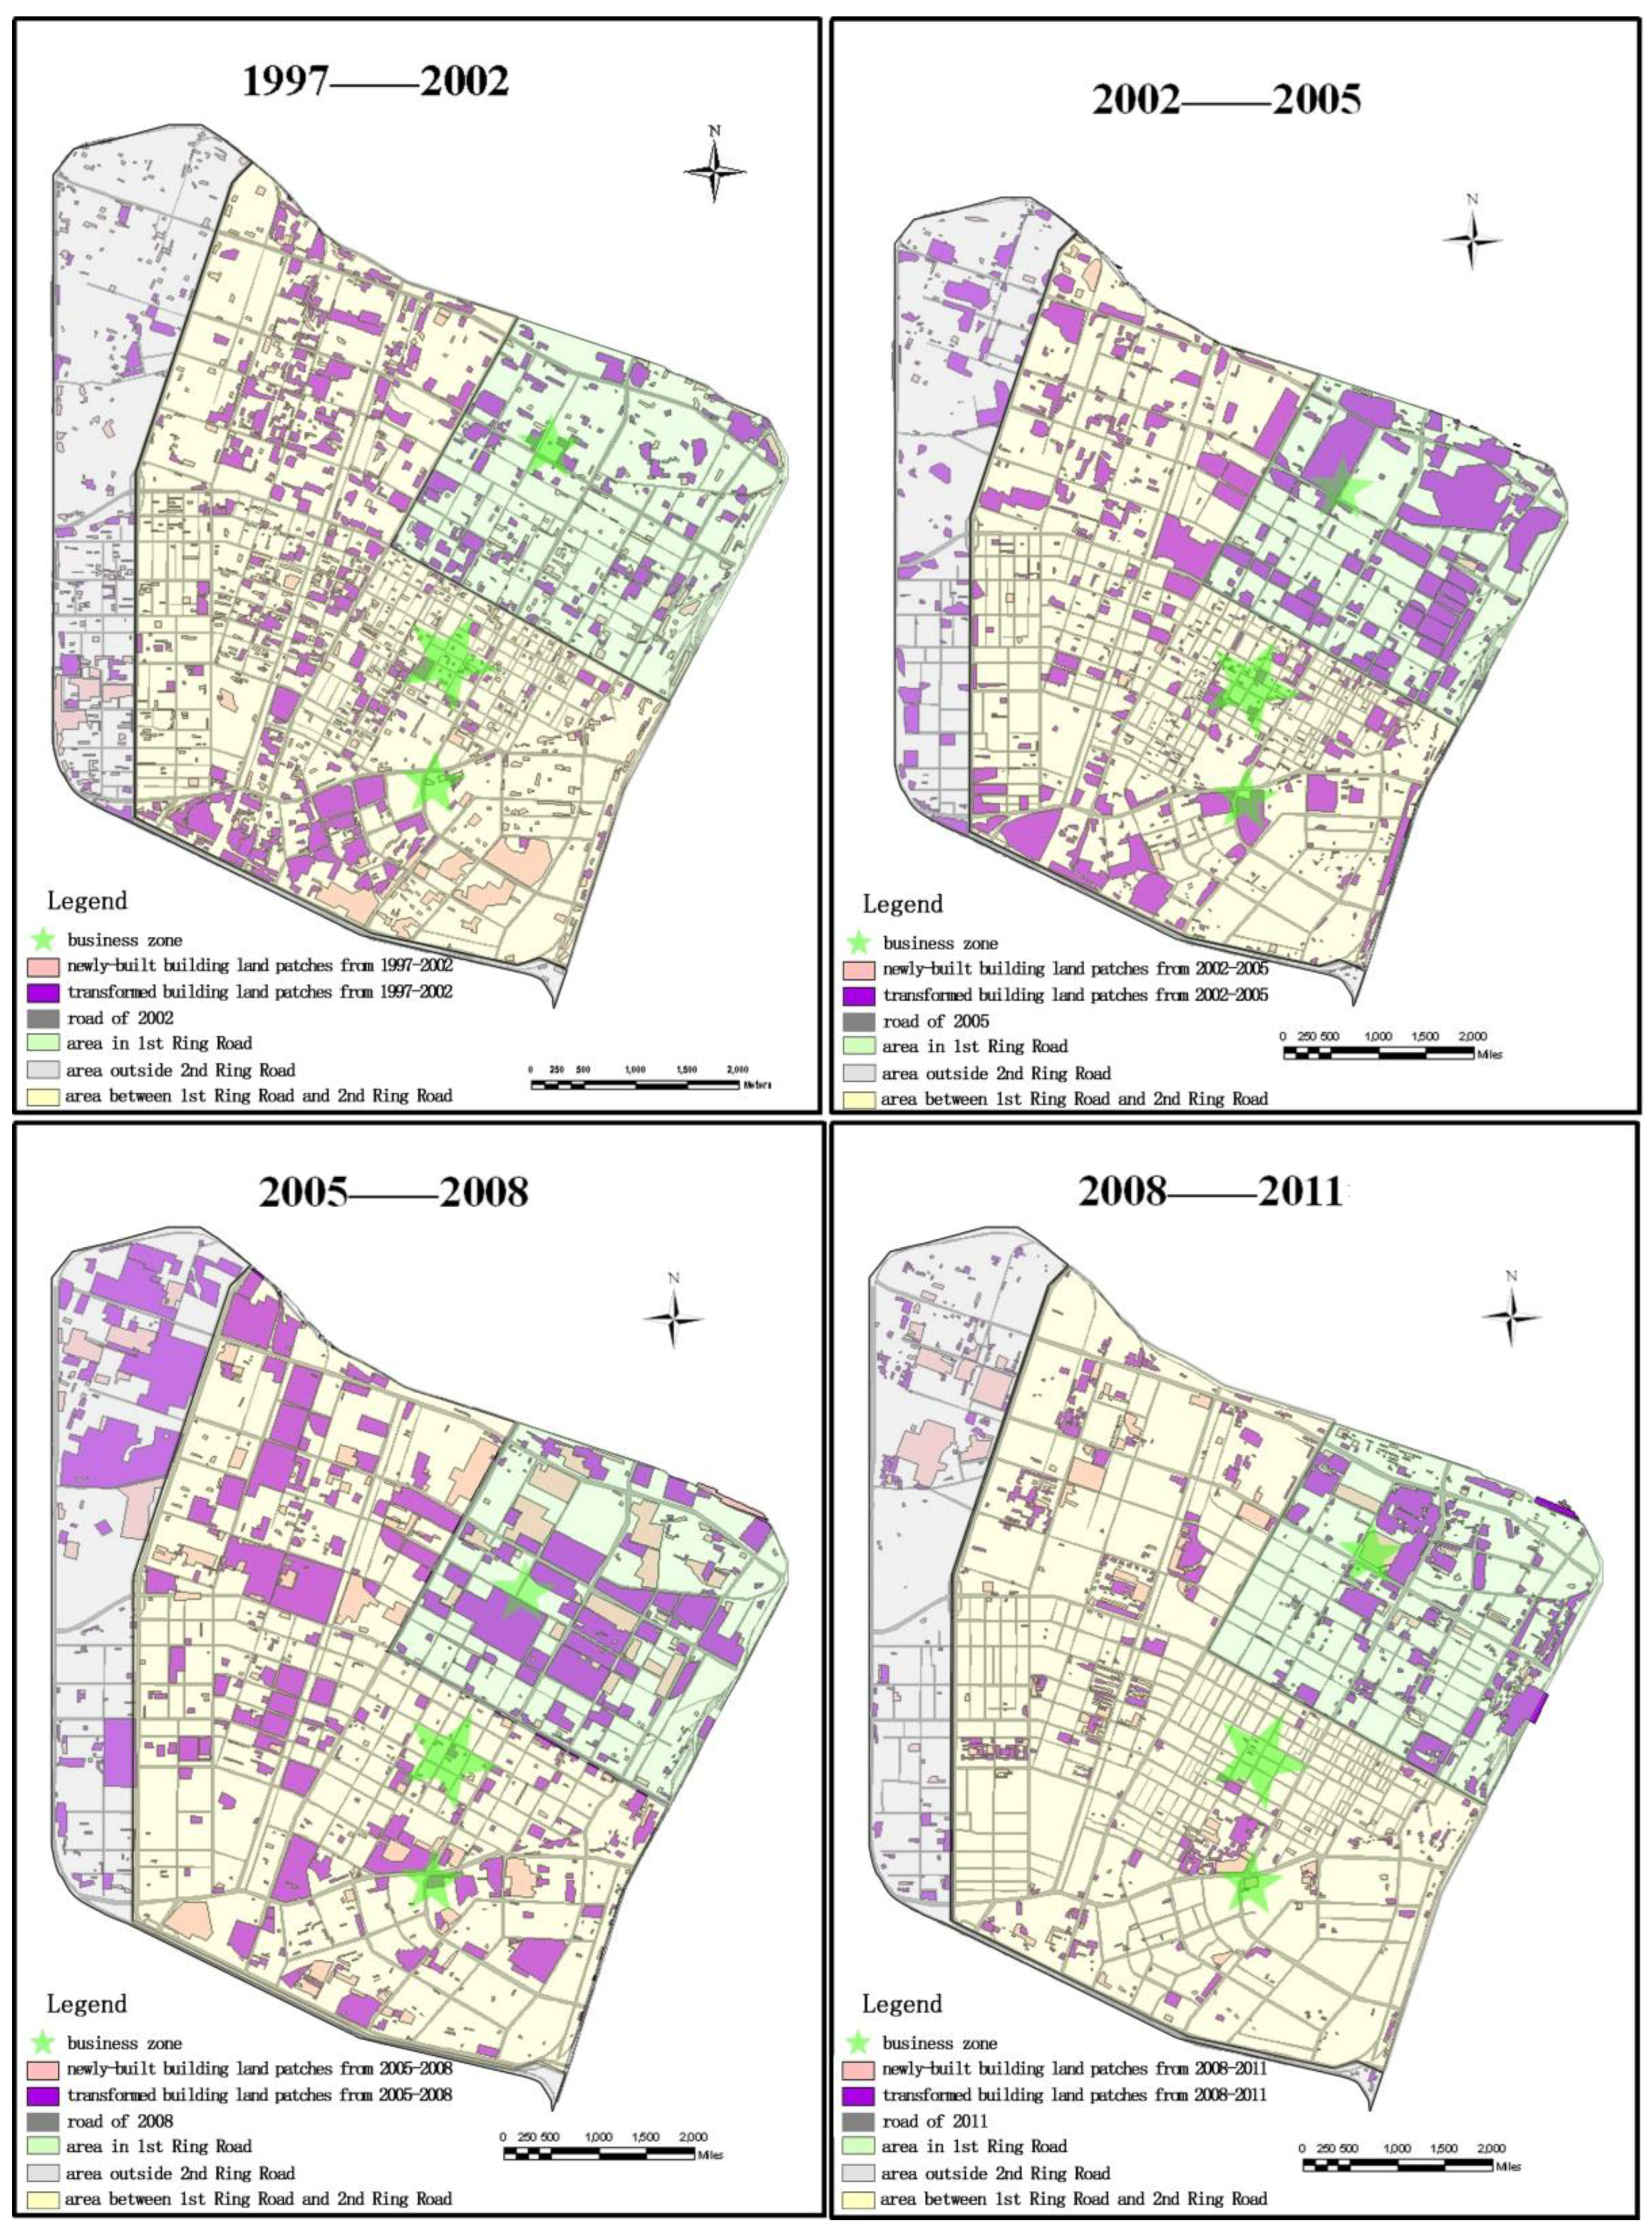
4.2. Renewal of Building Land Patches

In ArcGIS, we superimposed landscape-type maps for 1997, 2002, 2005, 2008 and 2011 to create maps that indicated the spatial distribution of changes in landscape patch types; then, we analyzed these maps statistically (Figure 4).
From 1997 to 2011, the primary form of land renewal was transformation, with transformed patches being most prevalent and newly built patches less so.
From 1997 to 2002, renewal areas (either newly built or transformed patches) occupied 16.94% of the total area of Tiexi, mainly between the first and second ring roads. There were 478 transformed patches and 1051 newly built patches. Transformed patches mostly concentrated on two places. One was on both sides of Weigong Street, east of Zhaogong Street and west of Baogong Street. The other was a triangular area surrounded by Liaoshen West Road, Liaoshen Middle Road, Lanjun Road, Yanhua Street and Tengfei Second Street. Other patches were scattered. Newly built patches mostly concentrated on the southeastern side of Tiexi. The contiguous newly built patches are mainly located in the area surrounded by Lanjun Road, Tengfei First Street, Lingkong Second Street and Feixiang Road.
From 2002 to 2005, renewal areas occupied 19.53% of the total area. There were 832 transformed patches and 56 newly built patches. Transformed patches were mostly located between the north of Jianshe Road and the northern boundary of the study area, and in the area enclosed by Shenxin East Road, Shenliao Road, Tengfei Second Street and the southern border of Tiexi. Newly built patches were mainly in the area enclosed by Zhonggong North Street, Zhaogong North Street, North-First West Road and North Railway. Compared with 1997–2002, the large-scale transformed patches mainly concentrated on the first ring road of the city. The new patches were fewer than before, and they were highly fragmentized at the same time.
From 2005 to 2008, renewal areas occupied up to 27.61% of the total area. There were 461 transformed patches and 377 newly built patches. Transformed patches were mostly located between the north of the Jianshe Road and the northern boundary of Tiexi, and the two sides of the ShenLiao West Road. Newly built patches were mainly located in areas with dense reconstruction.
From 2008 to 2011, the proportion of renewal area decreased to 11.30% of the total area, and was mainly located in the former industrial area. There were 459 transformed patches and 529 newly built patches. Transformed patches were mainly located in the north of the Bei’er Road, which was within the scope of the first ring road of the city. While newly built patches were mainly in areas outside the second ring. Newly built patches were mainly in the area enclosed by Zhonggong North Street, Jianshe Road and the east border of Tiexi.
From 1997 to 2011, distribution patterns of renewal land patches underwent constant variation, shifting gradually from arterial roads to the first ring area, and then to the former industrial area. This variation serves as an indication that spatial distribution of building land renewal was related to regional transportation infrastructure, land-use types and distance to the urban center.

4.3. Variations in City Skylines

We generated city skylines for the five study years (1997, 2002, 2005, 2008, and 2011) in the east–west and north–south directions (Figure 5).
In 1997, the city’s skyline in the east–west direction showed three peaks and four sub-peaks. The peaks were respectively located in the eastern, central and western areas. Each sub-peak was located between every two peaks, and was also located at both ends of the city. The north–south skyline had three peaks and two valleys, with peaks in the middle and valleys at both ends. The peak was primarily composed of a single building. The buildings were mainly in the central and southern areas.
Compared with 1997, variations in skylines in 2002 mainly concentrated on the south and east of the central area in 2002. The city skyline in the east–west direction showed six peaks, seven sub-peaks and 10 valleys. There was one peak in the west, three peaks in the middle and two peaks in the east. The city skyline in the north–south direction had three peaks and three valleys: overall, buildings were tall in the middle of the skyline and shorter on both ends.
Compared with 2002, variations in skylines mainly concentrated on the north-central and eastern areas in 2005. The city skyline in the east–west direction showed alternating peaks and valleys, with flatter areas in the west and peaks primarily in the middle and east. The city skyline in the north–south direction displayed five peaks and four valleys, with taller buildings in the middle and flatter areas on both ends, with three peaks in the central area, two peaks in the south and a flat area in the north.
Compared with 2005, variations in skylines mainly concentrated on the central and western areas in 2008. The city skyline in the east–west direction displayed five peaks and three valleys, with peaks distributed evenly and the highest peak in the east-central area. The city skyline in the north–south direction was high in the middle and low on both ends, with a single dome-shaped peak in the middle.
Compared with 2008, variations in skylines mainly concentrated on the west-central and northern areas in 2011. The city skyline in the east–west direction had six peaks and two belts, with flat areas from the middle to the east, and a main peak in the east-central area. The city skyline in the north–south direction was low in the east with a major peak in the middle and four sub-peaks in the south. The earlier-renewed northern area had fewer high-rise buildings, while the newly built residential area in the south had more high-rise buildings than previously, which resulted in two additional southern peaks compared with the skyline in 2008.
Through the analysis of the average distance between different types of buildings and urban centers (Table 3), it could be seen that multi-story buildings were increasingly further away from the central point of the city in the east–west direction, while in the north–south direction they were close to the central point of the city at first and then far away from the central point of the city. The average annual variation was 7.98 m in the east-west direction and 4.13 m in the north-south direction. Generally, the valleys composed of multi-story buildings moved away from the city center in the east–west skylines and north–south skylines. The mid-rise buildings were increasingly far away from the city center in the east–west direction, while it was far from the city center at first and then close to the city center in the north-south directions. The average annual variation was 22.20 m in the east–west direction and 9.23 m in the north–south direction. Generally, the peaks composed of mid-rise buildings moved away from the city center in the east–west skylines and north–south skylines before 2008. However, the valleys composed of mid-rise buildings moved close to the city center in the east–west skylines and north–south skylines after 2008. The high-rise buildings were far from the city center firstly and then close to the city center in the east–west and the north–south directions. The average annual variation was 13.80 m in the east–west direction and 17.90 m in the north–south direction. The peaks composed of high-rise buildings were far from the city center firstly and then close to the city center in the east–west skylines and the north–south skylines. The super high-rise buildings were increasingly far away from the city center in the east–west and north–south directions. The average annual variation was 116.50 m in the east–west direction and 23.23 m in the north–south direction. The peaks composed of super high-rise buildings moved away from the city center in the east–west skylines and north–south skylines.
During the study period, the height of the city’s skyline gradually increased above the horizon. The number of peaks and valleys increased and then decreased. The structure of peaks also gradually changed from representing one or a few original structures to comprising many buildings. The valleys composed of multi-story buildings were gradually away from the city center in the east–west and north–south directions, while the valleys composed of mid-rise buildings were gradually close to the city center in the east–west and north–south directions. The peaks composed of high-rise buildings were gradually close to the city center in the east–west and north–south directions, while the peaks composed of super high-rise buildings were gradually away from the city center in the east–west and north–south directions.

4.4. High-Rise Building Height and Floor Area

According to relevant provisions of the Residential Design Code (GB 50096-2011), Official Building Design Specifications (JGJ 67-2006), Design of Civil Buildings (GB 50352-2005) and High-Rise Building Fire Protection Design Specification (GB 50045-2005), in this study, we defined high-rise buildings as those with a height >24 m. Based on 3D digital models for 1997, 2002, 2005, 2008 and 2011, we categorized all buildings according to height: (24, 30] m, (30, 40] m, (40, 50] m, (50, 60] m, (60, 70] m, (70, 80] m, (80, 90] m, (90, 100] m, >100 m. We collected statistics for the building areas of each section of the study area and produced a building floor area vs. building height diagram (Figure 6).
From 1997 to 2002, there were no super high-rise buildings (>100 m) in Tiexi and the number of high-rise (>90 m) and medium high-rise buildings (>50 m) grew slowly, with an increase in area of 24,630 m2. Multi-story and mid-level buildings < 40 m were dominant in 2002, covering an area 1.99 times that in 1997. Thus, the overall shape of urban structures was in the form of a weak pyramid.
From 2002 to 2005, the number of high-rise buildings (>90 m) remained unchanged, while that of medium high-rise buildings (>50 m) grew slowly, with an increase in area of 12,350 m2. The area of multi-story buildings (24, 30] m declined slightly. The area of buildings of (40, 50] m showed an increase of 68.39%. Multi-story and mid-level buildings shorter than 40 m were dominant. The overall shape of urban structures continued to form a weak pyramid.
From 2005 to 2008, the number of super-high-rise and high-rise buildings >50 m grew more quickly. In 2008, nine super-high-rise building covered an area of 9800 m2 and the floor area of high-rise buildings (90, 100] m was 20.85 times that in 2005. The building area versus building height curve in 2008 showed obvious increases in building height over previous years, with multi-story and mid-level buildings (<50 m) as the most prevalent. The overall shape of urban structures continued to form a weak pyramid.
From 2008 to 2011, the number of super-high-rise and high-rise buildings >50 m grew more quickly. In 2011, the area of super-high-rise buildings was 3.51 greater than in 2008, and the number of high-rise buildings of (50, 60] m, (60, 70] m, (70, 80] m, (80, 90] m, (90, 100] m, >100 m were 1.53, 1.31, 1.46, 2.06, and 2.35 times greater, respectively. In 2011, the overall shape of urban structures was still a weak pyramid.

5. Discussion

5.1. Driving Forces of Urban Expansion

The city is the area most disturbed by humans. Urban development policy has had an important influence on the change of urban architectural landscape. Revitalizing Old Industrial Base of Northeast China was a policy driving force for the change of architectural landscape in Tiexi District [49]. In June 2002, for the first time, the Chinese government clearly put forward the strategy of rejuvenating the old industrial base of northeast China and proposed Support the Northeast Region and Other Old Industrial Bases to Speed up Adjustments and Reforms. In October 2003, the Chinese government formally issued Several Opinions on Implementing the Revitalization Strategy of Northeastern China and Other Old Industrial Bases, and specified supportive policies for the old industry base. Policy was the main driving force for promoting the three-dimensional expansion of cities in Tiexi District.
The Move the East and Transform the West (METW) development plan in Tiexi District of Shenyang City was a planning driving force for the architectural landscape’s change in Tiexi District. The enterprises located in the eastern part of the city were relocated in the development zone in the west of the city. Tiexi District was re-planned after relocation, focusing on the development of tertiary industry such as trade services. Urban development planning guided the form and process of urban three-dimensional expansion.
The urban master plan played a guiding role in urban expansion. Tiexi District had been planned twice. The first occasion was the Mukden Capital Project by Japanese in 1935. The district on the west side of the railway in Shenyang was designed as industrial zone at that time, and the planning area was 11.5 km2. Since then, Tiexi District was used as industrial zone. With Jianshe Road seemingly as the dividing line, the residential area of Tiexi District was located in the south and industrial area was in the north. The second plan was drawn up after the founding of the People’s Republic. In order to reform Tiexi District, the Tiexi District Renovation Plan was compiled by the Renovation Office of Tiexi District in Shenyang. It mainly contained: (1) adjust the land area for industry use and living use; (2) replan the area for the function of producing, storing, and commercial service; (3) enhance the construction and reconstruction of infrastructure [50]. Specific guidance was given for Tiexi’s renewal. According to the Overall Reconstruction Framework and Strategic Orientation Outline of Tiexi Industrial Zone from 2000 to 2010, effort needed to be made to adjust the industrial structure of enterprises, and develop ecological industries. The Regulatory Plan of Northern Area in Tiexi District in Shenyang published in 2011 suggested that the scale of the land for living use and commercial-and-residential use was constantly increasing. Guidance was given for the further updating of Tiexi.
Income played an important role in China’s urban growth [51]. From 2002 to 2011, Shenyang’s disposable personal income increased by 2.3 times [52]. The rapid increase of average salary enhanced people’s purchasing power and thus might stimulate the improvement of living environment and the construction of new housing. The higher income promoted the change of architectural landscape in Tiexi District from an economic point of view.
In addition, urban transportation infrastructure construction guided the architectural landscape’s change in Tiexi District. During the period of research, construction of architectural landscapes initially took place on two sides of the main streets of the city.

5.2. Comparisons with the Results of Related Studies

In this study, the numerical difference between the estimated height of buildings and the measured height of buildings ranged from 2.3 m to 2.8 m, while that of Zhang P. et al. was 2.66 m. The interpretation accuracy of the two studies was similar. They were all within the theoretical error range [5].
The results of this study were compared with those of Qingdao [24], Nanjing [34], Yangzhou [6] and Houston [4]. The results showed that the common feature of urban expansion was the significant urban expansion in a vertical direction, and the height of the city was increasing year by year. It increased 0.69 m annually in Tiexi, while 0.67 m in Qingdao. The growth rate of building height in Yangzhou was about 12.62%. The floor area ratio of cities was increasing. The ratio in Tiexi increased by 0.05 per year and by 0.04 per year it increased in Qingdao. The velocity of vertical expansion was not uniform everywhere in the study area. The urban expansion around Tiexi’s commercial center and on both sides of the main road was higher than that of other places’. The expansion of Shibei district was faster than Shinan district in Qingdao. The expansion in Nanjing was mainly in the south and west of the city. The main expansion was concentrated on the western new urban areas in Yangzhou. The expansion in Wuhan mainly showed up in the western suburbs, the northern new urban area, and the eastern new urban area. In Houston, Skyline District perfectly reflects the vertical expansion of the urban landscape. The dense cluster of buildings also forms “rugged” urban morphology in the Skyline District. The skylines of Tiexi and Nanjing were constantly changing. There was an apparent change in Tiexi’s east–west skyline, while it existed in central and southern range of the north–south skyline. The west of the east–west skyline of Nanjing changed obviously, while the south of the north–south skyline changed obviously. The apparent change appeared in the middle and west of the east–west skyline in Yangzhou; however, it showed as a smooth line in the north–south skyline. Tiexi’s overall shape of the city had always been a weak pyramid stage, but Nanjing’s overall shape had developed from a weak pyramid stage to a balanced pyramid stage.
The factors affecting the three-dimensional expansion of each city were different. Tiexi urban expansion was related to urban development policy, income and urban transportation infrastructure construction. Expansion differences in Qingdao were related to its history of development, function, planning and population. The expansion of Yangzhou was affected by its urban spatial development strategy and planning, industry development and urbanization. Meanwhile, the factors from limited environment conditions and protection of historical sites all had an impact on Yangzhou’s development.

5.3. Urban Renewal Differences between Tiexi and Ruhr

Urban renewal strategy is influenced by geographical location, development history, development stage, economic status, location characteristics, industrial types, social culture and architectural status [53]. The Ruhr’s strategy was to reuse old things while Tiexi was to abandon the old and build new ones. Therefore, the renewal of the Ruhr did not result in drastic three-dimensional expansion of the city. However, Tiexi’s low-rise buildings were replaced by a large number of high-rise buildings, which changed the city’s appearance, and the city’s 3D expansion was remarkable. This is mainly due to the orientation of urban renewal and the different sources of funds.
The orientation of urban renewal was different. From the 1950s to the late 1960s, the Ruhr began to adjust its industrial structure and implement the strategy of “re-industrialization”. According to the Ruhr Development Program formulated by the North Rhine-Westphalia Government, some traditional polluting industries began to stop producing, and began to develop towards new industries such as environmental protection technology, electronics, machinery and equipment. Universities and research institutes with cutting-edge scientific and technological capabilities were established. It developed a service industry, mostly tourism. The Ruhr District put its investment in the development of tourism resources in industrial memorial sites such as large numbers of factories, workshops and mechanical structures left over in the industrialized era [54]. In June 2002, Shenyang Municipal Government decided to ask Tiexi District and Shenyang Economic and Technological Development Zone to co-operate in building up Tiexi New District with a strategy of large-scale enterprise relocation from east to west implemented. Old Tiexi’s urban orientation was to develop modern business and life services. Owing to the limited land resources in Old Tiexi, the main way was to renew the stock. The land vacated by industrial enterprises was redeveloped and the historical industrial land was transformed into residential or commercial land.
Funds came from different sources. In the renewal of Ruhr, German governments at all levels not only provided policy support, but also a large number of financial subsidies. As for the projects such as environmental protection and waste plant utilization, 80% of the investment could be funded, half of which was invested by the federal and state governments [55]. As a result, the old workshop land was recycled and became an environment-friendly base for research and development. At the same time, the development funds for tourism resources were invested in the development of industrial memorial sites to build unique industry-style history museums, so as to drive the tourism service industry which could stimulate the tourism service industry [56]. However, Tiexi’s renewal fund was leveraged by differential land rent, and capital investment was an important means [57]. The transformation of Tiexi old industrial zone basically adopted a land replacement mode guided by real estate development. The vacant land of the relocated enterprises was used to attract investment and develop financial, commercial and real estate industries. Real estate development achieved the greatest land income by increasing the “building volume ratio”. The economic benefits coming from the change of land use and higher volume ratio increased the financial resources of Tiexi District Government, which can be used to offer sufficient funds for shanty towns’ transformation [58].

5.4. Future Urban Expansion of Tiexi

Driven by two transformation strategies of Retreat into Three and Move the East and Transform the West (METW) in 2002 and 2007, the period of urban renewal in Tiexi District was the most intense from 2002 to 2011. The task Move the East and Transform the West (METW) ended in 2012. From 2000 to 2010, the overall change rate of land-use types reached 76.9% [50]. In 1997–2002, 2002–2005, 2005–2008 and 2008–2011, the total area of land-use type’s transformation was respectively 18.762 km2, 6.728 km2, 13.709 km2 and 7.909 km2. From 1997 to 2002, the total area of land-use type transformation was the largest, which was directly related to the large-scale shanty town’s transformation in that period. From 2002 to 2005, the total area of land-use type conversion was the smallest, which was related to the large number of industrial buildings relocated and the existence of a large number of unconstructed areas relocated during this period. The overall change rate of land-use types was 91.18%. From 1997 to 2011, major urban renewal in Tiexi District was basically completed.
According to the Report On the Work of Tiexi Government in 2018 [59], since 2013, urban renewal became more focused on road extension and construction, improvement of landscape, demolition of scattered shanty towns and building up urban infrastructure. The renewal of Tiexi District would go on, while the pace of 3D expansion of urban space would gradually slow down. The number of height and capacity of the city was going to climb continuously, and with more non-uniform distribution of buildings showing that the city was becoming more crowded than ever. There were still some factories and low-rise residential buildings lower than 15 m in the northwest of the city, which would become a focus area for city’s renewing in the future. High-rise buildings would replace low-rise industrial and residential buildings. Meanwhile, the skyline in the north of the city would change dramatically. The overall shape of the city would remain similar to the weak pyramid for quite a long time.

5.5. Urban Expansion and City Skyline

The city skyline reflected the characteristics of urban spatial dimension, and affected the city’s beauty at the same time [60]. The full rhythm of urban skyline could give people a unique urban image and visual enjoyment of beauty. At the same time, a multi-angle urban skyline could comprehensively indicate the development and the form of the city skyline more. The city’s skyline could be recognized easily and it was worthwhile to protect it [61].
During the research period, the three-dimensional expansion of the city contributed to the skyline smoother, losing its aesthetic curve line gradually. In the future urban renewal, real estate development and construction should not only pursue the buildings height and floor area ratio, but also take overall shape of the building groups into consideration, otherwise the city’s wonderful skyline would disappear gradually.

5.6. Urban Expansion and High-Rise Building Height and Floor Area

According to the relationship map of high-rise building height and floor area of Tiexi District, Shenyang, it can be concluded that Tiexi District’s overall morphology is similar to the weak pyramid type. There is a big gap from the dome-shaped urban form. The downtown area of Nanjing, China, has developed into a balanced pyramid stage, even in the transition to the dome stage [34]. The comparison suggested that the relatively small site area of high-rise buildings (above 40 m) in Tiexi District was the major reason (Figure 7). It showed that the amount of high-rise buildings’ floor area in Tiexi District was increasing, and there was also an increase in vertical expansion.

5.7. Evaluation of Urban Renewal

Through the renewal of China’s old industrial areas, their 3D urban space had undergone rapid development and expansion. The urban renewal of Tiexi had increased the number of high-rise buildings, completely changed the city’s appearance, and brought about rapid economic development. The per capita disposable income of urban residents in 2018 was 3.99 times that of 2002. The population increased from 765,000 in 2002 to 909,000 in 2018. Car ownership has increased dramatically. In 2018, a quarter of people own a car averagely, the number of which was more than twice of that in 2012 [62]. SCD increased from 1.86 in 1997 to 3.38 in 2011. However, from 2002 to 2018, the number of primary and secondary schools increased by only 9, and the number of hospitals increased by only 7 [63]. These tended to result in a variety of problems. These issues can include traffic congestion, auto pollution, higher pressure on education and health care systems, ecological damage, lower quality of life, and a decreased sense of belonging as a result of the loss of a livable urban scale. Only by properly addressing the problems mentioned above can the city accomplish its sustainable development goal.
The three-dimensional expansion of a city is limited by many factors. Vertical extension should have a limit, not the higher the better. Urban renewal should take social, economic, ecological and other benefits into account. Some scholars believed that the urban renewal and transformation of old industrial zones was in line with the goal of urban sustainable development, but the sustainability and scientific nature of the implementation of the project need to be further demonstrated [63]. Therefore, the scientific and systematic evaluation of old industrial areas after its renewal was particularly important. At present, there is relatively little research on urban renewal evaluation in old industrial areas. Only a few studies have assessed the performance of urban renewal in old industrial areas from one aspect, such as the evaluation of the effect of renewal on economic recovery from the perspective of economics, and the social benefits of social deprivation from the perspective of sociology [64,65]. Scientific and systematic evaluation can provide guidance for the adjustment of urban renewal and make urban renewal reach an optimal level.

5.8. Sustainability and Urban Renewal

Society, economy and environment are three pillars of sustainable development. Urban renewal aims at solving a series of urban problems, including urban function deterioration, social exclusion in urban areas, and environmental pollution. Therefore, in order to promote the sustainability of cities, urban renewal has become common. The results suggested that it could promote the restoration of dilapidated buildings, increased the number of existing buildings, and promoted the land efficient utilization [66,67]. Besides, it improved value of the land and the quality of the environment [68]. Then, it stopped a city’s decline, and helped in the achievement of social economic goals [69]. The method enhanced network of the society, improved the quality of the environment, and united the vulnerable groups to resolve the adverse impact towards their living environment [70]. In these respects, urban renewal can significantly contribute to sustainable urban development if it follows a sustainable path. However, most urban renewal policies tended to focus on economic regeneration rather than environmental or social regeneration [71]. In conclusion, although the relationship between sustainability and urban renewal is complex, it does offer an orientation for urban’s sustainable developing in the future [72]. After 10 years of urban renewal, the urban environment of Tiexi has undergone tremendous changes and achieved rapid economic and population growth. It has won the awards of “Sixty landmarks of New China”, “United Nations Global Livable City Demonstration Award” and “China Habitat Environment Model Award” [59]. The renewal of Tiexi achieved a phased success. However, there are still many problems in the sustainable development of Tiexi District. As the land for industrial use in old urban areas was replaced with residential and commercial use, a large number of people were attracted to settle there. The population increased from 765,000 in 2002 to 909,000 in 2018. The per capita land resources are becoming less. The per capita area of construction land in Tiexi decreased from 51.4 square meters per person in 2002 to 43.26 square meters per person in 2018. This makes the pressure on supporting infrastructure heavy, which has affected the livability of the city to a certain extent. Although tertiary industry, which should become the pillar of the economy after “de-industrialization”, has grown steadily, its foundation is weak and the speed of economic development has been affected to a certain extent. The proportion of Tiexi’s tertiary industry increased from 37.7% in 2002 to 76.9% in 2015. However, the development level of the tertiary industrial structure is low, which shows that the proportion of traditional services is high, that of emerging services is low, that of labor-intensive and capital-intensive services is high, and that of technology-based and knowledge-based services is low. The total proportion of wholesale, retail and accommodation catering industries reached 51%, while the proportion of producer services (transportation, information services, finance, business, scientific research services, etc.) in the tertiary industry was only 21% [73]. Population aging is relatively serious. The level of population aging in Tiexi (calculated by population over 60 years old) reached 25.2% in 2018 [63]. In the future, under the guidance of national policies, Tiexi needs to change the mode of economic growth, enhance innovation ability, emphasize refine development, and guide the young employment population to “live in Tiexi” in order to achieve long-term sustainable development of Tiexi District.

6. Conclusions

This paper introduced the characteristics of the 3D expansion of Tiexi, Shenyang, China, and demonstrated the effectiveness and quantification of the methods for evaluating city’s spatial morphology based on a geographic information system (GIS), remote-sensing images with high resolution, and the Barista application. The landscape index, the spatiotemporal distribution of changes in building renewal modes and variations in the city skyline as well as the relationship between the number and size of high-rise buildings were used to quantify the 3D urban expansion. Among them, the method of extracting the skyline with high speed and accuracy was creatively applied in urban 3D expansion. The methods proposed in this paper are expected to become a foundation for a wide range of 3D urban expansion studies.
The results showed that from 1997 to 2011, Tiexi District expanded vertically and increased its urban capacity. The distribution of urban architecture was uneven and the three-dimensional space became increasingly congested. Renewal took place mainly through transformation, supplemented by newly built areas. Spatial distribution of changes in land patch types was related to regional transportation infrastructure, land-use types and distance from the urban center. During this period, there was a gradual increase in skyline’s height, and the skyline in the east–west direction shifted from a “peak-valley” pattern to a more even pattern. For the skyline, the original peak expanded slowly at first but then rapidly from the middle of the skyline to the south, while the north area of the skyline changed relatively slowly. The overall shape of the city was shown to be like the weak pyramid, whose top angle was gradually becoming larger.
By studying 3D expansion of urban space in old industrial areas, the basic rules underlying the processes of urban renewal can be understood and a theoretical underpinning for urban planning and renewal can be provided. The appropriate distribution of space as well as optimization of the natural environment in China’s old industrial areas can also be identified. Further post-renewal 3D space expansion research on different functional areas should be conducted to better grasp the different patterns of the 3D urban space distribution that occur during urban renewal.
Renewal of old industrial areas facilitates the horizontal and vertical expansion of the city. Vertical expansion means not only upward development of high-rise buildings, but also development underground, with a large number of newly built underground construction and transportation projects. The current study was restricted to studying changes in urban space aboveground only. However, underground development is also an important aspect of 3D urban space expansion, and should be included in future research on urban expansion and landscape variations.

Author Contributions

Y.X. conceived and designed the research, and did most of the analysis; Y.H. and Z.X. contributed extensively to data processing and preparation; M.L. and C.L. have given many suggestions for improving and modifying this article.

Funding

This research was funded by the Key Project of the National Natural Science Foundation of China, grant number 41730647, the China National R&D Program, grant number 2017YFC0505704 and National Natural Science Foundation of China, grant number 41671185 and 41671184.

Conflicts of Interest

The authors declare no conflict of interest.

References

  1. Marris, P. The social implications of urban redevelopment. J. Am. Inst. Plan. 1962, 28, 180–186. [Google Scholar] [CrossRef]
  2. Metzger, J.T. Rebuilding harlem: Public housing and urban renewal, 1920–1960. Plan. Perspect. 1994, 9, 255–296. [Google Scholar] [CrossRef]
  3. Robert, S. The International Building Exhibition (IBA) Emscher Park, Germany: A Model for Sustainable Restructuring? Eur. Plan. Stud. 2002, 10, 77–97. [Google Scholar] [CrossRef]
  4. Yu, B.; Liu, H.; Wu, J.; Hu, Y.; Zhang, L. Automated derivation of urban building density information using airborne LiDAR data and object-based method. Landsc. Urban Plan. 2010, 98, 210–219. [Google Scholar] [CrossRef]
  5. Zhang, P.; Hu, Y.; Xiong, Z. Extraction of three-dimensional architectural data from quickbird images. J. Indian Soc. Remote Sens. 2013, 42, 409–416. [Google Scholar] [CrossRef]
  6. Shi, L.; Shao, G.; Cui, S.; Li, X.; Lin, T.; Yin, K.; Zhao, J. Urban three-dimensional expansion and its driving forces—A case study of Shanghai, China. Chin. Geogr. Sci. 2009, 19, 291–298. [Google Scholar] [CrossRef]
  7. Bhatta, B. Analysis of urban growth pattern using remote sensing and GIS: A case study of Kolkata, India. Int. J. Remote Sens. 2009, 30, 4733–4746. [Google Scholar] [CrossRef]
  8. Jiao, L. Urban land density function: A new method to characterize urban expansion. Landsc. Urban Plan. 2015, 139, 26–39. [Google Scholar] [CrossRef]
  9. Li, X.; Zhou, W.; Ouyang, Z. Forty years of urban expansion in Beijing: What is the relative importance of physical, socioeconomic, and neighborhood factors? Appl. Geogr. 2013, 38, 1–10. [Google Scholar] [CrossRef] [Green Version]
  10. Li, J.; Deng, X.; Seto, K.C. Multi-level modeling of urban expansion and cultivated land conversion for urban hotspot counties in China. Landsc. Urban Plan. 2012, 108, 131–139. [Google Scholar] [CrossRef]
  11. Al-Shalabi, M.; Billa, L.; Pradhan, B.; Mansor, S.; Al-Sharif, A.A.A. Modelling urban growth evolution and land-use changes using GIS based cellular automata and SLEUTH models: The case of Sana’a metropolitan city, Yemen. Environ. Earth Sci. 2012, 70, 425–437. [Google Scholar] [CrossRef]
  12. Wang, H.; He, S.; Liu, X.; Dai, L.; Pan, P.; Hong, S.; Zhang, W. Simulating urban expansion using a cloud-based cellular automata model: A case study of Jiangxia, Wuhan, China. Landsc. Urban Plan. 2013, 110, 99–112. [Google Scholar] [CrossRef]
  13. Chow, T.E. An agent-integrated irregular automata model of urban land-use dynamics. Int. J. Geogr. Inf. Sci. 2014, 28, 2281–2303. [Google Scholar] [CrossRef]
  14. Rottensteiner, F.; Sohn, G.; Gerke, M.; Wegner, J.D.; Breitkopf, U.; Jung, J. Results of the ISPRS benchmark on urban object detection and 3D building reconstruction. ISPRS J. Photogramm. Remote Sens. 2014, 93, 256–271. [Google Scholar] [CrossRef]
  15. Jawak, S.D.; Panditrao, S.N.; Luis, A.J. Airborne lidar and high resolution satellite data for rapid 3d feature extraction. Remote Sens. Spat. Inf. Sci. 2014, XL-8, 573–580. [Google Scholar] [CrossRef]
  16. Sohn, G.; Dowman, I. Data fusion of high-resolution satellite imagery and LiDAR data for automatic building extraction. ISPRS J. Photogramm. Remote Sens. 2007, 62, 43–63. [Google Scholar] [CrossRef]
  17. Moallem, P. Automatic building extraction in dense urban areas through GeoEye multispectral imagery. Int. J. Remote Sens. 2014, 35, 5094–5119. [Google Scholar] [CrossRef]
  18. Zia, A.; Liang, J.; Zhou, J.; Gao, Y. 3D Reconstruction from Hyperspectral Images. In Proceedings of the 2015 IEEE Winter Conference on Applications of Computer Vision (WACV), Waikoloa, HI, USA, 5–9 January 2015; pp. 318–325. [Google Scholar] [CrossRef]
  19. Liu, C.; Wu, H.; Zhang, Y. Extraction of urban 3d features from lidar data fused with aerial images using an improved mean shift algorithm. Surv. Rev. 2011, 43, 402–414. [Google Scholar]
  20. Brunner, D.; Lemoine, G.; Bruzzone, L.; Greidanus, H. Building height retrieval from vhr sar imagery based on an iterative simulation and matching technique. IEEE Trans. Geosci. Remote Sens. 2010, 48, 1487–1504. [Google Scholar] [CrossRef]
  21. Feng, D.; Chen, W. Structure filling and matching for three-dimensional reconstruction of buildings from single high-resolution sar image. IEEE Geosci. Remote Sens. Lett. 2016, 13, 752–756. [Google Scholar] [CrossRef]
  22. Zhai, W.; Shen, H.; Huang, C.; Pei, W. Fusion of polarimetric and texture information for urban building extraction from fully polarimetric sar imagery. Remote Sens. Lett. 2016, 7, 31–40. [Google Scholar] [CrossRef]
  23. Chen, Z.; Xu, B.; Devereux, B. Urban landscape pattern analysis based on 3d landscape models. Appl. Geogr. 2014, 55, 82–91. [Google Scholar] [CrossRef]
  24. Zhang, P. Spatiotemporal features of the three-dimensional architectural landscape in Qingdao, China. PLoS ONE 2015, 10, e0137853. [Google Scholar] [CrossRef]
  25. Ali, S.S. Pixel- and Feature-Level Fusions of Aerial Imagery with LiDAR Data for Landscape Object Extraction; Flinders University: South Australia, Adelaide, Australia, 2011. [Google Scholar]
  26. Vozikis, G.; Fraser, C.; Jansa, J. Alternative Sensor Orientation Models for High Resolution Satellite Imagery; Publikationen der Deutschen Gesellschaft für Photogrammetrie, Fernerkundung und Geoinformation: Potsdam, Germany, 2003; Volume 12, pp. 179–186. [Google Scholar]
  27. Willneff, J.; Poon, J. (Eds.) Georeferencing from orthorectified and non-orthorectified high-resolution satellite imagery. In Proceedings of the 13th Australasian Remote Sensing and Photogrammetry Conference, Canberra, Australia, 20–24 November 2006. [Google Scholar]
  28. Fraser, C.S.; Rottensteiner, F.; Weser, T.; Willneff, J. Application of a generic sensor orientation model to spot 5, QuickBird and ALOS imagery. In Proceedings of the Asia Conference and Remote Sensing, Kuala Lumpur, Malaysia, 12–16 November 2007; pp. 1–7. [Google Scholar]
  29. Wang, J.W.; Jiang, Y.; Zheng, G.Q. Research on the three-dimensional information extraction of urban buildings from single qiuckbird remote sensing image. Appl. Mech. Mater. 2011, 90–93, 3298–3302. [Google Scholar] [CrossRef]
  30. Zhang, X.F.; Wang, Y.L.; Li, Z.G.; Li, W.F.; Ye, M.T. Preliminary theory of three-dimensional urban landscape ecology. Acta Ecol. Sin. 2007, 7, 2972–2982. (In Chinese) [Google Scholar]
  31. Zhang, P.F.; Hu, Y.-M. Variations of three-dimensional architecture landscape at different spatial scales. Chin. J. Ecol. 2013, 32, 1319–1325. [Google Scholar] [CrossRef]
  32. Chen, T.; Liu, M.; Hu, Y.M.; Chang, X.K.; Li, C.L.; Xu, Y.Y.; Shi, T. Differentiation characteristics of three-dimensional landscape pattern in Shenyang. Chin. J. Ecol. 2015, 34, 2621–2627. (In Chinese) [Google Scholar]
  33. Qin, J.; Fang, C.; Wang, Y.; Li, G.; Wang, S. Evaluation of three-dimensional urban expansion: A case study of Yangzhou City, Jiangsu Province, China. Chin. Geogr. Sci. 2015, 25, 224–236. [Google Scholar] [CrossRef]
  34. Qiao, W.; Liu, Y.; Wang, Y.; Liu, Y. Analysis on the characteristics of three-dimensional urban space expansion in Nanjing since 2000. Geogr. Res. 2015, 34, 666–676. [Google Scholar] [CrossRef]
  35. Yang, J.; Guo, A.; Xi, J.; Ge, Q.; Li, X. Spatial-temporal differentiation of three-dimensional urban landscape pattern: A case study of Zhongshan District in Dalian. Geogr. J. 2017, 4, 646–656. (In Chinese) [Google Scholar] [CrossRef]
  36. Taubenböck, H.; Wiesner, M.; Felbier, A.; Marconcini, M.; Esch, T.; Dech, S. New Dimensions of Urban Landscapes: The Spatio-Temporal Evolution from a Polynuclei Area to a Mega-Region Based on Remote Sensing Data. Appl. Geogr. 2014, 47, 137–153. [Google Scholar] [CrossRef]
  37. Frolking, S.; Milliman, T.; Seto, K.C.; Friedl, M.A. A Global Fingerprint of Macro-Scale Changes in Urban Structure from 1999 to 2009. Environ. Res. Lett. 2013, 8, 024004. [Google Scholar] [CrossRef]
  38. Semboloni, F. The growth of an urban cluster into a dynamic self-modifying spatial pattern. Environ. Plan. B Plan. Des. 2000, 27, 549–564. [Google Scholar] [CrossRef]
  39. Czamanski, D.; Benguigui, L.; Roth, R. Modeling cities in 3D: A cellular automaton approach. Environ. Plan. B Plan. Des. 2008, 35, 413–430. [Google Scholar] [CrossRef]
  40. Qin, J.; Fang, C.; Wang, Y. The Three-dimensional Urban Growth Simulating Based on Cellular Automata. J. Geo-Inf. Sci. 2013, 15, 662–671. [Google Scholar] [CrossRef]
  41. Lin, J.; Huang, B.; Chen, M.; Huang, Z. Modeling urban vertical growth using cellular automata—Guangzhou as a case study. Appl. Geogr. 2014, 53, 172–186. [Google Scholar] [CrossRef]
  42. Li, W.; Zhang, C.; Willig, M.R.; Dey, D.K.; Wang, G.; You, L. Bayesian Markov chain random field cosimulation for improving land cover classification accuracy. Math. Geosci. 2015, 47, 123–148. [Google Scholar] [CrossRef]
  43. Zhang, W.; Li, W.; Zhang, C.; Li, X. Incorporating spectral similarity into Markov chain geostatistical cosimulation for reducing smoothing effect in land cover post classification. IEEE J. Sel. Top. Appl. Earth Obs. Remote Sens. 2017, 10, 1082–1095. [Google Scholar] [CrossRef]
  44. Zhang, W.; Li, W.; Zhang, C.; Ouimet, W.B. Detecting horizontal and vertical urban growth from medium resolution imagery and its relationships with major socioeconomic factors. Int. J. Remote Sens. 2017, 38, 3704–3734. [Google Scholar] [CrossRef]
  45. Chen, B.; Bao, Z. The Role of Landscape Index in Landscape Planning. Planner 2004, 20, 112–114. (In Chinese) [Google Scholar] [CrossRef]
  46. Dong, F. “Move the East and Transform the West”: Mode selection of revitalizing old industrial bases in Tiexi, Shenyang. Land Resour. 2007, 5, 23–27. (In Chinese) [Google Scholar]
  47. Pan, X.Z.; Zhao, Q.G.; Chen, J.; Liang, Y.; Sun, B. Analyzing the variation of building density using high spatial resolution satellite images: The example of Shanghai city. Sensors 2008, 8, 2541–2550. [Google Scholar] [CrossRef]
  48. Yu, Z.; Wu, Z. Discussion of Multi-dimensional urban spatial growth. In Urban Planning in China, Urban and Rural Planning from the Perspective of Ecological Civilization, Proceedings of the Annual Conference of Urban Planning in China, Dalian, China, 1–5 December 2008; Dalian Press: Dalian, China, 2008. (In Chinese) [Google Scholar]
  49. Sun, Y.; Zhao, S.; Qu, W. Quantifying spatiotemporal patterns of urban expansion in three capital cities in northeast china over the past three decades using satellite data sets. Environ. Earth Sci. 2015, 73, 7221–7235. [Google Scholar] [CrossRef]
  50. Wang, M.L.; Bing, L.F.; Xi, F.M.; Wu, R.; Geng, Y. Spatiotemporal patterns and driving forces of land use change in industrial relocation area: A case study of old industrial area in Tiexi of Shenyang, Northeast China. Chin. J. Appl. Ecol. 2013, 24, 1969–1976. (In Chinese) [Google Scholar]
  51. Wu, D.W.; Zhang, X.L.; Mao, H.Y.; Wu, H. Socio-economic driving forces of land-use change in Fuzhou, the southeastern coastal area of China. In Proceedings of the IEEE International Workshop on Earth Observation and Remote Sensing Applications, Beijing, China, 30 June–2 July 2008. [Google Scholar]
  52. Report on the Work of Tiexi Government. Available online: https://wenku.baidu.com/view/e767909c988fcc22bcd126fff705cc1755275fea.html (accessed on 20 February 2019). (In Chinese).
  53. Yang, J. Transformation and renewal of old industrial cities. Res. Urban Dev. 2008, s1, 137–140. (In Chinese) [Google Scholar]
  54. Goch, S. Betterment without airs: Social, cultural, and political consequences of de-industrialization in the Ruhr. Int. Rev. Soc. Hist. 2002, 47, 224–232. [Google Scholar] [CrossRef]
  55. Salaske, C. Deindustrialisierung und Restrukturierung-Das Ruhrgebiet im Wandel (1957–2007); Universität zu Köln: Köln, Germany, 2007. [Google Scholar]
  56. Chen, T. Study on the Decline and Transition of German Ruhr Industrial Zone. Ph.D. Thesis, Jilin University, Jilin, China, 2009. (In Chinese). [Google Scholar]
  57. Zhang, P. Institutional and cultural factors of renovation of Tiexi industrial zone in Shenyang. Hum. Geogr. 2006, 21, 45–49. (In Chinese) [Google Scholar] [CrossRef]
  58. Li, X. Review and reflection on the development of Tiexi based on the theory of urban transition. J. Shenyang Norm. Univ. (Soc. Sci. Ed.) 2014, 38, 19–21. (In Chinese) [Google Scholar]
  59. Shenyang Statistical Information Network. Available online: http://www.sysinet.gov.cn (accessed on 16 September 2017). (In Chinese)
  60. Wang, X.; Wang, R.; Wang, M.Y. Research on the relation of city skyline and city: Taking Hong Kong as an example. Appl. Mech. Mater. 2014, 584–586, 330–334. [Google Scholar] [CrossRef]
  61. Yusoff, N.A.H.; Noor, A.M.; Ghazali, R. City skyline conservation: sustaining the premier image of Kuala Lumpur. Procedia Environ. Sci. 2014, 20, 583–592. [Google Scholar]
  62. Shenyang Statistical Bulletin of National Economic and Social Development 2017. Available online: https://www.sohu.com/a/236903716_100010372 (accessed on 20 February 2019). (In Chinese).
  63. Laprise, M.; Lufkin, S.; Rey, E. An indicator system for the assessment of sustainability integrated into the project dynamics of regeneration of disused urban areas. Build. Environ. 2015, 86, 29–38. [Google Scholar] [CrossRef]
  64. Wrigley, N.; Guy, C.; Lowe, M. Urban regeneration, social inclusion and large store development: The seacroft development in context. Urban Stud. 2002, 39, 2101–2114. [Google Scholar] [CrossRef]
  65. Seo, J.K. Re-urbanisation in regenerated areas of Manchester and Glasgow: new residents and the problems of sustainability. Cities 2002, 19, 113–121. [Google Scholar] [CrossRef]
  66. Adams, D.; Hastings, E.M. Urban renewal in Hong Kong: Transition from development corporation to renewal authority. Land Use Policy 2001, 18, 245–258. [Google Scholar] [CrossRef]
  67. Ho, D.C.W.; Yau, Y.; Poon, S.W.; Liusman, E. Achieving sustainable urban renewal in Hong Kong: Strategy for dilapidation assessment of high rises. J. Urban Plan. Dev.-Asce 2012, 138, 153–165. [Google Scholar] [CrossRef]
  68. Lee, G.K.L.; Chan, E.H.W. The analytic hierarchy process (AHP) approach for assessment of urban renewal proposals. Soc. Indic. Res. 2008, 89, 155–168. [Google Scholar] [CrossRef]
  69. Chan, E.H.W.; Yung, E.H.K. Is the development control legal framework conducive to a sustainable dense urban development in Hong Kong? Habitat Int. 2004, 28, 409–426. [Google Scholar] [CrossRef]
  70. Krieger, J.; Higgins, D.L. Housing and health: Time again for public health action. J. Inf. 2002, 92. [Google Scholar] [CrossRef]
  71. Couch, C.; Dennemann, A. Urban regeneration and sustainable development in Britain-the example of the Liverpool Ropewalks Partnership. Cities 2000, 17, 137–147. [Google Scholar] [CrossRef]
  72. Zheng, H.W.; Shen, G.Q.; Wang, H. A review of recent studies on sustainable urban renewal. Habitat Int. 2014, 41, 272–279. [Google Scholar] [CrossRef] [Green Version]
  73. Yin, J.; Li, X.; Li, Y. Ten years’ development review and reflection of Tiexi district, Shenyang. Shanghai Urban Plan. 2015, 5, 110–115. (In Chinese) [Google Scholar]
Figure 1. Study area in Tiexi District, Shenyang.
Sustainability 11 01860 g001
Figure 2. Urban landscape of Tiexi in 1997 and 2014.
Sustainability 11 01860 g002
Figure 3. Characteristic 3D urban growth forms over time.
Sustainability 11 01860 g003
Figure 4. Spatial distribution of changes in land patch type.
Sustainability 11 01860 g004
Figure 5. Skylines of Tiexi District from 1997 to 2011.
Sustainability 11 01860 g005
Figure 6. Relationship of high-rise building height and floor area in Tiexi District from 1997 to 2011.
Sustainability 11 01860 g006
Figure 7. Comparison of relationship between urban construction area and building height in Tiexi in 2011 and Nanjing in 2012.
Sustainability 11 01860 g007
Table 1. Indices of architecture landscape and their meaning.
IndicatorExpressionDescription
Average building height (AH) AH = j = 1 n H ij n i AH is the average height of all buildings in the study area. Reflects the average building height and urban expansion in the vertical direction. Hij is the height of jth building of class i; ni is the number of class i buildings.
Floor area ratio (FAR) FAR = ( H / C * F ) A FAR is the ratio of overall floorage to land area in a certain area. Reflects urban expansion in the vertical direction. For the same research object, the higher the FAR number is, the taller buildings will be. H is the building height; F is the building floor area; C is a constant (C = 3.0 m), which corresponds to the average height of one story; and A is the total land area.
Average volume (AV) AV = 1 n i = 1 n V i AV is the average of all building volumes within the study area. Reflects the average volume of urban buildings and the space they occupy in the vertical direction. The higher AV number is, the larger average size of urban buildings and space occupied by the city’s vertical direction will be. Vi is the volume of the ith building; n is the number of buildings.
Building evenness index (BEI) BEI = [ i = 1 n ( V i AV ) ] 2 / A BEI is the extraction of a root of ratio of standard deviation of building volume to urban area. Reflects the evenness of buildings in a three-dimensional space. Generally, the bigger the BEI value is, the more uneven the distribution of buildings will be. Vi is the volume of the ith building; AV is the average volume of buildings; A is the total land area; and n is the number of buildings.
Space congestion degree (SCD) SCD = i = 1 n V i max { H i } × A × 100 % SCD refers to the sum of all the buildings’ volumes as percentage of urban volume. Reflects the congestion of buildings in a three-dimensional space. The larger the SCD value, the more crowded the urban space. Vi is the volume of the ith building; max{Hi} is the maximum building height; n is the number of buildings; and A is the total land area.
Table 2. Urban 3D expansion index statistics.
YearAH (m)FARAV (m3)BEISCD (%)
19979.740.8710,695.81347.171.86
200211.801.2213,468.23383.112.60
200512.651.1412,747.07366.062.42
200816.781.4116,387.26765.113.01
201119.341.5817,557.92857.243.38
Note: AH, average building height; FAR, floor area ratio; AV, average volume; BEI, building evenness index; SCD, space congestion degree.
Table 3. Statistics of the average distance between different types of buildings and urban center in Tiexi.
YearMulti-Story BuildingMid-Rise BuildingHigh-Rise BuildingSuper High-Rise Building
East-West North-South East-West North-South East-West North-South East-West North-South
19971297.261575.781113.601542.701100.011546.59
20021337.521585.761255.891574.181684.702389.41
20051366.051366.051307.631791.001383.132303.07
20081382.751621.431426.511700.341264.161914.411244.132001.63
20111409.011636.131424.401671.861293.261797.121593.772071.32
Note: The unit of distance is meters. There was no super high-rise building in Tiexi before 2008.

