The Social Costs of Marine Litter along the East China Sea: Evidence from Ten Coastal Scenic Spots of Zhejiang Province, China

1
School of Economics, Zhejiang University, Hangzhou 310027, China
2
School of Business, Ningbo University, Ningbo 315211, China
3
Department of Economics, University of Uppsala, 751 20 Uppsala, Sweden
*
Author to whom correspondence should be addressed.
Sustainability 2019, 11(6), 1807; https://doi.org/10.3390/su11061807
Submission received: 28 February 2019
/
Revised: 17 March 2019
/
Accepted: 18 March 2019
/
Published: 25 March 2019
Abstract
:Marine litter poses numerous threats to the global environment. To estimate the social costs of marine litter in China, two stated preference methods, namely the contingent valuation model (CVM) and the choice experiment model (CEM), were used in this research. This paper conducted surveys at ten different beaches along the East China Sea in Zhejiang province in October 2017. The results indicate that approximately 74.1% of the interviewees are willing to volunteer to participate in clean-up programmes and are willing to spend 1.5 days per month on average in their daily lives, which equates to a potential loss of income of USD 1.08 per day. The willingness to pay for the removal of the main types of litter ranges from USD 0.12–0.20 per visitor across the four sample cities, which is mainly determined by the degree of the removal, the crowdedness of the beach and the visitor’s perception. The social costs are USD 1.08–1.40 per visitor when the contingent valuation method is applied and USD 1.00–1.07 per visitor when the choice experiment method is adopted, which accounts for 8–14% of the beach entrance fee. The analysis of the social costs of marine litter yielded some useful implications regarding future coastal management policy, including extra entrance fee, the quality-oriented environmental strategy and more incentives to volunteers.
1. Introduction
Coastal tourism contributes increasingly to the gross domestic product (GDP), and its proportion of the GDP ranges from approximately 2% for countries with small tourism industries to over 10% for countries such as China [1,2]. A large proportion of the GDP is observed in most of the south-eastern coastal provinces in China [3]. However, coastal tourism has generated huge impacts on the marine environment, especially with riverine and marine litter [4,5,6]. It has been argued that marine litter has posed significant costs on society, particularly with respect to coastal tourism and recreation, and the social costs are substantial [7,8]. The costs could arise from the limitations on beach enjoyment and the decline of the coastal tourism demand [9,10].
The social costs estimation of marine litter could be logically nested in the Millennium Ecosystem Assessment’s research, which means that ‘‘ecosystem services are the benefits people obtain from ecosystems’’ [11]. It is widely acknowledged that the most important ecosystem services provided by the coastal areas are the recreational services and amenities. [12,13] The accumulation of marine litter will have significant negative impacts on the supply of recreational services. The significant impacts of the direct costs and the loss of income are also focused on by marine eco-economists [14]. The willingness to pay (WTP) is a great indicator of the governing costs of environmental pollutants [15,16,17]. The WTP, derived from the contingent valuation model (CVM) and the choice experiment model (CEM), is a well-accepted indicator of the social costs of marine litter, and the clean-up costs (namely, the direct costs) are also part of the social costs. Both of these two stated preference methods are survey-based techniques for eliciting preferences regarding a wide range of non-market environmental changes, such as the litter cleaning.
The United Nations Environment Programme (UNEP) has highlighted the importance and need for establishing national marine litter monitoring programmes and clean-up initiatives [18]. UNEP’s report and other related studies had defined the social costs of marine litter, but few studies had evaluated them [19]. The limited published work on the evaluation of marine litter includes Smith (1997), who took surveys in New Jersey and North Carolina; Loomis & Santiago (2013), who studied northeast Puerto Rico as an example; Brouwer et al. (2017), who collected data from Greece, Bulgaria and the Netherlands; some important studies done in the United Kingdom, Belgium and Netherlands. More specifically, in New Jersey and North Carolina, the estimated median WTP to clean up marine litter is between USD 21.38 and USD 72.18 per person per year in terms of an annual income tax based on a one-time payment [20]. In Puerto Rico, the mean WTP for eliminating trash is USD 98–103 as an additional trip cost, which was calculated using 427 visitors’ data for five beaches [21]. Based on 200 visitors to Greece, 301 visitors to Bulgaria and 149 visitors to the Netherlands, the WTPs for litter removal vary a lot across the countries. The average WTP for the removal of plastic is USD 0.76 per year in Greece, USD 9.32 in Bulgaria and USD 2.32 in the Netherlands. The average WTP for the removal of cigarette butts is USD 0.47 per year in Greece, USD 7.98 in Bulgaria, USD 2.90 in the Netherlands [22]. In Den Haag and the UK, the WTPs for removal are USD 3.50 and USD 1.13 per year, respectively [23]. Meanwhile, several statistic studies also show that, in the United Kingdom, the evaluated cost of marine litter with respect to coastal tourism is between USD 8.67 to USD 26.00 million [24]; in Belgium and the Netherlands, the total costs of beach litter removal was USD 16.20 million per year [23]. To the best of our knowledge, only one work on the Chinese WTPs for marine litter and oil pollution reductions was found in Tianjing, and the estimated WTP was USD 3.54 annually for a 10% reduction [25]. Table 1 provides the detailed information of the individual assessments. Although the comparative studies are rare, this paper could also find some transregional heterogeneity in these estimated works, including the preferred payment styles and the perceived value of beach cleaning. The cumulative quantity of marine litter worldwide is still predicted to increase by an order of magnitude over the next decade [26]. LITTERBASE also shows that almost all of the world’s oceans contain litter [27]. In the East China Sea, marine litter has been a large local and global environmental problem in the past and will continue to be in coming decades, mainly due to the increasing anthropogenic activities and population growth, and beach litter has generated serious social and environmental problems [28,29]. Zhejiang province, which is located along the East China Sea, has the most islands and the longest coastlines. To the best of our knowledge, this is the first study estimating the social costs of marine litter in Zhejiang in the East China Sea.
The main objective of this study is to estimate the social costs of beach litter in ten coastal scenic spots along the East China Sea in Zhejiang province. A total of 805 beach visitors were interviewed personally in October 2017. The estimation mainly concerns the following issues: (1) the public perception of marine litter at the sample beaches, (2) the WTP to reduce the litter and its potential determinants, and (3) the robust social costs from the two stated preference valuation methods. The remainder is organized as follows.
2. Survey Design and Methodology
The questionnaire consisted of five parts. The ethics committee of our university is involved when questionnaires are made and people are interviewed. The respondents were informed that they were participating in the scientific research at the beginning of the interview. The questionnaire was set with no private questions, e.g., no name, no identification card number, no home address, etc. Moreover, all the survey respondents said that they were quite willing to support this research and hoped to give their own contribution to the governance policies on the marine litter in the near future in China. Then, the first part concentrated on the respondents’ tourism information. This part included some relatively easy warm-up questions, such as the number of times that they have visited the beaches, their detailed tourism expenses, their origins, their transportation style, etc. Visitors’ socio-demographic characteristics were also included in the first part, such as their age, place of residence, education and personal income.
The second part focused on the specific condition and visitors’ perception of the beach litter. This was followed by a series of questions related to the amount and types of litter found on the beach and its impacts on the visitor’s beach experience. Then, the visitors were asked about their willingness to volunteer in beach clean-up programmes. They were first asked if they are willing to participate in such a voluntary clean-up programme and then how many days per month they would like to spend doing this.
The third part was mainly about the perceived situations in the beach areas. For instance, respondents were asked about their perceptions of the number of sanitary workers, the price of plastic bags and the congestion on the beach. The fourth part introduced the different types of WTP for the combinations of the environmental improvements. The mean WTP varies across the alternative elicitation techniques. In this research, the payment card approach is applied in the questionnaire design because here the questions are easy to understand and various interval and numerical WTPs could be obtained for further research. The CVM and CEM are then carried out for the estimation of the WTP under the various removal conditions of marine litter. For the CVM, the core question was the visitors’ maximum WTP for the removal of the litter. Using different pictures of three main types of litter, this paper set up the payment questions as three types. The payment attribute was split into five levels: USD 0–0.29, USD 0.30–0.59, USD 0.60–0.89, USD 0.90–1.18, and USD 1.18 or above. The exchange rate is set at 6.75 (CNY/USD). In the CEM, visitors chose the environmental conditions combined with the associated entrance fee they would like to pay. Alternative situations were created by combining the attributes presented in Table 2. In order to make the visitors understand the environmental condition better, several significantly different kinds of pictures are used to illustrate the differences of sample beach conditions. In our face to face interview, the interviewers also explained the attribute levels in the hypothetical scenarios to the respondents for their consideration.
The combination yielded 480 possible cases. Because visitors could not be shown all possible choice situations, the number of combinations was reduced to 65 choice tasks based on a D-efficient fractional factorial design and practical pilot questionnaire. Each combination had some improved situations that were randomly chosen. The levels of the additional entrance fee were fixed at USD 0, USD 0.44, USD 0.89, USD 1.33 and USD 1.78. The basic bid was set to 1% of the travel expenses per capita and confirmed by the pilot experiments. Figure 1 shows one base situation and two improved situations. The final part was completed by the investigator and is related to the wave height, the water quality, the weather condition and the air visibility.
Both the CVM and CEM were chosen to explain the economic responses to the hypothetical scenarios. The CVM is a widely used non-market valuation method and mainly focuses on the WTP [30,31,32,33]. The CEM was first introduced in environmental valuations in the 1990s and became increasingly more popular [34,35]. Because of the censored nature of the dependent variable that can only be zero or positive, Tobit regression models are used to analyse the WTP in the CVM model. Considering the potential influencing factors of the WTP, this paper examined the socio-demographic and perceived potential factors, such as the number of times they visit the beach, the origin, sex, age, education and personal income after tax of the visitors, and the environmental attribute variables, such as the amount of residual litter, the litter source, and the number of visitors. The equations are as follows:
where i(1, 2, …, n) indicates the interviewed respondent, is the mean WTP of cleaning up the litter j, and refers to the bid of respondent i for removing the litter type j.
The can be influenced by environmental and social-demographic variables in the matrix X, and e is an independently and normally distributed error term. Here, the multivariate Tobit regression model was used to explain the variation in the number of days that visitors are willing to spend [36,37].
From the results, very few respondents chose the maximum payment at more than USD 1.33; therefore, setting the extreme payment at USD 1.33 for the right censored was reasonable. The Probit model was also used to explain whether the visitors are willing to participate in the clean-up programmes.
Regarding the CEM, it explains the choices in a utility maximizing framework [38,39,40]. If an individual’s utility function is assumed to be dependent on the vector V of the environmental attributes Z and socio-demographic characteristics S, then the utility function can be partitioned into the deterministic/observable components and the random/unobservable components. That is,
where indicates the total utility that individual i derived from the alternative choice n, indicates the observable utility that the individual i derived from the alternative choice n, indicates the unobservable utility that the individual i derived from the alternative choice n, indicates the alternative specific constant of the individual i, indicates the particular environmental attribute l in the choice n, indicates the payment attribute r in the choice n, and indicates the socio-demographic attribute t of the individual i. , and are the respective coefficient vectors. The marginal value of an attribute change could be given as the partial-worth or marginal WTP, which is calculated as follows:
where . refers to the parameter of the environmental attribute or social-demographic attribute (one kind of element in vector ), while refers to the parameter of the payment attribute in the equation (one kind of element in vector ).
3. Case Study Location and Data Collection
All the sampled beaches are located along the East China Sea. AAAAA is the best rating level for Chinese scenic spots according to the official rule defined by the National Tourism Administration of China. AAAA is the second-best rating level. As of September 2017, there were 249 AAAAA scenic spots in China. There are four coastal cities in this area with ten national AAAA or AAAAA level scenic spots. The cities are Zhoushan, Ningbo, Taizhou and Wenzhou. Figure 2 shows the five beaches selected in Zhoushan, one in Ningbo, two in Taizhou and two in Wenzhou. The numbers distributed among these spots are weighted by the quantity of annual tourists at these spots. More specifically, 74 respondents were interviewed in Ten Sands, 82 respondents in Daqing Mountain, 164 respondents in Mount Putuo, 82 respondents in Nanji Islands, 95 respondents in Dongtou Islands, 37 respondents in Taohua Island, 48 respondents in Tawan Golden Sand, 50 respondents in Dalu Island, 123 respondents in Shepan Island and 50 respondents in China Fishing Village. There were 805 total visitors in the sample.
Note: 1.Ten Sands, 2.Daqing Mountain, 3.Mount Putuo, 4.Nanji Islands, 5.Dongtou Islands, 6.Taohua Island, 7.Tawan Golden Sand, 8.Dalu Island, 9.Shepan Island, and 10.China Fishing Village. 1. and 3. are AAAAA scenic spots while the others are AAAA scenic spots.
The ten scenic spots all charge entrance fees, regardless of whether the visitors are local or from out of town. Thus, this study believes that a one-time additional entrance fee is the correct payment choice to estimate the WTP, instead of taxation. Moreover, although the survey areas are all in Zhejiang province, the respondents are from hundreds of cities nationwide so that the sample is representative of different social-demographic attributes. In addition, the interviews were conducted on a random ‘next to pass’ basis, due to which a similar amount of men and women and an equal representation of different age groups were interviewed.
4. Results
4.1. Beach Visitors’ Socio-Demographic, Educational, and Traveling Characteristics
This study dropped 11 observations due to the key variable WTP missing, which resulted in 794 remaining observations. The characteristics of the beach visitors are summarized in Table 3. Most of the visitors were not first-time visitors at the scenic beach, and the average visits of beach areas were at 3.2 times. They spent nearly 3 days for their whole trip and 4 hours on the interviewed beach. A total of 74.1% visitors were willing to participate in the environmental organization to protect the marine environment. With respect to the respondents’ socio-demographic characteristics, compared with the national statistics in 2017, slightly more female visitors were interviewed, accounting for 58.1% of the total. Significant differences were further found in terms of respondents’ ages and household incomes. The respondents were young, and the average age was 33.4 years. The personal incomes after taxes were relatively high, at an average of USD 874.0 per month. A substantial share of the visitors had a university degree, and almost two-thirds of the visitors are living in urban areas, which is in line with the urbanization rate assessed by the National Bureau of Statistics of China (57.35% in 2016 in China).
4.2. Visitors’ Perception of Beach Littering Condition
Figure 3 shows the average perception of beach litter in the four cities. A minority of the visitors (4%–17%) believed that the beaches were not clean at all. Over half of the visitors (50%–62%) considered that the beach was somewhat clean and more than a quarter of the visitors (27%–38%) considered that the beach was clean. Among the four levels of perceived cleanliness, somewhat clean accounts for the most in all of the cities. This indicates that the conditions regarding beach litter are not very good, as a result of which the social costs estimation is necessary in these areas.
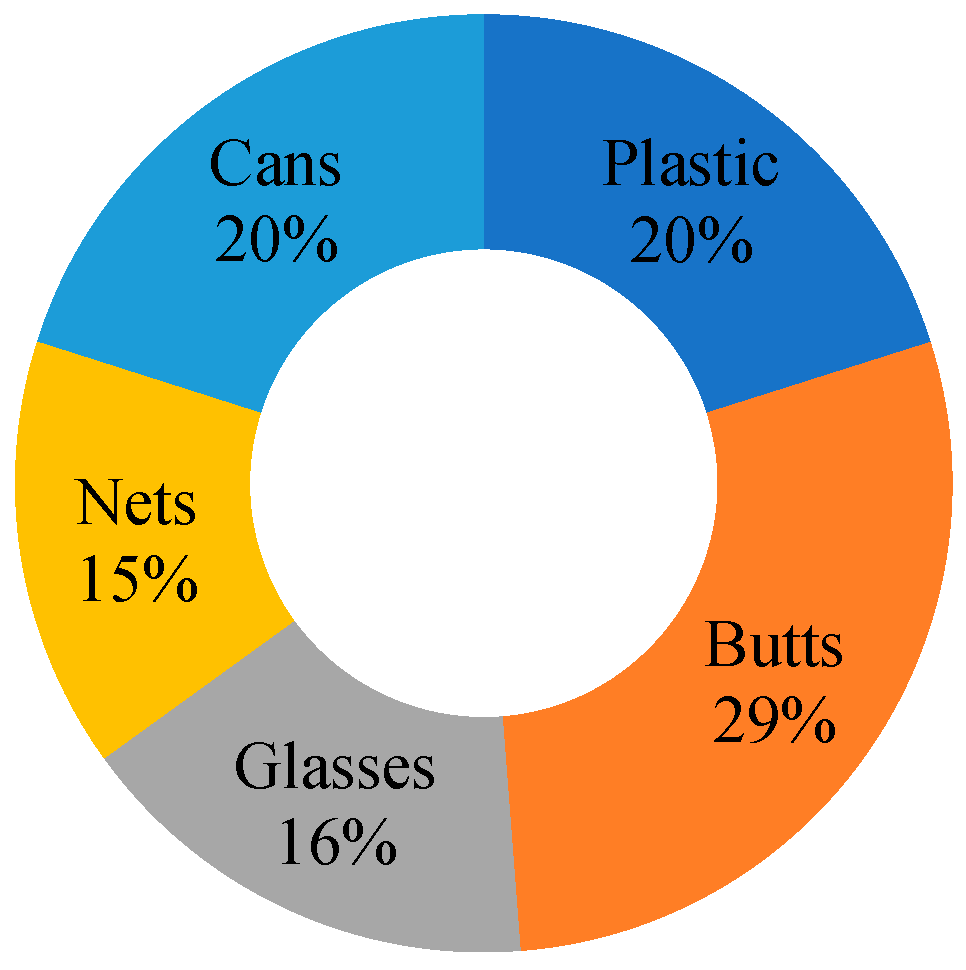
Figure 4 shows the five main litter types. They were butts, plastic, cans, glass and nets, the former three types being chosen for the choice experiment in Figure 1. In terms of the frequency of the litter, cigarette butts were mentioned the most and accounted for 60.83%, followed by plastic and cans that were rated at 42.82% and 42.70%, respectively. Glass and nets were approximately 34.63% and 31.61%, respectively. By assessing the frequencies using four levels, including Hardly Ever, Sometimes, Often and Always, the former three litter types’ frequencies are provided in Figure 5. The results are coherent with the conditions performed in Figure 3; the cleanliness in these sample beaches is not bad.
Figure 6 shows the perceived annoyance with beach litter. It is very interesting that “Somewhat Annoying” rates the highest, which is followed by “Not annoying at all”. Only a few visitors are very annoyed with the beach litter, accounting for 0.56%–2.00%. It means that Chinese visitors may often live in a worse surrounding with more litter or that the scenic beach is so clean that they greatly enjoy their coastal trip. Therefore, the relatively low WTP or to work might be reasonable and acceptable.
4.3. Visitors’ Willingness to Participate in the Beach Clean-up Programme
Approximately 74.1% of the interviewees would volunteer to participate in the beach clean-up programmes. If they are willing to participate in the environmental protection activities, such as the beach clean-up programs, they are willing to spend 1.5 days per month on average in their daily lives. In addition, in order to probe the determinants of the willingness to participate, both the binary Probit and the Tobit models are introduced. The regression results are shown in Table 4. The binary Probit model gives the determinants of whether they were willing to participate in the programmes while the Tobit model explains the determinants of the number of days they would spend.
Three robust variables are found in Table 4 considering both the willingness to participate and the number of days they were willing to spend working with the beach clean-up programmes. The three significant and robust variables are beach litter annoyance, personal income and age. Beach litter annoyance has a significantly positive impact on the willingness to participate and the number of days, which means that the visitors that are easily irritated by the beach litter are more likely to be willing to participate in the programmes. However, the visitors with a higher personal income or who are older are likely to be less willing to participate in those clean-up programme. Generally, older visitors are often richer and thus they are more willing and able to pay for the clean-up programmes rather than participate.
4.4. WTP for the Removal of Marine Litter Based on the CVM
The results are presented in Table 5. Taking the heterogeneity of the four city samples into consideration, the respondents’ WTPs for removing the marine litter varied from USD 0.51 to USD 0.71. Here, this study used different pictures to represent the marine litter, including plastic, cans and butts. The respondents’ WTPs for the removal of the different types of marine litter is in a relatively consistent interval [0.51,0.71], which means that the WTPs for removing marine litter in the East China Sea is robust. In addition, the overcrowding is generally considered an important disturbance factor by the beach visitors, and crowding is always associated with more litter being generated [5]. Therefore, this study counts the congestion costs as part of the social costs. The congestion costs are defined as the WTP for litter removal under different amounts of congestion. By considering the payment for the removal of the three most common types of litter and the average congestion costs, the total additional entrance payment for the social costs of marine litter is priced at approximately USD 1.08–USD 1.40 in this paper, which includes the average congestion costs of approximately USD 0.57–USD 0.69. The average ticket price is USD 10.40, as reported by the visitors themselves. Their WTP accounts for approximately 6% of the ticket price and approximately 12% (= (1.08 + 1.4)/2/10.40) if the congestion costs are included, which are twice the net WTP.
The latent factors of the WTP for the removal of the litter in the CVM are presented in Table 6. This paper was able to find more robust and significant variables. They are the amount of residual litter, the number of visitors, the income and beach litter annoyance. Compared to those relating to the willingness to participate, income and beach litter annoyance were the two common variables significantly influencing both the willingness to pay and the willingness to work. Beach litter annoyance had positive impacts on both the willingness to pay and work. However, the visitors with higher incomes were less likely to participate in the clean-up programmes but were more likely to pay for more. They would like to pay an extra USD 0.02 to remove the plastic, USD 0.03 for the can removal, USD 0.03 for the butt removal, as their income increases by USD 148.11 per month. The marginal WTP with respect to income was approximately 1.42%–1.83%. The visitor congestion and the amount of litter both have positive impacts on the WTP. It indicates that more congestion means a worse tourism experience, following which a larger payment might be given by the visitors to improve the beach environment.
Age and membership in an environmental organization are the two relatively significant variables determining the WTP. Older visitors still preferred to pay more for the clean-up programmes, while membership in an environmental organization negatively impacted the WTP. In addition, the origin of the litter and the number of sanitary workers had little impact on the WTP. This indicates that the visitor does not care about the origin of the litter and the efforts made by both the visitor and the manager of the beach.
4.5. WTP for the Removal of Marine Litter Based on the CEM
A multinomial logit model estimation is presented in Table 7 using a bootstrap procedure with 500 replications. All the choice attributes were almost significant except for the origin of the litter left by visitors. The insignificant origin indicates that the origin of the litter is indeed unimportant for the visitors because the exact quantity and floating route are not well known by the visitors [41]. The significant city level dummies indicate that the WTPs among the four cities were different. The heterogeneity of the city might be important for the governance of the marine litter. Beach litter annoyance is another robust and significant factor influencing the choice experiment. In addition, sex, age and beach cleanliness perception become significant in the CEM. The directions of the impacts are in line with the previous regressions if they are significant. The older female visitors were, to some extent, more likely to clean up the litter.
Based on the results of the CEM in Table 7 and Equation (5), the visitors’ WTP for the removal of the main types of litter is simulated in Table 8. The total additional entrance payment for the social costs of marine litter in the Taizhou beach area is approximately USD 1.00 per ticket including a USD 0.52 congestion fee. When the heterogeneity of the city is considered, the total additional entrance fee in Ningbo is USD 0.05 higher than that in Taizhou, the Wenzhou sample is USD 0.06 higher and the Zhoushan sample is USD 0.07 higher. The average ticket price is USD 7.98 in Ningbo, USD 13.68 in Zhoushan, USD 7.39 in Taizhou and USD 8.35 in Wenzhou. The social costs are approximately 13.19% of the enrolment price in Ningbo, 7.82% in Zhoushan, 13.53% in Taizhou and 12.72% in Wenzhou. This means that an extra enrolment fee policy could be first implemented as a trial in Zhoushan, mainly due to its relatively lower proportion of social costs with respect to the ticket price.
5. Discussion and Conclusions
First, the refusal rate for beach cleaning programme participation is only 25.9%, which is smaller than the Dutch rate of 72% and the Greek rate of 45%, and which is even slightly smaller than the Bulgarian refusal rate of 28% [22]. Second, the social costs of marine litter at the city level in China are approximately USD 1.08–1.40 per visitor when the CVM is applied, while it is USD 1.00–1.07 per visitor when the CEM is applied. Third, different cities will have different average WTPs. In Table 8, the social costs of marine litter are approximately USD 1.05 in Ningbo, USD 1.07 in Zhoushan, USD 1.00 in Taizhou, and USD 1.06 in Wenzhou. Instead of the WTP, the willingness to work may also play an important role in litter governance. Empirically, the average income after taxes (per month) of the sample is USD 874.0, and approximately 74.1% of the interviewed visitors are willing to spend an average of 1.5 days per month working with clean-up schemes. The opportunity costs of participating in a clean-up programme are USD 32.38 per month (= 5901.3 × 74.1%/30 × 1.5 × 6.7518) and USD 1.08 per day. This paper finds that the opportunity costs are much higher than the entrance fee. One day’s cost is very close to the extra entrance fee. Therefore, the visitors could be considered as taking free rides when they promise to participate in the clean-up programme because it is likely that only a few visitors will actually participate. The summary of the estimates in this paper is shown in Table 9.
With regards to the determinants of the WTP in the case of the CVM and the willingness to participate in the clean-up programmes, income and beach litter annoyance are the two key factors. The visitors with higher incomes prefer to pay more rather than to spend more time, while beach litter annoyance significantly and positively influences the social costs, which means that the travelling experience is very important in litter governance. A litter removal strategy based on the perceived travelling experience is strongly suggested. A clean beach forms the first impression for visitors, and complete removal should be the priority of the litter removal strategy. The perception of a clean beach is the second important aspect, and improving the travel experience with respect to the beach environment is another core strategy. Another important determinant is congestion. Both the visitor congestion and the amount of litter will significantly affect the social costs with respect to marine litter.
The analysis of the social costs of marine litter yielded some useful implications regarding future coastal management policy. First, citizens’ cooperation in marine litter removal was seldom found in case studies [42], but this study provides a better understanding of individuals’ contributions to the marine litter removal strategy. Decision makers can add an extra entrance fee, even if it might be only a small amount of the ticket, in order to remove marine and beach litter [43]. Second, a quality-oriented environmental strategy with respect to marine litter is strongly recommended. Apart from the promotion of environmental cognition, fines and more trash cans [44,45], and efficient law implementation and enforcement mentioned before [46], when it comes to litter cleaning, plastic, butts and cans are the three main litter types and should be properly governed in the development of the coastal tourism industry. The perceptions of visitors regarding marine litter should also receive close attention because it will have an important impact on the effectiveness of litter removal. Third, it is suggested that volunteers should be encouraged to participate in the clean-up programmes directly. Volunteering could not only achieve beach cleaning immediately, but also increases the public’s perception and measures taken against marine litter [47]. Moreover, mistrust of the government will result in lower WTPs, so more talks between the government and visitors are welcomed [48,49].
At last, the study also encounters some potential drawbacks. On the one hand, due to the fact that marine litter abundances are highly variable over time and are strongly affected by the local context [50], seasonal errors may not be avoided because this survey was completed within one month in October 2017. On the other hand, there have been relatively few comparable studies, so the robustness of the social costs needs further testing. In addition, it is worth separating the effects of litter and congestion in future studies, although this paper only claims that “A whole WTP may be equal to the sum of parts” by focusing on the gap between the willingness to work and willingness to pay for Chinese environmental issues.
Author Contributions
Conceptualization, H.X.; methodology, H.X.; investigation, H.X.; data curation, D.M.; writing—original draft preparation, D.M.; writing—review and editing, C.L.; supervision, M.S.; project administration, M.S.
Funding
This research was funded by the National Social Science Foundation of China, grant number: 16ZDA050.
Acknowledgments
We are very thankful for the help and suggestion of Roy Brouwer of Waterloo University with respect to the research on marine litter in China. This work is financially supported by the Major Project of the National Social Science Fund of China (No.16ZDA050). In addition, we appreciate the editors and the anonymous reviewers of this manuscript for their careful and efficient work.
Conflicts of Interest
The authors declare no conflict of interest.
References
- European Environment Agency. The Changing Faces of Europe’s Coastal Areas; Office for Official Publications of the European Communities: Luxembourg, 2006; p. 88. [Google Scholar]
- Shi, P.H. The Comprehensive Contribution of China’s Tourism Industry to GDP. China Tourism News, 8 July 2015; B03. (In Chinese) [Google Scholar]
- Pratt, S. Potential Economic Contribution of Regional Tourism Development in China: A Comparative Analysis. Int. J. Tour. Res. 2015, 17, 303–312. [Google Scholar] [CrossRef]
- OSPAR. Marine Litter in the North-East Atlantic Region: Assessment and Priorities for Response; Report OSPAR Commission: London, UK, 2009; ISBN 978-1-906840-26-6. [Google Scholar]
- Santos, I.R.; Friedrich, A.C.; Kersanach, M.W.; Fillmann, G. Influence of socio-economic characteristics of beach users on litter generation. Ocean Coast. Manag. 2005, 48, 742–752. [Google Scholar] [CrossRef]
- Kiessling, T.; Knickmeier, K.; Kruse, K.; Brennecke, D.; Nauendorf, A.; Thiel, M. Plastic Pirates sample litter at rivers in Germany–Riverside litter and litter sources estimated by schoolchildren. Environ. Pollut. 2019, 245, 545–557. [Google Scholar] [CrossRef] [PubMed]
- Williams, A.T.; R-Buitrago, N.G.; Anfuso, G.; Cervantes, O.; Botero, C.M. Litter impacts on scenery and tourism on the Colombian north Caribbean coast. Tour. Manag. 2016, 55, 209–224. [Google Scholar] [CrossRef]
- Newman, S.; Watkins, E.; Farmer, A.; ten Brink, P.; Schweitzer, J.P. The Economics of Marine Litter. In Marine Anthropogenic Litter; Bergmann, M., Gutow, L., Klages, M., Eds.; Springer International Publishing: Cham, Switzerland, 2015; p. 370. [Google Scholar] [CrossRef]
- Munari, C.; Corbau, C.; Simeoni, U.; Mistri, M. Marine litter on Mediterranean shores: Analysis of composition, spatial distribution and sources in northwestern Adriatic beaches. Waste Manag. 2016, 49, 483–490. [Google Scholar] [CrossRef]
- Keswani, A.; Oliver, D.M.; Gutierrez, T.; Quilliam, R.S. Microbial hitchhikers on marine plastic debris: Human exposure risks at bathing waters and beach environments. Mar. Environ. Res. 2016, 118, 10–19. [Google Scholar] [CrossRef]
- Millennium Ecosystem Assessment. Ecosystems and Human Well-Being: A Framework for Assessment; Island Press: Washington, DC, USA, 2003; pp. 50–59. ISBN 1-55963-403-0. [Google Scholar]
- Fogarassy, C.; Neubauer, É.; Bakosné, M.B.; Zsarnóczai, J.S.; Molnár, S. Water footprint based water allowance coefficient. Water Resour. Ind. 2016, 7–8, 1–8. [Google Scholar] [CrossRef]
- Fogarassy, C.; Neubauer, E. Evaluation of the regional water usage in Hungary with water allowance coefficient (WAC). Appl. Ecol. Environ. Res. 2016, 14, 161–173. [Google Scholar] [CrossRef]
- Galgani, F.; Hanke, G.; Werner, S.; De Vrees, L. Marine litter within the European Marine Strategy Framework Directive. ICES J. Mar. Sci. 2013, 70, 1055–1064. [Google Scholar] [CrossRef]
- Fogarassy, C.; Kerpely, K.; Horvath, B.; Bakos Borocz, M. Analysing the attributes of ecological evaluation on local and regional levels via willingness to pay (WTP)—A Hungarian case study. Appl. Ecol. Environ. Res. 2016, 14, 129–145. [Google Scholar] [CrossRef]
- Jin, M.L.; Juan, Y.X.; Choi, Y.J.; Lee, C.-K. Estimating the Preservation Value of World Heritage Site Using Contingent Valuation Method: The Case of the Li River, China. Sustainability 2019, 11, 1100. [Google Scholar] [CrossRef]
- García-Ayllón, S. New Strategies to Improve Co-Management in Enclosed Coastal Seas and Wetlands Subjected to Complex Environments: Socio-Economic Analysis Applied to an International Recovery Success Case Study after an Environmental Crisis. Sustainability 2019, 11, 1039. [Google Scholar] [CrossRef]
- UNEP. Marine Litter: A Global Challenge; UNEP: Nairobi, Kenya, 2009; p. 232. ISBN 978-92-807-3029-6. [Google Scholar]
- Schneider, F.; Parsons, S.; Clift, S.; Stolte, A.; McManus, M.C. Collected marine litter—A growing waste challenge. Mar. Pollut. Bull. 2018, 128, 162–174. [Google Scholar] [CrossRef] [PubMed]
- Smith, V.K.; Zhang, X.L.; Palmquist, R.B. Marine Debris, Beach Quality, and Non-Market Values. Environ. Resour. Econ. 1997, 10, 223–247. [Google Scholar] [CrossRef]
- Loomis, J.; Santiago, L. Economic valuation of beach quality improvements: Comparing incremental attribute values estimated from two stated preference valuation methods. Coast. Manag. 2013, 41, 75–86. [Google Scholar] [CrossRef]
- Brouwer, R.; Hadzhiyska, D.; Ioakeimidis, C.; Ouderdorp, H. The social costs of marine litter along European coasts. Ocean Coast. Manag. 2017, 138, 38–49. [Google Scholar] [CrossRef]
- Mouat, J.; Lozano, R.L.; Bateson, H. Economic Impacts of Marine Litter; KIMO International: Shetland, UK, 2010; pp. 41–44. [Google Scholar]
- Lee, J. Economic Valuation of Marine Litter and Microplastic Pollution in the Marine Environment: An Initial Assessment of the Case of the United Kingdom; SOAS-CeFiMS: London, UK, 2015; pp. 1–16. [Google Scholar]
- Zhai, G.F.; Suzuki, T. Public willingness to pay for environmental management, risk reduction and economic development: Evidence from Tianjin, China. China Econ. Rev. 2008, 19, 551–566. [Google Scholar] [CrossRef]
- Jambeck, J.R.; Geyer, R.; Wilcox, C.; Siegler, T.R.; Perryman, M.; Andrady, A.; Narayan, R.; Law, K.L. Plastic waste inputs from land into the ocean. Science 2015, 347, 768–771. [Google Scholar] [CrossRef] [PubMed]
- Bergmann, M.; Tekman, M.B.; Gutow, L. Marine litter: Sea change for plastic pollution. Nature 2017, 544, 297. [Google Scholar] [CrossRef] [PubMed]
- Li, D.J.; Daler, D. Ocean Pollution from Land-based Sources: East China Sea, China. AMBIO 2004, 33, 107–113. [Google Scholar] [PubMed]
- Seino, S.; Kojima, A.; Hinata, H.; Isobe, A. Multi-Sectoral Research on East China Sea Beach Litter Based on Oceanographic Methodology and Local Knowledge. J. Coast. Res. 2009, 56, 1289–1292. [Google Scholar]
- Venkatachalam, L. The contingent valuation method: A review. Environ. Impact Assess. Rev. 2004, 24, 89–124. [Google Scholar] [CrossRef]
- Freeman, A.M.; Herriges, J.A.; Kling, C.L. The Measurement of Environmental and Resource Values: Theory and Methods; Resources for the Future Press: Washington, DC, USA, 2003; pp. 83–419. ISBN 978-0-415-50157-6. [Google Scholar]
- Han, F.; Yang, Z.P.; Wang, H.; Xu, X.L. Estimating willingness to pay for environment conservation: A contingent valuation study of Kanas Nature Reserve, Xinjiang, China. Environ. Monit. Assess. 2011, 180, 451–459. [Google Scholar] [CrossRef]
- Guo, X.R.; Liu, H.F.; Mao, X.Q.; Jin, J.J.; Chen, D.S.; Cheng, S.Y. Willingness to pay for renewable electricity: A contingent valuation study in Beijing, China. Energy Policy 2014, 68, 340–347. [Google Scholar] [CrossRef]
- Adamowicz, W.; Boxall, P.; Williams, M.; Louviere, J. Stated preference approaches for measuring passive use values: Choice experiments and contingent valuation. Am. J. Agric. Econ. 1998, 80, 64–75. [Google Scholar] [CrossRef]
- Olesom, K.L.L.; Barnes, M.; Brander, L.M.; Oliver, T.A.; Van Beek, I.; Zafindrasilivonona, B.; Van Beukering, P. Cultural bequest values for ecosystem service flows among indigenous fishers: A discrete choice experiment validated with mixed methods. Ecol. Econ. 2015, 114, 104–116. [Google Scholar] [CrossRef]
- Greene, W.H. On the Asymptotic Bias of the Ordinary Least Squares Estimator of the Tobit model. Econometrica 1981, 49, 505–513. [Google Scholar] [CrossRef]
- Tobin, J. Estimation of Relationships for Limited Dependent Variables. Econometrica 1958, 26, 24–36. [Google Scholar] [CrossRef]
- Li, C.Z.; Kuuluvainen, J.; Pouta, E.; Rekola, M.; Tahvonen, O. Using choice experiments to value the Natura 2000 nature conservation programs in Finland. Environ. Resour. Econ. 2004, 29, 361–374. [Google Scholar] [CrossRef]
- Lancaster, K.J. A new approach to consumer theory. J. Political Econ. 1966, 74, 132–157. [Google Scholar] [CrossRef]
- McFadden, D. Conditional logit analysis of qualitative choice behavior. In Frontiers in Econometrics; Zarembka, P., Ed.; Academic Press: New York, NY, USA, 1974; pp. 105–142. [Google Scholar]
- Löhr, A.; Savelli, H.; Beunen, R.; Kalz, M.; Ragas, A.; Belleghem, F.V. Solutions for global marine litter pollution. Curr. Opin. Environ. Sustain. 2017, 28, 90–99. [Google Scholar] [CrossRef]
- Brennan, R.E.; Portman, M.E. Situating Arab-Israeli Artisanal Fishermen’s Perceptions of Marine Litter in a Socio-institutional and Socio-cultural Context. Mar. Pollut. Bull. 2017, 115, 240–251. [Google Scholar] [CrossRef]
- Shivlani, M.P.; Letson, D.; Theis, M. Visitor Preferences for Public Beach Amenities and Beach Restoration in South Florida. Coast. Manag. 2003, 31, 367–385. [Google Scholar] [CrossRef]
- Yu, B.; Cai, Y.Y.; Jin, L.Q.; Du, B.S. Effects on Willingness to Pay for Marine Conservation: Evidence from Zhejiang Province, China. Sustainability 2018, 10, 2298. [Google Scholar] [CrossRef]
- Eastman, L.B.; Núñez, P.; Crettier, B.; Thiel, M. Identification of self-reported user behavior, education level, and preferences to reduce littering on beaches e A survey from the SE Pacific. Ocean Coast. Manag. 2013, 78, 18–24. [Google Scholar] [CrossRef]
- Honorato-Zimmer, D.; Kruse, K.; Knickmeier, K.; Weinmann, A.; Hinojosa, A.I.; Thiel, M. Inter-hemispherical shoreline surveys of anthropogenic marine debris—A binational citizen science project with schoolchildren. Mar. Pollut. Bull. 2019, 138, 464–473. [Google Scholar] [CrossRef] [PubMed]
- Rayon-Viña, F.; Miralles, L.; Fernandez-Rodríguez, S.; Dopico, E.; Garcia-Vazquez, E. Marine litter and public involvement in beach cleaning: Disentangling perception and awareness among adults and children, Bay of Biscay, Spain. Mar. Pollut. Bull. 2019, 141, 112–118. [Google Scholar] [CrossRef]
- Blackemore, F.; Williams, A. British Tourists’ Valuation of a Turkish Beach Using Contingent Valuation and Travel Cost Methods. J. Coast. Res. 2008, 24, 1469–1480. [Google Scholar] [CrossRef]
- Borrelle, S.B.; Rochman, C.M.; Liboiron, M.; Bond, A.L.; Lusher, A.; Bradshaw, H.; Provencher, J.F. Why we need an international agreement on marine plastic pollution. Proc. Natl. Acad. Sci. USA 2017, 114, 9994–9997. [Google Scholar] [CrossRef]
- Hidalgo-Ruz, V.; Honorato-Zimmer, D.; Gatta-Rosemary, M.; Nuñez, P.; Hinojosa, A.I.; Thiel, M. Spatio-temporal variation of anthropogenic marine debris on Chilean beaches. Mar. Pollut. Bull. 2018, 126, 516–524. [Google Scholar] [CrossRef]
Figure 1.
Example choice card used for eliciting respondent’s preferred environmental condition.

Figure 2.
The locations of the sample beaches in Zhejiang province, China.

Figure 3.
Perceived cleanliness of the beaches in the four cities (share of the overall proportion).
Figure 3.
Perceived cleanliness of the beaches in the four cities (share of the overall proportion).

Figure 4.
Share of the five main beach litter types, mentioned by beach visitors.

Figure 5.
Reported frequency of beach littering with the three beach litter types (share of the overall proportion).
Figure 5.
Reported frequency of beach littering with the three beach litter types (share of the overall proportion).

Figure 6.
Visitors’ perceived annoyance regarding beach litter (share of the overall proportion).


Table 1.
Summary of the transregional estimated WTP works for the removal of marine litter.
| Authors (Year) | Sample Location | Methods | Observations | Payment Style | WTP |
|---|---|---|---|---|---|
| Smith (1997) | New Jersey, North Carolina | CVM | 693 | Local tax/ Entrance fee | USD 21.38–72.18 |
| Loomis & Santiago (2013) | Puerto Rico | CVM/CEM | 214 (CVM) 213 (CEM) | Additional trip cost | USD 98–103 |
| Brouwer, et al. (2017) | Greece | CEM | 200 | Local tax | USD 0.47–0.76 |
| Bulgaria | CEM | 301 | Local tax | USD 7.98–9.32 | |
| Netherlands | CEM | 149 | Entrance fee | USD 2.32–2.90 | |
| Mouat (2010) | Den Haag | Other | 12 (municipalities) | Annual additional expense | USD 3.50 |
| Mouat (2010) | UK | Other | 58 (municipalities) | Annual additional expense | USD 1.13 |
| Zhai & Suzuki (2008) | Tianjing | CEM | 898 | Annual additional expense | USD 3.54 |
Table 2.
Design of the choice experiment.
| Attributes | Levels |
|---|---|
| Type of litter removed | Plastic-Cans-Cigarette Butts |
| Amount of litter | None-Below average-Average |
| Origin of litter | Visitors-Washed ashore- Production and living activities |
| Beach crowdedness | Few visitors-Many visitors |
| Additional entrance fee | USD 0–0.44–0.89–1.33–1.78 |
Table 3.
Summarized socio-demographic and traveling characteristics of the sample.
| Beach Traveling Characteristics | |
| Share on their first beach visit (%) | 12.5 |
| Average number of times visiting the beach till the interview | 3.2 |
| Average number of days for the whole trip | 2.6 |
| Average hours spent on the beach per trip | 3.9 |
| Share of those willing to participate in the environmental organization | 74.1 |
| Socio-demographic Characteristics | |
| Share who were female (%) | 58.1 |
| Average age (years) | 33.4 |
| Share with a middle school-only education (%) | 23.9 |
| Share with a higher professional education (%) | 28.7 |
| Share with a university degree (%) | 42.7 |
| Average income after taxes (USD per month) | 874.0 |
| Share who were local visitors | 14.7 |
| Share who were urban residents (%) | 64.9 |
| Share who were attending tourist group (%) | 33.8 |
| Share who were travelling with others (%) | 72.3 |
Table 4.
Determinants of willingness to participate in the beach clean-up programme.
| Variables | Probit Model (Willingness to Participate: Yes = 1, No = 0) | Tobit Model (No. of Days Willing to Participate) | ||
|---|---|---|---|---|
| Coefficient | St. Error | Coefficient | St. Error | |
| Constant | 0.516 | 0.335 | 0.340 | 0.309 |
| Number of times visiting the beach | −0.007 | 0.035 | 0.010 | 0.032 |
| Urban resident (1 = from the urban) | −0.112 | 0.106 | 0.067 | 0.096 |
| Sex (1 = female) | 0.255*** | 0.100 | 0.133 | 0.092 |
| Age (years) | −0.008* | 0.005 | −0.011*** | 0.004 |
| Education (0–4) | 0.067 | 0.049 | 0.086* | 0.045 |
| Income (USD 148.11/month) | −0.038* | 0.019 | −0.042** | 0.018 |
| Beach cleanliness perception (0–4) | 0.052 | 0.071 | 0.182*** | 0.066 |
| Beach litter annoyance (0–4) | 0.163** | 0.066 | 0.250*** | 0.062 |
| LR chi square | 25.90*** | 44.63*** | ||
| N | 789 | 789 | ||
Note: ***p < 0.01, **p < 0.05, and *p < 0.1.
Table 5.
WTP (USD/Visitor/Time) for the removal of the three main litter types using the CVM.
| Removal of Marine Litter | Average Congestion Costs | Total Additional Payment | Sample | |||
|---|---|---|---|---|---|---|
| Indexed by Plastic | Indexed by Cans | Indexed by Butts | ||||
| Mean WTP (St. Error) | 0.59 | 0.61 | 0.65 | 0.62 | 1.21–1.26 | Four cities |
| (0.284) | (0.299) | (0.317) | (0.293) | |||
| 0.52 | 0.52 | 0.51 | 0.57 | 1.08–1.09 | Ningbo | |
| (0.308) | (0.308) | (0.305) | (0.270) | |||
| 0.58 | 0.57 | 0.62 | 0.58 | 1.16–1.20 | Zhoushan | |
| (0.300) | (0.312) | (0.326) | (0.315) | |||
| 0.62 | 0.66 | 0.68 | 0.64 | 1.25–1.31 | Taizhou | |
| (0.289) | (0.284) | (0.327) | (0.283) | |||
| 0.61 | 0.67 | 0.71 | 0.69 | 1.30–1.40 | Wenzhou | |
| (0.230) | (0.256) | (0.270) | (0.233) | |||
Table 6.
Estimated Tobit models explaining beach visitors’ WTP for the removal of the litter.
| Variables | Plastics | Cans | Cigarette Butts | |||
|---|---|---|---|---|---|---|
| Coeff. | St. Error | Coeff. | St. Error | Coeff. | St. Error | |
| Constant | 3.512*** | 0.849 | 4.967*** | 0.881 | 4.704*** | 0.952 |
| Amount of residual litter | 1.086*** | 0.419 | 1.230*** | 0.440 | 0.975* | 0.501 |
| Origin of the litter (visitors = 1) | −0.014 | 0.228 | 0.071 | 0.236 | 0.019 | 0.253 |
| Number of visitors | 1.491*** | 0.462 | 0.934** | 0.477 | 1.334*** | 0.515 |
| Number of sanitary workers | 0.366** | 0.143 | 0.212 | 0.147 | 0.175 | 0.157 |
| Number of times visiting the beach area | −0.014 | 0.077 | 0.061 | 0.079 | 0.054 | 0.085 |
| Sex (1 = female) | 0.033 | 0.219 | −0.020 | 0.223 | −0.014 | 0.240 |
| Age (years) | 0.020* | 0.010 | 0.018* | 0.011 | 0.014 | 0.011 |
| Education (0–4) | 0.018 | 0.106 | −0.113 | 0.109 | −0.017 | 0.116 |
| Income (USD 148.11/month) | 0.142*** | 0.044 | 0.181*** | 0.045 | 0.183*** | 0.049 |
| Member of Env. organization (1 = yes) | 0.061 | 0.246 | −0.619** | 0.255 | −0.498* | 0.273 |
| Beach cleanliness perception (0−4) | 0.104 | 0.157 | −0.022 | 0.161 | 0.124 | 0.172 |
| Beach litter annoyance (0−4) | 0.429*** | 0.148 | 0.365** | 0.151 | 0.331*** | 0.952 |
| Model Summary Statistics | ||||||
| LR chi square | 52.86*** | 56.92*** | 45.86*** | |||
| Log Likelihood | −1433.045 | −1421.572 | −1387.841 | |||
| Number of respondents | 770 | 770 | 770 | |||
Note: ***p < 0.01, **p < 0.05, and *p < 0.1.
Table 7.
Estimated multinomial logit model with the CEM results.
| Variables | Coeff. est. | St. Error | Coeff. est. | St. Error |
|---|---|---|---|---|
| Alternative specific constant | −2.134*** | 0.085 | −3.790*** | 0.118 |
| Choice Attributes | ||||
| Litter type: plastic | 0.528*** | 0.147 | 0.257* | 0.142 |
| Litter type: cans | 0.513*** | 0.143 | 0.404*** | 0.144 |
| Litter type: cigarette butts | 0.553*** | 0.143 | 0.440*** | 0.147 |
| Amount of residual litter: none | 2.376*** | 0.265 | 3.667*** | 0.320 |
| Amount of residual litter: less than average | 2.004*** | 0.173 | 2.109*** | 0.193 |
| Origin of the litter: left by visitors | 0.096 | 0.126 | −0.109 | 0.134 |
| Number of visitors: few | 0.539*** | 0.163 | 1.216*** | 0.174 |
| Entrance fee | −0.067*** | 0.021 | −0.326*** | 0.031 |
| Covariates | ||||
| Zhoushan (1 = yes) | 1.320*** | 0.254 | ||
| Taizhou (1 = yes) | 1.511*** | 0.267 | ||
| Wenzhou (1 = yes) | 1.806*** | 0.272 | ||
| Number of times visiting beach areas | 0.054 | 0.042 | ||
| Sex (1 = female) | 0.208* | 0.119 | ||
| Age (years) | 0.165*** | 0.056 | ||
| Income (USD 148.11/month) | 0.007 | 0.025 | ||
| Education (0–4) | 0.075 | 0.058 | ||
| Member environmental organization (1 = yes) | 0.026 | 0.206 | ||
| Beach cleanliness perception (0–4) | 0.308*** | 0.080 | ||
| Beach litter annoyance (0–4) | 0.159** | 0.076 | ||
| Model Summary Statistics | ||||
| Wald chi square | 596.18*** | 1041.26*** | ||
| Log Likelihood | −1183.316 | −1028.395 | ||
| Pseudo | 0.220 | 0.322 | ||
| Number of observations | 2382 | 2382 | ||
Note: ***p < 0.01, **p < 0.05, and *p < 0.1.
Table 8.
WTP (USD/Visitor/Entrance) for the removal of litter in Ningbo using the CEM.
| Removal of Marine Litter | Average Congestion Cost | Total Additional Payment | Sample | |||
|---|---|---|---|---|---|---|
| For Plastic | For Cans | For Butts | ||||
| Mean WTP (St. Error) | 0.13 | 0.15 | 0.18 | 0.58 | 1.04 | Four cities |
| (0.068) | (0.067) | (0.070) | (0.084) | |||
| 0.12 | 0.18 | 0.20 | 0.55 | 1.05 | Ningbo | |
| (0.065) | (0.065) | (0.067) | (0.079) | |||
| 0.12 | 0.19 | 0.20 | 0.56 | 1.07 | Zhoushan | |
| (0.068) | (0.067) | (0.070) | (0.083) | |||
| 0.12 | 0.17 | 0.19 | 0.52 | 1.00 | Taizhou | |
| (0.067) | (0.067) | (0.070) | (0.087) | |||
| 0.13 | 0.16 | 0.19 | 0.58 | 1.06 | Wenzhou | |
| (0.070) | (0.068) | (0.071) | (0.086) | |||
Note: Here, the total additional payment is calculated by summing up the WTPs for removing the three main types of marine litter (the plastic, cans and butts). In the CEM, the WTP for removing each type of marine litter is asked separately, while the WTP of the CVM in Table 5 for removing the marine litter is all the marine litter types together rather than the different types. Statistically, the summed total additional payment in Table 8 is very close to the integrated WTP in Table 5.
Table 9.
Summary of the estimated results in this paper.
| Sample Location | Methods | Observations | Payment Style | WTP |
|---|---|---|---|---|
| Zhejiang | CV/CE | 805 | Entrance fee (CV) | USD 1.08–1.40 |
| Entrance fee (CE) | USD 1.00–1.07 | |||
| Opportunity costs | USD 1.08 per day |
© 2019 by the authors. Licensee MDPI, Basel, Switzerland. This article is an open access article distributed under the terms and conditions of the Creative Commons Attribution (CC BY) license (http://creativecommons.org/licenses/by/4.0/).
Share and Cite
MDPI and ACS Style
Shen, M.; Mao, D.; Xie, H.; Li, C. The Social Costs of Marine Litter along the East China Sea: Evidence from Ten Coastal Scenic Spots of Zhejiang Province, China. Sustainability 2019, 11, 1807. https://doi.org/10.3390/su11061807
AMA Style
Shen M, Mao D, Xie H, Li C. The Social Costs of Marine Litter along the East China Sea: Evidence from Ten Coastal Scenic Spots of Zhejiang Province, China. Sustainability. 2019; 11(6):1807. https://doi.org/10.3390/su11061807
Chicago/Turabian StyleShen, Manhong, Di Mao, Huiming Xie, and Chuanzhong Li. 2019. "The Social Costs of Marine Litter along the East China Sea: Evidence from Ten Coastal Scenic Spots of Zhejiang Province, China" Sustainability 11, no. 6: 1807. https://doi.org/10.3390/su11061807
Note that from the first issue of 2016, this journal uses article numbers instead of page numbers. See further details here.