Spatial Justice of a Chinese Metropolis: A Perspective on Housing Price-to-Income Ratios in Nanjing, China

1
School of Geographical Science, Nanjing Normal University, Nanjing 210023, China
2
Jiangsu Center for Collaborative Innovation in Geographical Information Resource Development and Application, Nanjing 210023, China
3
Nanjing Institute of Geography and Limnology, Chinese Academy of Sciences, Nanjing 210008, China
4
College of Humanities and Social Development, Nanjing Agricultural University, Nanjing 210095, China
*
Author to whom correspondence should be addressed.
Sustainability 2019, 11(6), 1808; https://doi.org/10.3390/su11061808
Submission received: 20 February 2019
/
Revised: 20 March 2019
/
Accepted: 20 March 2019
/
Published: 26 March 2019
(This article belongs to the Special Issue Geographic Data Science and Sustainable Urban Developments)
Abstract
:The housing price-to-income ratio is an important index for measuring the health of real estate, as well as detecting residents’ housing affordability and regional spatial justice. This paper considers 1833 residential districts in one main urban area and three secondary urban areas in Nanjing during the period 2009–2017 as research units. It also simulates and estimates the spatial distribution of the housing price-to-income ratio with the kriging interpolation method of geographic information system (GIS) geostatistical analysis and constructs a housing spatial justice model by using housing price, income, and housing price-to-income ratio. The research results prove that in the one main urban area and the three secondary urban areas considered, the housing price-to-income ratio tended on the whole to rise, presenting a core edge model of a progressive decrease from the Main Urban Area to the secondary urban areas spatially, with high-value areas centered around famous school districts and new town centers. The housing spatial justice degree presented a trend opposite to that of the housing price-to-income ratio pattern; it progressively decreased from the secondary urban areas to the Main Urban Area. Furthermore, the spatial justice degree tended to decrease in the new towns, in the periphery of the Main Urban Area, and in the secondary urban areas, and it tended to rise, relatively, in the inner urban areas. The enhancement of the housing price-to-income ratio has caused the urban housing spatial justice degree to become gradually imbalanced, gradually squeezing out the poor and vulnerable groups to urban fringe areas and leading to a phenomenon of middle class stratification. This has thus aroused social problems such as housing differentiation and class solidification, etc., and has caused inequality in social spaces. Tt is therefore urgently necessary to reflect on urban space production with the value and principle of spatial justice, which is also the only way to obtain urban sustainable development, in mind.
1. Introduction
Since 1998, China has comprehensively ceased the physical distribution of housing and has gradually executed monetized housing distribution, causing China’s urban housing system to slowly change from a planning type system to a market type system, and gradually transforming the housing system into one which has the market as its subject. Alongside the fast development of China’s housing market, housing prices have displayed a trend of fast growth; the housing prices of the cities represented by Beijing, Shanghai, Shenzhen and Nanjing have especially maintained high-speed growth. From 2006 to 2016, the prices of commodity housing in these cities grew by more than 280% but the per capita disposable income of residents grew by only 166% [1,2]. The relatively slow growth of residents’ income and the fast growth of housing prices has become a practical problem faced by Chinese society. Hence, research on residents’ housing affordability has also received the common attention of society, the government, and academia.
Housing price-to-income ratio (PIR), namely the ratio of the total price of residential housing and residents’ family income, is an index commonly used to research residents’ housing affordability [3,4]. Generally, the higher the PIR is, the lower the residents’ affordability, and the higher the degree of speculation demand or the possibility of a real estate bubble in the real estate market [5]. For this reason, it has attracted broad attention from many domestic and overseas scholars. There is a lack of unified understanding on the calculation of the housing price-to-income ratio at home and abroad, but this has not affected domestic and overseas scholars’ broad and thorough research into it. In terms of research content, scholars mostly focus on researching the connotations and algorithms of the housing price-to-income ratio [6,7], regional differentiation and influential factors of the housing price-to-income ratio [8,9], and residents’ housing affordability [10,11], as well as real estate bubble measurement [12], etc. However, they seldom research the spatial differentiation patterns of the housing price-to-income ratio. In terms of research methods, scholars mainly use the theory of econometrics to determine the calculation model of the housing price-to-income ratio, and on this basis, estimate the reasonable scope of the housing price-to-income ratio by constructing a residents’ housing affordability index and housing affordability model, etc. [13,14]. In terms of the research scale, the authors give priority to research at the mesoscopic and macroscopic levels, deem provincial and greater regions or national areas to be research areas at the macroscopic level, and mostly consider the entirety of a city as the research unit at the mesoscopic level, but seldom carry out research based on the microscopic perspective of the urban interior. In terms of research perspective, authors mostly carry out analysis and research from the perspectives of economics, management science, and sociology, but seldom carry out research from the perspective of geography at present.
Along with the over-fast growth of housing prices in first- and second-tier Chinese cities, the residential housing burden has become increasingly serious [15,16]. Housing naturally has dual attributes of residence and investment, but under the market economy system, it is very difficult to prevent commodity housing from becoming an object of investment and speculation. The over-fast growth of urban housing prices and excessive speculation in the market will possibly induce unfair problems within urban spaces such as urban space imbalance and residential segregation, etc. [17,18,19]. This will further arouse social exploration and the pursuit of social justice, with spatial justice aroused by urban housing having also gradually become a hot spot in domestic and overseas academic research. The spatial distribution of the PIR within cities reflects the spatial differences in residents’ housing affordability. The differences in residents’ affordability in different areas also indicate the differences in residents’ housing space selection, that is, the PIR may reveal the imbalance in housing space to a certain degree. For this reason, this paper introduces the PIR as an important index for detecting the spatial justice of housing inside cities.
2. The Right to a Dwelling: The Core of Spatial Justice in the Process of Urbanization
Spatial justice refers to pursuing social fairness and justice from the perspective of space and realizing the social sharing of spatial development achievements through corresponding value guidance, system arrangement, policy formulation, and planning, with an aim to observe, distinguish, alleviate, and eliminate injustice in space production. The concept of spatial justice originated from the concept of “territory justice” [20], which was brought forward by Bleddyn Davies; David Harvey creatively developed it into “territory redistributive justice” [21]. Edward Soja considers spatial injustice to be artificial and that it can be changed through policy and planning [22]. Spatial justice is an interdisciplinary, complex, and integrated concept, involving relatively broad contents such as production, distribution [23], power [24], capital [25], environment [26], and culture, etc. It pays much attention to problems like economic exploitation, power deprivation, environmental risks, racial discrimination, and so on. As a social value and concept, spatial justice has been integrated into many fields, including economy, politics, society, and ecology. Against a background of social transformation, the study of space in the social sciences has been placed in an increasingly important position. For example, Henri Lefevre specially emphasizes the social attributes of space; as a consequence he believes that space is not pre-set, static and invariable, but can be produced, and that is a dynamic evolution process [27]. Research on spatial justice in China started relatively late and has been concentratively conducted in the distribution field [28,29].
Housing is not only a space resource but also a space product [30], and therefore housing justice belongs to the field of spatial justice and is an important part of spatial justice [31]. Housing spatial justice is usually regarded as social equality and justice within the field of public housing spatial rights and interests. It is a reflection on the imbalance of social housing space occupation, that is, the justice of housing production, possession, utilization, consumption, and exchange [32]. More precisely, it includes the beliefs that urban residents enjoy should equal rights to housing; various forms of spatial segregation, residence restriction, and housing discrimination should be avoided; there should be relatively free and ideal living space production and consumption; and residents should have their own housing and relatively friendly living environments [33]. Spatial justice emphasizes that residents should equally enjoy the spatial rights and interests of all spatial resources and spatial products. For urban residents, the crucial spatial resource is housing. Among the social spatial resources of Chinese cities, housing is associated with plentiful urbanized rights and interests. Residents who have housing have obvious advantages in terms of children’s schooling and settlement, etc., and even have absolute advantages in terms of enjoying high-quality basic education resources. To a certain degree, this means that residents who have housing enjoy more rights in terms of things like medical treatment, employment, and endowment, but housing tenants may not equally enjoy public service resources. As a basic human right affecting the realization of citizens’ numerous important rights, housing rights have great significance for promoting social fairness and justice and maintaining social harmony and stability, and have gradually occupied a core status in research surrounding the spatial justice of Chinese cities.
Spatial justice is a topic jointly researched by sociology and geography. Sociology researches the allocation and deprivation levels of social resources from the perspective of constructing social equity while geography measures justice and spatial deprivation from the perspective of space. This paper attempts to explore the distribution justice of urban internal housing resources from a geographical perspective and by using data like housing prices and residents’ income. On this basis, it endeavors to further analyze the space-time change characteristics of housing resources distribution justice by constructing a model of the degree of housing spatial justice, aiming to discover relevant problems within urban housing, guide the coordinative development of society and the urban real estate market, provide a reference with which to aid governmental departments in adjusting and controlling regional housing prices and making housing policies, and provide instructions for urban residents’ selection of housing.
3. Material and Methods
3.1. Study Area
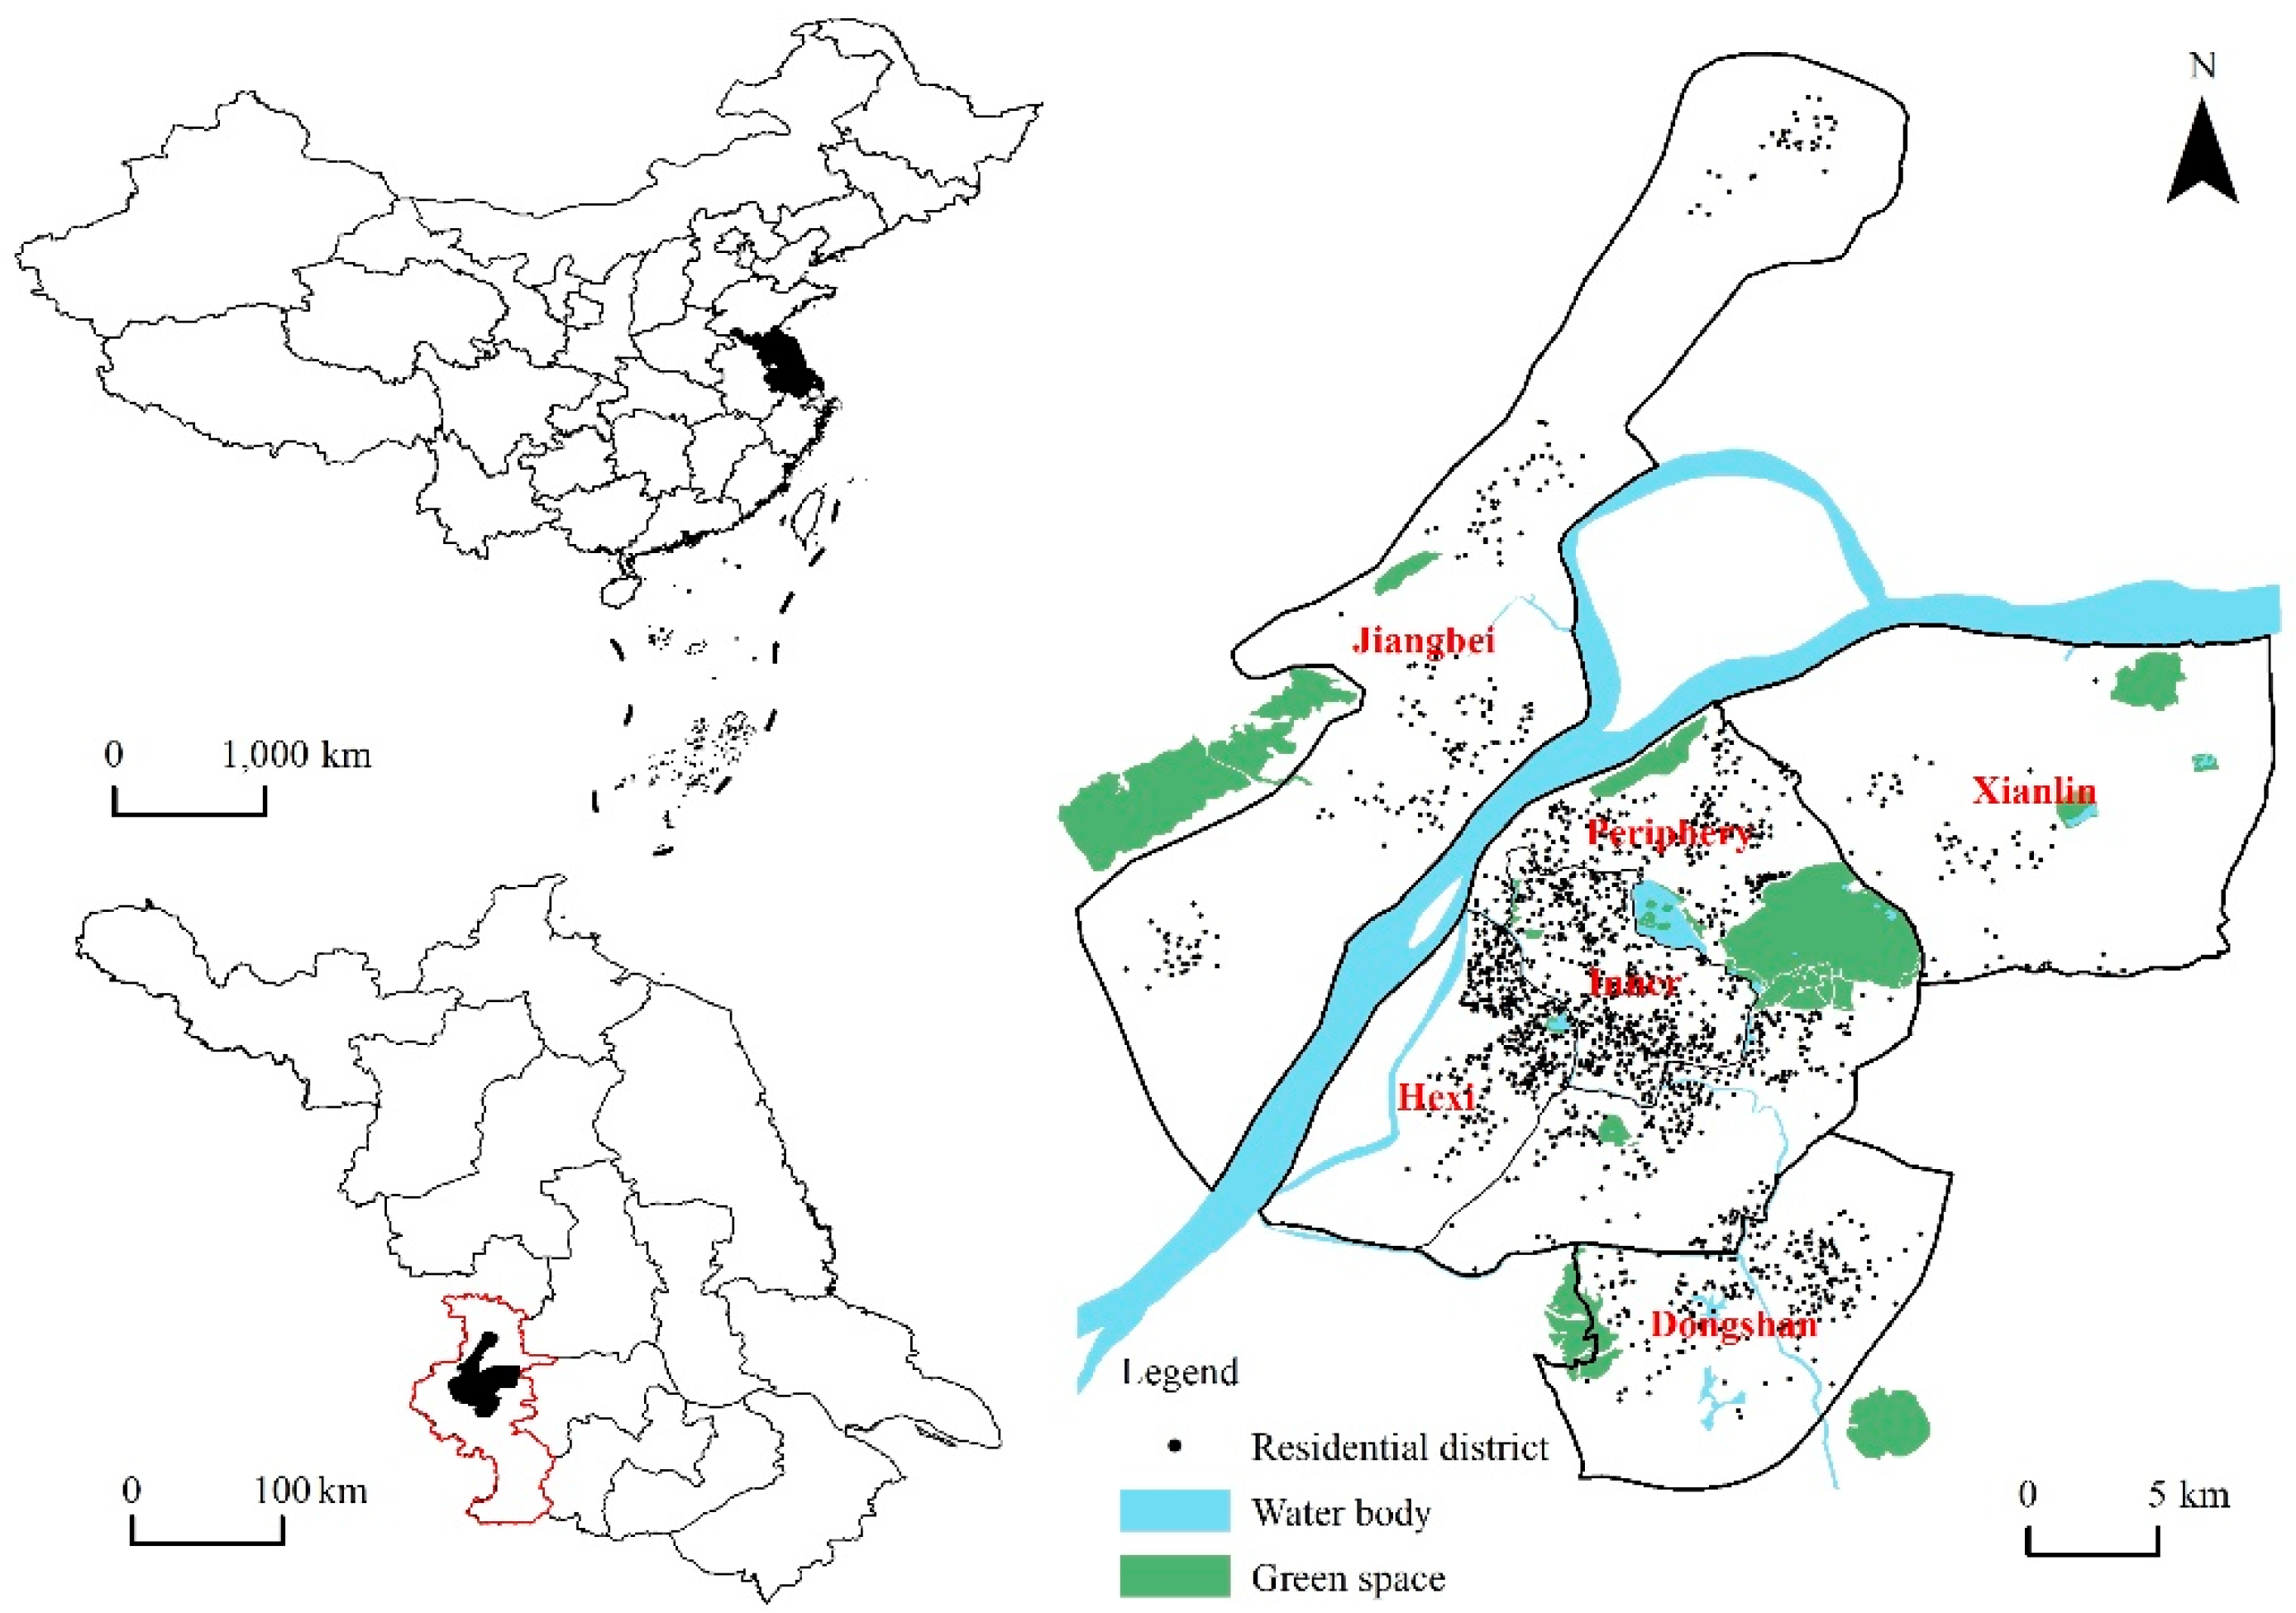
From the main expansion direction of completed urban areas in Nanjing [34] and the Urban Overall Planning of Nanjing (2011–2020), this paper selected one main urban area and three secondary urban areas from the central urban areas of Nanjing, namely, the “Main Urban Area”, “Jiangbei Secondary Urban Area”, “Xianlin Secondary Urban Area”, and “Dongshan Secondary Urban Area” as its chosen research areas. These cover an area of 846 km2 and account for around 12.8% of the administrative region of Nanjing. The Main Urban Area is the core of Nanjing’s urban development area and is also the center of the Nanjing Metropolis Circle. The secondary urban areas are the subcenters of Nanjing’s urban development area, namely, the urban new economic growth poles, and are the result of the evolution of urban space structure from single kernels to multiple kernels. The one main urban area and three secondary urban areas considered are areas where the real estate market is relatively active and where residential points are most densely distributed in Nanjing, so researching these areas may be able to reflect the spatial differentiation rule of the PIR and housing justice in Nanjing to the largest degree. The Main Urban Area may be further divided into the inner urban area, Hexi New Town (including Jiangxinzhou), and the periphery of the Main Urban Area. The scope of the inner urban area mainly consists of the area within the City Wall of the Ming Dynasty [35]; Hexi New Town refers to the area enclosed by Qinhuai River, Nan River, New Qinhuai River, and the Yangtze River; and the periphery refers to the remaining areas except for the inner urban area and Hexi New Town. In terms of administrative regions, the one main urban area and three secondary urban areas include the four districts, namely, Xuanwu District, Gulou District, Qinhuai District, and Jianye District, as well as partial areas of Yuhuatai District, Jiangning District, Qixia District, Pukou District, and Luhe District.
3.2. Data Sets
The Notification on the Policy of Sales Tax for Transfer of Personal Housing, which was formally implemented in 2009, states that from 1 January to 31 December 2009, individuals shall be exempted from sales tax for selling common houses held for more than or exactly two years after purchasing. Along with the gradual implementation of this policy, the increase in new housing sales and the preferential policy for the transfer of second-hand housing meant that the market was expected to improve, and the turnover in the real estate market of Nanjing created a new high record. In 2013, the implementation of the Nanjing Eight Clauses, , including the methods of “land price competition and supporting facilities competition” and “land price competition and housing fund competition”, ushered in a boom in the Nanjing real estate market. In 2017, Nanjing became the first city “selling housing through notarized order shaking” in China; completed price limitation, purchasing limitation, loan limitation, and sales limitation; and became one of several cities executing the strictest control nationwide. Hence, this paper covers three time periods: 2009, 2013, and 2017. With the first quarter of each year as the time bucket and residential districts as the basic research units, this paper collected information on housing prices from 1833 residential districts of one main urban area and three secondary urban areas in the central urban areas of Nanjing. Housing price data were mainly sourced from data listed by the Nanjing Real Estate Market Transaction Management Center and were screened, supplemented, and checked according to information on real estate transactions in Nanjing as provided by real estate websites like China Housing Price Platform (http://www.creprice.cn/). The housing prices of residential districts gave priority to the average transaction price per unit area in the secondary real estate market (the new housing transaction market) or tertiary real estate market (second-hand housing transaction market) in that quarter.
Urban residents’ income data were sourced from field investigation data. For this work the author carried out an investigation by visiting each residential district, taking characteristics like the quality of residential districts and the profession and position of residents as the basis for testing the reliability of investigation data, and adopting the average value investigated for each residential district as its income data. The urban per capita housing building area data were sourced from the Nanjing Statistical Yearbook and Jiangsu Statistical Yearbook of 2009 to 2017, and with per capita housing building area data being the average value of the urban residents in the whole city. The time bucket adopted for the housing price research in this paper was the first quarter of each year, so the housing price-to-income ratio was calculated with income data and building area data of the previous year. This paper used Google Earth to detect the spatial position of each residential district and establish a spatial attribute database of residential districts in the researched area. The regional distribution of residential districts is shown in Figure 1 and Table 1.
3.3. Methods
3.3.1. Housing Price-to-Income Ratio Model
In the Urban Indicators Tool Kit Guide of the United Nations Human Settlements Programme (UN-Habitat), the housing price-to-income ratio is defined as the ratio of the medium free market price of residential units and the medium families’ annual income within a region. In recent years, while the income of Chinese urban and rural residents has continued to steadily increase, the income gap between different groups has gradually widened [36], and China has not become a society dominated by middle-income families. Therefore, exploring the housing price-to-income ratio of microscopic regions inside cities may still reflect more accurately the real housing purchasing ability of families with different incomes and have more social practical significance. The formula of housing price-to-income ratio is [11,37]
where PIR refers to the housing price-to-income ratio; HP refers to the sales price of each house, which is the product of the average unit area price of housing (AR), urban per capita housing building area (AF), and urban average household population (n); and HI refers to the annual income of residential families, which is the product of the per capita disposable income of urban residents (AI) and urban average household population (n).
3.3.2. Housing Justice Model
For urban residents, the accessibility of housing in different regions is not equal; it is instead closely related to residents’ economic strength and regional housing price levels, i.e., closely related to the PIR. In addition, with regard to the differences in factors such as residents’ housing affordability, social structure, and community culture, the phenomenon of community segmentation has gradually appeared in cities and has had a heavy impact on residents’ selection of housing areas. Therefore, this paper introduces the concept of a PIR spatial balance and isolation index [38] with which to construct the housing spatial justice of each community. The formula is
where Pi refers to the PIR spatial balance of community i, with the larger Pi is the higher the PIR spatial balance of the community; refers to the average value of the PIR of all communities in the researched areas; Air refers to the PIR of community i; Di refers to the isolation index of community i, with the larger Di is, the higher the isolation degree of the community; ARi refers to the average unit area of housing in community i; refers to the average unit area price of housing in the researched areas; AIi refers to the per capita disposable income of residents in community i; refers to the per capita disposable income of residents in the researched areas; Ji refers to the housing justice of community i; W1 refers to the weight of the PIR spatial balance of the housing community; W2 refers to the weight of the isolation index of the residential district, with both being 0.5 in this paper. refers to the min-max standardization of Pi; is the min-max standardization of Di; and the bigger Ji is, the higher the housing justice of the community. The housing justice degree reflects the relative fairness degree, that is, the ranking of housing accessibility of each residential district in the researched areas relative to the average level of the researched areas. The residential districts with a relatively high justice degree are those with housing of relatively high accessibility, while residential districts with a relatively low justice degree are those with housing of relatively low accessibility, being also in a state of space deprivation.
3.3.3. Kriging Spatial Interpolation
Kriging spatial interpolation, also known as spatial local interpolation, is a method used for unbiased optimal estimation of regionalized variables in a finite region based on spatial autocorrelation [39]. In the field of spatial interpolation, kriging interpolation is an accurate local interpolation method which not only considers the distance relation but also considers the relations between the spatial distribution of known sample points and the spatial orientation of unknown sample points through variation function and structure analysis, calculating the numerical value of unknown sample points by giving weight to known sample points. The concrete function expression is [40]
where Z(x0) refers to the attribute value of unknown sample points; Z(xi) refers to the attribute value of known sample points surrounding unknown sample points; λi refers to the weight of the known sample point i to unknown sample points; and n refers to the number of known sample points. This paper uses the ordinary kriging to detect the spatial distribution characteristics of the PIR and housing justice. In the ordinary kriging, the uniformly minimum variance unbiased estimate (UMVU) must be satisfied, so the weight coefficient λi will meet the equation set [41]
The weight coefficient λi (i = 1, 2, …, n) is calculated and then the attribute value Z(x0) at the non-collected point x0 is calculated.
4. Results
4.1. Space-time Differentiation Pattern of the Housing Price-to-Income Ratio of Urban Families in Nanjing
This paper calculates the PIR of urban families in Nanjing with Formula (1) and subsequently carries out the spatial interpolation of the PIR of urban families in Nanjing with the ordinary kriging method in the geostatistical analysis module of ArcGIS software, obtaining the space-time distribution state of the PIR of urban families in Nanjing (Figure 2). This paper carries out descriptive statistics of the PIR of each region in the one main urban area and three secondary urban areas considered, as a result obtaining Table 2. By referring to the research results of predecessors and the current state of housing prices in Nanjing [9,42], this paper divides the PIR of urban families in Nanjing into five types: (1) low-PIR residential districts where the PIR is lower than 5; (2) medium-PIR residential districts where the PIR ranges 5.00–10.00; (3) relatively high-PIR residential districts where the PIR ranges 10.01–15.00; (4) high-PIR residential districts where the PIR ranges 15.01–20.00; and (5) ultra-high-PIR residential districts where the PIR is higher than 20.
According to Table 2 and Figure 2, in the period 2009–2017, the PIR of urban families in Nanjing tended to rise. The PIR values for the periphery of the Main Urban Area, Jiangbei Secondary Urban Area, Xianlin Secondary Urban Area, and Dongshan Secondary Urban Area displayed trends of accelerated increase. The growth trend of the PIR for the inner urban area and Hexi New Town was weakened somewhat, and the growth rate of the PIR was basically inversely proportional to housing prices, that is, the higher housing prices were, the lower the growth rate of the PIR was. For example, in the inner urban areas where the housing prices were relatively high, the PIR growth rate was the lowest; in Jiangbei Secondary Urban Area, where the housing prices were lowest, the PIR growth rate was the highest. Hexi New Town, as a new urban center specially developed by Nanjing, held a leading position within the areas for its housing prices and PIR, and the growth rate of its PIR was the highest in the Main Urban Area.
As seen from the spatial distribution of the PIR, the PIR of urban families in Nanjing during the period 2009–2017 displayed a stepwise decline from Hexi New Town to the surrounding areas, with Hexi New Town as the core. It also presented a core-periphery pattern of progressive decrease, on the whole, from the Main Urban Area to external secondary urban areas. In 2009, the maximum values of the PIR were located in areas surrounding famous school districts in the southern part of Hexi New Town, in inner urban areas, and in the northern part of Hexi New Town. These schools included Lasa Road Primary School, Lixue Primary School, Lang Ya Road Primary School, Primary School Affiliated to Nanjing Normal University, East Beijing Road Primary School, Hanjiang Road Primary School, and Longjiang Road Primary School. Jiangbei Secondary Urban Area became a gathering area for low values. In 2013, the high-PIR areas were extended to surrounding areas. The maximum values were mainly distributed within the southern part of Hexi New Town, as well as within the surrounding areas of Jinling Huiwen Primary School and Yincheng Primary School in the northern part of Hexi New Town. The inner urban area, Yuhuatai and Purple Mountain in the periphery of the Main Urban Area, the Maqun and Xianlin Subdistricts in Xianlin Secondary Urban Area, and Baijiahu and Jiangjunshan in Dongshan Secondary Urban Area, as well as other urban areas, became the secondary distribution areas of the PIR. On the whole, high-PIR areas were shaped as a shuttle; these areas took Hexi-Xianlin as the main “shaft” and extended in the northeast-southwest direction. In 2017, the high-PIR areas were the same as those in 2013 and continued to extend to the periphery. Moreover, the average PIR of Hexi New Town was higher than 15. Lasa Road Primary School, Lixue Primary School, Lang Ya Road Primary School, East Beijing Road Primary School in the inner urban area, Yuhuatai in the periphery of the Main Urban Area, Xianlin Subdistrict in Xianlin Secondary Urban Area, and Baijiahu and Jiangjunshan in Dongshan Secondary Urban Area became island-shaped secondary high-value areas. Within the period 2009–2017, Jiangbei Secondary Urban Area was always a gathering area for low values. The PIR growth rate of Jiangbei Secondary Urban Area over the eight years reached 90.67%, but Luhe Area in its northern region was still the lowest-value area among the one main urban area and three secondary urban areas considered, and the PIR of Pukou Area in its southern region was at a moderate level.
For the period 2009–2017, the PIR values of each area in the main urban area and three secondary urban areas of Nanjing displayed rising growth, and except for the inner urban areas, the PIR values of the other areas grew by more than 50% over the eight years considered. The growth rates presented an anti-core-periphery pattern, i.e., Jiangbei Secondary Urban Area > Dongshan Secondary Urban Area > Xianlin Secondary Urban Area > Hexi New Town > the periphery of the Main Urban Area > the inner urban Area. Except for Jiangbei Secondary Urban Area, the PIR of the other areas was more than 10 in 2017, that is, the development of the housing market in the Main Urban Area, and Xianlin and Dongshan Secondary Urban Areas went beyond the purchasing ability of most residents.
4.2. Measurement of Housing Spatial Justice in Nanjing from the Perspective of the Housing Price-to-Income Ratio
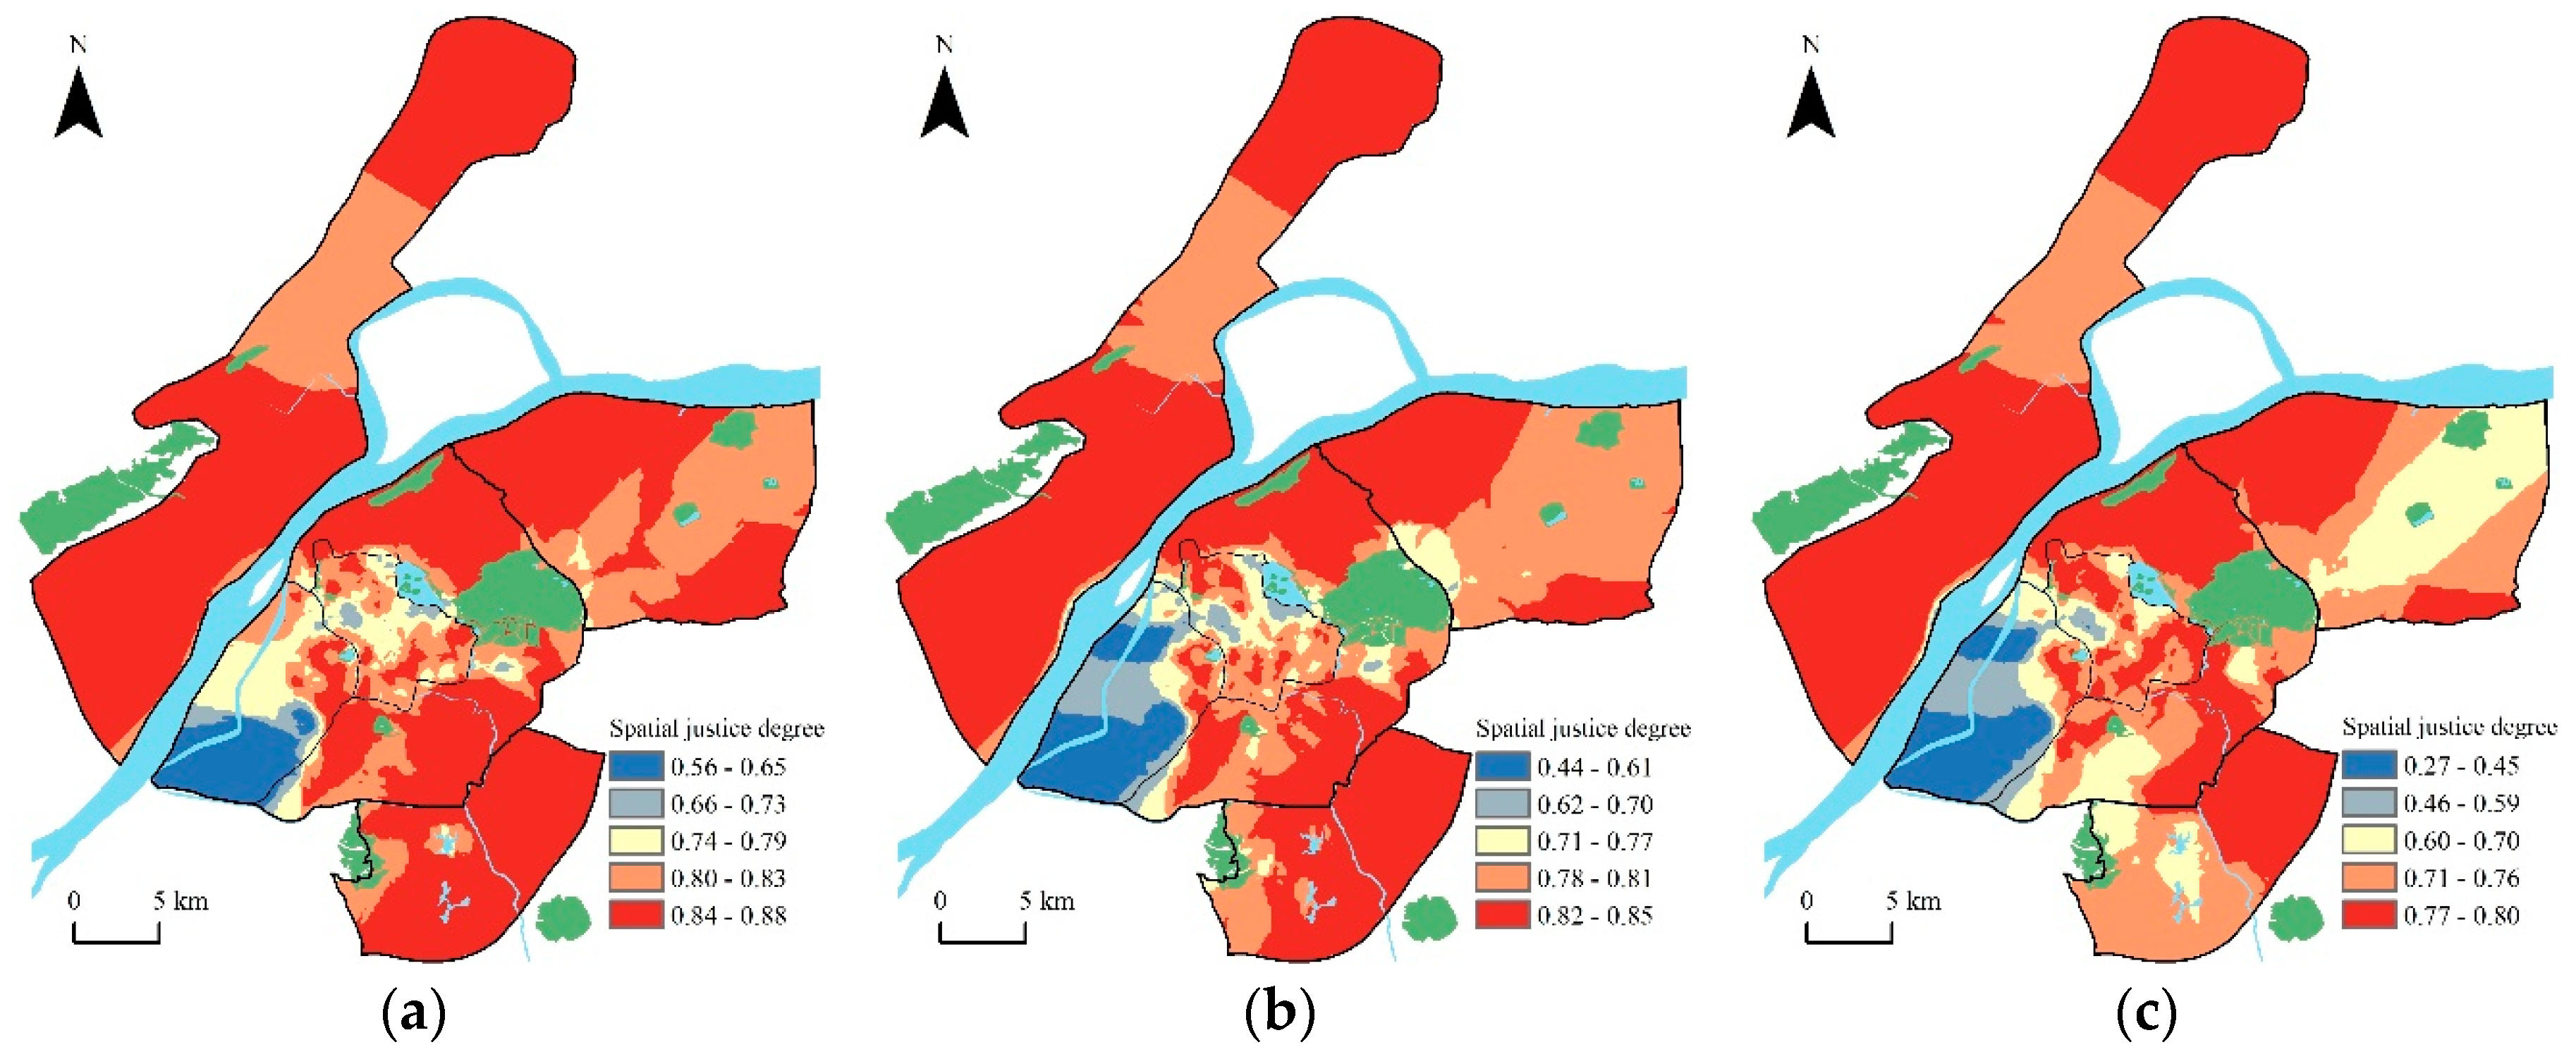
According to the above analysis on the housing price-to-income ratio, and in combination with the housing justice degree model, this paper calculated the accessibility of housing in each area, carried out spatial interpolation with the ordinary kriging method, and thus obtained a space-time distribution of the degree of housing justice for urban families in Nanjing (Figure 3).
According to Figure 3, in 2009–2017, the spatial justice degree of urban families in Nanjing displayed a negative correlation with the spatial pattern of the housing price-to-income ratio, that is, in the three secondary urban areas where the PIR was relatively low, the spatial justice was relatively high; in Hexi New Town, where the PIR was the highest, the spatial justice was the lowest. Spatial justice was generally expressed as a spatial pattern decreasing gradually from the secondary urban areas to the Main Urban Area. Jiangbei Secondary Urban Area always ranked highly among the various areas in terms of spatial justice and did not change significantly across the three time sections. In 2013–2017, spatial justice in the south of the periphery of the Main Urban Area, in the south of Xianlin Secondary Urban Area, and in the west of Dongshan Secondary Urban Area noticeably dropped; spatial justice in the inner urban area tended to rise; and the only areas with relatively poor justice were Lasa Road Primary School, Lixue Primary School, Lang Ya Road Primary School, and the areas along Xuanwu Lake. Spatial justice in the northern part of Hexi New Town also noticeably dropped. Overall, the spatial justice of Hexi New Town, the periphery of the Main Urban Area, Xianlin Secondary Urban Area, and Dongshan Secondary Urban Area tended to drop, while that of the inner urban area tended to rise, and that of Jiangbei Secondary Urban Area tended to be relatively stable.
4.3. Spatial Distribution Model of the Spatial Justice Degree in Nanjing
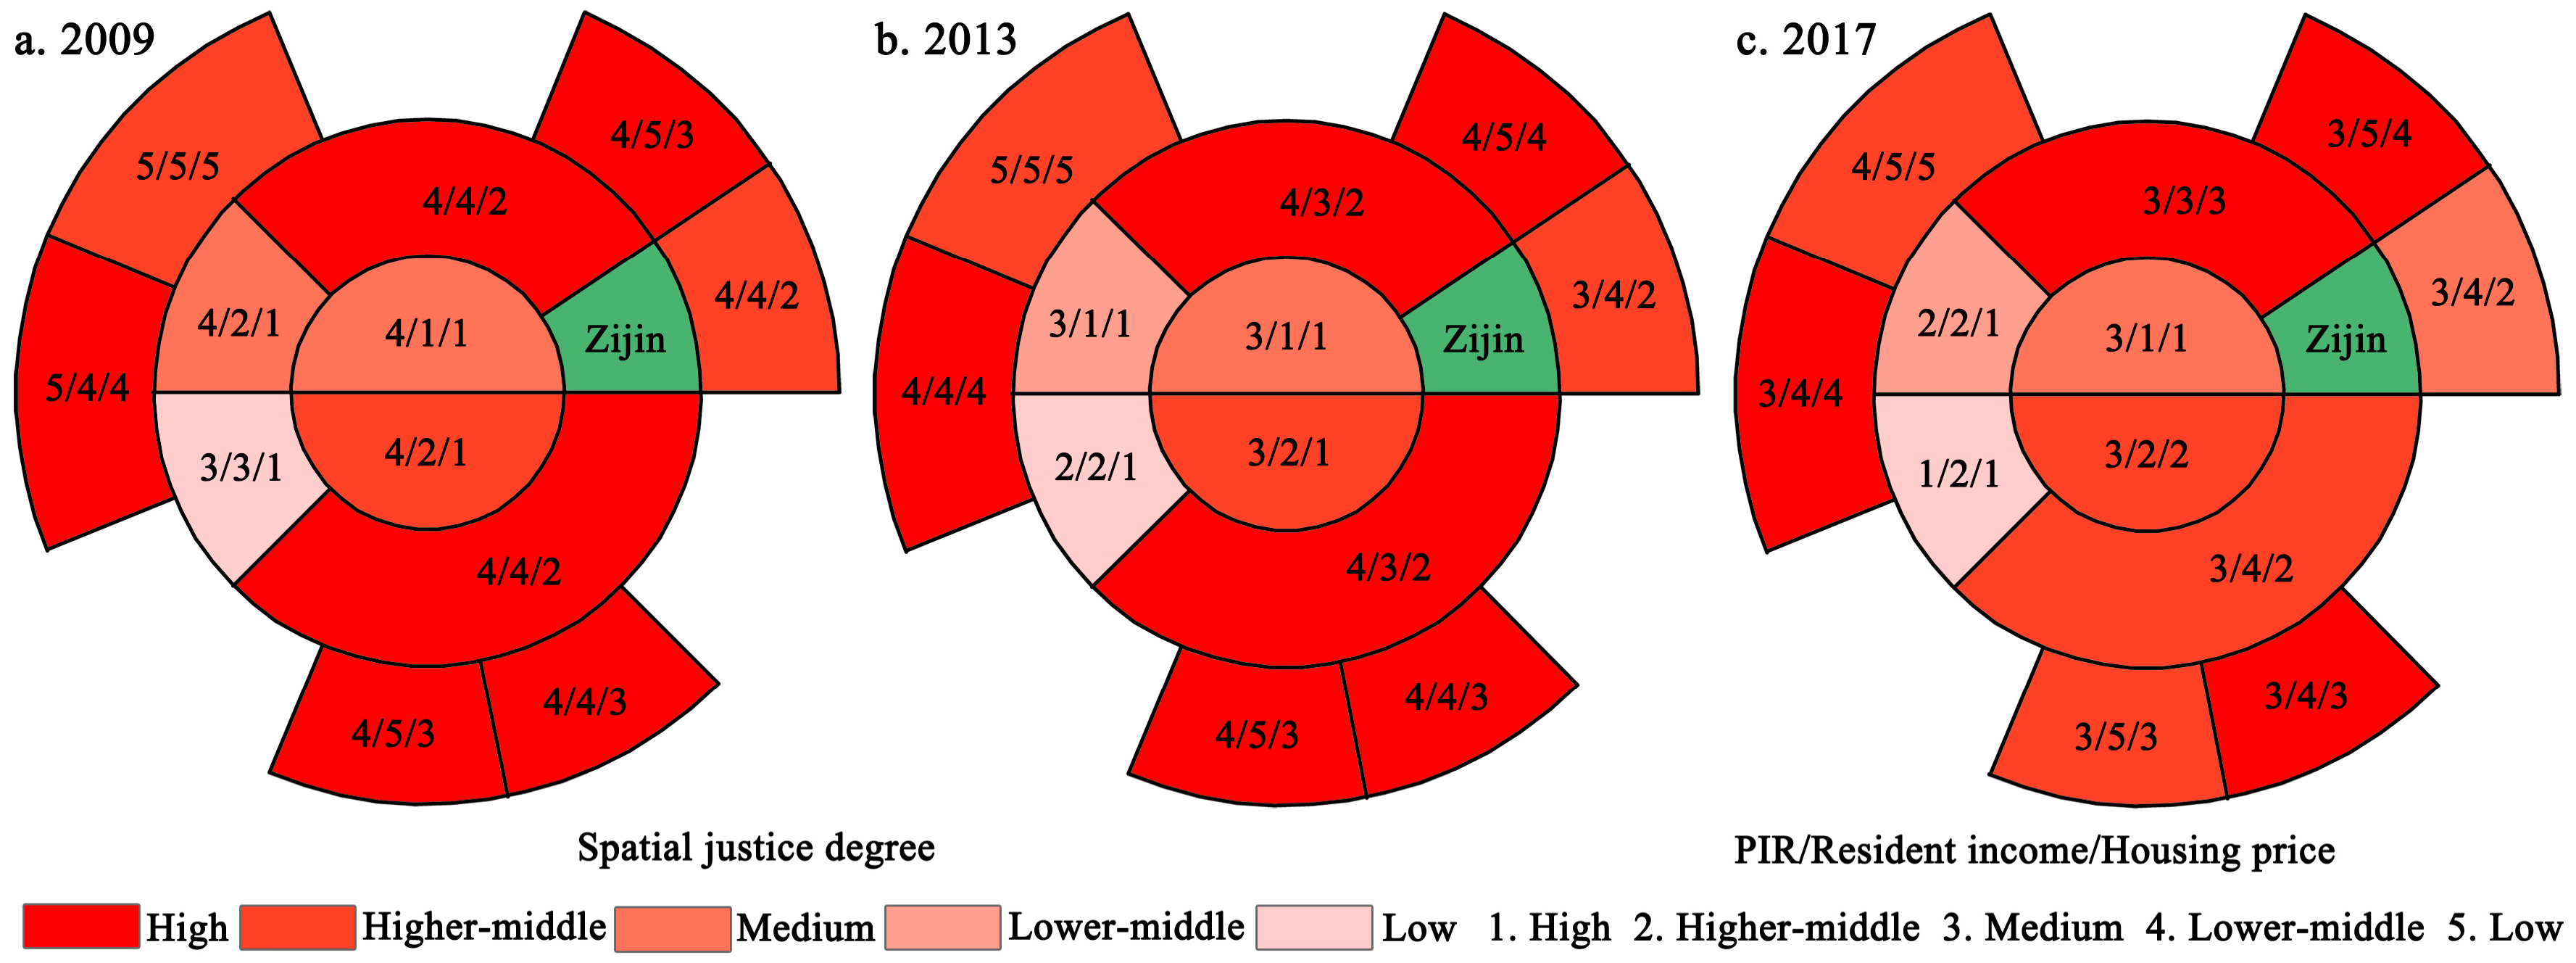
By dividing the housing spatial justice degree, housing price-to-income ratio, residents’ income, and housing prices in the one main urban area and three secondary urban areas considered into five levels, namely, high, mid-high, middle, mid-low, and low, this paper summarizes and constructs a spatial structure model of housing spatial justice degree, housing prices, and residents’ income in the one main urban area and three secondary urban areas of Nanjing which are considered (Figure 4). As seen from the form and evolution of its spatial matching, this model has the following characteristics:
- (1)
- Housing prices, residents’ income, and housing price-to-income ratio in the one main urban area and three secondary urban areas considered essentially present a “core-periphery” structure in which housing prices decrease progressively from famous school districts in the inner urban area and Hexi New Town as the center to surrounding areas; residents’ income tends to decrease progressively from the northern part of the inner urban area and neighboring Longjiang Area in Hexi New Town to the surrounding areas; and housing price-to-income ratio decreases progressively from Hexi New Town to other areas. The spatial pattern of spatial justice degree was seen to be somewhat different as it displayed a trend of progressive decrease from the secondary urban areas to the Main Urban Area. It could be concluded that the spatial distribution forms of housing prices, residents’ income, housing price-to-income ratio, and spatial justice in the one main urban area and three secondary urban areas of Nanjing which were considered are relatively stable.
- (2)
- The spatial pattern of housing prices was highly similar to that of income, that is, the areas with high housing prices were distributed among high-income residents, and the areas with low housing prices were distributed among low-income residents. Along with constant increases in housing prices, housing will place an increasingly high strain on residents’ economic resources and it will be increasingly difficult for poverty-stricken and vulnerable groups to obtain housing resources (especially those which are high-quality), further aggravating social stratification and the gap between the rich and the poor. In this way, the spatial inequality of housing will cause more serious social inequality.
- (3)
- The spatial justice degree presented a trend which was the opposite of that of the spatial pattern of the housing price-to-income ratio, that is, the areas with relatively strong housing affordability had a relatively high spatial justice degree, while the areas with relatively weak housing affordability had relatively low spatial justice. The housing price-to-income ratio and housing spatial justice degree clearly had different trend characteristics; the housing price-to-income ratio displayed a trend of accelerated rise on the whole, while the housing spatial justice degree presented a trend of accelerated decrease on the whole.
5. Discussion
Vigorously pushed by industrialization and urbanization, populations in multitudinous Chinese cities have grown greatly. Using Nanjing as an example, the proportion of Nanjing’s urban population in 2009–2017 rose from 77.2% to 82.29%, and during those eight years, the urban population increased by 907,500 while the annual building area of housing tended to drop [43,44]. This swift urban population growth not only aggravated difficulties for residents in obtaining housing but also stimulated the rise of housing prices. Along with an increasingly widening urban income gap and a deepening of the degree of housing marketization, urban under-privileged people (middle- and low-income groups and foreign migrant workers, etc.) have gradually displayed a trend of relative agglomeration in residential space. More specifically, under-privileged people are concentrated within sub-city fringe areas where the housing price-to-income ratio is relatively low and the housing spatial justice degree is relatively high; within the periphery of urban central areas, it will be impossible to obtain excess profit for reasons of real estate development, resulting in the decline of old areas and the formation of further slum areas. These under-privileged people cannot enjoy fair spatial resources or participate in the urban space production process, which induces the aggravation of poverty. In addition, in order to guarantee the residential rights and interests of middle- and low-income groups and improve the residential conditions of middle- and low-income residents, the central government has issued a series of policies and measures about indemnificatory housing and has brought the implementation of indemnificatory housing construction into the administrative assessment of local governments. This upsurge in indemnificatory housing construction has been gradually rising in various places. However, there are many problems with the construction of indemnificatory housing. In most cities, indemnificatory housing is constructed centrally on large-scale land areas within the periphery of main urban areas where the land price is low and the infrastructure is not sound. For example, the four indemnificatory housing areas in Nanjing (Daishan, Shangfang, Huagang, and Dingjiazhuang) are all located near the around-city highways within the periphery of the main urban area, and the spatial distribution of indemnificatory housing has been marginalized in the long term. Influenced by high housing prices and high housing price-to-income ratios, urban poor and vulnerable groups have been forced to move to urban fringe areas and suburbs, thus depriving these poor and vulnerable groups of their equal rights and interests with regard to living. Such space deprivation will cause a series of social problems, including social exclusion, class solidification, the alienation of compulsory education, and the integration into urban society of migrant workers and their children, especially. Along with the increasingly rising land prices and housing prices, the living spaces of poor and vulnerable groups will possibly shift further and further away from the Main Urban Area, causing additional aggravation to social problems such as the differentiation of residential space, the excessive separation of the workplace and residence, and the lowering of employment accessibility, thus inspiring people’s demands for spatial rights and interests and equal participation in urban space production.
In the period 2009–2017, housing prices in Nanjing grew by more than 170%, while urban residents’ income only grew by around 114% [43,44], that is, the growth rate of housing prices was by far higher than that of residents’ income, and the income gap between different income groups also displayed an expanding trend. Affected by factors such as educational background, labor skills, and affordability, urban poor and vulnerable groups are mostly involved in such employment as manual labor and service work, meaning there are numerous phenomena indicating a mismatch between living and employment spaces. In the inner urban area and Hexi New Town of Nanjing, the fast growth of housing prices and the housing price-to-income ratio is unaffordable for poor and vulnerable groups. In addition, the government is moving the middle- and low-income classes out of places like the inner urban area and Hexi New Town by means of “urban renewal”, which involves demolishing dangerous and older, traditional residential districts and subsequently reconstructing high-grade closed communities. The urban rich and middle classes gain relatively more economic capital and under the mechanisms of housing commercialization and housing price filtration [45], they gradually replace the original low-income social groups, thus occupying numerous houses in the inner urban area and Hexi New Town. These groups endow the neighborhood community with specific stratum culture attributes, realizing the so-called “social cleaning” of the poor and vulnerable classes in the inner urban area, also known as the “gentrification” phenomenon. “Super gentrification”, which involves the domination of the financial industry [46], “new-build gentrification”, involving the renewal of the inner urban area [47], “studentification” consisting of the domination of higher-level education resources [48], and “jiaoyufication”, which involves the domination of high-quality basic education resources [49], are also produced by these groups. The gentrification of China plays a positive role in sufficiently excavating the value of urban spatial capital, improving urban landscapes, curbing the decline of the inner urban area and the appearance of slums, and so on. However, just as there are “two sides of a coin”, urban gentrification will also arouse a series of social problems. Its stratum filtering mechanism will aggravate the degree of social polarization and isolation, deprive poor and vulnerable groups of their social and spatial interests, and thus produce social problems like the differentiation of living spaces and class solidification, which will cause inequality in social spaces.
The evolution of urban space occurs under the combined action of three mutually restrictive factors, namely, the government, society, and the market. In most cities in China, however, including Nanjing, space production is dominated by power and capital, while society and the market have a relatively weak influence and cannot carry out effective restriction of power and capital. Such governance mechanisms will also induce a lack of “spatial justice” in the space production and reconstruction of most cities. Therefore, to realize urban spatial justice, we must change the existing governmental governance mechanism, effectively restrict and supervise power, and in the meantime, encourage residents to actively participate in urban governance processes and urban space production.
6. Conclusions
Housing price-to-income ratio plays an important role in measuring residents’ housing affordability and real estate health conditions. This paper selected one main urban area and three secondary urban areas among the urban areas of Nanjing as research objects, analyzed the space-time pattern and evolution law of the housing price-to-income ratio in 2009–2017 based on the perspective of the housing price-to-income ratio, and constructed a model of housing spatial justice degree by using housing prices, residents’ income and the housing price-to-income ratio. In doing so, it obtained the following conclusion: the housing price-to-income ratio in the one main urban area and three secondary urban areas considered in this study tends to rise on the whole, and presents a core-periphery pattern of decreasing gradually from the inner main urban area to the peripheral secondary urban areas. The areas with high housing price-to-income ratio values have famous school districts and new urban centers as their core and Hexi-Xianlin as their main “shaft”, and extend in the northeast-southwest direction. Along with the rise in the housing price-to-income ratio, except for in Jiangbei Secondary Urban Area, the housing price-to-income ratio in other areas was observed to be more than 10, that is, the development of the housing market in the urban areas to the south of the Yangtze River has gradually exceeded residents’ housing affordability. The spatial justice degree spatial pattern and housing price-to-income ratio was seen to present a more or less opposite trend. The spatial justice degree decreases progressively from the secondary urban areas to the main urban area on the whole and displays obvious stage-like characteristics. The spatial justice degree tends to decrease in new town and secondary urban areas and tends to increase in the inner urban area and the periphery of the main urban area.
Overall, the growth rate of urban residents’ disposable income has been far lower than that of housing prices in Nanjing, meaning the housing price-to-income ratio has generally risen. Since the research period, the housing affordability of residents in each region of the one main urban area and three secondary urban areas selected in this study has been affected to various degrees. By 2017, the housing price-to-income ratio in the areas to the south of the Yangtze River was generally more than 10. Most families are under great pressure to purchase common commodity housing independently by relying on their own income and it has become increasingly impossible for middle- and low-income families to purchase housing in the one main urban area and three secondary urban areas considered here (except for in Jiangbei Secondary Urban Area). The housing price-to-income ratio of each residential district is affected by numerous factors such as business location, famous school district, traffic condition, and landscape resource. Hence, the government should guide reasonable housing demand and consumption modes, adopt a gradient consumption principle to transform housing consumption into a gradient consumable suitable for consumers’ own economic strength, and thus realize a future in which “residents have their own housing and live a contented life in their own housing”. In addition, it is still necessary for the income distribution policy to be improved and to further shorten the income gap of residents [50]. Along with the issuance of the Notification on Suspending the Sales of Commodity Housing to Enterprises, Public Institutions, and Other Institutions in Nanjing in August 2018, Nanjing has started a “four-restriction mode”, which includes price restriction, purchasing restriction, loan restriction, and sales restriction, thus causing it to become one of the cities executing the strictest control on the real estate market in China. It could be predicted that the growth rate of housing prices in Nanjing will be slow or even that housing prices will tend to drop, that is, the growth rate of residents’ income will exceed housing prices and the housing price-to-income ratio will gradually reach a reasonable level.
Urbanization is the process of urban production and reconstruction. However, in this process, strong urban government and capital occupy a leading position. Under the promotion and cover of growth, excessive pursuit of spatial economic benefits has resulted in a lack of justice value and institutional conditions, thus damaging the principle of spatial justice and causing urban spatial inequality, which involves the deprivation and isolation of space, the marginalization of vulnerable groups, and the over-capitalization of public spaces. Within this context, it is urgently necessary to reflect on urban space production and the role of the government in urban space production, with the value and principle of “spatial justice”, the making of cities more fitting for the value of spatial justice, and the realization of the harmonious development of urban society in mind. Spatial justice is the only way to achieve urban sustainable development and is also a basic principle that must be followed in urban space production.
This paper has mainly researched the space-time differentiation of urban residents’ housing price-to-income ratio and has not paid close attention to the space-time differentiation of the housing price-to-income ratio of different income classes. Middle- and low-income residents have low housing affordability, so it is necessary to strengthen research on the housing rent-to-income ratio of urban middle- and low-income groups. In addition, there is no uniform standard for the calculation of the housing price-to-income ratio at home and abroad, so some factors (such as residents’ consumption expenditure, the proportion of the first installment payment, bank loan interest rates, and building tax) which affect residents’ housing affordability have possibly been omitted in research on the housing price-to-income ratio here. The influences of these factors will be added in future research, so as to analyze the space-time differentiation law of the housing price-to-income ratio and residents’ housing affordability more accurately.
Author Contributions
W.S. and C.L. conceived and designed the experiments; S.Y. and Z.M. performed the experiments; S.Y. analyzed the data; S.Y. and Z.M. wrote the paper; and W.S. and C.L. revised and constructively commented on the paper.
Funding
The research was supported by the National Natural Science Foundation of China (no. 41671155 and no. 41771184), and the open fund of the Key Laboratory of Beibu Gulf Environmental Change and Resources Utilization under the Ministry of Education (no. 2015BGERLKF06).
Conflicts of Interest
The authors declare no conflict of interest.
References
- National Bureau of Statistics of China. China City Statistical Yearbook 2007; China Statistics Press: Beijing, China, 2007. (In Chinese)
- National Bureau of Statistics of China. China City Statistical Yearbook 2017; China Statistics Press: Beijing, China, 2017. (In Chinese)
- André, C.; Gil-Alana, L.A.; Gupta, R. Testing for persistence in housing price-to-income and price-to-rent ratios in 16 OECD countrie. Appl. Econ. 2014, 46, 2127–2138. [Google Scholar] [CrossRef]
- Zhang, C.C.; Jia, S.; Yang, R.D. Housing affordability and housing vacancy in China: The role of income inequality. J. Hous. Econ. 2016, 33, 4–14. [Google Scholar] [CrossRef]
- Hui, E.C.M.; Liang, C.; Wang, Z.; Song, B.T.; Gu, Q. Real estate bubbles in China: A tale of two cities. Constr. Manag. Econ. 2012, 30, 951–961. [Google Scholar] [CrossRef]
- Gan, Q.; Hill, R.J. Measuring housing affordability: Looking beyond the median. J. Hous. Econ. 2009, 18, 115–125. [Google Scholar] [CrossRef] [Green Version]
- Zhang, Q.Y. The origin, calculation and application of housing price to income ratio: An analysis based on literarure. Financ. Trade Econ. 2011, 32, 114–119. (In Chinese) [Google Scholar]
- Collstello, G.; Fraser, P.; Groenewold, N. House prices, non-fundamental components and interstate spillovers: The Australian experience. J. Bank. Financ. 2011, 35, 653–669. [Google Scholar] [CrossRef]
- Li, P.; Song, S.F. What pushes up China’s urban housing price so high? Chin. Econ. 2016, 49, 128–141. [Google Scholar] [CrossRef]
- Lau, K.M.; Li, S.M. Commercial housing affordability in Beijing, 1992-2002. Habitat Int. 2006, 30, 614–627. [Google Scholar] [CrossRef]
- Lin, Y.J.; Chang, C.O.; Chen, C.L. Why homebuyers have a high housing affordability problem: Quantile regression analysis. Habitat Int. 2014, 43, 41–47. [Google Scholar] [CrossRef]
- Hu, Y.; Oxley, L. Bubbles in US regional house prices: Evidence from house price-income ratios at the State level. Appl. Econ. 2018, 50, 3196–3229. [Google Scholar] [CrossRef]
- Liu, M.J.; Reed, R.; Hao, W. Challenges facing housing affordability in Beijing in the twenty-first century. Int. J. Hous. Mark. Anal. 2008, 1, 275–287. [Google Scholar]
- Leung, C.K.Y. Error correction dynamics of house prices: An equilibrium benchmark. J. Hous. Econ. 2014, 25, 75–95. [Google Scholar] [CrossRef] [Green Version]
- Chen, J.; Hao, Q.J.; Stephens, M. Assessing housing affordability in post-reform China: A case study of Shanghai. Hous. Stud. 2010, 25, 877–901. [Google Scholar] [CrossRef]
- Kim, A.M. The extreme primacy of location: Beijing’s underground rental housing market. Cities 2016, 52, 148–158. [Google Scholar] [CrossRef]
- Liu, Y.F.; Dijst, M.; Geertman, S. Residential segregation and well-being inequality over time: A study on the local and migrant elderly people in Shanghai. Cities 2015, 49, 1–13. [Google Scholar] [CrossRef]
- Li, S.W.; Ye, X.Y.; Lee, J.; Gong, J.F.; Qin, C.L. Spatiotemporal analysis of housing prices in China: A big data perspective. Appl. Spat. Anal. Policy 2017, 10, 421–433. [Google Scholar] [CrossRef]
- Madden, J.F.; Ruther, M. The paradox of expanding ghettos and declining racial segregation in large U.S. metropolitan areas, 1970–2010. J. Hous. Econ. 2018, 40, 117–128. [Google Scholar] [CrossRef]
- Davies, B.P. Social Needs and Resources in Local Services: A Study of Variations in Provision of Social Services between Local Authority Areas; Joseph Rowntree: London, UK, 1968. [Google Scholar]
- Harvey, D. Social Justice and the City; Edward Arnold: London, UK, 1973. [Google Scholar]
- Soja, E.W. Seeking Spatial Justice; The University of Minnesota Press: Minneapolis, MN, USA, 2010. [Google Scholar]
- Israel, E.; Frenkel, A. The distribution of capital forms between cities and suburbs and their impact on social justice in space. Urban Geogr. 2015, 36, 578–607. [Google Scholar] [CrossRef]
- Armstrong, F. Landscapes, spatial justice and learning communities. Int. J. Incl. Educ. 2012, 16, 609–626. [Google Scholar] [CrossRef]
- Hadjimichalis, C. Uneven geographical development and socio-spatial justice and solidarity: European regions after the 2009 financial crisis. Eur. Urban Reg. Stud. 2011, 18, 254–274. [Google Scholar] [CrossRef]
- Cutter, S.L.; Hodgson, M.E.; Dow, K. Subsidized Inequities: The spatial patterning of environmental risks and federally assisted housing. Urban Geogr. 2001, 22, 29–53. [Google Scholar] [CrossRef]
- Lefebvre, H. The Production of Space; Blackwell Publishing: Oxford, UK, 1991. [Google Scholar]
- Lu, X.C. Spatial production and governance mechanism of new urbanization: Based on the perspective of spatial justice. Urban Dev. Stud. 2016, 23, 94–100. (In Chinese) [Google Scholar]
- Wang, W.Y. The approach to realize space reproduction power and spatial justice for rural tourist areas: Deep analysis on Multiple cases the perspective of easement. Hum. Geogr. 2018, 33, 152–160. (In Chinese) [Google Scholar]
- Rodman, M.G.; Cooper, M. The sociocultural production of urban space: Building a fully accessible Toronto housing cooperative. City Soc. 1989, 3, 9–22. [Google Scholar] [CrossRef]
- Jonkman, A.; Janssen-Jansen, L.; Schilder, F. Rent increase strategies and distributive justice: The socio-spatial effects of rent control policy in Amsterdam. J. Hous. Built Environ. 2018, 33, 653–673. [Google Scholar] [CrossRef] [PubMed]
- Rigolon, A.; Browning, M.; Jennings, V. Inequities in the quality of urban park systems: An environmental justice investigation of cities in the United States. Landsc. Urban Plan. 2018, 178, 156–169. [Google Scholar] [CrossRef]
- Walker, G. Beyond distribution and proximity: Exploring the multiple spatialities of environmental justice. Antipode 2009, 41, 614–636. [Google Scholar] [CrossRef]
- Gao, J.L.; Chen, J.L.; Yuan, F.; Wei, Y.D.; Chen, W. Patterns, functions and underlying mechanisms of urban land expansion in Nanjing. Geogr. Res. 2014, 33, 1892–1907. (In Chinese) [Google Scholar]
- Song, W.X.; Wu, Q.Y.; Zhu, X.G. Residential differentiation of Nanjing in the new period. Acta Geogr. Sin. 2010, 65, 685–694. (In Chinese) [Google Scholar]
- Li, P.L.; Zhu, D. Make efforts to develop an olice-shaped distribution pattern: An analysis based on data from the Chinese social survey for 2006–2013. Soc. Sci. China 2016, 37, 5–24. [Google Scholar]
- Li, Y.S.; Li, A.H.; Wang, Z.F.; Wu, Q. Analysis on Housing Affordability of Urban Residents in Mainland China Based on Multiple Indexes: Taking 35 Cities as Examples. Annals of Data Science. Available online: https://doi.org/10.1007/s40745-018-0168-x (accessed on 19 June 2018).
- Duncan, O.D.; Duncan, B. A methodological analysis of segregation indexes. Am. Sociol. Rev. 1955, 20, 210–217. [Google Scholar] [CrossRef]
- Yin, S.G.; Song, W.X.; Ma, Z.F.; Li, Z.J.; Wu, Q.Y. Spatial differentiation and influencing factors analysis of housing prices in Nanjing: Based on geographically weighted regression model. Hum. Geogr. 2018, 33, 68–77. (In Chinese) [Google Scholar]
- Kuntz, M.; Helbich, M. Geostatistical mapping of real estate prices: An empirical comparison of kriging and cokriging. Int. J. Geogr. Inf. Sci. 2014, 28, 1904–1921. [Google Scholar] [CrossRef]
- Hadi, S.J.; Tombul, M. Comparison of spatial interpolation methods of precipitation and temperature using multiple integration periods. J. Indian Soc. Remote Sens. 2018, 46, 1187–1199. [Google Scholar] [CrossRef]
- Song, W.X.; Mao, N.; Chen, P.Y.; Yuan, Y.Q.; Wang, Y. Coupling mechanism and spatial-temporal pattern of residential differentiation from the perspective of housing prices: A case study of Nanjing. Acta Geogr. Sin. 2017, 72, 589–602. (In Chinese) [Google Scholar]
- Nanjing Municipal Bureau of Statistics. Statistical Yearbook of Nanjing 2010; China Statistics Press: Beijing, China, 2010. (In Chinese)
- Nanjing Municipal Bureau of Statistics. Statistical Yearbook of Nanjing 2018; China Statistics Press: Beijing, China, 2018. (In Chinese)
- Yilmaz, K. The role of government in regentrification. Pap. Reg. Sci. 2019, 98, 575–594. [Google Scholar] [CrossRef]
- Lees, L. Super-gentrification: The case of Brooklyn Heights, New York city. Urban Stud. 2003, 40, 2487–2509. [Google Scholar] [CrossRef]
- Davidson, M.; Lees, L. New-build ‘gentrification’ and London’s riverside renaissance. Environ. Plan. A 2005, 37, 1165–1190. [Google Scholar] [CrossRef]
- Smith, D.P.; Holt, L. Studentification and ‘apprentice’ gentrifiers within Britain’s provincial towns and cities: Extending the meaning of gentrification. Environ. Plan. A 2007, 39, 142–161. [Google Scholar] [CrossRef]
- Wu, Q.Y.; Zhang, X.L.; Waley, P. Jiaoyufication: When gentrification goes to school in the Chinese inner city. Urban Stud. 2016, 53, 3510–3526. [Google Scholar] [CrossRef] [Green Version]
- Leung, C.K.Y.; Sarpca, S.; Yilmaz, K. Public housing units vs. housing vouchers: Accessibility, local public goods, and welfare. J. Hous. Econ. 2012, 21, 310–321. [Google Scholar] [CrossRef] [Green Version]
Figure 1.
Location of the study area and its administrative units.

Figure 2.
The spatial differentiation patterns of PIR values of urban households in Nanjing: 2009 PIR (a); 2013 PIR (b); 2017 PIR (c).
Figure 2.
The spatial differentiation patterns of PIR values of urban households in Nanjing: 2009 PIR (a); 2013 PIR (b); 2017 PIR (c).

Figure 3.
Spatial distribution patterns of the spatial justice degree of urban households in Nanjing: 2009 spatial justice degree (a); 2013 spatial justice degree (b); 2017 spatial justice degree (c).
Figure 3.
Spatial distribution patterns of the spatial justice degree of urban households in Nanjing: 2009 spatial justice degree (a); 2013 spatial justice degree (b); 2017 spatial justice degree (c).

Figure 4.
Spatial differentiation and evolution model of spatial justice degree of urban households in Nanjing.
Figure 4.
Spatial differentiation and evolution model of spatial justice degree of urban households in Nanjing.


Table 1.
Residential district distribution in the researched area.
| Region | Main Urban Area | Jiangbei Secondary Urban Area | Xianlin Secondary Urban Area | Dongshan Secondary Urban area | Total | ||
|---|---|---|---|---|---|---|---|
| Inner Urban Area | Hexi New Town | Periphery of Main Urban Area | |||||
| Number of sample (pcs) | 489 | 339 | 470 | 204 | 105 | 226 | 1833 |
| Proportion of sample (%) | 26.7 | 18.5 | 25.6 | 11.1 | 5.7 | 12.3 | 100 |
Table 2.
Characteristics of residential prices and the housing price-to-income ratio (PIR) in Nanjing in 2009, 2013, and 2017.
Table 2.
Characteristics of residential prices and the housing price-to-income ratio (PIR) in Nanjing in 2009, 2013, and 2017.
| Region | 2009 | 2013 | 2017 | |||
|---|---|---|---|---|---|---|
| Housing Price | PIR | Housing Price | PIR | Housing Price | PIR | |
| Inner urban area | 12,501 | 9.09 | 19,841 | 10.76 | 29,584 | 13.29 |
| Hexi New Town | 12,083 | 9.49 | 21,326 | 12.48 | 34,573 | 15.75 |
| Periphery of the Main Urban Area | 9701 | 7.80 | 16,004 | 9.55 | 25,730 | 11.76 |
| Jiangbei Secondary Urban Area | 4948 | 4.39 | 8509 | 5.55 | 16,725 | 8.37 |
| Xianlin Secondary Urban Area | 8441 | 7.35 | 14,449 | 9.30 | 25,074 | 12.60 |
| Dongshan Secondary Urban Area | 7439 | 6.93 | 12,642 | 8.63 | 23,905 | 12.46 |
| Total | 10,052 | 7.97 | 16,747 | 9.87 | 27,214 | 12.41 |
Note: Housing price refers to the actual average transaction price of housing, with yuan/m2 as the unit.
© 2019 by the authors. Licensee MDPI, Basel, Switzerland. This article is an open access article distributed under the terms and conditions of the Creative Commons Attribution (CC BY) license (http://creativecommons.org/licenses/by/4.0/).
Share and Cite
MDPI and ACS Style
Yin, S.; Ma, Z.; Song, W.; Liu, C. Spatial Justice of a Chinese Metropolis: A Perspective on Housing Price-to-Income Ratios in Nanjing, China. Sustainability 2019, 11, 1808. https://doi.org/10.3390/su11061808
AMA Style
Yin S, Ma Z, Song W, Liu C. Spatial Justice of a Chinese Metropolis: A Perspective on Housing Price-to-Income Ratios in Nanjing, China. Sustainability. 2019; 11(6):1808. https://doi.org/10.3390/su11061808
Chicago/Turabian StyleYin, Shanggang, Zhifei Ma, Weixuan Song, and Chunhui Liu. 2019. "Spatial Justice of a Chinese Metropolis: A Perspective on Housing Price-to-Income Ratios in Nanjing, China" Sustainability 11, no. 6: 1808. https://doi.org/10.3390/su11061808
Note that from the first issue of 2016, this journal uses article numbers instead of page numbers. See further details here.