A Retrospective Comparison of Water Quality Treatment in a Bioretention Cell 16 Years Following Initial Analysis


Department of Biological and Agricultural Engineering, North Carolina State University, Campus Box 7625, Raleigh, NC 27695, USA
*
Author to whom correspondence should be addressed.
Sustainability 2019, 11(7), 1945; https://doi.org/10.3390/su11071945
Submission received: 18 March 2019
/
Revised: 29 March 2019
/
Accepted: 29 March 2019
/
Published: 2 April 2019
(This article belongs to the Special Issue Green Stormwater Infrastructure for Sustainable Urban and Rural Development)
Abstract
:One of the most popular stormwater practices in (sub-)urban North Carolina is bioretention. While bioretention has been researched intensively to determine the most efficient designs, few long-term studies have attempted to assess the performance of older bioretention. However, previous research and design guidance for bioretention has predicted long-term water quality treatment. This study compared discharged concentrations and loads of nitrogen and phosphorus from a bioretention cell (1) post-construction and (2) following 17 years of treatment. A conventionally-drained bioretention cell with lateral underdrains in Chapel Hill, North Carolina, USA, was first monitored post-construction for 10-months from 2002–2003 and, again following continuous use, for 14 months from 2017–2018. Estimated mass load reductions during the initial monitoring period were 40% for total nitrogen (TN) and 65% for total phosphorus (TP). Mass load reductions were increased 17 years after construction, with reductions of 72% and 79% for TN and TP, respectively. Plant growth, death, and decay over the 17-year life of the bioretention cell are hypothesized to have contributed additional nitrogen assimilation and carbon to the fill media, serving as a catalyst for nitrogen treatment. Phosphorus removal remained relatively unchanged between the two monitoring periods. Filter media samples indicated the top 20 cm of filter media were nearing phosphorus saturation, but with 1.2 m of filter media, lower depths would most likely continue to provide treatment. If designed, built, and maintained correctly, bioretention appears to provide sustained treatment of stormwater runoff for nitrogen and phosphorus for nearly two decades, and likely longer.
1. Introduction
To ameliorate deleterious environmental impacts of urbanization, developers utilize low impact development (LID) practices to reduce stormwater runoff and treat stormwater on-site to improve downstream water quality [1]. By employing decentralized treatment via detention and infiltration, LID practices have been shown to reduce stormwater runoff volumes, nutrient loading, and sediment loading compared to traditional stormwater practices [2,3,4].
First developed in the early 1990’s, bioretention is now one of the most popular LID stormwater control measures (SCMs) in the United States and Australasia as research has demonstrated success in meeting both hydrologic and water quality goals in laboratory and field settings [5,6,7,8,9,10]. Bioretention cells (BRCs) are a (depressed) landscape feature; underlying the landscape is engineered filter media, and in many cases, an underdrainage system [9]. Stormwater runoff fills the BRC bowl while simultaneously infiltrating into the filter media. Runoff stored within the BRC either exits via exfiltration to in-situ soils, is discharged through an underdrainage system, or evapotranspires. BRC filter media guidance varies by state and country. However, a typical filter media consists of a mixture of predominantly sand with native soil, gravel, and an electron donor (e.g., organic matter) [9]. Per its design, bioretention employs adsorption, filtration, sedimentation, volatilization, ion exchange, and biological decomposition [9].
While bioretention has been researched intensively to determine the most efficient design with respect to media depth, media selection, vegetative cover, drainage configuration, ponding depth, and capture volume [9], few long-term studies have assessed the function of older BRCs. Previous research and design guidance for BRCs, however, does predict long-term water quality treatment. Komlos and Traver [11] reported sustained orthophosphate (OP) removal over a nine year monitoring period from a rain garden in Philadelphia, PA. The authors observed P saturation within the top 10 cm of filter media after nine years, but estimated that saturation of deeper depths would not occur for 20 years [11]. Similarly, Johnson and Hunt [12] described elevated concentrations of phosphorus, zinc, and copper in the filter media of an 11-year-old BRC, but predicted sustained removal with routine maintenance. Willard et al. [13] compared post-construction pollutant removal in a BRC with that which occurred following seven years of service and noted removal of nutrients and sediment during both monitoring periods. This limited research suggests BRCs could still be performing as originally designed, if not better.
The research presented herein explores changes in the performance of a BRC with age. Discharged concentrations and loads of nitrogen and phosphorus are compared for one BRC (1) post-construction as previously reported by Hunt et al. [14] and then (2) following 17 years of service.
2. Methodology
2.1. Site Description
A bioretention cell was constructed in Chapel Hill, NC, USA, at the University Mall shopping center (35°5539.0 N, 79°0129.6 W), in Fall 2001 to treat parking lot stormwater runoff (Figure 1; Table 1). The original drainage area consisted entirely of a 0.06-hectare asphalt parking lot, but was resurfaced between the initial and second (post-17 years) monitoring periods, resulting in an enlarged watershed of 0.11 hectares for the second monitoring period. While the drainage area nearly doubled, the BRC was initially oversized, designed to capture and store 95 mm of precipitation within the surface storage bowl. Conventional design suggests runoff from 25 mm of rainfall be captured [9]. The BRC was constructed over low permeability hydrologic soil group (HSG) D, white store-urban land complex, soils [15].
The surface area of the BRC was 90 m with a surface storage depth of 10 cm. The BRC was excavated to a depth of 1.2 m and filled with a sandy filter media sourced from a local quarry. Shortly after construction, filter media saturated hydraulic conductivity was 3.3–7.6 cm/h, and the media was low in bioavailable P (3.7–11.1 mg Mehlich-3 P/kg filter media). The BRC was drained using two lateral 10 cm underdrains installed beneath the filter media. The surface was mulched and planted with perennial grasses, shrubs, and trees (Figure 1).
2.2. Monitoring
The Chapel Hill (CH) BRC was monitored for hydrology and water quality during both monitoring periods. Hydrologic data were used to calculate pollutant loads. As Hunt et al. [14] monitored the CH BRC 16 years prior to the second period, monitoring technology differed, but techniques remained constant between monitoring periods.
During the initial monitoring period (June 2002–April 2003), rainfall data were collected using a tipping bucket RG600™ rain gauge. American Sigma900 Max™ automatic samplers were coupled with pressure transducers to calculate flow over v-notch weirs at both the inlet to the BRC (120°) and from a weir box (30°) attached to the outlet of the underdrain system. Influent and effluent samples were collected on a flow-weighted basis and composited following each storm event.
During the second monitoring period (February 2017–March 2018), rainfall data were collected with a ISCO model 674 tipping bucket rain gauge and checked for accuracy with a manual plastic rain gauge. Inflow and underdrain flow were measured with ISCO 730 bubbler modules and a 90° sharp crested v-notch weir at the inlet to the BRC and a 45° sharp crested v-notch weir on a weir box attached to the outlet of the underdrain system. Onset HOBO U20 water level loggers were installed from February–March 2018 to monitor internal water levels and calculate media infiltration rates. While overflow was not directly measured during either study, overflow volumes for load calculations were estimated using routing methods described by Malcom [16]. Composite water quality samples were taken on a flow proportional volumetric basis using ISCO 6712 portable samplers.
For both monitoring periods, rainfall events were defined as a minimum of 5 mm of rainfall, having a minimum antecedent dry period of 6 h. Water quality samples were collected within 36 h of rainfall cessation. Water quality samples were placed on ice and immediately transported to a nearby laboratory for analysis. During the second monitoring period, samples were analyzed at the Environmental Analysis Laboratory at NC State University for total ammoniacal nitrogen (TAN), nitrate/nitrite nitrogen (NO3-N), total Kjeldahl nitrogen (TKN), total phosphorus (TP), and orthophosphate (OP). Total nitrogen (TN), organic nitrogen (ON), and particulate bound phosphorus (PBP) were calculated (Table 2).
In February 2018, seven soil samples were collected from the filter media following the standard method for sampling with a scoop [17]. The BRC surface was cleared of debris, and samples were taken from the top 20 cm of filter media following guidance by Li and Davis [18]. Samples were placed in individual sealable plastic bags and labeled with site location. Samples were analyzed at the Environmental Analysis Laboratory at NC State University for bulk density, pH, TP, and carbon:nitrogen (C:N) ratio.
2.3. Data Analysis
Influent and effluent event mean concentrations (EMCs) were compared to assess pollutant removal during each sampled storm event using the efficiency ratio (ER), calculated as,
where is the influent event mean concentration and is the effluent event mean concentration.
Flow data were analyzed in ISCO Flowlink® software to calculate flow volumes. Individual storm loads were then calculated using Equation (2).
where is the observed EMC (mg/L) for a particular storm at either the inlet or outlet sampling location and is storm-associated flow volume (L).
Cumulative loads were normalized by annual rainfall using Equation (3).
where is the observed or event median concentration (mg/L), is the runoff or outflow volume (L), is the drainage area of the BRC (ha), is the normal annual rainfall in Chapel Hill, NC (1129 mm [19]), and is the measured rainfall during each monitoring period (mm).
Statistical analyses were performed using R statistical software [20]. Data were inspected for normality and log-normality visually and by using the Shapiro–Wilk, Anderson–Darling, and Cramer–von Mises tests for normality. Data were uniformly non-normal, and statistical comparisons utilized Wilcoxon signed rank non-parametric statistical analyses. Differences were considered significant at = 0.05.
3. Results and Discussion
During the initial monitoring period (June 2002–April 2003), Hunt et al. [14] collected water quality samples from ten events with precipitation ranging from 17.3 to 58.4 mm. Median EMCs were reduced for TAN and OP, while median EMCs increased for TKN, NO3-N, TN, ON, and TP (Figure 2 and Figure 3; Table 3). Median PBP EMCs were unchanged. Median TN and TP EMCs increased by 38% and 21%, respectively. Using observed EMCs and volumes for runoff and outflow samples, Hunt et al. [14] were able to estimate 10 month loads for nitrogen and phosphorus species. Estimated annual mass loads exported during the initial monitoring period were calculated as 3.2 kg/ha/year and 0.4 kg/ha/year for TN and TP, respectively. The BRC provided 40% and 65% reductions in TN and TP loads, respectively. Mass load of nitrate was reduced by only 13.2%. These observations were in line with other research at the time which demonstrated variable removal of TN from BRCs, yet suggested that BRCs could reduce loads via volume reduction [21,22,23,24].
During the second monitoring period (February 2017–March 2018), 18 separate storm events were sampled for water quality, with individual storm precipitation ranging from 5.6 to 50.8 mm. Statistically significant reductions (p < 0.05) in EMCs were observed for TAN, NO3-N, TN, and TP (Figure 2 and Figure 3; Table 3). Annual TN and TP loads exported from the BRC during the return period were 5.0 kg/ha/year and 0.4 kg/ha/year, respectively, and represented percent reductions of 72% and 79%. NO3-N loads during the return period were reduced by 84%.
Based upon these two monitoring periods, N and P removal improved over time (Table 3). Although annual TN loads exported from the BRC increased between the initial and second monitoring periods, it should be noted that TN loads into the BRC increased from an annualized 5.4 kg/ha/year during the initial monitoring period to 17.8 kg/ha/year during the second monitoring period, mainly because the watershed size was much larger for a similar amount of rain (1063.1 mm initial vs. 924.6 mm second). Regardless, mass removal rates for both TN and TP were higher during the 2017–2018 monitoring period. This BRC might typify sustainable treatment for extended periods of time, with the caveat of regular maintenance [11,12,25].
When compared to target thresholds for ambient water quality vis-à-vis benthos species in the Piedmont of NC [26], the Chapel Hill BRC performed better for TP and the same for TN after 17 years of maturation compared to when it was initially monitored (Figure 4 and Figure 5). For TN, effluent EMCs exceeded the “good” threshold for approximately 55–57% of storm events for both monitoring periods (Figure 4). Effluent TP EMCs met target thresholds for 36% initially, but increased to 57% after 17 years. Results from the latter period compare favorably to studies from newer BRCs [21,27,28].
3.1. Nitrate
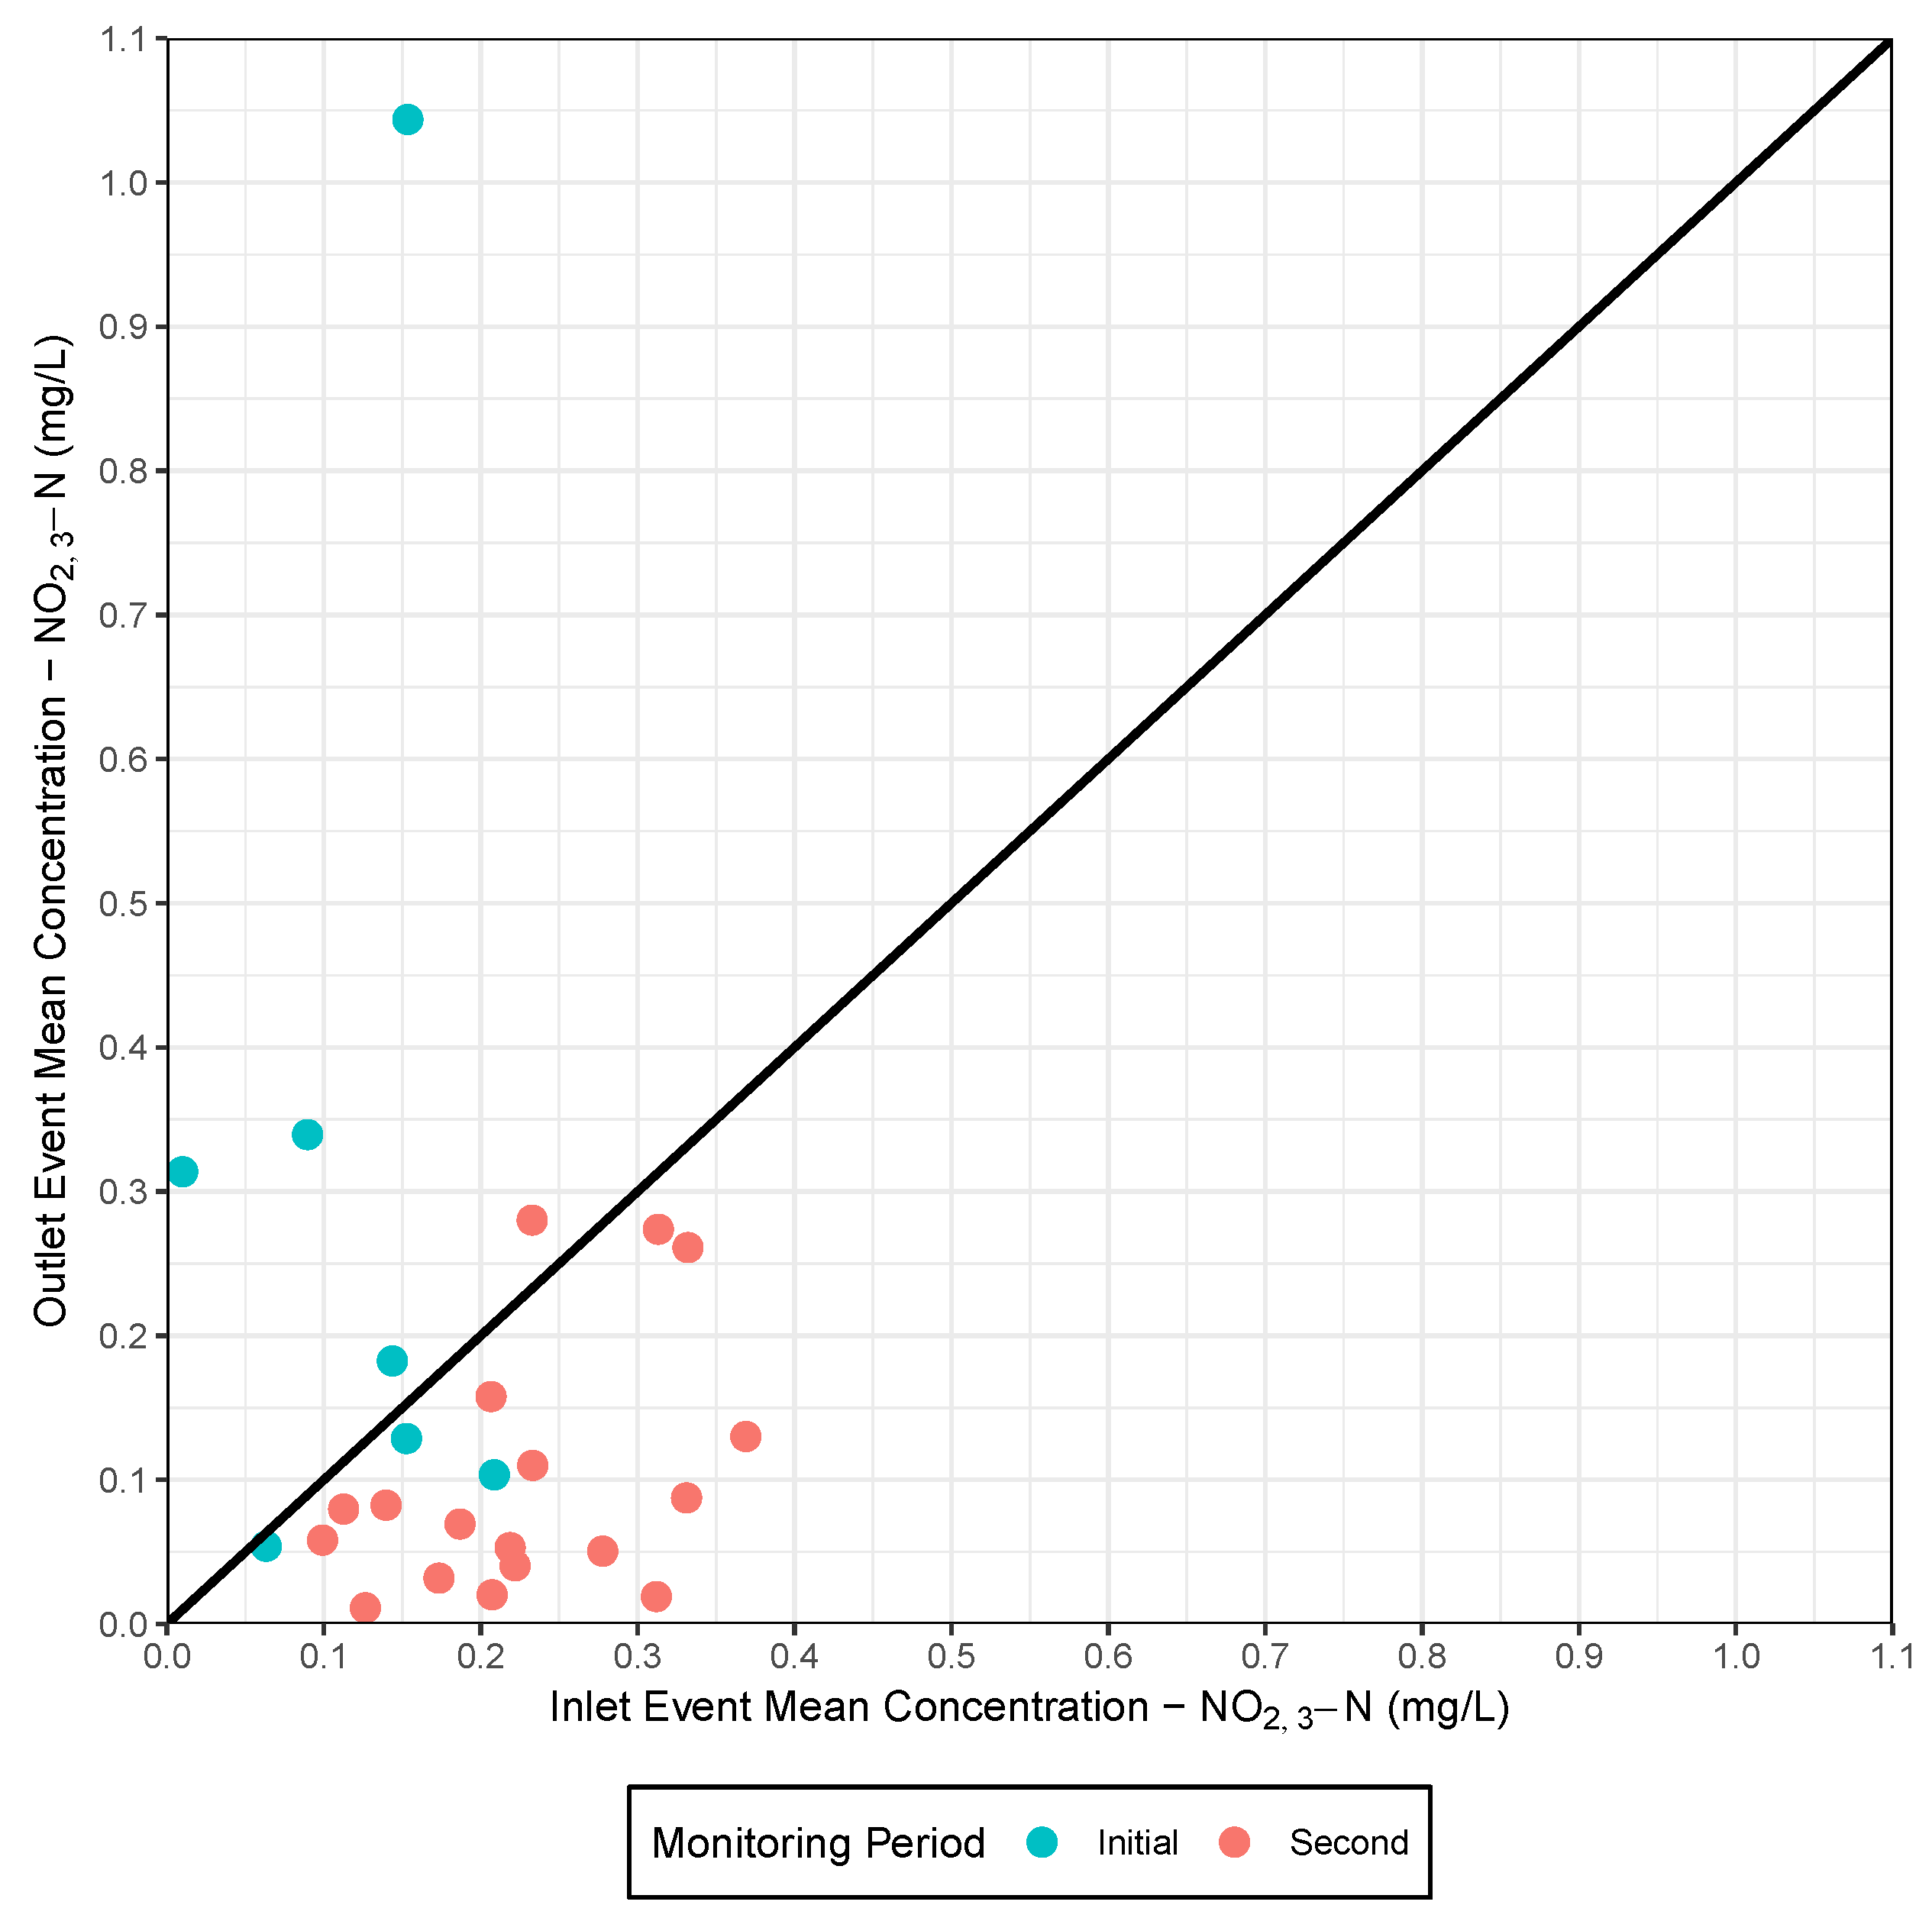
A noteworthy improvement between the two monitoring periods was observed for NO3-N. During the initial monitoring period NO3-N mass removal was 13%; this jumped to 86% 17 years post-construction. The median effluent NO3-N concentration in 2002–2003 was 0.18 mg/L; while that of the second period was 0.08 mg/L. During the initial monitoring period, effluent nitrate concentrations exceeded influent concentrations for four of seven observed events, yet in 2017–2018, effluent concentrations exceeded influent concentrations for only one of 18 events (Figure 6). It is postulated that nitrate conversion is attributed to (1) increased N uptake following maturation of vegetation in the BRC and/or (2) cycling of plant material through the fill media of the BRC which increased media carbon content (a necessary component for denitrification).
The importance of maturation vis-à-vis denitrification has been demonstrated for another vegetated SCM [29]. Assimilation has been shown to be a key component in BRC nitrogen removal [10,30,31,32], representing up to 88% of nitrate removal [30]. The steady growth of vegetation, as evidenced in Figure 1, provides a greater opportunity for the uptake of nitrogen. A key consideration for sustained removal of nitrogen via vegetative uptake is maintenance of vegetation. Vegetation of the CH BRC received regular pruning and landscaping, following the guidance of Payne et al. [30]; regular vegetation maintenance prevents the release of nitrogen via senescence and extends plant nitrogen demand by removing sources of internal N cycling. Further, mature vegetation will have a greater root mass than when first planted and may provide greater N removal due to a larger surface area for nutrient uptake and microbial communities [31]. Seasonal cycling of decaying plant matter into the soil media will also provide an optimal environment for nitrogen-fixing microbes [33]. Microbial communities provide rapid sequestration of nitrogen and can outcompete vegetation for nitrogen [34]. Increasing vegetation and root density may also provide additional opportunities for denitrification within the rhizosphere of BRC plants [35].
Plant growth, death, and decay over the 17-year life of the BRC likely contributed carbon to the fill media, a catalyst for denitrification [36]. While the CH BRC is conventionally drained, denitrification still occurs within microsites of saturated fill media [10,37].
Seven soil samples were taken from the fill media to quantify carbon content. The carbon to nitrogen ratio (C:N) ranged from 6.4 to 11.6 with a mean C:N of 8.8 ± 2.0, both of which are less than a maximum C:N of 44 observed in a seven year-old BRC in Virginia [13], but similar to those found in cultivated soils [38]. The average carbon content of the media was 0.67%. Initial C:N values for the fill media during installation were not available, but the media was a sandy media mined from a local quarry [14]. Considering that Peterson et al. [39] suggest an optimal soil media carbon content of 4.5% by weight to promote denitrification, nitrate removal is poised to continue at the Chapel Hill BRC as additional carbon is introduced to the filter media over time.
Willard et al. [13] examined denitrifying bacteria populations within a seven-year-old BRC in Virginia, finding that despite the presence of a dedicated anoxic zone for denitrification, the greatest populations of denitrifying bacteria were located in the surface layers of the BRC. The authors hypothesized that the abundance of carbon and organic material at the surface would result in preferential denitrification there. As a 10–15 cm layer of organic matter had accumulated at the surface of the CH BRC, it is possible that conditions within the upper layers of the CH BRC surface became more favorable to denitrification due to maturation.
3.2. Phosphorus
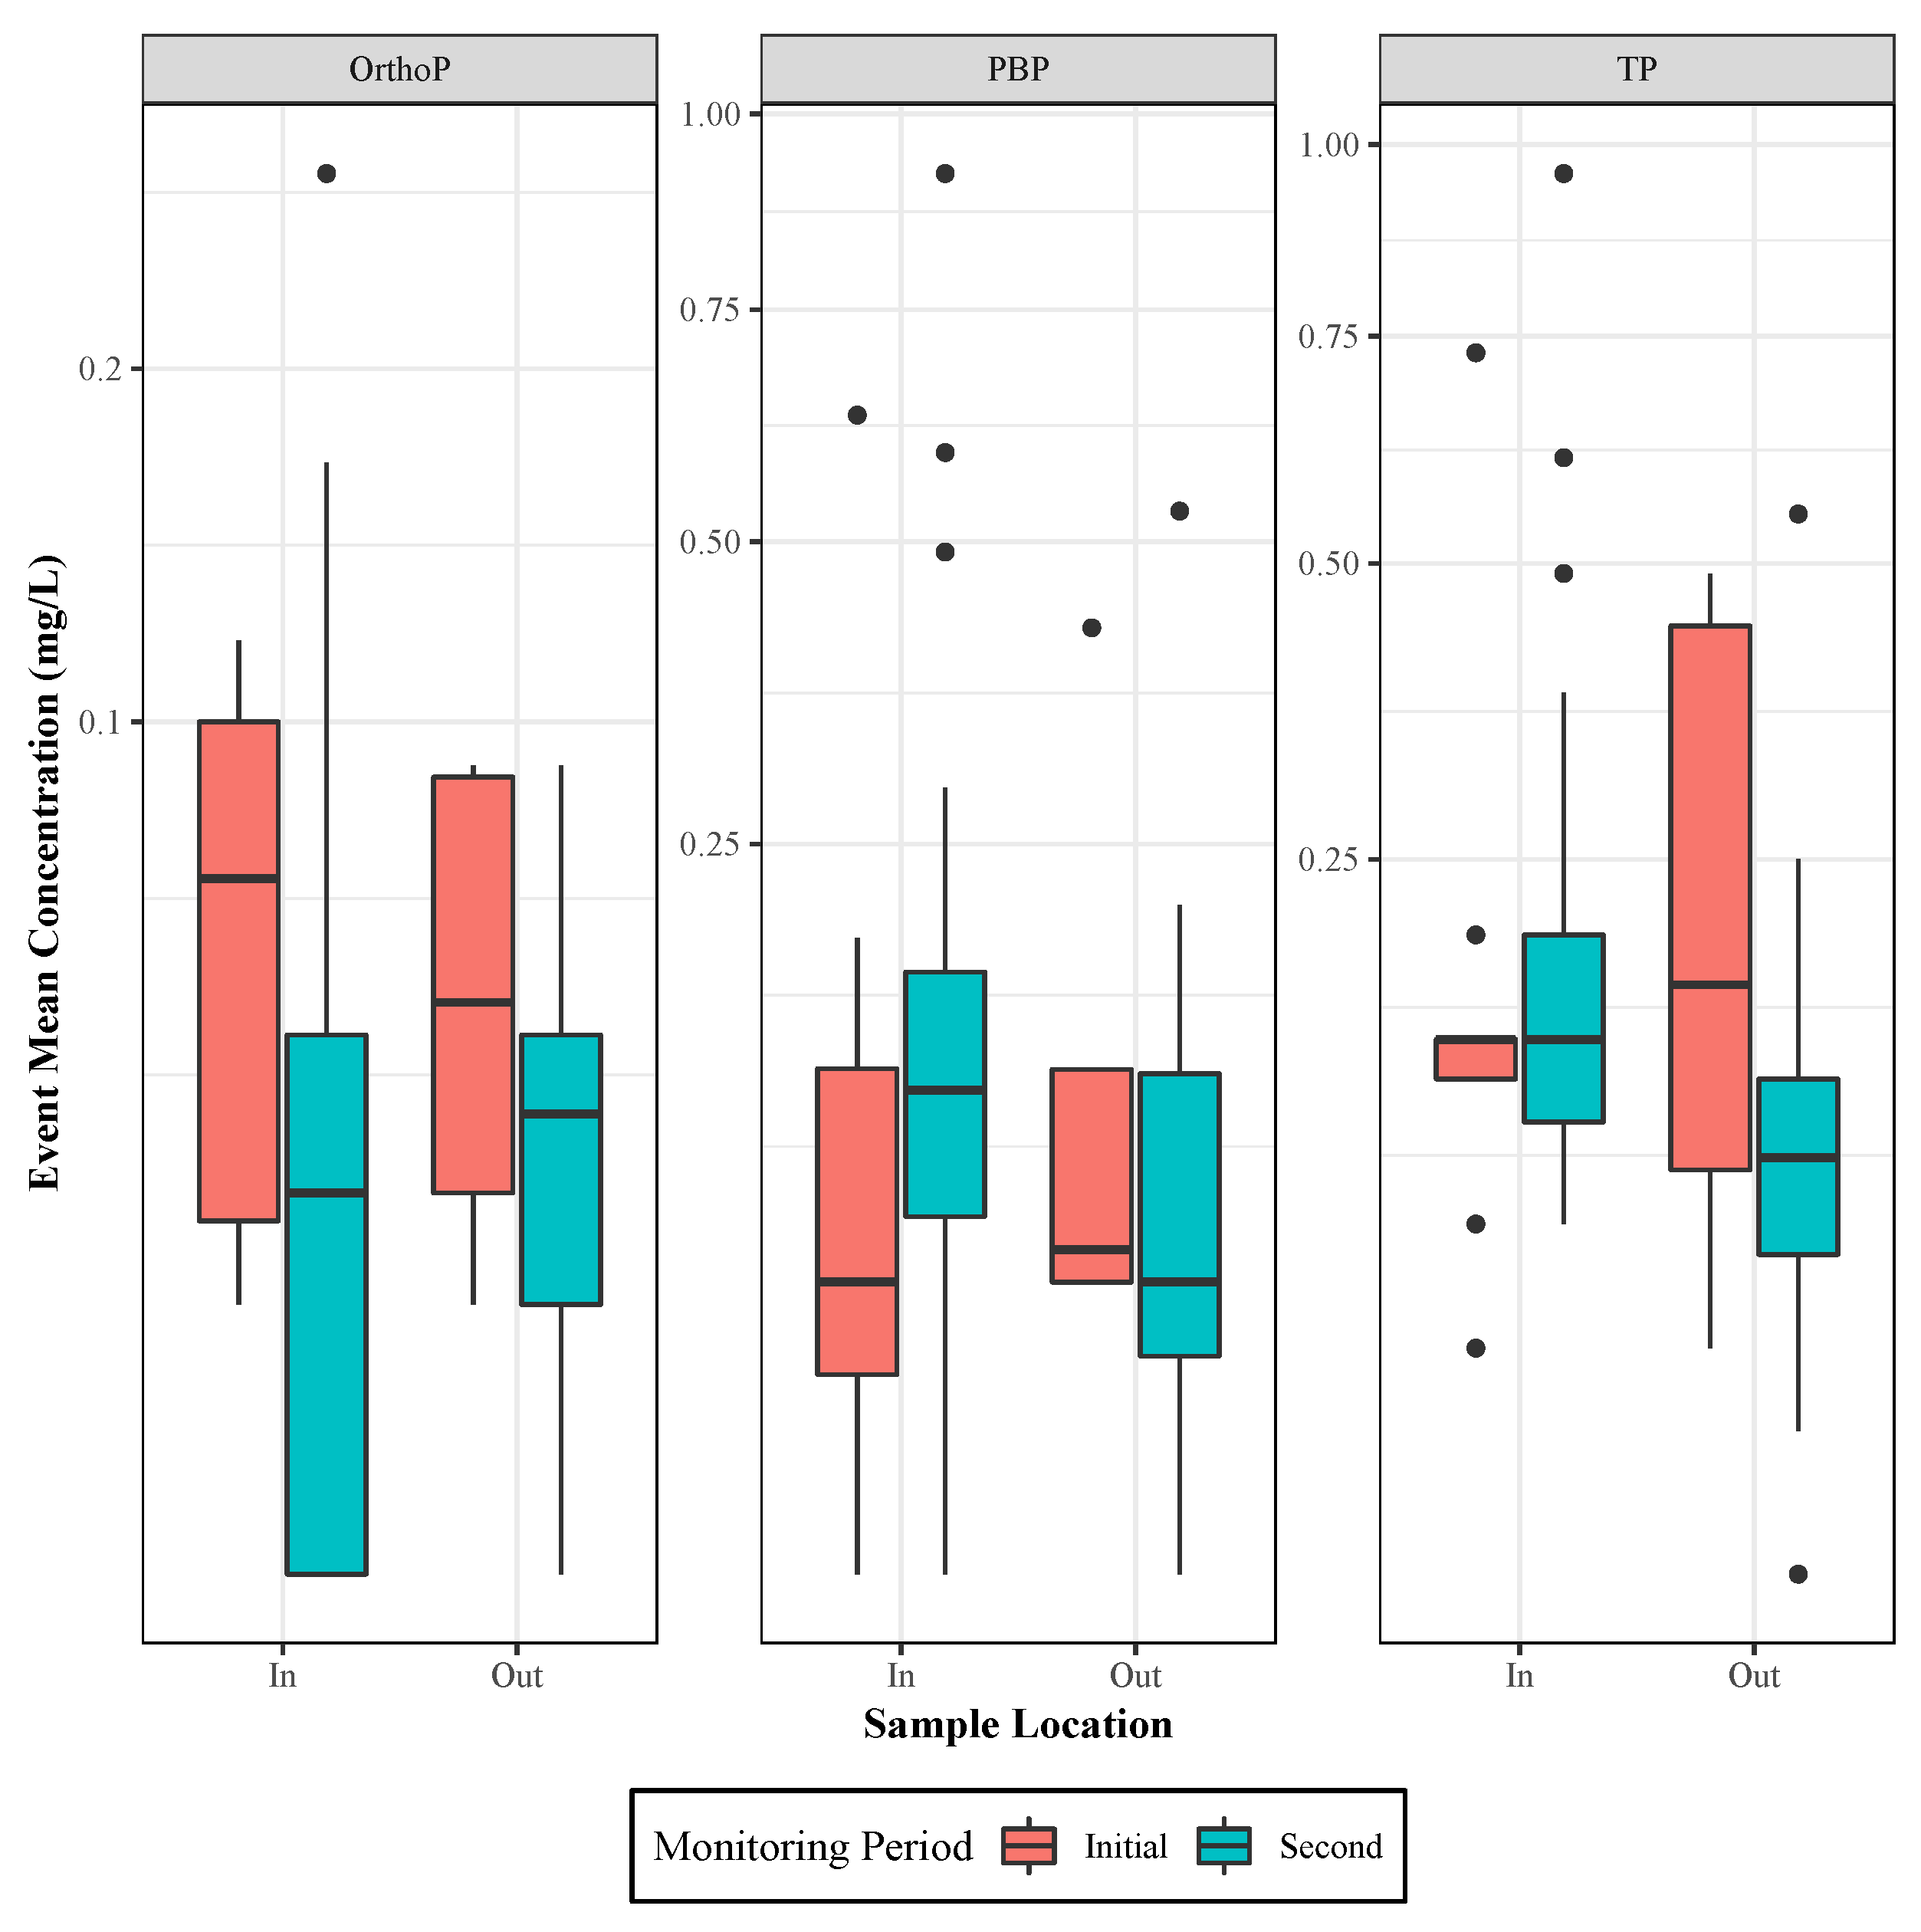
TP concentrations were significantly reduced after the site was 17 years old. The young site (1–2 years old) did not have a significant difference between inflow and outflow concentrations. During the initial monitoring period median influent and effluent TP concentrations were 0.14 mg/L and 0.17 mg/L, respectively (an ER of −21.4%). Fifteen years later, median influent and effluent TP concentrations were 0.14 mg/L and 0.09 mg/L, respectively (an ER of 39.3%). Median effluent OP concentrations were 0.05 mg/L and 0.03 mg/L during the initial and second monitoring periods, respectively, and remained proportional (approximately one third) to TP concentrations. Annual export loads of TP were 0.4 kg/ha/year during both monitoring periods, suggesting that TP export remained relatively constant over the life of the BRC.
That phosphorus removal has persisted for 17 years in this BRC and is supported by previous research [11,40]. A BRC in Philadelphia, PA, had no loss of function with respect to OP removal over a seven-year monitoring period [11]. The BRC investigated by Willard et al. [13] continued to significantly remove TP loads for seven years.
To assess the rate of phosphorus accumulation within the CH BRC filter media, soil media samples were collected post-construction during the initial monitoring period and again during the second monitoring period. Post-construction samples were analyzed for Mehlich-3 phosphorus (M3-P, an estimation of bioavailable P), while 15 years later, the samples were analyzed for total phosphorus using K2SO4-CuSO4 digestion and colorimetry. Soil media samples collected during the initial monitoring period had M3-P concentrations of 3.7 and 11.1 mg/kg, which was expected for a sand-based media [14]. Soil media samples collected during the second monitoring period had TP concentrations ranging from 133.0–302.6 mg P/kg filter media. While return period samples did not represent bioavailable P, it can be estimated using research by Lammers and Bledsoe [41] who related various TP measurement methods to M3-P in streambank sediments from 662 soil samples. Their investigation reported that M3-P concentrations were, on average, 11.7% of those of TP.
Following the results of Lammers and Bledsoe [41], M3-P concentrations were estimated from those of TP (by multiplying TP by 0.117). This allowed comparison between both monitoring periods. After 17 years, M3-P concentrations ranged from 15.6–35.4 mg/kg; the mean M3-P concentration was 24.3 ± 7.1 mg/kg. Using both periods’ M3-P concentrations, the mass of M3-P within the filter media was calculated using Equation (4).
where is the mass of Mehlich-3 P in the filter media (g), A is the surface area of the BRC (m), D is the depth of media (m), is the bulk density of the filter media (kg/m), and is the mean concentration of Mehlich-3 P in the filter media (mg M3-P/kg filter media).
As soil media samples were collected from the top 20 cm, Equation (4) was applied using a depth of 0.2 m rather than the total depth of the filter media. Since bulk density values from the first monitoring period were not reported, mean bulk density from the later monitoring period samples were used for calculations.
M3-P within the filter media was calculated as 136.4 g and 446.9 g for the first and second periods, respectively. An increase of 310.6 g represents an annualized accumulation rate of 19.4 g/year. While sorption capacity of the BRC filter media will vary based on the chemical composition of media, previous research by Hsieh and Davis [40] estimated the sorption capacity of two sand based media mixes (92–95% sand, similar to that at CH BRC) to be 28 mg M3-P/kg media. With an average M3-P concentration of 24.3 mg/kg, the top 20 cm of BRC media appears to be nearing sorption capacity. At an annual M3-P accumulation rate of 19.4 g/year, the CH BRC filter media would reach sorption capacity in approximately 3.5 more years.
That the top 20 cm of filter media are at, or nearing, sorption capacity for phosphorus following 17 years of treatment, is expected. There appears to remain multiple decades of capacity at this BRC because of the 1.2 m media depth. Komlos and Traver [11] found the top 10 cm of BRC filter media to be saturated with phosphorus while estimating 20+ years to saturation at lower depths. However, should media replacement be necessary, simply replacing the top 20 cm of saturated filter media might prove less costly and is supported by previous research [18,42].
3.3. Regulatory Implications
As regulation of nitrogen and phosphorus export in nutrient sensitive watersheds continues, the sustained treatment performance of the CH BRC is promising. Estimates of performance are usually predicated on early succession research [7,9]. Were BRC nutrient reduction ability to improve with time, then BRCs may be undervalued by regulators and models. For example in NC, BRCs are assigned specific TN (1.20 mg/L) and TP (0.12 mg/L) effluent concentrations for nutrient regulation calculations [43]. Post-construction median effluent TN and TP concentrations at the CH BRC were 1.23 and 0.17 mg/L, respectively. Fifteen years later, median TN and TP concentrations had decreased to 1.12 and 0.09 mg/L, respectively. With maturation, the CH BRC is performing better than the NCDEQ-assigned credit. As BRCs are a biologically-derived treatment practice, their performance will change over time and will be dependent on maturation and maintenance, much like constructed stormwater wetlands [29]. This BRC appears to be a very sustainable SCM with regard to nutrient removal.
4. Conclusions
The preponderance of bioretention research is concentrated on the treatment capabilities of “young” BRCs, post-construction. As bioretention is a biological filtration system, physical and biogeochemical processes that drive stormwater treatment in BRCs are subject to temporal changes [44], yet little research has addressed exactly how BRC treatment changes with time. The research presented herein illustrates that BRC nutrient removal can be sustained. If designed, built, and maintained following research-based guidance [9,25,45], bioretention provides excellent treatment of stormwater runoff for nitrogen and phosphorus for prolonged periods of time.
Author Contributions
Conceptualization, J.P.J. and W.F.H.; data curation, J.P.J.; formal analysis, J.P.J.; funding acquisition, W.F.H.; investigation, J.P.J.; project administration, J.P.J. and W.F.H.; writing—original draft, J.P.J.; writing—review and editing, J.P.J. and W.F.H.
Funding
This research was funded by the North Carolina Policy Collaboratory.
Acknowledgments
The authors would like to thank Shawn Kennedy for his assistance with the installation and maintenance of monitoring equipment at the research site.
Conflicts of Interest
The authors declare no conflict of interest. The funders had no role in the design of the study; in the collection, analyses, or interpretation of data; in the writing of the manuscript, or in the decision to publish the results.
References
- Davis, A.P. Green Engineering Principles Promote Low-impact Development. Environ. Sci. Technol. 2005, 39, 338A–344A. [Google Scholar] [CrossRef] [Green Version]
- Dietz, M.E. Low Impact Development Practices: A Review of Current Research and Recommendations for Future Directions. Water Air Soil Pollut. 2007, 186, 351–363. [Google Scholar] [CrossRef] [Green Version]
- Line, D.E.; Brown, R.A.; Hunt, W.F.; Lord, W.G. Effectiveness of LID for Commercial Development in North Carolina. J. Environ. Eng. 2012, 138, 680–688. [Google Scholar] [CrossRef]
- Wilson, C.E.; Hunt, W.F.; Winston, R.J.; Smith, P. Comparison of Runoff Quality and Quantity from a Commercial Low-Impact and Conventional Development in Raleigh, North Carolina. J. Environ. Eng. 2015, 141, 05014005. [Google Scholar] [CrossRef]
- Bratieres, K.; Fletcher, T.; Deletic, A.; Zinger, Y. Nutrient and sediment removal by stormwater biofilters: A large-scale design optimisation study. Water Res. 2008, 42, 3930–3940. [Google Scholar] [CrossRef]
- Coffman, L.S.; Green, R.; Clar, M.; Bitter, S. Development of Bioretention Practices for Stormwater Management. J. Water Manag. Model. 1994, 6062, 23–42. [Google Scholar] [CrossRef]
- Davis, A.P.; Hunt, W.F.; Traver, R.G.; Clar, M. Bioretention Technology: Overview of Current Practice and Future Needs. J. Environ. Eng. 2009, 135, 109–117. [Google Scholar] [CrossRef]
- Davis, A.P.; Traver, R.G.; Hunt, W.F.; Lee, R.; Brown, R.A.; Olszewski, J.M. Hydrologic Performance of Bioretention Storm-Water Control Measures. J. Hydrol. Eng. 2012, 17, 604–614. [Google Scholar] [CrossRef]
- Hunt, W.F.; Davis, A.P.; Traver, R.G. Meeting Hydrologic and Water Quality Goals through Targeted Bioretention Design. J. Environ. Eng. 2012, 138, 698–707. [Google Scholar] [CrossRef]
- Lucas, W.C.; Greenway, M. Nutrient Retention in Vegetated and Nonvegetated Bioretention Mesocosms. J. Irrig. Drain. Eng. 2008, 134, 613–623. [Google Scholar] [CrossRef]
- Komlos, J.; Traver, R.G. Long-Term Orthophosphate Removal in a Field-Scale Storm-Water Bioinfiltration Rain Garden. J. Environ. Eng. 2012, 138, 991–998. [Google Scholar] [CrossRef]
- Johnson, J.P.; Hunt, W.F. Evaluating the spatial distribution of pollutants and associated maintenance requirements in an 11 year-old bioretention cell in urban Charlotte, NC. J. Environ. Manag. 2016, 184, 363–370. [Google Scholar] [CrossRef]
- Willard, L.L.; Wynn-Thompson, T.; Krometis, L.H.; Neher, T.P.; Badgley, B.D. Does It Pay to be Mature? Evaluation of Bioretention Cell Performance Seven Years Postconstruction. J. Environ. Eng. 2017, 143, 04017041. [Google Scholar] [CrossRef]
- Hunt, W.F.; Jarrett, A.R.; Smith, J.T.; Sharkey, L.J. Evaluating Bioretention Hydrology and Nutrient Removal at Three Field Sites in North Carolina. J. Irrig. Drain. Eng. 2006, 132, 600–608. [Google Scholar] [CrossRef] [Green Version]
- Soil Survey Staff. Web Soil Survey. 2018. Available online: https://websoilsurvey.sc.egov.usda.gov/ (accessed on 18 April 2018).
- Malcom, H.R. Elements of Urban Stormwater Design; North Carolina State University: Raleigh, NC, USA, 1989. [Google Scholar]
- Standard Practice for Sampling with a Scoop; ASTM Standard D5633; Technical Report; ASTM: West Conshohocken, PA, USA, 2012. [CrossRef]
- Li, H.; Davis, A.P. Urban Particle Capture in Bioretention Media. I: Laboratory and Field Studies. J. Environ. Eng. 2008, 134, 409–418. [Google Scholar] [CrossRef]
- NOAA NCEI. NCDC Climate Normals; NOAA NCEI: Washington, DC, USA, 2018.
- R Core Team. R: A Language and Environment for Statistical Computing; R Core Team: Vienna, Austria, 2017. [Google Scholar]
- Davis, A.P. Field Performance of Bioretention: Water Quality. Environ. Eng. Sci. 2007, 24, 1048–1064. [Google Scholar] [CrossRef]
- Davis, A.P.; Shokouhian, M.; Sharma, H.; Minami, C. Water Quality Improvement through Bioretention Media: Nitrogen and Phosphorus Removal. Water Environ. Res. 2006, 78, 284–293. [Google Scholar] [CrossRef]
- Dietz, M.E.; Clausen, J.C. A Field Evaluation of Rain Garden Flow and Pollutant Treatment. Water Air Soil Pollut. 2005, 167, 123–138. [Google Scholar] [CrossRef] [Green Version]
- Li, H.; Davis, A.P. Water Quality Improvement through Reductions of Pollutant Loads Using Bioretention. J. Environ. Eng. 2009, 135, 567–576. [Google Scholar] [CrossRef]
- Brown, R.A.; Hunt, W.F. Improving bioretention/biofiltration performance with restorative maintenance. Water Sci. Technol. 2012, 65, 361. [Google Scholar] [CrossRef]
- McNett, J.K.; Hunt, W.F.; Osborne, J.A. Establishing Storm-Water BMP Evaluation Metrics Based upon Ambient Water Quality Associated with Benthic Macroinvertebrate Populations. J. Environ. Eng. 2010, 136, 535–541. [Google Scholar] [CrossRef]
- Hunt, W.F.; Smith, J.T.; Jadlocki, S.J.; Hathaway, J.M.; Eubanks, P.R. Pollutant Removal and Peak Flow Mitigation by a Bioretention Cell in Urban Charlotte, N.C. J. Environ. Eng. 2008, 134, 403–408. [Google Scholar] [CrossRef]
- Passeport, E.; Hunt, W.F.; Line, D.E.; Smith, R.A.; Brown, R.A. Field Study of the Ability of Two Grassed Bioretention Cells to Reduce Storm-Water Runoff Pollution. J. Irrig. Drain. Eng. 2009, 135, 505–510. [Google Scholar] [CrossRef]
- Merriman, L.S.; Hunt, W.F. Maintenance versus Maturation: Constructed Storm-Water Wetland’s Fifth-Year Water Quality and Hydrologic Assessment. J. Environ. Eng. 2014, 140, 05014003. [Google Scholar] [CrossRef]
- Payne, E.G.I.; Fletcher, T.D.; Russell, D.G.; Grace, M.R.; Cavagnaro, T.R.; Evrard, V.; Deletic, A.; Hatt, B.E.; Cook, P.L.M. Temporary Storage or Permanent Removal? The Division of Nitrogen between Biotic Assimilation and Denitrification in Stormwater Biofiltration Systems. PLoS ONE 2014, 9, e90890. [Google Scholar] [CrossRef] [Green Version]
- Read, J.; Wevill, T.; Fletcher, T.; Deletic, A. Variation among plant species in pollutant removal from stormwater in biofiltration systems. Water Res. 2008, 42, 893–902. [Google Scholar] [CrossRef]
- Turk, R.P.; Kraus, H.T.; Hunt, W.F.; Carmen, N.B.; Bilderback, T.E. Nutrient Sequestration by Vegetation in Bioretention Cells Receiving High Nutrient Loads. J. Environ. Eng. 2017, 143, 06016009. [Google Scholar] [CrossRef]
- Chen, G.; Zhu, H.; Zhang, Y. Soil microbial activities and carbon and nitrogen fixation. Res. Microbiol. 2003, 154, 393–398. [Google Scholar] [CrossRef]
- Dunn, R.M.; Mikola, J.; Bol, R.; Bardgett, R.D. Influence of microbial activity on plant–microbial competition for organic and inorganic nitrogen. Plant Soil 2006, 289, 321–334. [Google Scholar] [CrossRef]
- Birgand, F.; Skaggs, R.W.; Chescheir, G.M.; Gilliam, J.W. Nitrogen Removal in Streams of Agricultural Catchments—A Literature Review. Crit. Rev. Environ. Sci. Technol. 2007, 37, 381–487. [Google Scholar] [CrossRef]
- Kim, H.; Seagren, E.A.; Davis, A.P. Engineered bioretention for removal of nitrate from stormwater runoff. Water Environ. Res. 2003, 75, 355–367. [Google Scholar] [CrossRef]
- Seitzinger, S.; Harrison, J.A.; Böhlke, J.K.; Bouwman, A.F.; Lowrance, R.; Peterson, B.; Tobias, C.; Drecht, G.V. Denitrification Across Landscapes and Waterscapes: A Synthesis. Ecol. Appl. 2006, 16, 2064–2090. [Google Scholar] [CrossRef]
- Brady, N.C.; Weil, R.R. The Nature and Properties of Soils; Pearson Prentice Hall: Columbus, OH, USA, 2008. [Google Scholar]
- Peterson, I.J.; Igielski, S.; Davis, A.P. Enhanced Denitrification in Bioretention Using Woodchips as an Organic Carbon Source. J. Sustain. Water Built Environ. 2015, 1, 04015004. [Google Scholar] [CrossRef]
- Hsieh, C.h.; Davis, A.P.; Needelman, B.A. Bioretention Column Studies of Phosphorus Removal from Urban Stormwater Runoff. Water Environ. Res. 2007, 79, 177–184. [Google Scholar] [CrossRef]
- Lammers, R.W.; Bledsoe, B.P. What role does stream restoration play in nutrient management? Crit. Rev. Environ. Sci. Technol. 2017, 47, 335–371. [Google Scholar] [CrossRef]
- Hatt, B.E.; Fletcher, T.D.; Deletic, A. Hydraulic and Pollutant Removal Performance of Fine Media Stormwater Filtration Systems. Environ. Sci. Technol. 2008, 42, 2535–2541. [Google Scholar] [CrossRef]
- N.C. DEQ. North Carolina Stormwater Control Measure Credit Document; North Carolina Department of Environmental Quality: Raleigh, NC, USA, 2017.
- Davis, A.P.; Traver, R.G.; Hunt, W.F. Improving Urban Stormwater Quality: Applying Fundamental Principles. J. Contemp. Water Res. Educ. 2010, 146, 3–10. [Google Scholar] [CrossRef] [Green Version]
- Blecken, G.T.; Hunt, W.F.; Al-Rubaei, A.M.; Viklander, M.; Lord, W.G. Stormwater control measure (SCM) maintenance considerations to ensure designed functionality. Urban Water J. 2017, 14, 278–290. [Google Scholar] [CrossRef]
Figure 1.
Bioretention cell during initial monitoring period (left) and return monitoring period (right).
Figure 1.
Bioretention cell during initial monitoring period (left) and return monitoring period (right).
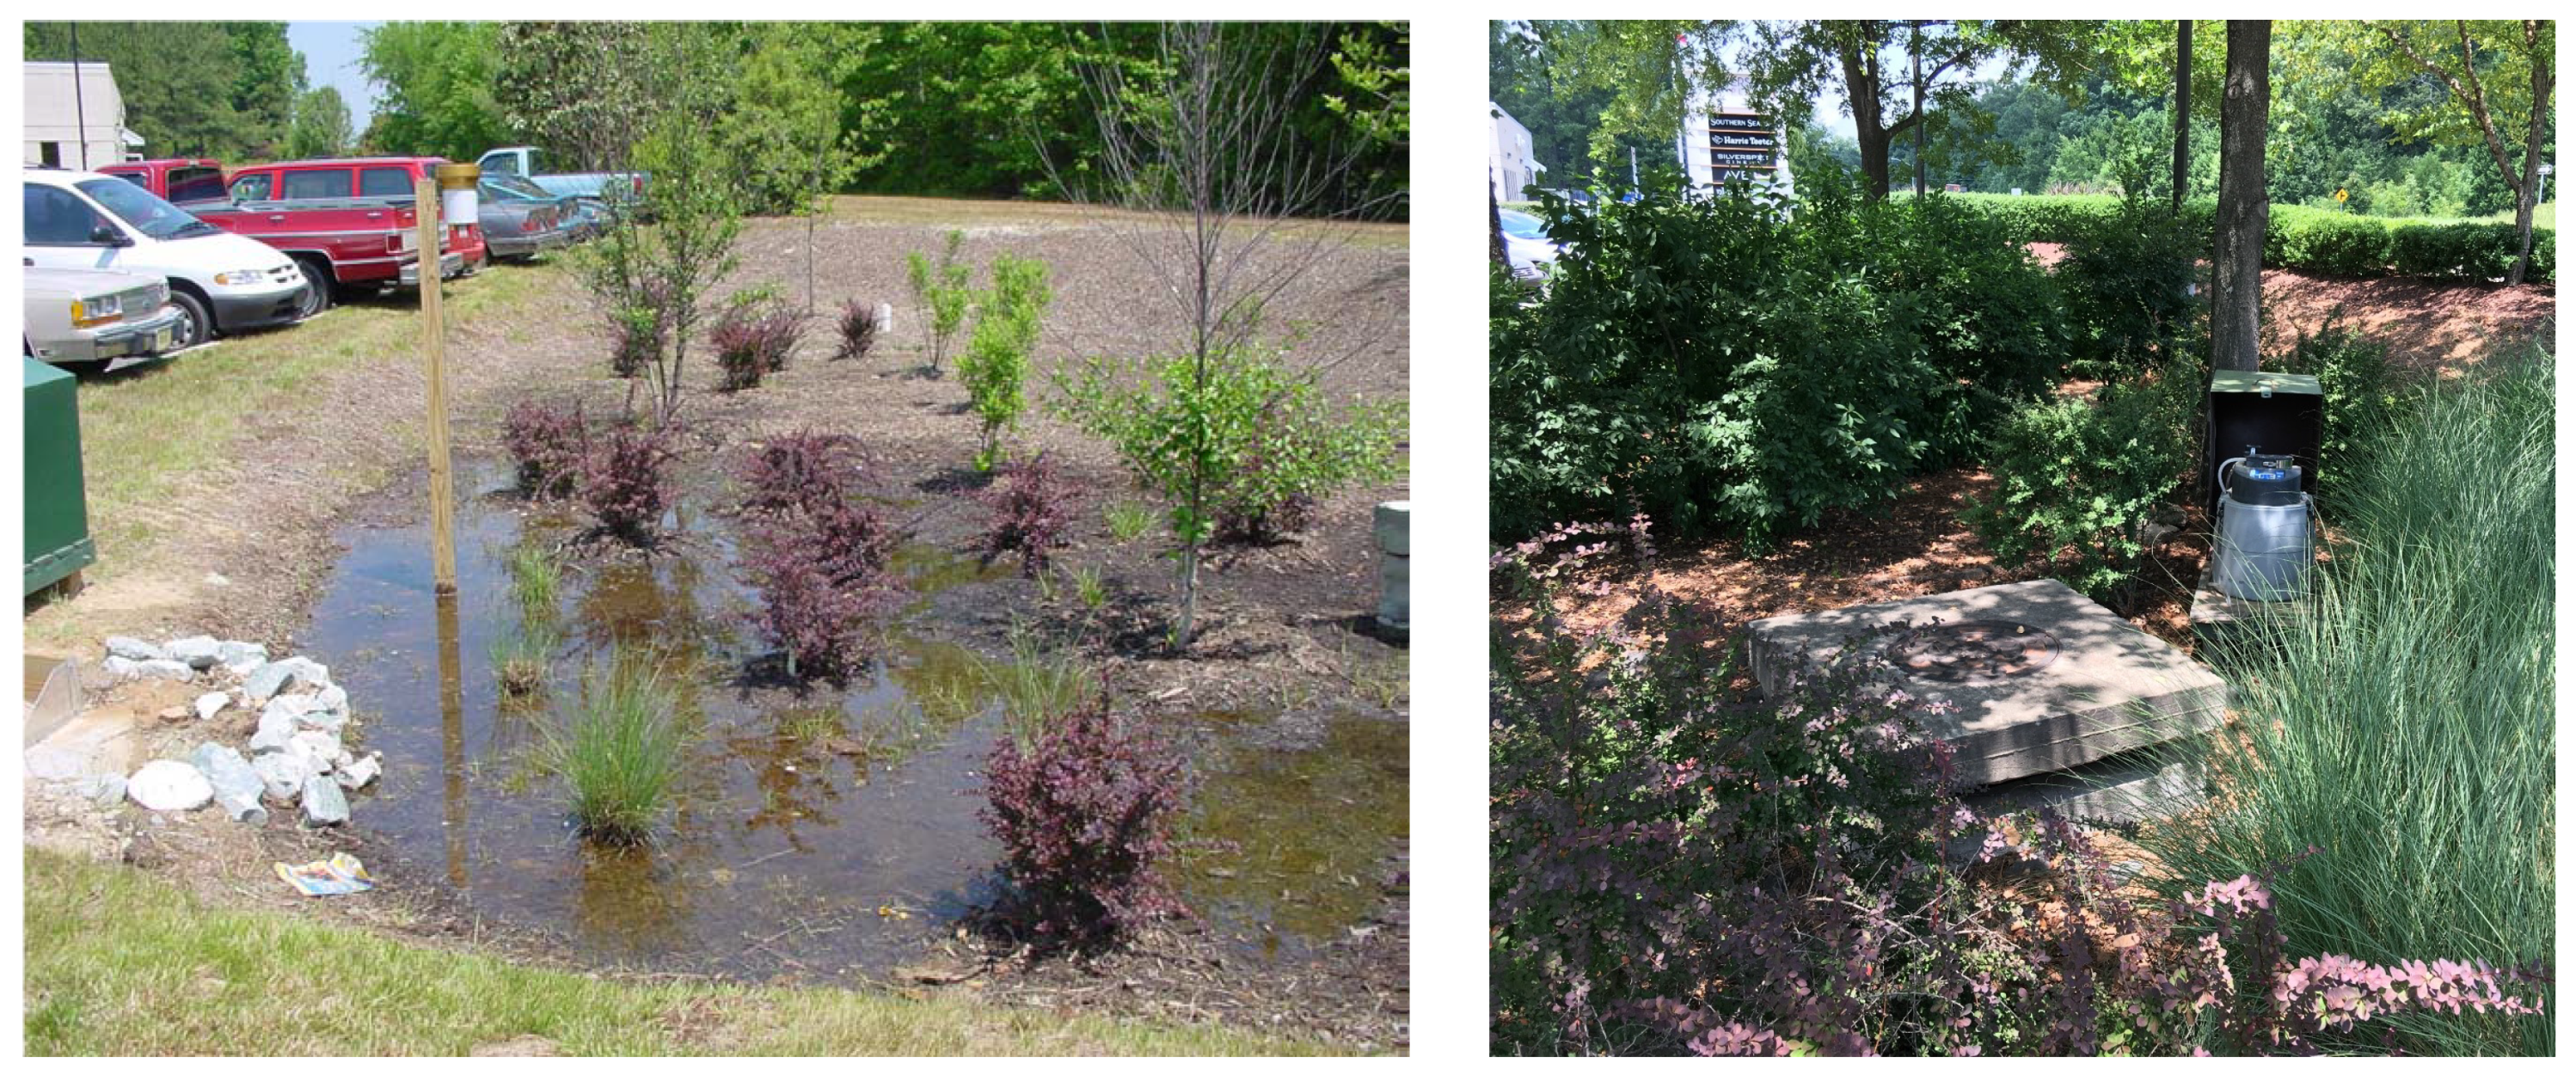
Figure 2.
Event mean nitrogen species concentrations for sampled storm events at the inlet (in) and outlet (out) of the Chapel Hill bioretention cells (BRC) during each monitoring period.
Figure 2.
Event mean nitrogen species concentrations for sampled storm events at the inlet (in) and outlet (out) of the Chapel Hill bioretention cells (BRC) during each monitoring period.
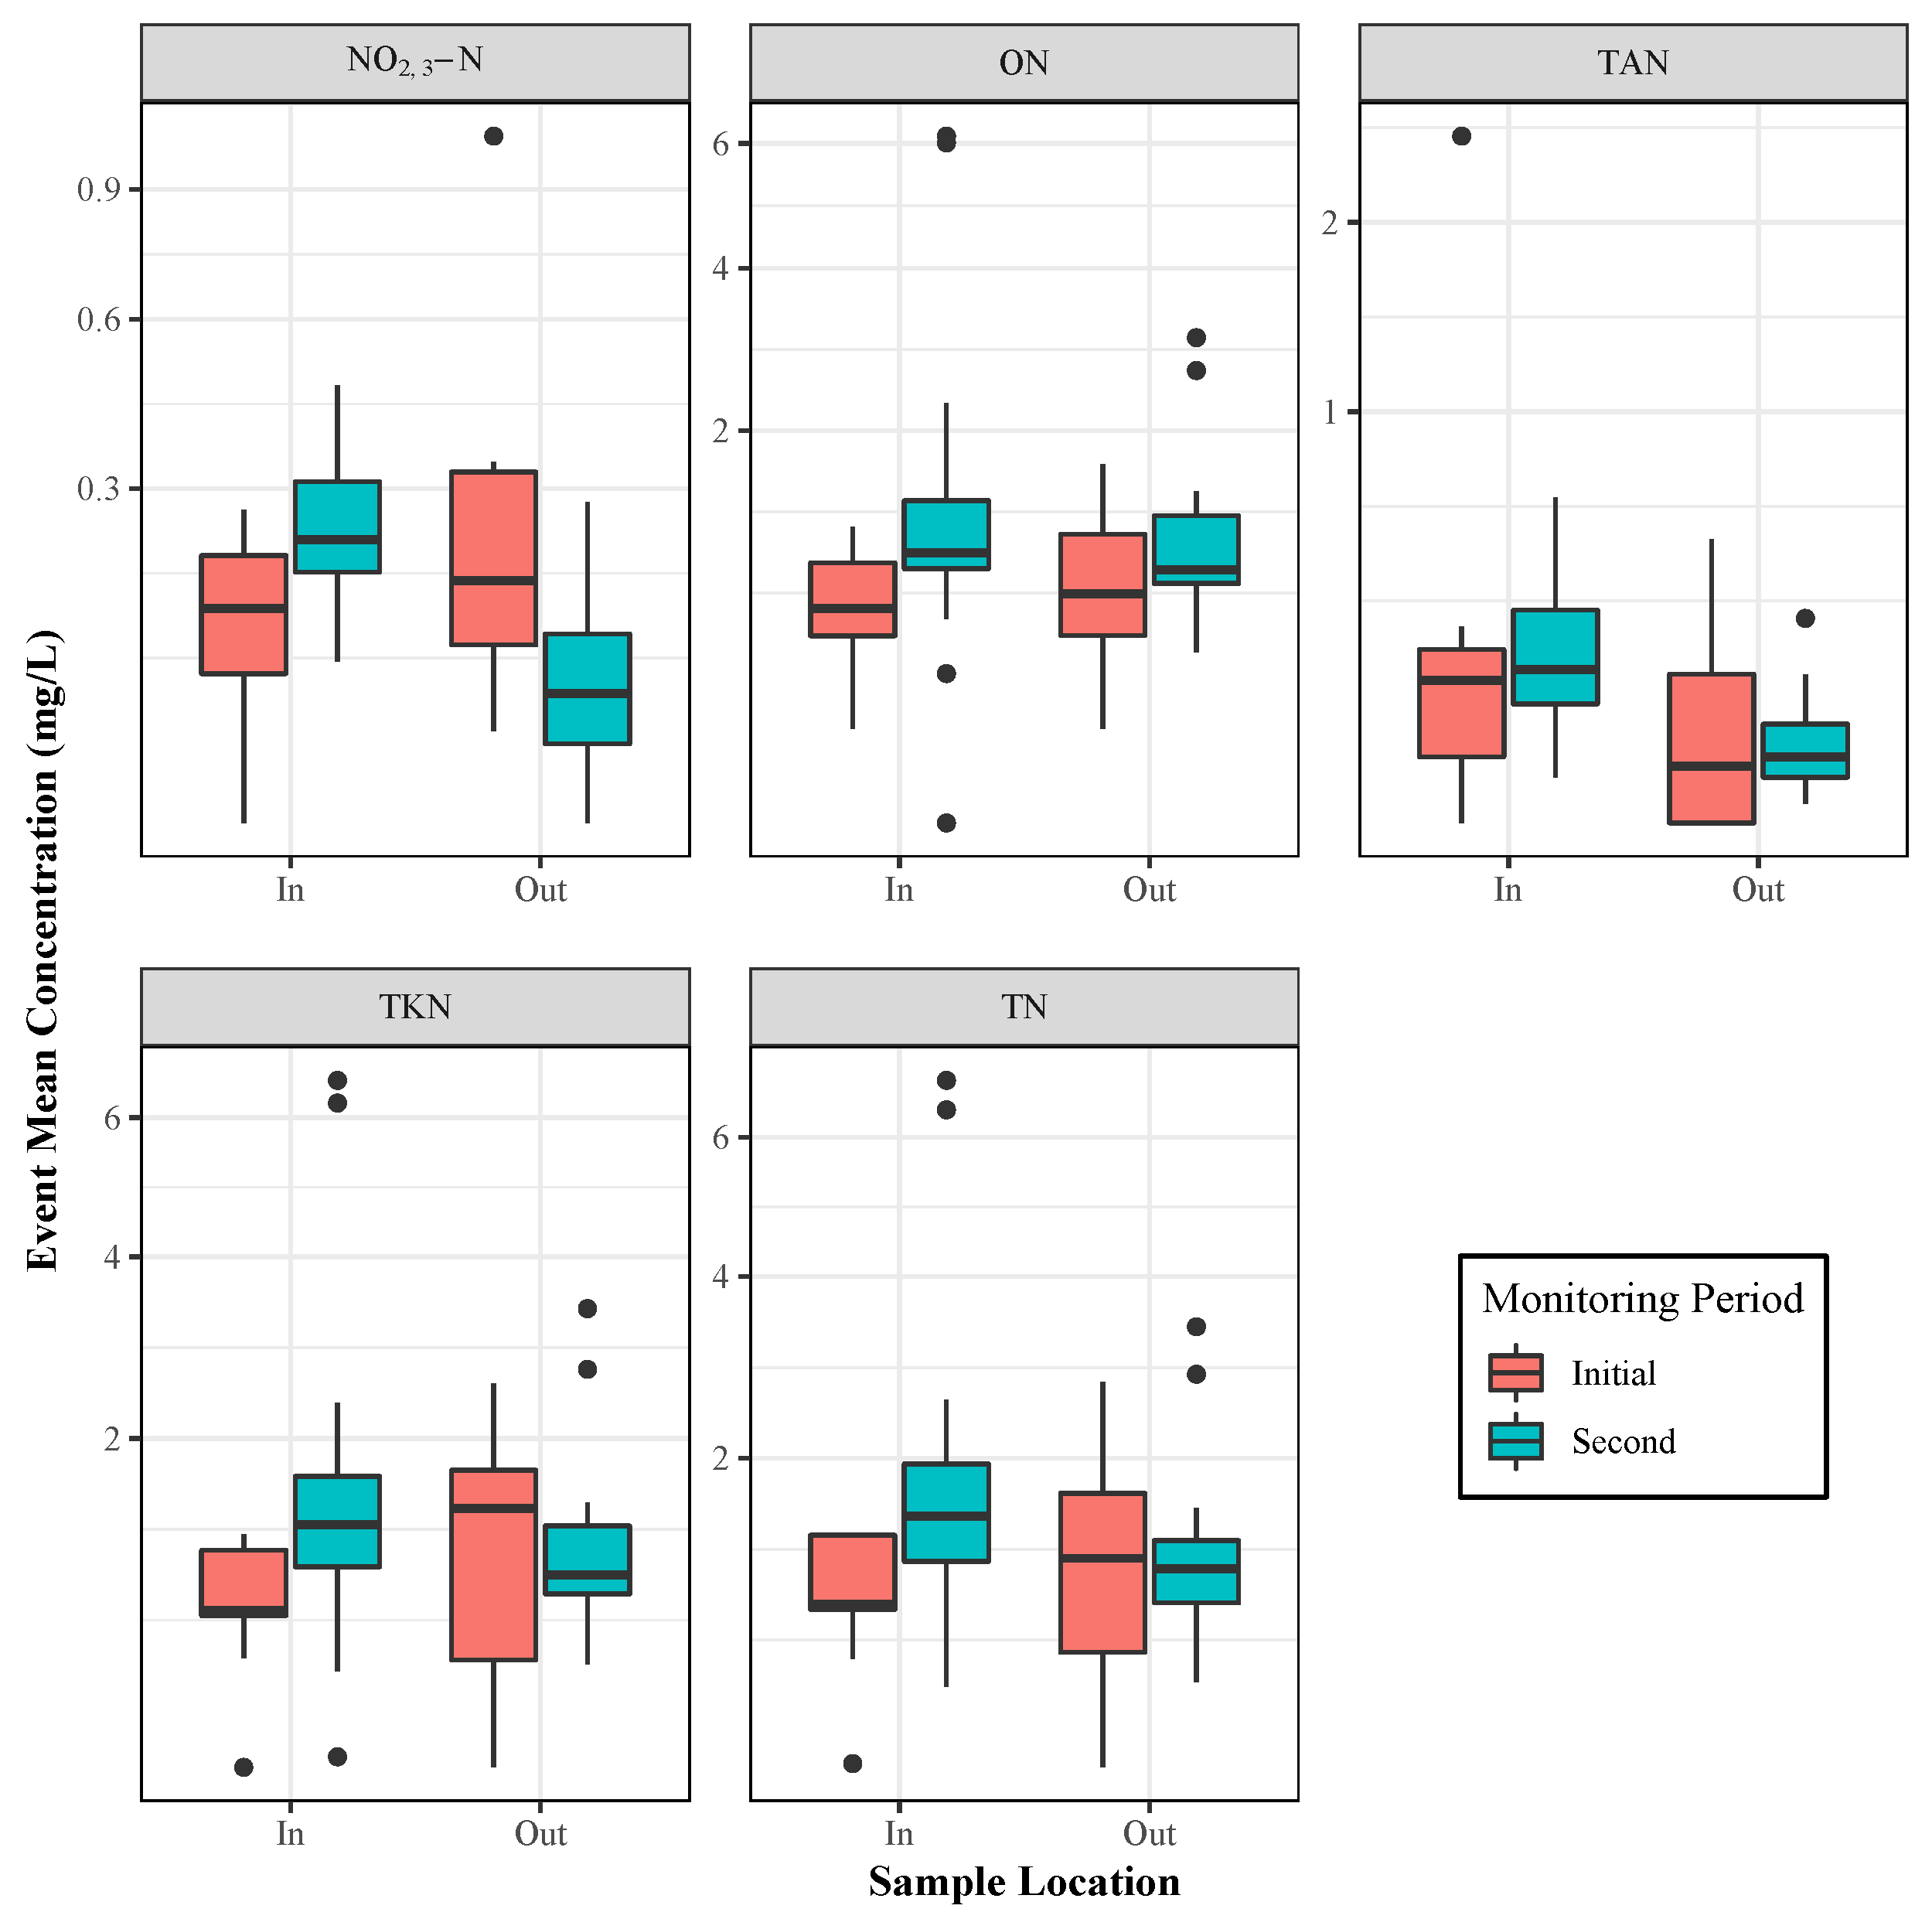
Figure 3.
Event mean phosphorus species concentrations for sampled storm events at the inlet (in) and outlet (out) of the Chapel Hill BRC during each monitoring period.
Figure 3.
Event mean phosphorus species concentrations for sampled storm events at the inlet (in) and outlet (out) of the Chapel Hill BRC during each monitoring period.

Figure 4.
Chapel Hill BRC effluent total nitrogen (TN) exceedance probability compared with McNett et al. [26] threshold for water quality.
Figure 4.
Chapel Hill BRC effluent total nitrogen (TN) exceedance probability compared with McNett et al. [26] threshold for water quality.

Figure 5.
Chapel Hill BRC effluent total phosporous (TP) exceedance probability compared with McNett et al. [26] threshold for water quality.
Figure 5.
Chapel Hill BRC effluent total phosporous (TP) exceedance probability compared with McNett et al. [26] threshold for water quality.

Figure 6.
Influent and effluent nitrate concentrations observed at the Chapel Hill BRC during each monitoring period.
Figure 6.
Influent and effluent nitrate concentrations observed at the Chapel Hill BRC during each monitoring period.


Table 1.
Chapel Hill bioretention cell (BRC) characteristics.
| Characteristic | Chapel Hill BRC |
|---|---|
| Year constructed | 2001 |
| Underlying soil | Clay, clay loam, and silty clay |
| 2002–2003 drainage area (m) | 607 |
| 2017–2018 drainage area (m) | 1133 |
| Imperviousness | 100% |
| BRC surface area (m) | 90 |
| Bowl storage depth (cm) | 10 |
| Media depth (m) | 1.2 |
| Median infiltration rate (cm/h) | 3.3–7.6 |
| Original media P-index | 4–12 (3.7–11.1 mg Mehlich-3 P/kg) |
| Underdrain type | Conventional (no IWS) |
| Vegetative cover | Perennial grasses, trees, shrubs |
Table 2.
Water quality analysis methods of the second monitoring period (2017–2018).
| Analyte | Method |
|---|---|
| NO3-N | EPA Method 353.2 |
| TAN | Standard Method 4500-NH3 G |
| TKN | EPA Method 351.2 |
| ON | TKN–TAN |
| TN | NO3-N + TKN |
| TP | Standard Method 4500-P F |
| OP | EPA Method 365.1 |
| PBP | TP–OP |
Table 3.
Median EMCs and efficiency ratio (ER) for sampled analytes during each monitoring period.
| Pollutant | Initial Monitoring Period | Second Monitoring Period | ||||
|---|---|---|---|---|---|---|
| EMC In | EMC Out | Change | EMC In | EMC Out | Change | |
| (mg/L) | (%) | (mg/L) | (%) | |||
| TN | 0.89 | 1.23 | +37.6 * | 1.51 | 1.12 | −25.8 * |
| TKN | 0.74 | 1.41 | +90.5 * | 1.29 | 0.95 | −26.4 |
| TAN | 0.17 | 0.05 | −70.6 | 0.19 | 0.06 | −68.4 * |
| NO3-N | 0.15 | 0.18 | +20.0 * | 0.23 | 0.08 | −67.4 * |
| ON | 0.56 | 0.70 | +25.0 * | 0.95 | 0.84 | −12.1 |
| TP | 0.14 | 0.17 | +21.4 | 0.14 | 0.09 | −39.3 * |
| OP | 0.07 | 0.05 | −28.6 | 0.02 | 0.03 | +50.0 |
| PBP | 0.04 | 0.04 | 0.0 | 0.11 | 0.04 | −63.6 |
* denotes statistical significance (p < 0.05).
© 2019 by the authors. Licensee MDPI, Basel, Switzerland. This article is an open access article distributed under the terms and conditions of the Creative Commons Attribution (CC BY) license (http://creativecommons.org/licenses/by/4.0/).
Share and Cite
MDPI and ACS Style
Johnson, J.P.; Hunt, W.F. A Retrospective Comparison of Water Quality Treatment in a Bioretention Cell 16 Years Following Initial Analysis. Sustainability 2019, 11, 1945. https://doi.org/10.3390/su11071945
AMA Style
Johnson JP, Hunt WF. A Retrospective Comparison of Water Quality Treatment in a Bioretention Cell 16 Years Following Initial Analysis. Sustainability. 2019; 11(7):1945. https://doi.org/10.3390/su11071945
Chicago/Turabian StyleJohnson, Jeffrey P., and William F. Hunt. 2019. "A Retrospective Comparison of Water Quality Treatment in a Bioretention Cell 16 Years Following Initial Analysis" Sustainability 11, no. 7: 1945. https://doi.org/10.3390/su11071945
Note that from the first issue of 2016, this journal uses article numbers instead of page numbers. See further details here.