Design and Performance Characterization of Roadside Bioretention Systems

1
School of Civil Engineering, Southeast University, Nanjing 211189, China
2
Southeast University-Monash University Joint Research Centre for Future Cities, Nanjing 211189, China
*
Author to whom correspondence should be addressed.
Sustainability 2019, 11(7), 2040; https://doi.org/10.3390/su11072040
Submission received: 28 February 2019
/
Revised: 29 March 2019
/
Accepted: 2 April 2019
/
Published: 5 April 2019
(This article belongs to the Special Issue Green Stormwater Infrastructure for Sustainable Urban and Rural Development)
Abstract
:In the current study, three roadside bioretention systems with different configurations were constructed to investigate their pollutant removal efficiency in different rainfall recurrence intervals. The bioretention systems (referred as units) (unit A: 700 mm height material without submerged zone; unit B: 400 mm height material with 300 mm submerged zone; unit C: 400 mm height material without submerged zone) were used to conduct the rainfall events with uniform 120 min rainfall duration for 2-, 5-, 10-, 15-, and 30-year recurrence intervals. Results reveal that the gradual increase of rainfall return period would have negative effects on TN and NH4+-N removal. The higher filler layer may increase pollutant removal efficiency. Setting a submerged zone could improve the CODMn and TN removal compared to TP and NH4+-N removal. The values for comprehensive reduction rate of pollutant load in the three bioretention systems were recorded as follows: 64% in SS, 50%~80% in TP, 69% in NH4+-N, and 28%~53% in NO3-N separately. These results provide greater understanding of the design and treatment performance of bioretention systems.
1. Introduction
Since the beginning of the 21st century, the urbanization process has developed rapidly in China. By the end of 2015, the level of urbanization in China had exceeded 54%, and there is still much room for urbanization. Although urbanization can promote the rapid development of regional economies, at the same time, hardened pavement has been expanded on a large scale, gradually replacing the soil-rock pavement composed of vegetation, which has greatly changed the original permeability of the pavement, triggering the generation of urban rainwater runoff [1]. The nature of urban underlying surfaces is the most important factor affecting the form of runoff, while pavement hardening will lead to the growth of urban rainwater runoff and the pollution of surface water, which will lead to various water environmental problems, especially rainstorms and floods, and seriously affect peoples’ daily lives [2,3]. At present, facing the double problems of frequent urban waterlogging disasters and shortage of freshwater resources, improving urban drainage system, increasing rainwater recycling efficiency, and balancing water resources have become the most important issues in the development of urbanization [4]. Many researchers are engaged in research related to flood control and retention facilities. One of the essential needs for retention reservoirs is to reduce the volume of wastewater flow in sewer systems. Their main advantage is the potential to increase retention in the system, which in turn improves hydraulic safety by reducing the risk of node flooding and the emergence of the phenomenon of “urban flooding” [5]. The most effective method of adapting sewer systems suffering from hydraulic overloads to the new hydraulic conditions is to apply rainwater retention at the various stages of rainwater handling and disposal [6,7,8,9,10]. Therefore, the development of alternative, more sustainable, and cost-effective urban drainage systems has been growing in size [11].
A new urban water resource management strategy called the Sponge City Program (SCP) was proposed by China in 2013, which totally deviated from the traditional rapid-drainage techniques [12]. The Sponge City concept is an effective urban water management plan that aims to absorb rainwater for reuse in a proper scientific manner [13]. Meanwhile, the construction of the sponge urban road facility emphasizes the imitation of natural ecological rainwater treatment, as well as the application of low impact development techniques (LID) [14]. Much attention is also paid to the importance of slow release and distributed rainwater in order to address urban road flooding rationally, and make full use of rainwater resources [15]. Adoption of the sponge urban facilities (such as pumps, storage tanks, wetlands, and a bioretention facilitity) is aimed at alleviating the urban flooding problem, which has always been a key issue in China [16].
Bioretention is a key element of LID practices, which is implemented for hydrological and water treatment purposes, flood control, and water resource management [17,18]. Bioretention systems are extremely important due to their ability to be used as seawater in cities, reducing stormwater runoff, eliminating pollutants, as well as reusing water resources [19]. In addition, bioretention systems also have an aesthetic function valued by the public [20]. As an important part of the urban ecosystem, most of the urban green space does not meet its design expectations. Attention is only paid to the aesthetics, causing poor performance regarding reduction of peak flow and pollutant load [21]. Therefore, the transformation of green space into a roadside bioretention system is necessary to resolve this problem.
The objectives of this study are: (1) to evaluate the comprehensive reduction rates of pollutant load, including suspended solids (SS), chemical oxygen demand (CODMn), total phosphorus (TP), ammonium-nitrogen (NH4+-N), nitrate-nitrogen (NO3−-N), and total nitrogen (TN) of a rainfall event of 120 min duration for recurrence intervals of 2, 5, 10, 15, and 30 years in three roadside bioretention units; (2) investigate the relationship between the height of the filler layer and pollutant removal efficiency; and (3) investigate the effects of setting of a submerged area on pollutant removal efficiency.
2. Methodology
2.1. Experimental Site
In this study, an urban road green space along the arterial road was selected to be transformed into bioretention systems, which was located in the Hefei High-tech Zone Park, Hefei, China. The catchment area of this green space was approximately 60 m2.
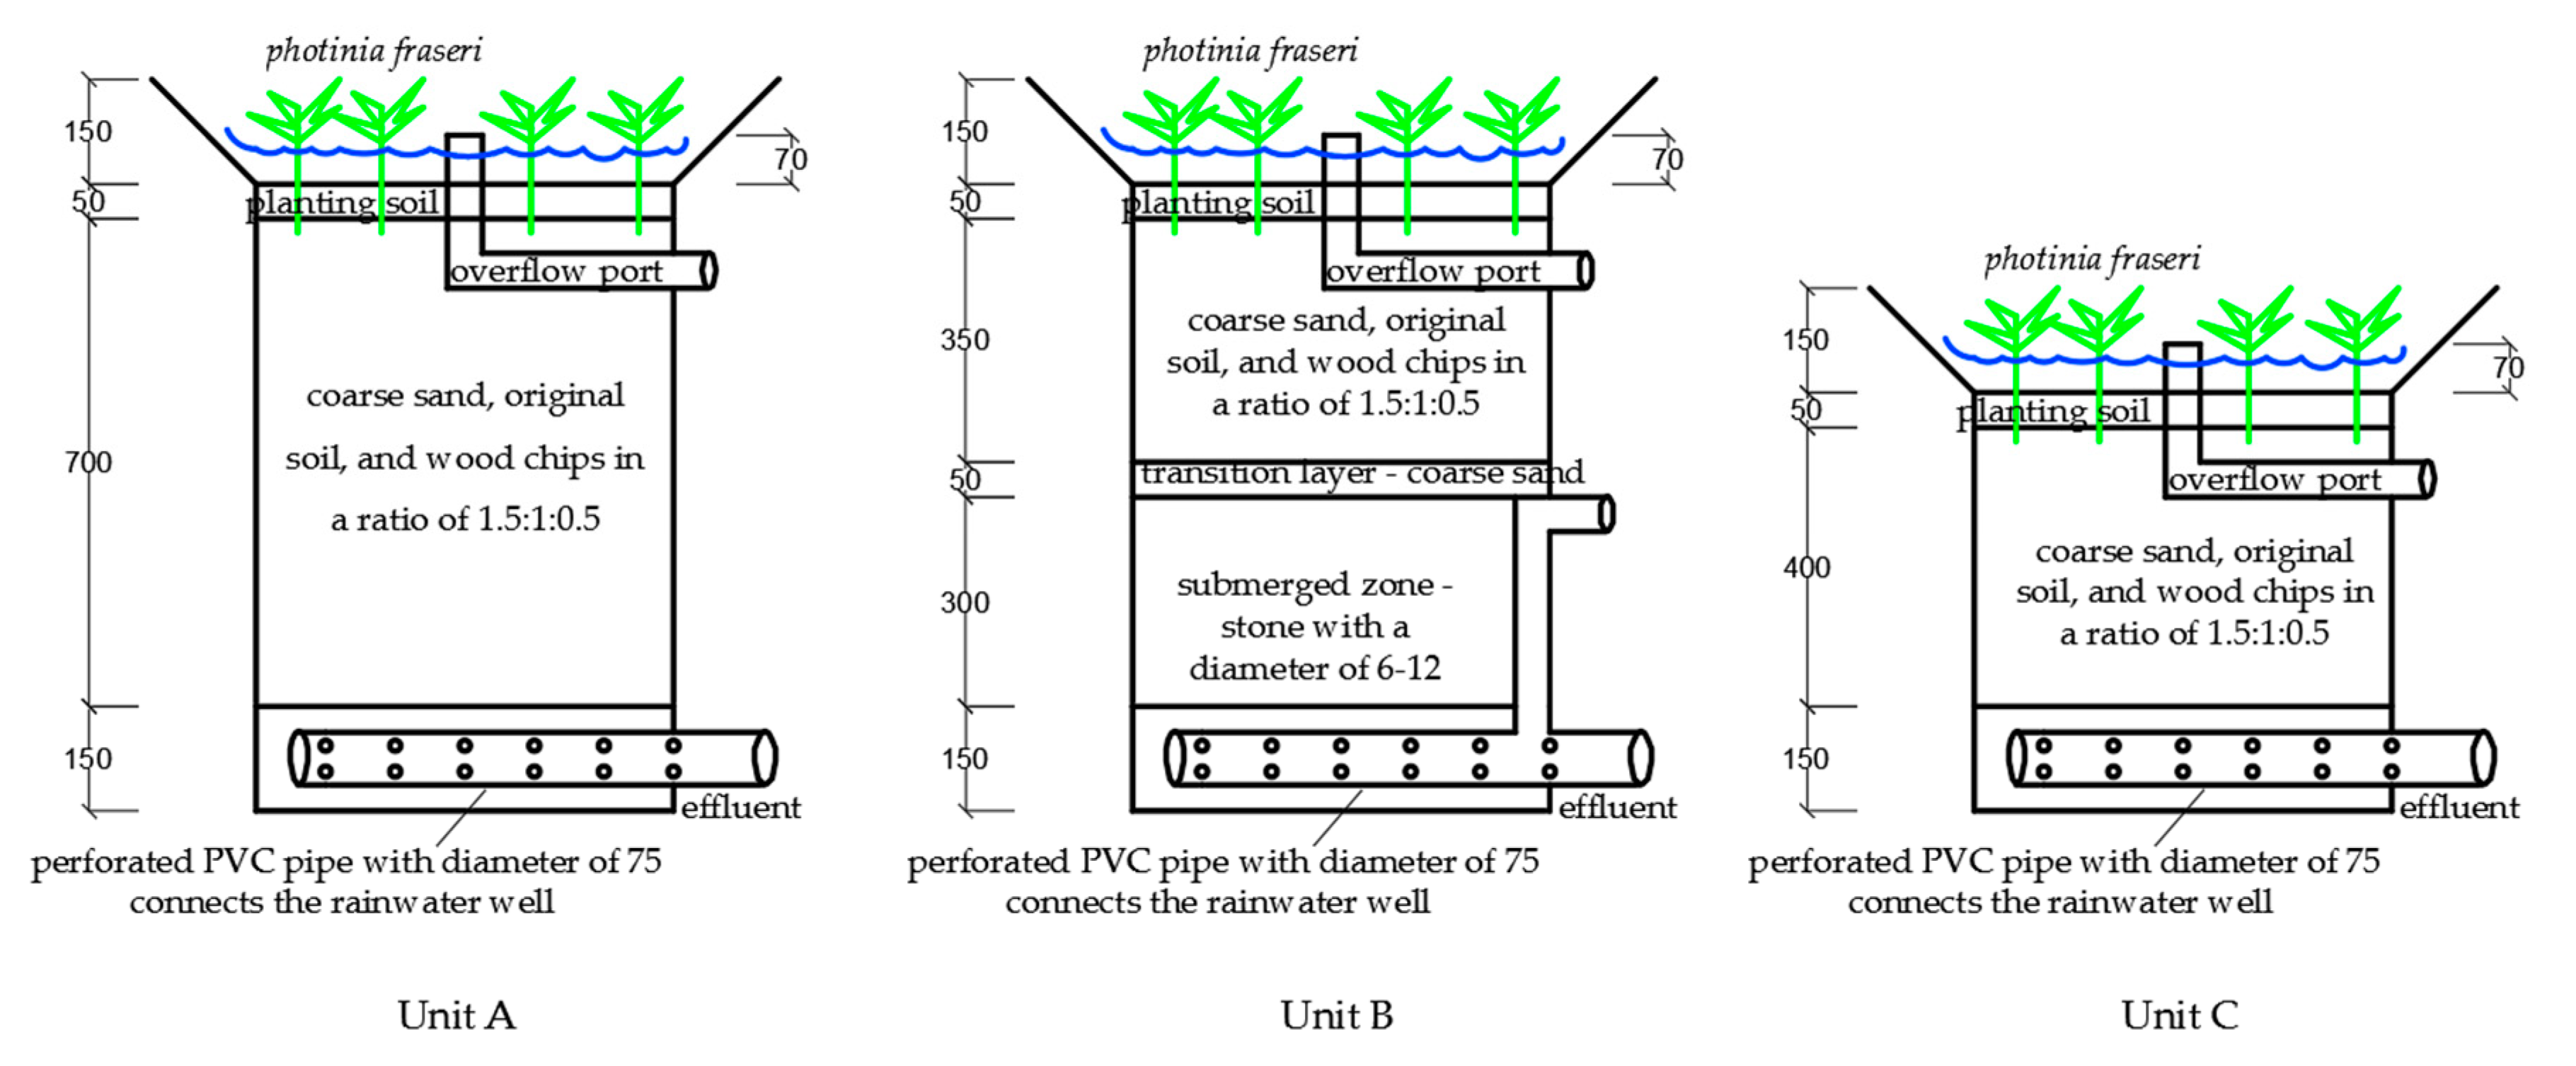
Three types of bioretention units with different configurations were designed and constructed according to the design idea of a rain garden. Design of the experimental bioretention units utilized in the current work is presented in Figure 1. Detailed configuration of the bioretention units is provided in Supplementary Materials (Table S1). All the experimental units had a uniform surface area: 2 × 1.5 m. The first bioretention unit (unit A) had a 700 mm height without a submerged zone. The artificial filler layer was uniformly mixed material of coarse sand, original soil, and wood chips in a ratio of 1.5:1:0.5. The original soil was undisturbed natural soil and the wood chips were added to the artificial filler layer mainly because they served as organic matter [12]. The second bioretention unit (unit B) had a 400 mm substrate with a 300 mm submerged zone, meanwhile, a vertical PVC tube of 300 mm height was laid at the bottom of the perforated pipe. A gravel layer with a height of 300 mm was laid on the upper part of the perforated pipe, and the gravel particle size was 6.35~12.7 mm. The third bioretention unit (unit C) had a 400 mm height without a submerged zone. The upper part of the filter material layer was covered with 50 mm planting soil. The construction details of the system are supposed to adapt to local environmental conditions [22], and Photinia fraseri were planted in the unit, which is a commonly available plant species (Hefei, China) with a planting density of 15 units per square meter. At the bottom of each unit, perforated water collection pipes with 75 mm diameter were arranged, and a perforated collector outlet was located at the original rain water storage tank located in the park. The overflow port in the pool was directly connected with the municipal pipe network.
2.2. Rainfall Event Selection and Hydrologic Parameters
In this study, the Chicago Design Storm (CDS) was selected for rainfall event simulation and analysis, which was proposed by Keifer and Chu in 1957 [23]. It is a non-uniformly designed rainfall storm pattern based on the relationships of intensity-duration-frequency (IDF) [4]. The selected rainfall patterns were 120 min rainfall duration separately under 2-, 5-, 10-, 15-, and 30-year rainfall recurrence intervals. The Chicago Design Storm determination process (Figure 2) includes the determination of the integrated rainfall peak position coefficient (r) and the rainfall hydrograph model [4]. Statistical results of the rainfall peak position coefficient (r) in different countries and regions, including China, are presented in the Supplementary Materials (Table S2) [24].
The instantaneous rainfall intensity before and after the rain peak can be calculated by the following formula [4]:
where i(tb) is the instantaneous intensity before rain peak, i(ta) is the instantaneous intensity after rain peak, ta and tb are the corresponding rainfall duration, r is the rainfall peak position coefficient. Taking a certain recurrence interval, the storm intensity formula is , noting that A, b, and n are constant parameters for a certain return period, which are calculated and determined by statistical methods. Specifically, A is the rainfall intensity parameter, indicating the 1 min design rainfall (mm) at the return period of 1 a; b is the rainfall duration correction parameter, which represents a time constant (min) added to the logarithm of the two sides of the storm intensity formula to draw the curve into a straight line; n is the rain attenuation index, related to the return period.
The Chicago synthetic rainstorm process line can be calculated by using formula (1) and (2). Afterwards, the Chicago design rainfall pattern corresponding to a certain recurrence interval and rainfall duration can be determined. The integrated rainfall peak position coefficient of Hefei in the current study was determined to be 0.4. The other parameters in the Hefei storm intensity formula are shown in Table 1, noting that parameter C is the rain force variation parameter (dimensionless). The CDS simulation rainfall patterns with 120 min duration in Hefei for return periods of 2, 5, 10, 15, and 30 years were calculated by EXCEL (Supplementary Materials (Table S3)). Rainfall data in different periods in Hefei during the 10-year recurrence interval and the average influent flow rate per 5 min under different recurrence intervals are provided in Supplementary Materials (Tables S3 and S4).
2.3. Influent Water Volume and Quality
Based on the simulation results of the rainfall intensity at each time interval in Hefei, the inflow flow rate per minute and the total water inflow of 120 min in the bioretention system under different rainfall recurrence intervals could be obtained (Supplementary Materials (Table S3)). Since the rainfall intensity was not changed much in a short period of time in the case of the experiment condition, the inflow flow rate was adjusted every 5 min in order to make the bioretention operation easier.
Xie et al. analyzed the SS, COD, TN, and TP water quality indicators of different rainfall runoffs and natural rainfall samples from 4 different types of underlying surfaces in Hefei city, and the scouring effect was compared between the rainfall runoff of different types of underlying surfaces and the concentration distribution of pollutants in natural rainfall samples, and the average concentration of incidents of rainfall runoff pollutants was calculated [25]. According to the water quality characteristics of rainfall runoff on different underlying surfaces in Hefei city, the synthetic runoff in the current study was prepared to mimic local highly polluted runoff characteristics of COD, TP, TN, NH4+-N, and NO3−-N (Table 2).
2.4. Experimental Procedure
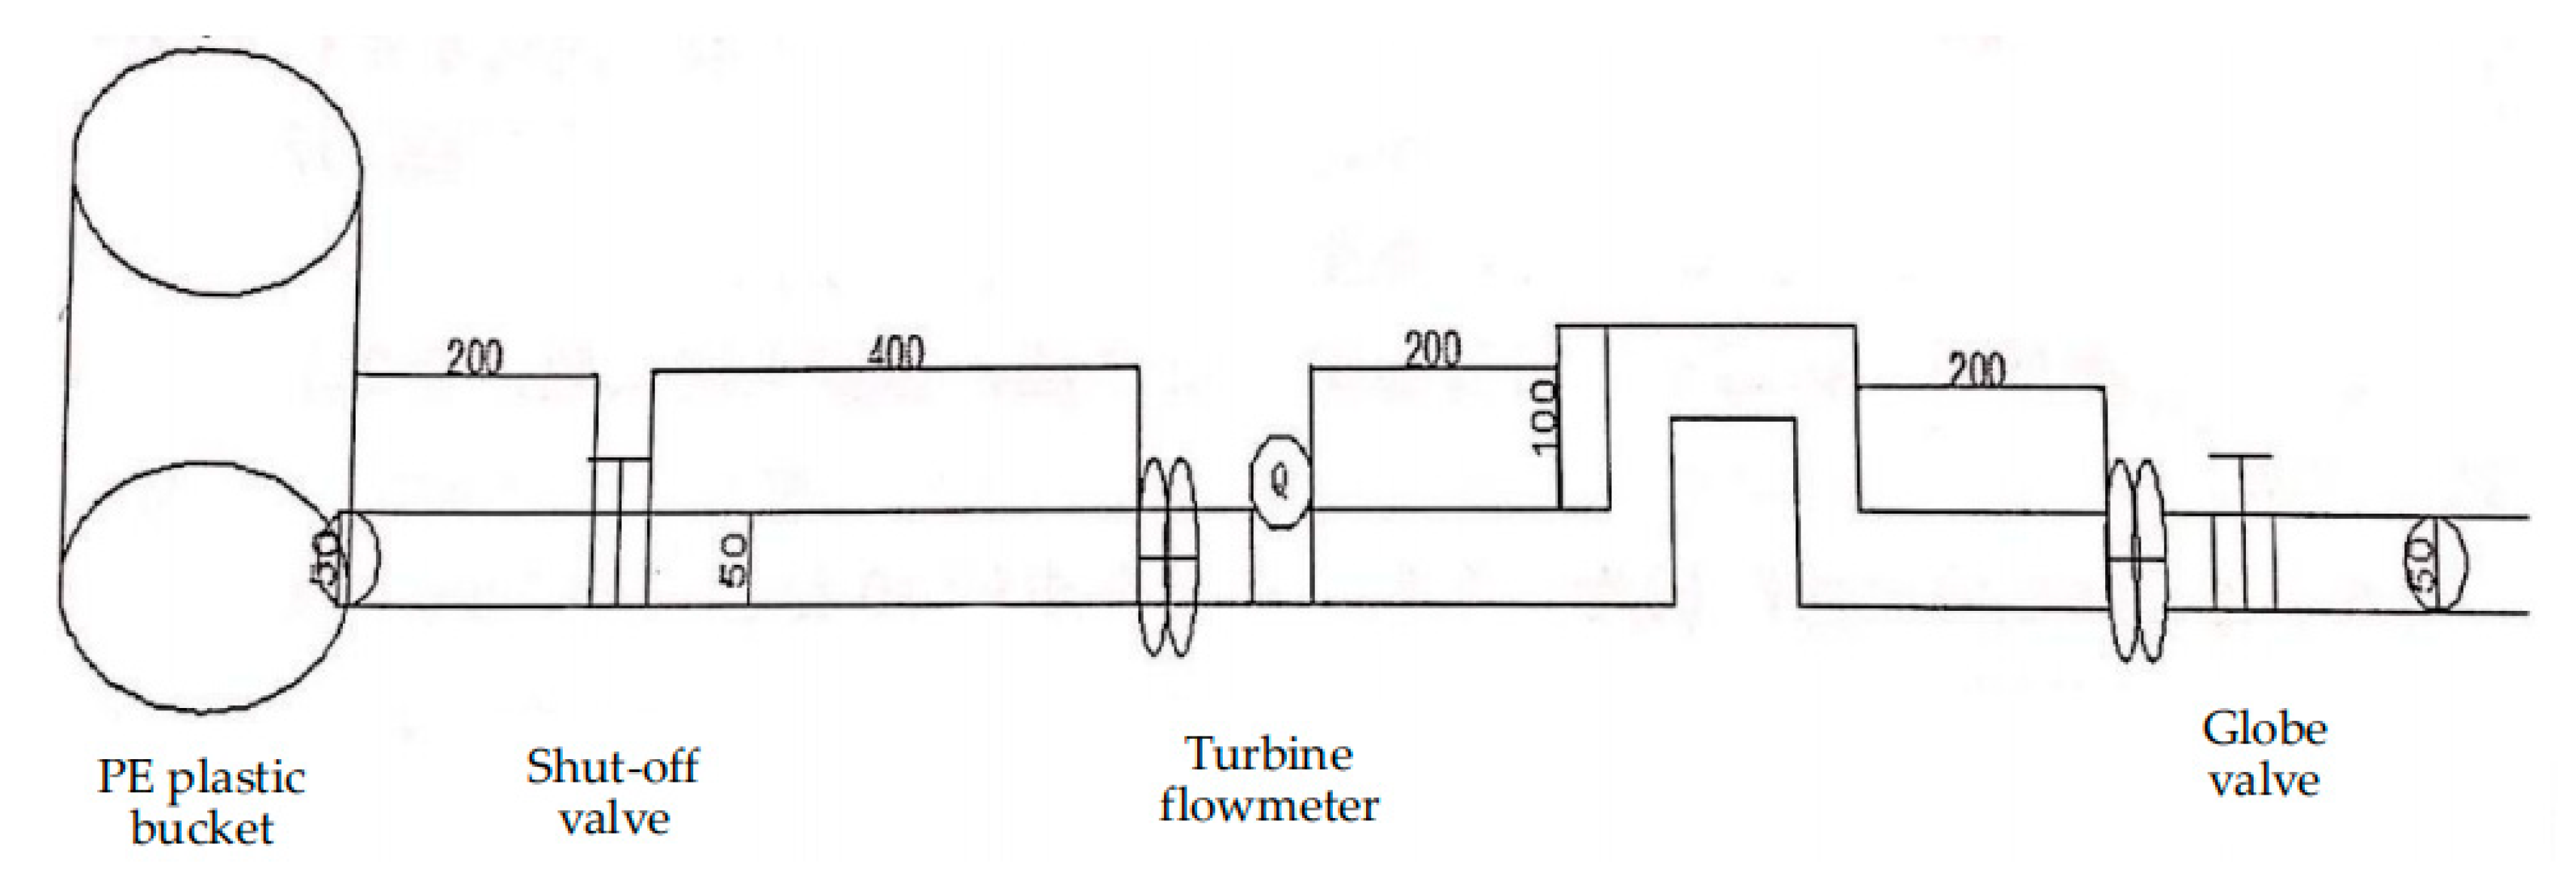
Three mesocosm bioretention units were installed and operated with synthetic runoff for two hours at one-week intervals for five rainfall events (five rainfall recurrence intervals) during the month of May to September, 2016 (at 23~38 °C). According to the runoff pollution load shown in Table 2, the synthetic water was prepared in the laboratory and added to the storage unit (bucket) (Figure 3), and the amount of sample water was the total rainfall under a specific return period. In the experimental process, the water inflow of 5-min intervals is shown in Supplementary Materials (Table S5). The total water inflows under 2-, 5-, 10-, 15-, and 30-year recurrence intervals were 3.22 m3, 4.02 m3, 4.62 m3, 4.97 m3, and 5.58 m3, respectively. The turbine flow meter was used to control the outlet flow and total water output and the valves were adjusted according to the outlet flow rate until the experimental requirements were met. Bioretention units A, B, and C were sequentially conducted to the above experimental steps, while the interval of rainfall was supposed to be one week. The above test steps were repeated with different pollution loads under 2-, 5-, 10-, 15-, and 30-year recurrence intervals.
2.5. Sampling and Data Analysis
Discrete samples were collected to investigate the variation in water quality during a runoff event. The inlet and outlet water samples were collected at the 30-min intervals after the unit began to have stable water discharge. The total volume of each sample was 2.0L. The samples collected and analyzed for SS, CODMn, TP, NH4+-N, NO3—N, and TN, which are the primary stormwater pollutants [26].
In this study, the event mean concentration (EMC) removal method, recommended by the American Society of Civil Engineers and the Environmental Protection Agency (ASCE-EPA) [27], was used to calculate the removal efficiency:
where EMCi and EMCo were the event mean concentration of various pollutants in the inflow and outflow, respectively.
All the box-and-whisker plots were drawn using OriginPro 2015 (OriginLab Corp., Northampton, MA, USA). Significant statistical difference analyses were performed by the statistical software package PASW Statistics 19.0 (SPSS Inc., Chicago, IL, USA). Meanwhile, ANOVA was used to test the significant difference in the removal efficiencies of various pollutants.
3. Results and Discussion
To evaluate the pollutant removal efficiency of the three bioretention systems, the concentration of contaminants in the water at the outlet under the given five rainfall scenarios was detected and compared to the inlet water. Statistical analysis was conducted on pollutant removal and load reduction rate for the bioretention facilities with the consideration that the pollutant removal and load reduction rate are 100% if no outflow and overflow occur. The pollutant removal efficiency and load reduction of the bioretention facilities are presented in Table 3.
3.1. SS Removal
Earlier studies revealed that bioretention has the ability to capture SS and other solids due to its capacity for sedimentation and filtration [28]. Figure 4 reveals that the removal rate of SS in all 3 units reached the highest level at the 5-year return period, and decreased slightly afterwards. The removal efficiency of SS fluctuated greatly in the single inlet process, but the average removal efficiency varied slightly in different structures of the bioretention units and in different recurrence intervals. However, the impact of climate-change-induced precipitation increase on SS retention has not been clearly assessed [29]. The concentration of SS in effluent was generally stable at 30 mg/L, and some effluent SS could even be optimized below 20 mg/L. In the current study, under the five rainfall scenarios, the average removal efficiency in unit A and B was around 64%, comparatively lower than other studies. Brown and Hunt demonstrated that removal performance for the SS was less variable than other nutrient parameters, the value of which was between 70 to 80% [28], whereas the SS removal rate was consistently over 95% in the work of Bratieres et al. [30]. Hatt et al. presented that loads of SS were effectively reduced by all filter types, despite variability in inflow pollutant concentrations [31]. Only the initial runoff SS concentration reached 150 mg/L, and then the influent SS concentration was maintained at 60 mg/L in the current experiment. When compared to the removal rate of unit A and unit B, it indicated that a higher filter layer would bring better results, which is consistent with the conclusion obtained by Brown and Hunt [28].
3.2. CODMn Removal
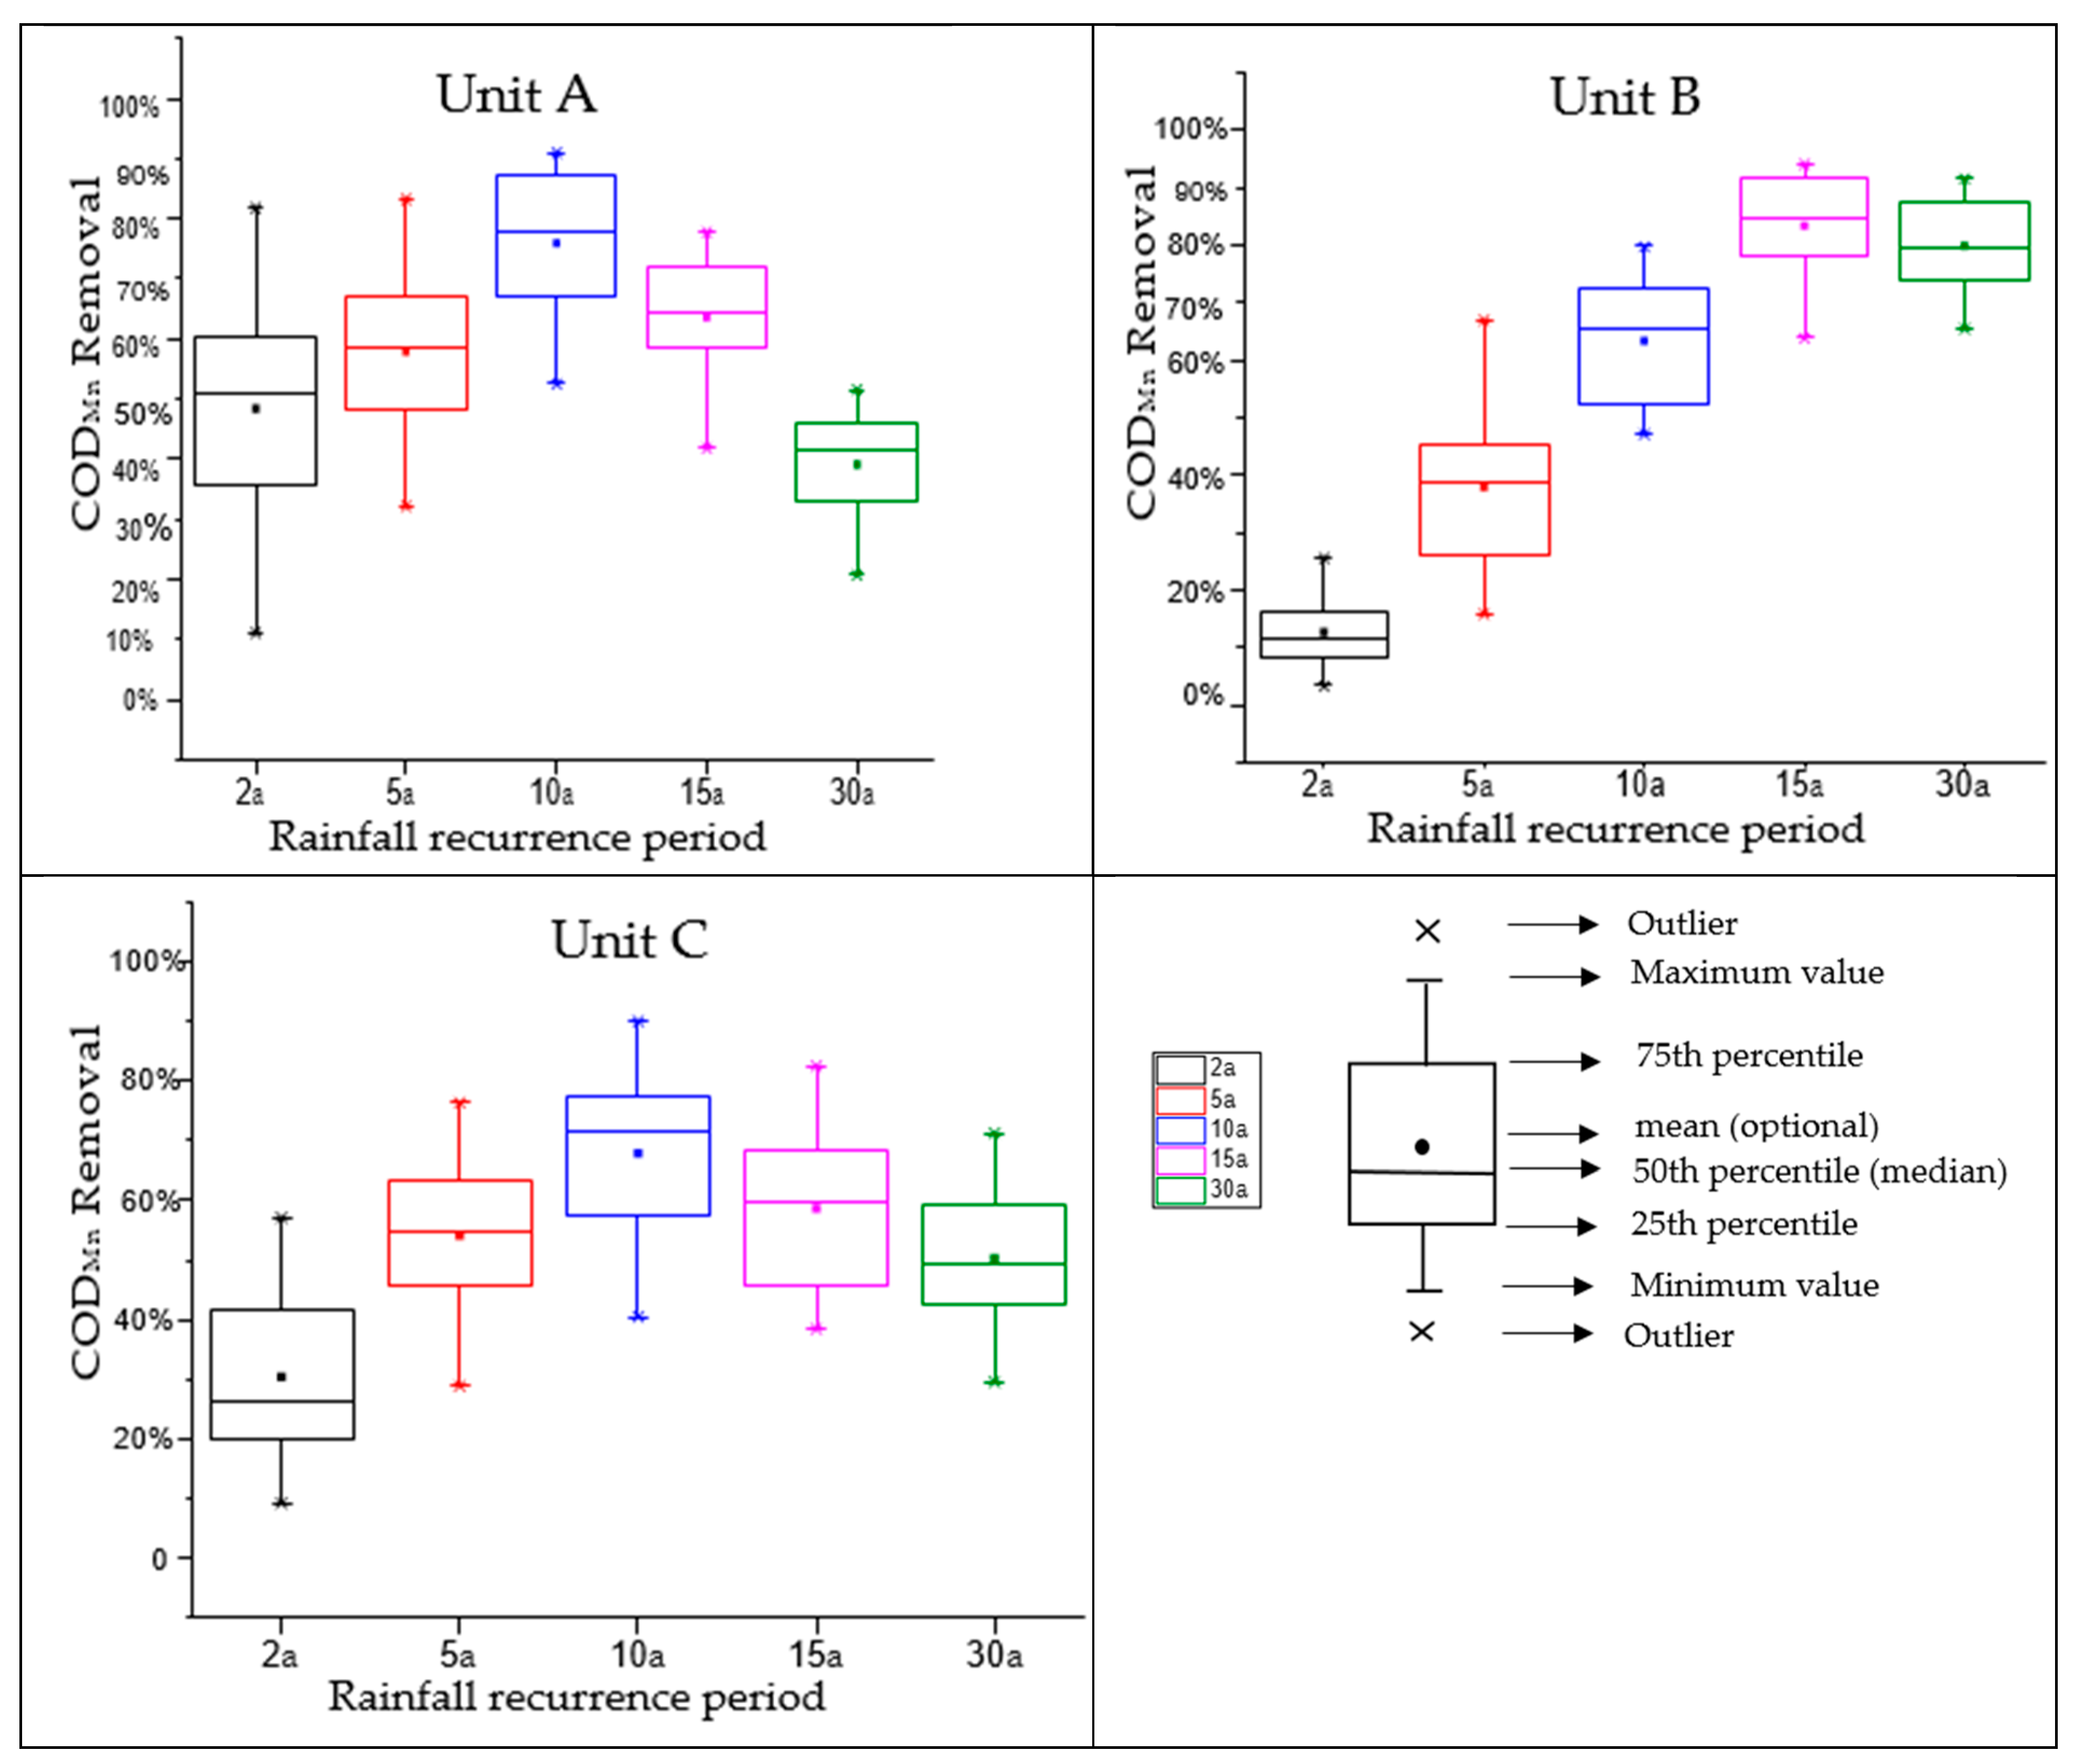
Figure 5 presents the mean concentration removal efficiency for CODMn. It revealed that in the early stage of the systems, due to the decay of the wood chips added by the artificial filler, the number of microbes in the system was too small to decompose large quantities of pollutants, resulting in the lower removal efficiency (≥12.7% in unit B). After the systems were stabilized, the degradation of organic matter was promoted with the increase of oxygen content and the microbial population of the systems, leading to the rapid increase of the CODMn removal in the three bioretention units (the highest removal rate of unit B in the 15 year recurrence interval reached up to 94.2%). Li et al. found that the CODMn removal efficiency with different thicknesses of filter varied between 65%~75% [32]. However, as the experiment continued, with the further increase of the rainfall recurrence interval, the CODMn adsorption capacity of the filler was gradually saturated. Under scouring action of the runoff, the CODMn leaching from the filler led to a gradual decline of the removal effect. The same phenomenon appeared in the experiment of Jiang et al. and Shrestha et al. [19,33]. Among the three bioretention units, unit A showed the best performance on CODMn removal. It could be deduced that CODMn removal was least affected by the rainfall intensity in the case of the higher filler layer, which was similar to the findings of Liu [34]. Unit B showed better performance than unit C, indicating that setting a submerged zone could improve CODMn removal efficiency in some extent.
3.3. TP Removal
The mean TP removal rates in this study are presented in Figure 6, which shows unit A fluctuated between the range of 50%~85%, unit B was slightly lower than unit A, and unit C had the least ideal performance (at around 30%). Several studies have measured the TP removal efficiency in bioretention systems. For example, reports of labile P removal by bioretention to date have been extremely variable: from 78 to 98% for soluble reactive phosphorus (SRP) [35]. Li et al. found that soluble reactive phosphorus removal rate in bioretention systems was in the range of 65%~85% [36]. Shrestha et al. noted that the removal rate of TP in bioretention systems with different configurations was 50%~70% [33]. In contrast to these studies, TP removal efficiency in this study was generally lower. This could be because the original soil around the bioretention units was buried in the park building and domestic garbage, which caused the removal efficiency to fluctuate greatly and be relatively low. The relatively higher TP reduction happened in unit A, which demonstrated that the height of the filler layer was critical for the removal of TP, while the setting of the submerged area results in a reduction in TP removal. Earlier studies also reveal that setting a submerged area exerted minimal influence on the TP removal in different filler combinations [33,36].
3.4. Nitrogen Removal
In contrast with other synthetic stormwater pollutant parameters, nitrogen species are more difficult to remove due to being highly soluble and strongly affected by the variable wetting and drying regime inherent in bioretention system [37]. Removal efficiency of various nitrogen species in bioretention units is presented in Figure 7. In the current study, both unit A and B were effective on NH4+-N with a removal rate of 69%. Results reveal that three units were not effective for removing NO3—N where the mean removal was in the range of 28%~53%. For TN removal, unit A and unit B showed better removal effect, and the effluent water quality could reach the surface V water standard, which is stipulated by the Standard for Surface Water Environmental Quality (GB3838-2002), representing water qualities that are suitable for agricultural water use, as well as general landscape requirements, and water bodies that exceed V water quality standards are useless. Meanwhile, the unit C removal effect was poor, which was more affected by the rainfall return period. With the gradual increase of rainfall return period, the effects of NH4+-N and TP removal were significantly reduced, similar to the results of Li et al. [32].
Comparing the performance of the three units, results indicated that the height of the filler layer had a greater influence on the removal effect of NH4+-N and TN under different rainfall recurrence intervals, which is the same conclusion as that obtained by Liu [34]. The NH4+-N removal efficiency in unit B was lower than that of unit A under most recurrence intervals. The reason may be that the existence of submerged area affected the aerobic environment of the whole system, resulting in lower removal efficiency [37,38]. However, unit B with a submerged area had the best removal effect on TN, and was least affected by the change of rainfall intensity, which indicated the same conclusion as that obtained by Afrooz and Boehm [39]. All the three units had a large fluctuation in the removal effect of NO3−-N, and the removal effect was not ideal. Nitrate removal in bioretention systems equipped with drains is usually worse than that in NH4+-N due to its poor adsorption capacity on most of the soils or filtration media [40]. The results from the experiment of Brown et al. revealed another reason, which reported that the residual ammonia and organic nitrogen could be nitrated to nitrate during aerobic circumstances in the filler layer during the rainfall events, resulting in low nitrate removal or even excessive leaching during subsequent events [37].
The performance of bioretention systems is dynamic as a function of media depth, rainfall pattern, and retention time. The configuration of the saturated zone and optimized depth of filler layers can provide a favorable condition for pollutant removal under random inflow conditions. The factors, including climate, rainfall pattern, and runoff pollutant load, should be taken into consideration when designing a roadside bioretention system. Given the innovated pollutant removal ability of the bioretention system under different rainfall recurrence intervals in the case of 120 min rainfall duration, further studies should evaluate the design and removal efficiency under different rainfall duration.
4. Conclusions
The results of the simulated rainfall events under five different rainfall intervals in three different bioretention systems reveal that: (1) with the gradual increase of rainfall recurrence interval, TN and NH4+-N concentration reduction showed a significant decrease, while CODMn removal rate also declined slightly. SS and TP showed no obvious change under different intervals. (2) In most of the cases, the pollutant parameters presented higher removal efficiency with the higher filler layer in the current study. (3) A submerged zone improved CODMn and TN removal rates, but resulted in a slight reduction of TP and NH4+-N removal. (4) For the comprehensive reduction rate of the pollutant load, suspended solids (SS) were effectively removed, with a 64% mean concentration removal in unit A and unit B. The CODMn removal rates of the three bioretention units fluctuated heavily, reaching 85% in the case of the stabilized system. However, the phenomenon of CODMn leaching from the filler layer was common, which caused the higher concentration of the outflow. TP removal efficiency in the current study was 50%~80%, which might be affected by the surrounding soil conditions. For nitrogen species removal, NH4+-N concentration removal was about 69%; the TN concentration of the outlet in unit A and unit B could reach the surface V water standard. The NH3−-N removal was the least (28%~53%) and it requires further study for a clearer explanation.
Supplementary Materials
The following are available online at https://www.mdpi.com/2071-1050/11/7/2040/s1, Tables S1~S5.
Author Contributions
D.F. and R.P.S. conceived and designed the experiments. D.F. supervised the experiments and managed the funding. F.Z., J.S., and Q.J. performed the experiments, and along with R.P.S. analyzed the data. R.P.S. wrote the paper.
Acknowledgments
This work was financially supported by the National Key Research and Development Program of China (Grant No. 2018YFC0809900).
Conflicts of Interest
The authors declare no conflict of interest.
References
- Liu, Z.; Li, J.; Li, P.; Li, Y.; Li, W. Study of bioretention system on heavy-metal removal effect. Pol. J. Environ. Stud. 2017, 27, 163–173. [Google Scholar] [CrossRef]
- Brezonik, P.L.; Stadelmann, T.H. Analysis and predictive models of stormwater runoff volumes, loads, and pollutant concentrations from watersheds in the twin cities metropolitan area, Minnesota, USA. Water Res. 2002, 36, 1743–1757. [Google Scholar] [CrossRef]
- Mohammed, A.; Babatunde, A.O. Modelling heavy metals transformation in vertical flow constructed wetlands. Ecol. Model. 2017, 354, 62–71. [Google Scholar] [CrossRef] [Green Version]
- Uruya, W.; Winai, C.; Muhammad Mudassar, R.; Sutat, W. Modification of a design storm pattern for urban drainage systems considering the impact of climate change. Eng. Appl. Sci. Res. 2017, 44, 161–169. [Google Scholar]
- Pochwat, K.B.; Słyś, D. Application of artificial neural networks in the dimensioning of retention reservoirs. Ecol. Chem. Eng. S 2018, 25, 605–617. [Google Scholar] [CrossRef]
- Mazurkiewicz, K.; Skotnicki, M.; Cimochowicz-Rybicka, M. The influence of synthetic hyetograph parameters on simulation results of runoff from urban catchment. E3S Web Conf. 2018, 30, 01018. [Google Scholar] [CrossRef] [Green Version]
- Davydova, Y.; Volkova, Y.; Nikonorov, A.; Aleksandrovskiy, M. Drainage of small volume reservoirs on the technogenic territories. MATEC Web Conf. 2018, 170, 02025. [Google Scholar] [CrossRef]
- Douglas, N.I. On-site stormwater detention: Improved implementation techniques for runoff quantity and quality management in Sydney. Water Sci. Technol. 1995, 32, 85–91. [Google Scholar]
- Guo, X.C.; Zhao, D.Q.; Du, P.F.; Li, M. Automatic setting of urban drainage pipe monitoring points based on scenario simulation and fuzzy clustering. Urban Water J. 2018, 15, 700–712. [Google Scholar] [CrossRef]
- Liang, J.; Melching, C.S. Experimental evaluation of the effect of storm movement on peak discharge. Int. J. Sediment Res. 2015, 30, 167–177. [Google Scholar] [CrossRef]
- De, M.M.; Rosa, A.; Do, C.L.; Mendiondo, E.M.; De, V.S. Learning from the operation, pathology and maintenance of a bioretention system to optimize urban drainage practices. J. Environ. Manag. 2017, 204, 454–466. [Google Scholar]
- Wang, C.; Wang, F.; Qin, H.; Zeng, X.; Li, X.; Yu, S.-L. Effect of saturated zone on nitrogen removal processes in stormwater bioretention systems. Water 2018, 10, 162. [Google Scholar] [CrossRef]
- Hao, W.; Chao, M.; Liu, J.H.; Shao, W.W. A new strategy for integrated urban water management in China: Sponge city. China Technol. Sci. 2018, 61, 317–329. [Google Scholar]
- Zhang, L.; Lu, Q.; Ding, Y.; Peng, P.; Yao, Y. Design and performance simulation of road bioretention media for sponge cities. Perform. Constr. Facil. 2018, 32, 04018061. [Google Scholar] [CrossRef]
- Davis, A.P. Green engineering principles promote low impact development. Environ. Sci. Technol. 2005, 39, 338–344. [Google Scholar] [CrossRef]
- Mei, C.; Liu, J.; Wang, H.; Yang, Z.; Ding, X.; Shao, W. Integrated assessments of green infrastructure for flood mitigation to support robust decision making for sponge city construction in an urbanized watershed. Sci. Total Environ. 2018, 639, 1394–1407. [Google Scholar] [CrossRef]
- Chin, D.A. Designing bioretention areas for stormwater management. Environ. Proc. 2017, 4, 1–13. [Google Scholar] [CrossRef]
- Gülbaz, S.; Kazezyılmaz-Alhan, C.M. Hydrological model of LID with rainfall-watershed-bioretention system. Water Resour. Manag. 2017, 31, 1931–1946. [Google Scholar] [CrossRef]
- Jiang, C.; Li, J.; Li, H.; Li, Y.; Chen, L. Field performance of bioretention systems for runoff quantity regulation and pollutant removal. Water Air Soil Pollut. 2017, 228, 468. [Google Scholar] [CrossRef]
- Kim, S.; An, K. Exploring psychological and aesthetic approaches of bioretention facilities in the urban open space. Sustainability 2017, 9, 2067. [Google Scholar] [CrossRef]
- Guo, J.; Yu, B.; Zhang, Y.; Che, S. Predicted models for potential canopy rainfall interception capacity of landscape trees in Shanghai, China. Eur. J. For. Res. 2017, 136, 387–400. [Google Scholar] [CrossRef]
- Tahvonen, O. Adapting bioretention construction details to local practices in Finland. Sustainability 2018, 10, 276. [Google Scholar] [CrossRef]
- Keifer, C.J.; Chu, H.H. Synthetic storm pattern for drainage design. J. Hydraul. Div. 1957, 83, 1–25. [Google Scholar]
- Taylor, S.R.; Mclennan, S.M. The geochemical evolution of the continental crust. Rev. Geophys. 1995, 33, 241–265. [Google Scholar] [CrossRef]
- Xie, J.F.; Hu, Z.X.; Xu, T.; Han, H.Y.; Yin, D.Q. Analysis on characteristics of rainfall runoff water quality of different underlying surfaces in Hefei City. J. China Environ. Sci. 2012, 32, 1018–1025. (In Chinese) [Google Scholar]
- Mangangka, I.R.; Liu, A.; Egodawatta, P.; Goonetilleke, A. Performance characterisation of a stormwater treatment bioretention basin. J. Environ. Manag. 2015, 150, 173–178. [Google Scholar] [CrossRef] [Green Version]
- American Public Health Association; American Water Works Association; Water Environment Federation. Standard Methods for the Examination of Water and Wastewater, 22nd ed.; American Public Health Association, American Water Works Association, Water Environment Federation: Washington, DC, USA, 2012. [Google Scholar]
- Brown, R.A.; Hunt, W.F. Impacts of media depth on effluent water quality and hydrologic performance of undersized bioretention cells. J. Irrig. Drain. Eng. 2011, 137, 132–143. [Google Scholar] [CrossRef]
- Cording, A.; Hurley, S.; Adair, C. Influence of critical bioretention design factors and projected increases in precipitation due to climate change on roadside bioretention performance. J. Environ. Eng. 2018, 144, 04018082. [Google Scholar] [CrossRef]
- Bratieres, K.; Fletcher, T.; Deletic, A.; Zinger, Y. Nutrient and sediment removal by stormwater biofilters: A large-scale design optimisation study. Water Res. 2008, 423, 930–3940. [Google Scholar] [CrossRef] [PubMed]
- Hatt, B.E.; Fletcher, T.D.; Deletic, A. Hydraulic and pollutant removal performance of fine media stormwater filtration systems. Environ. Sci. Technol. 2008, 42, 2535–2541. [Google Scholar] [CrossRef]
- Li, J.; Zhao, R.; Li, Y.; Chen, L. Modeling the effects of parameter optimization on three bioretention tanks using the Hydrus-1d model. J. Environ. Manag. 2018, 217, 38–46. [Google Scholar] [CrossRef]
- Shrestha, P.; Hurley, S.E.; Wemple, B.C. Effects of different soil media, vegetation, and hydrologic treatments on nutrient and sediment removal in roadside bioretention systems. Ecol. Eng. 2018, 112, 116–131. [Google Scholar] [CrossRef]
- Liu, J. The Design and Operation of the Bioretention with Submerge Area Zone. Ph.D. Thesis, Southeast University, Nanjing, China, 2015. (In Chinese). [Google Scholar]
- Lefevre, G.H.; Paus, K.H.; Natarajan, P.; Gulliver, J.S.; Novak, P.J.; Hozalski, R.M. Review of dissolved pollutants in urban storm water and their removal and fate in bioretention cells. J. Environ. Eng. 2015, 141, 04014050. [Google Scholar] [CrossRef]
- Li, J.; Liang, Z.; Li, Y.; Li, P.; Jiang, C. Experimental study and simulation of phosphorus purification effects of bioretention systems on urban surface runoff. PLoS ONE 2018, 13, e0196339. [Google Scholar] [CrossRef] [PubMed]
- Brown, R.A.; Birgand, F.; Hunt, W.F. Analysis of consecutive events for nutrient and sediment treatment in field-monitored bioretention cells. Water Air Soil Pollut. 2013, 224, 1581. [Google Scholar] [CrossRef]
- Wu, J.; Cao, X.; Zhao, J.; Dai, Y.; Cui, N.; Li, Z.; Cheng, S. Performance of biofilter with a saturated zone for urban stormwater runoff pollution control: Influence of vegetation type and saturation time. Ecol. Eng. 2017, 105, 355–361. [Google Scholar] [CrossRef]
- Afrooz, A.R.M.N.; Boehm, A.B. Effects of submerged zone, media aging, and antecedent dry period on the performance of biochar-amended biofilters in removing fecal indicators and nutrients from natural stormwater. Ecol. Eng. 2017, 102, 320–330. [Google Scholar] [CrossRef]
- Li, L.; Davis, A.P. Urban stormwater runoff nitrogen composition and fate in bioretention systems. Environ. Sci. Technol. 2014, 48, 3403–3410. [Google Scholar] [CrossRef]
Figure 1.
Bioretention units: structural details (Unit: mm).

Figure 2.
Flow chart of the Chicago Design Storm (CDS) Model [4].
Figure 2.
Flow chart of the Chicago Design Storm (CDS) Model [4].
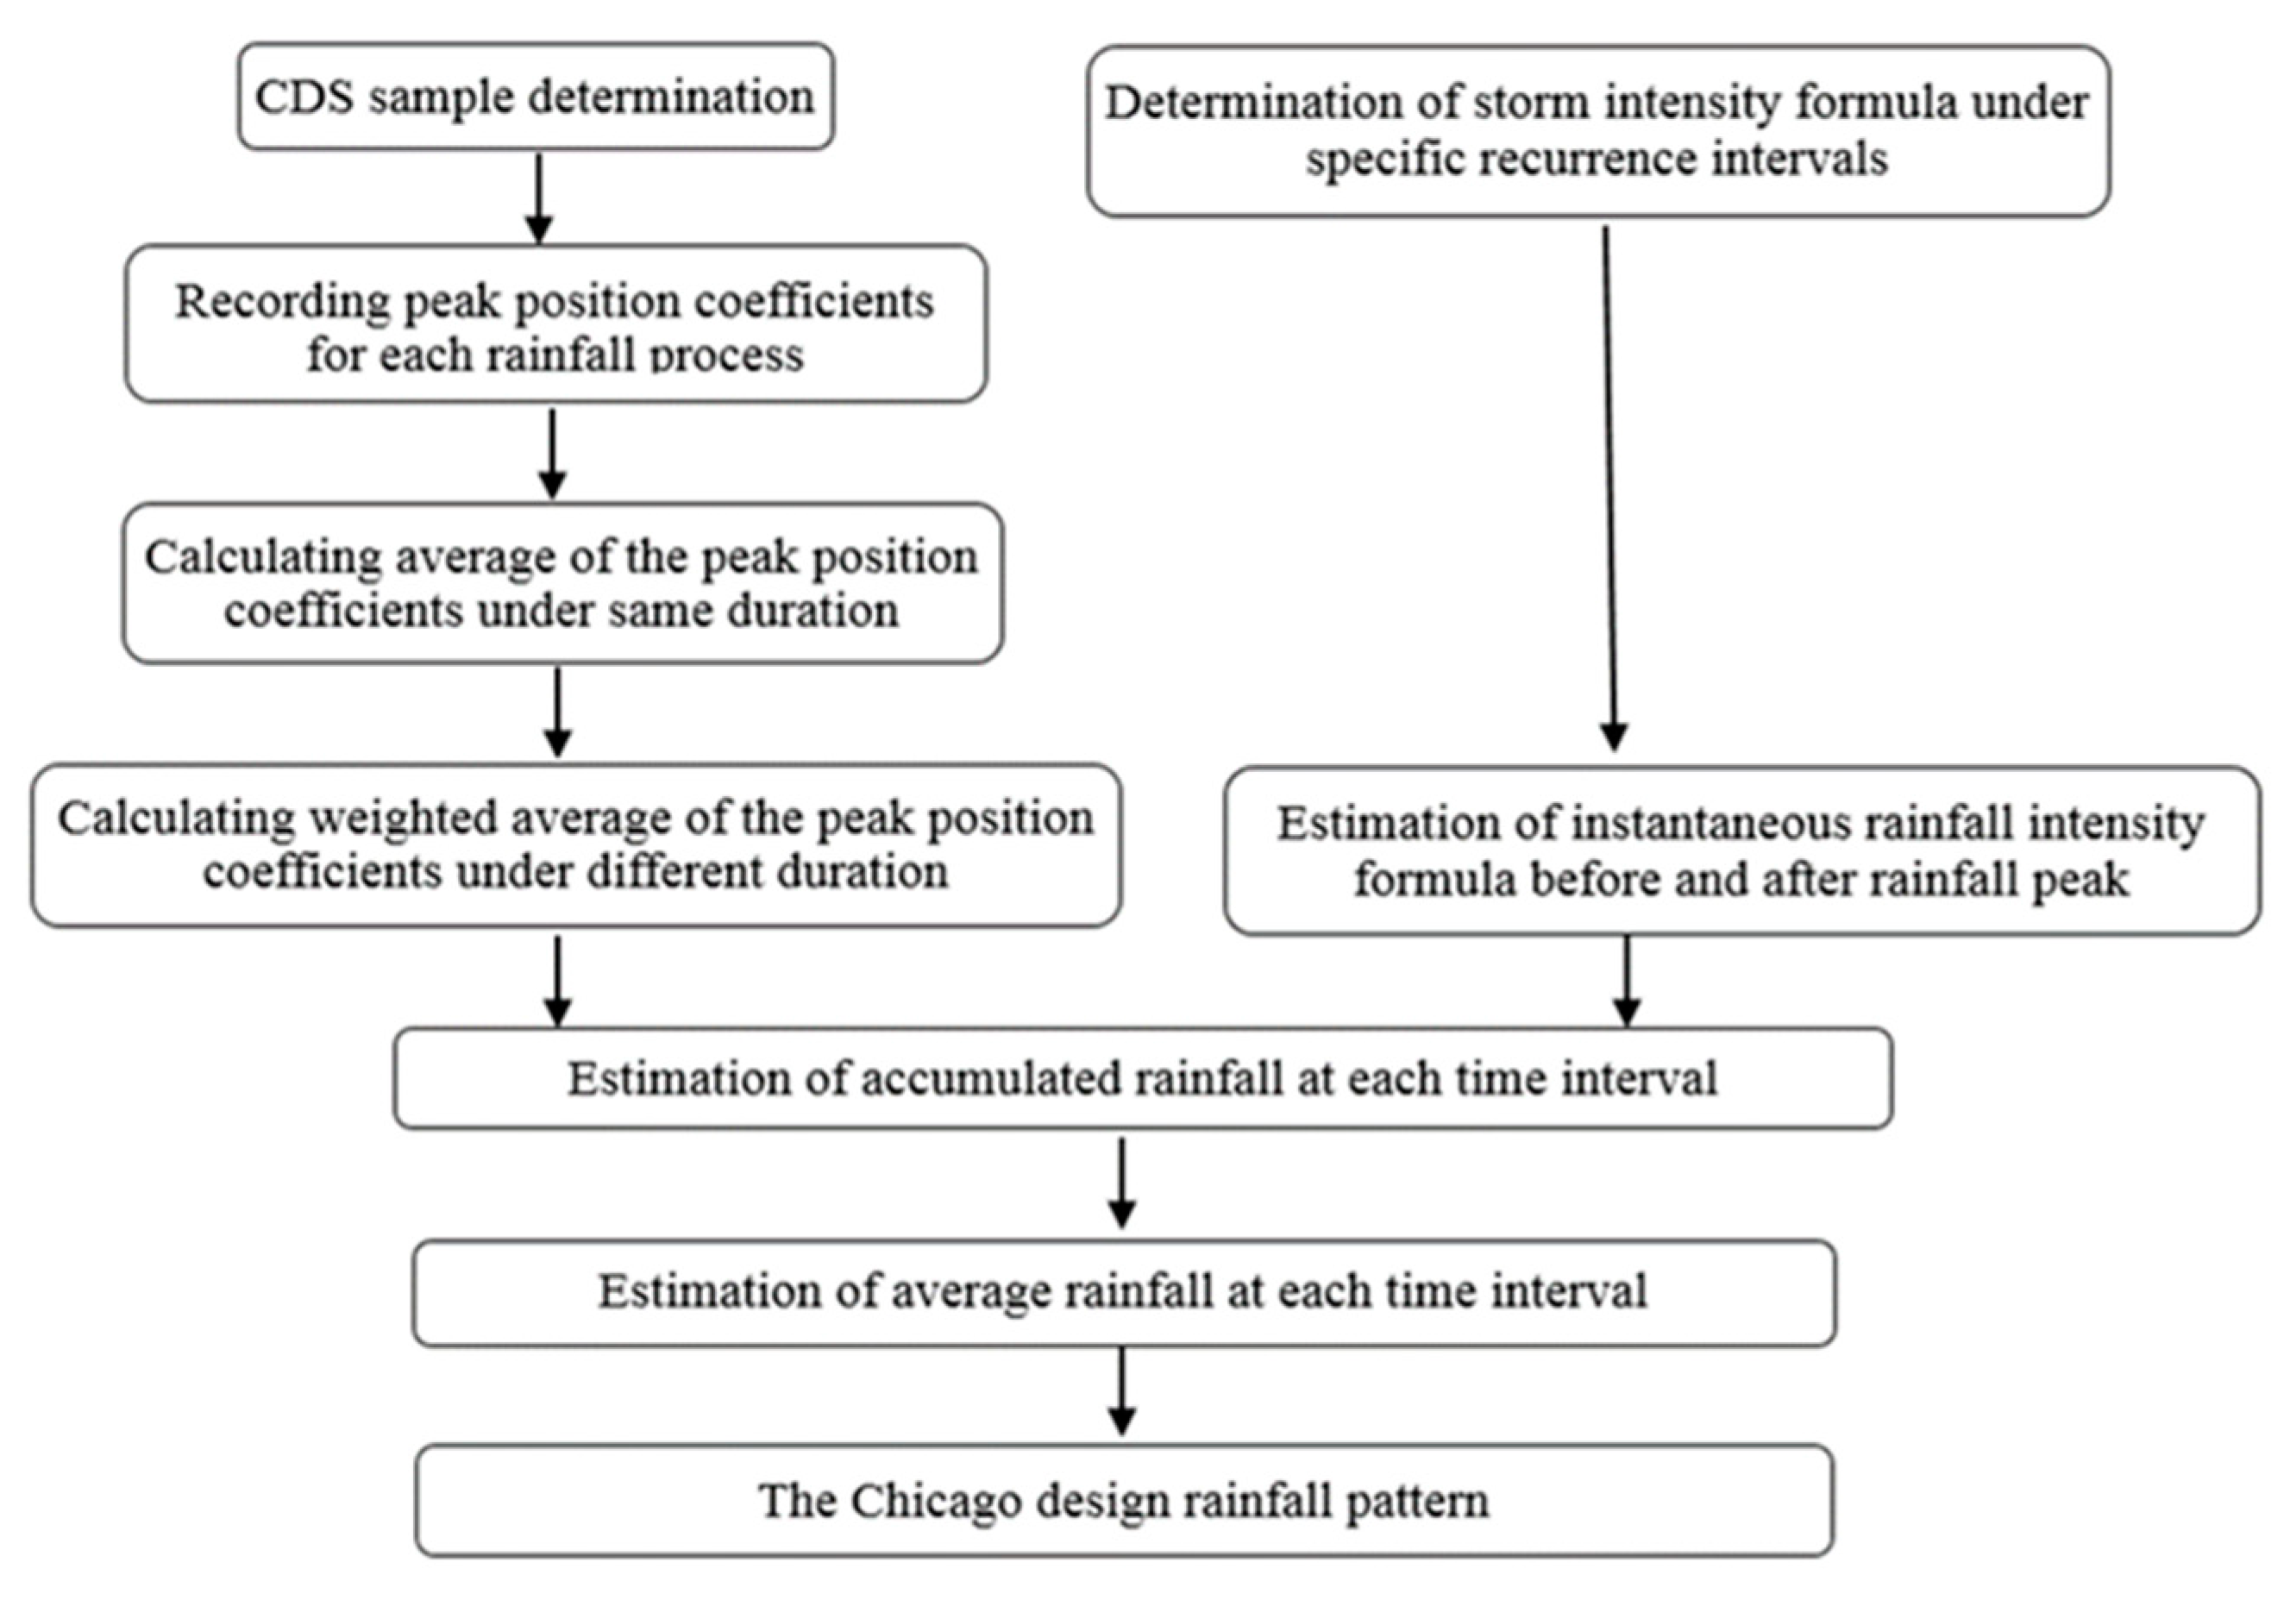
Figure 3.
Experimental device and process flow chart (unit: mm).

Figure 4.
Removal efficiency of SS in bioretention units (A–C).
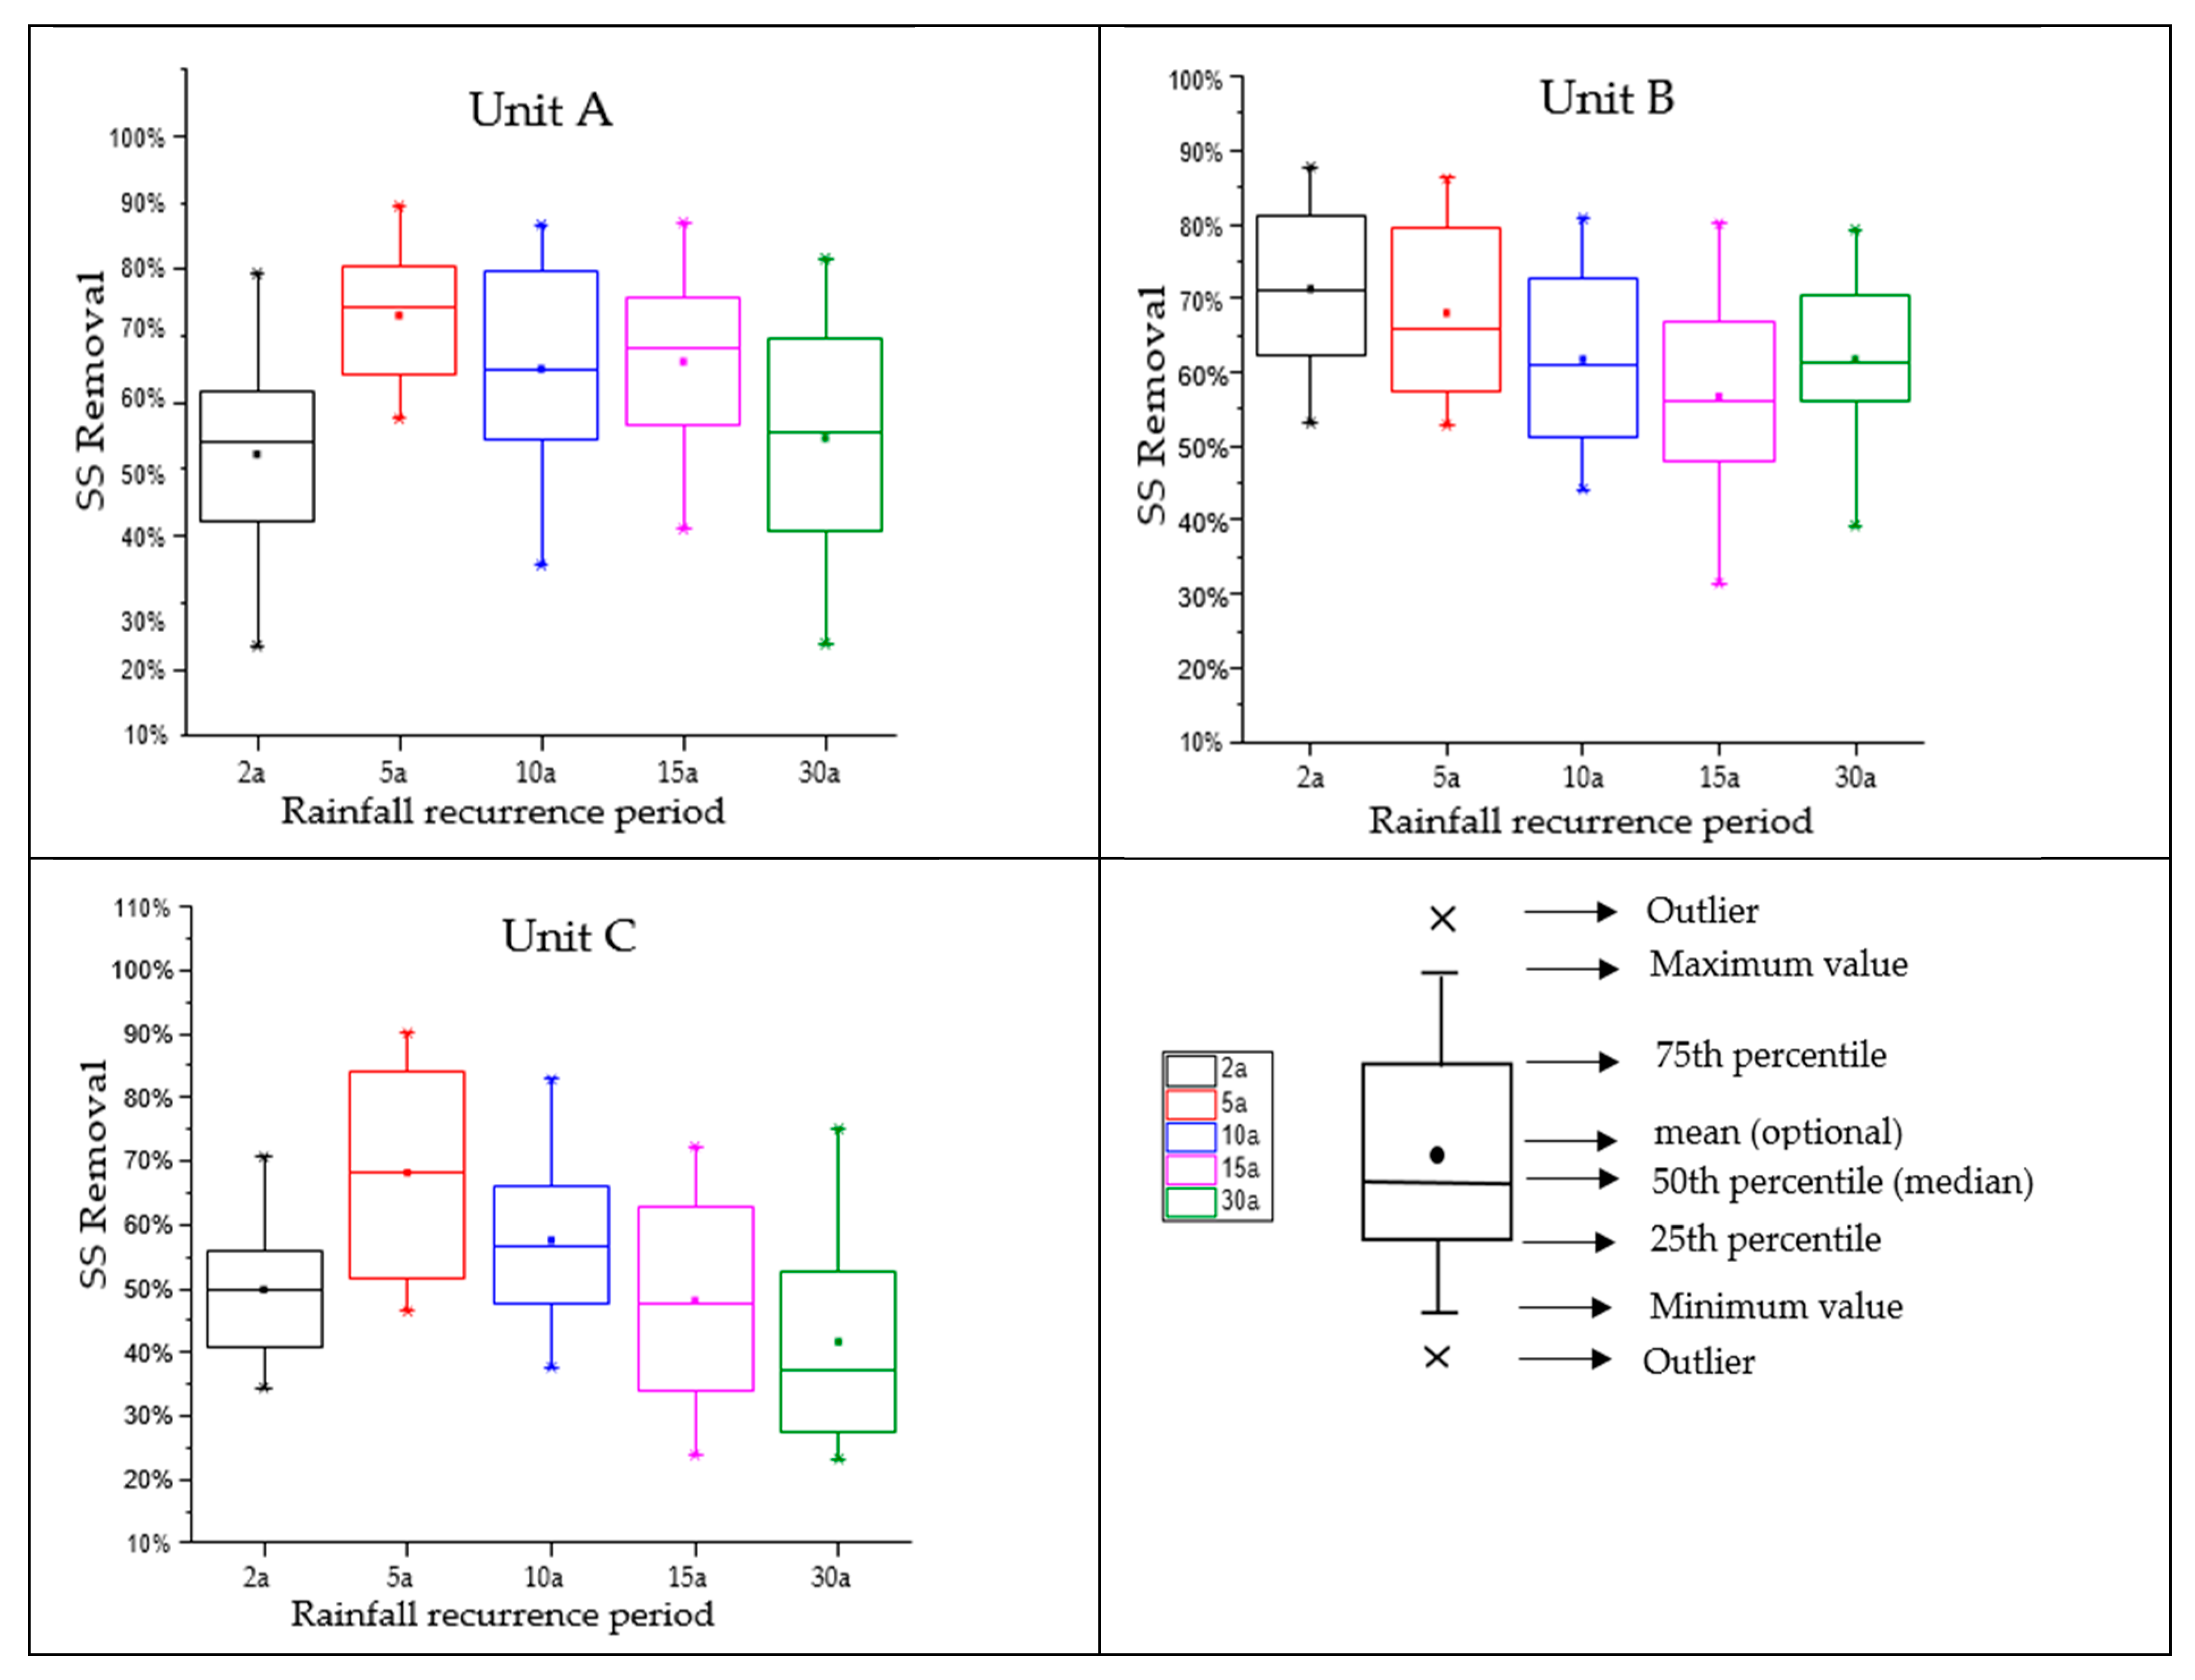
Figure 5.
Removal efficiency of CODMn bioretention units (A–C).

Figure 6.
Removal efficiency of TP in bioretention units (A–C).
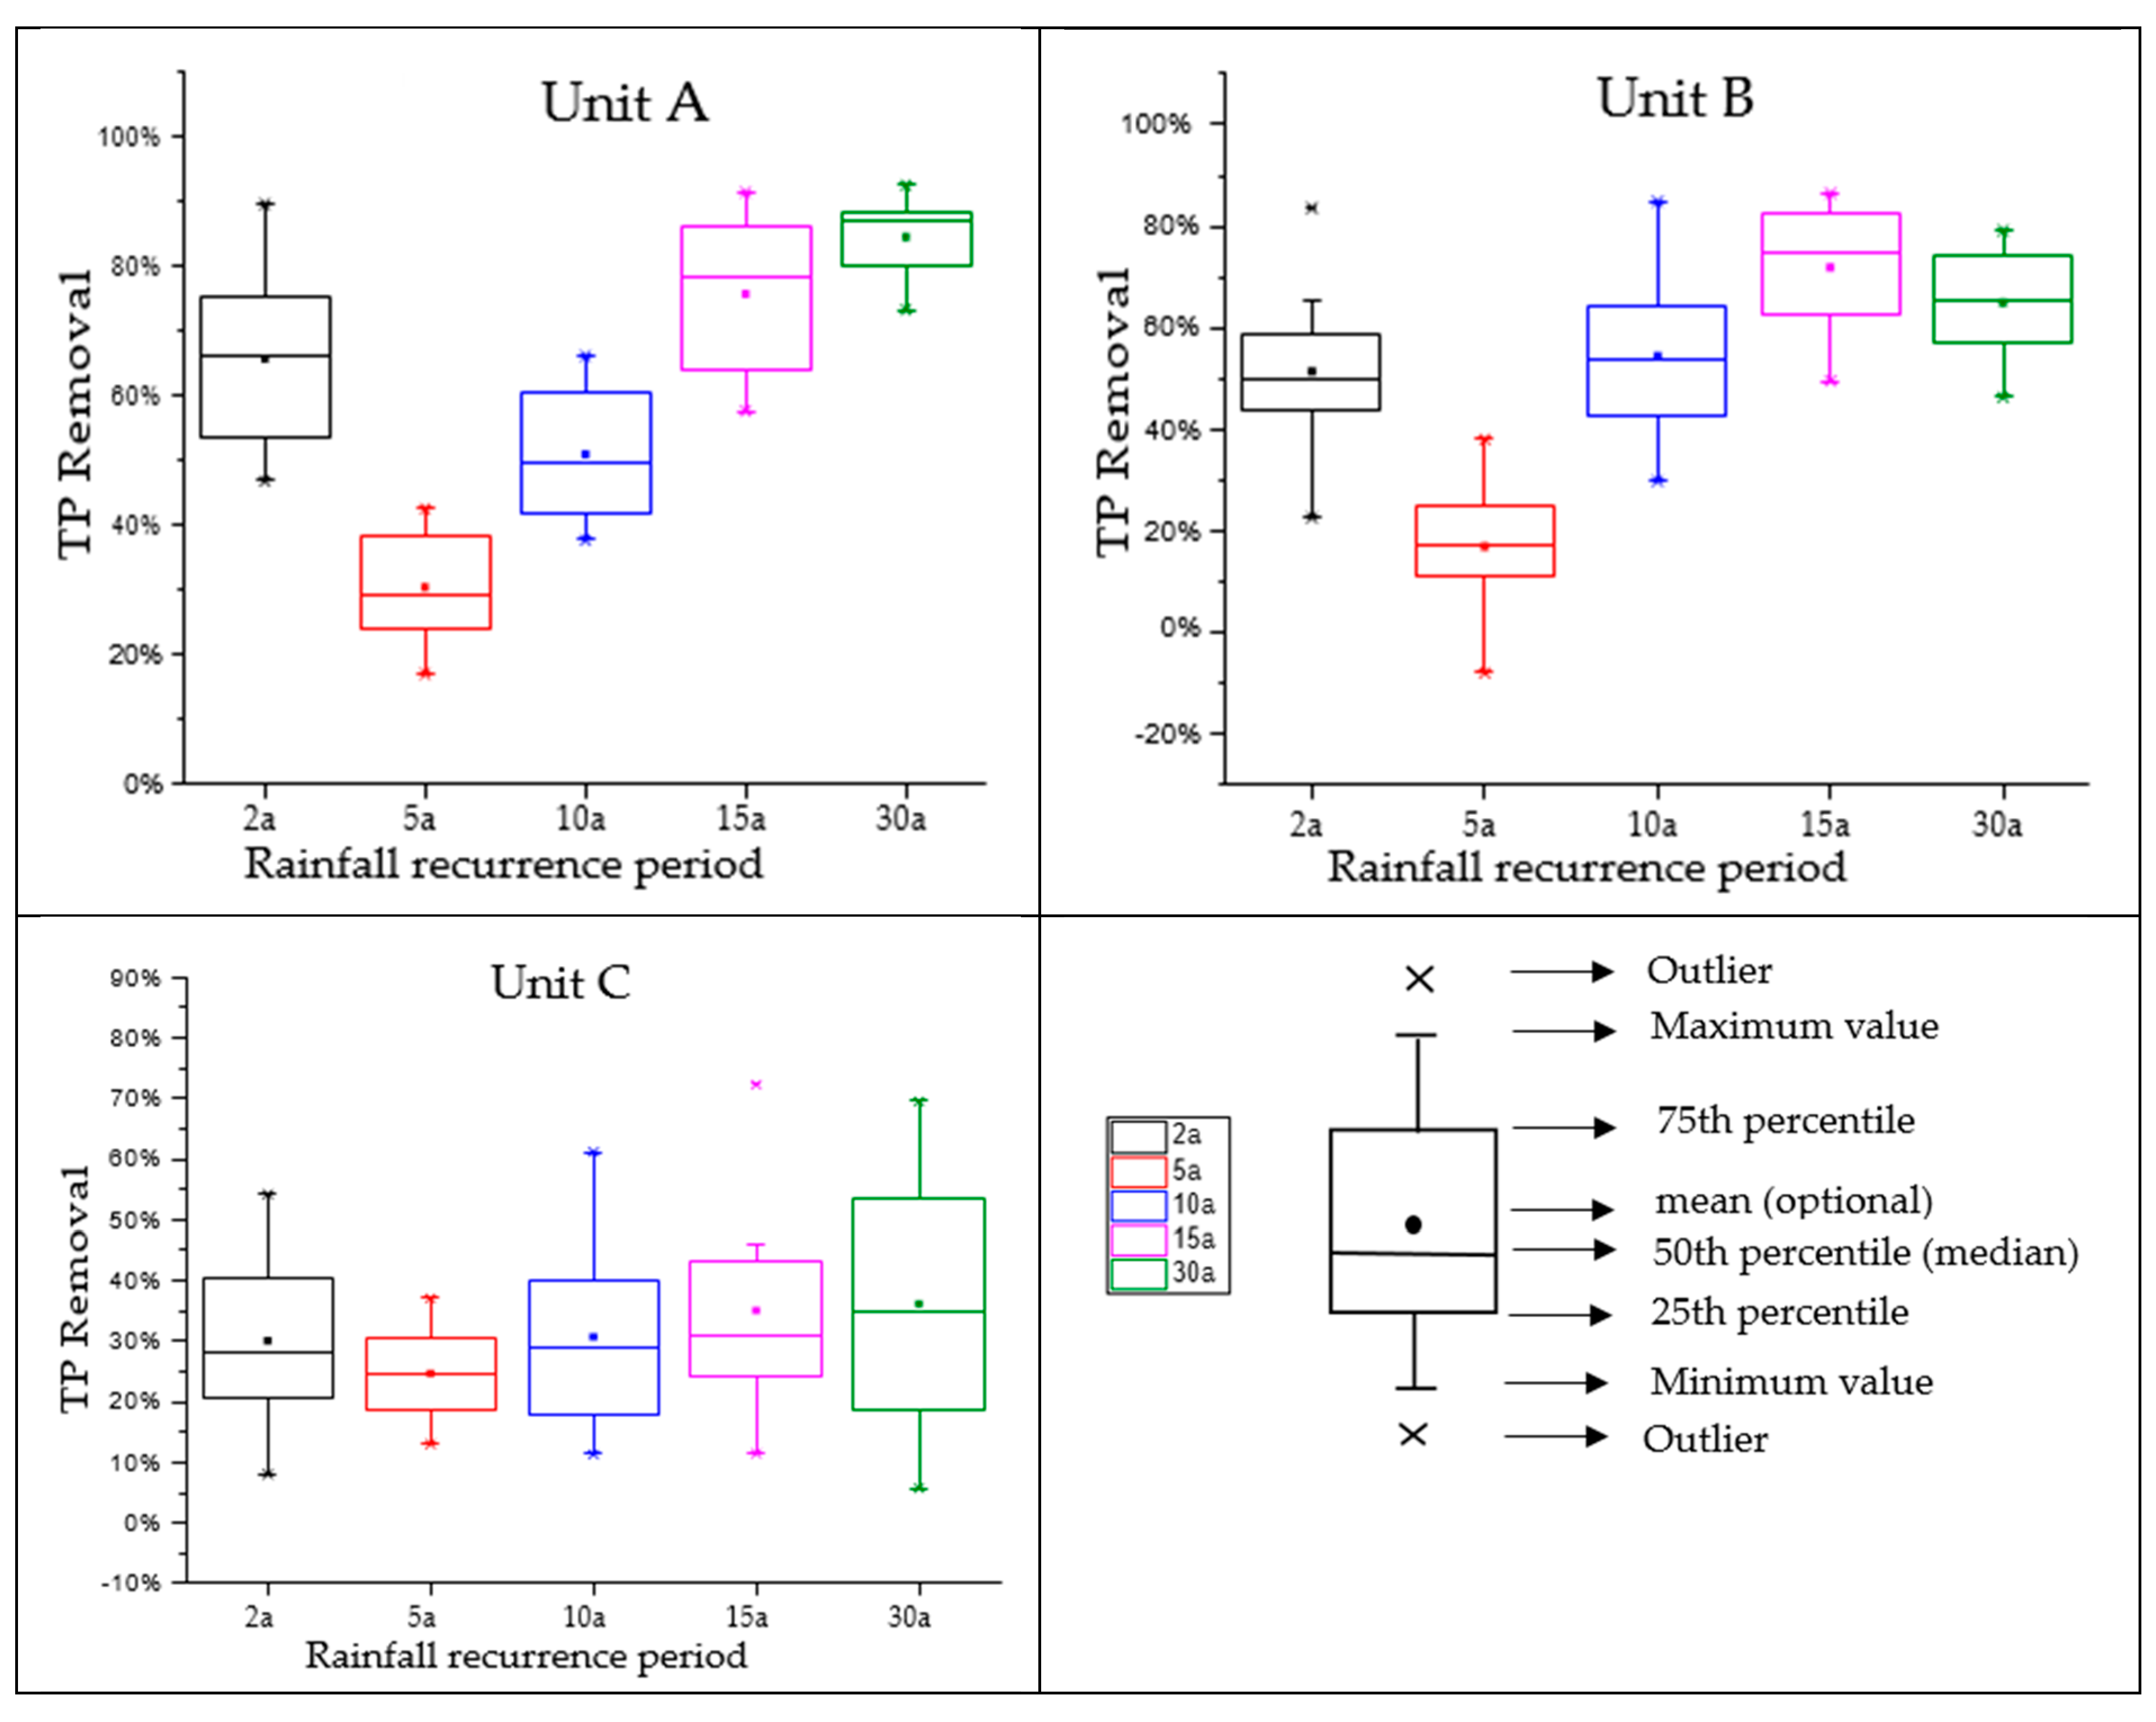
Figure 7.
Removal efficiency of nitrogen species in bioretention units (A–C); (a) NH4+-N; (b) NH3—N; and (c) TN.
Figure 7.
Removal efficiency of nitrogen species in bioretention units (A–C); (a) NH4+-N; (b) NH3—N; and (c) TN.


Table 1.
Chicago design storm parameters [4].
Table 1.
Chicago design storm parameters [4].
| Integrated rainfall peak position coefficient (r) | 0.4 |
| Total rainfall duration (T) min | 120 |
| Rain force parameter (A) mm | 36.61 |
| Rain force variation parameter (C) | 0.77 |
| Rainfall duration correction parameter (b) min | 23.15 |
| Rain attenuation index (n) | 0.93 |
Table 2.
Mean inflow concentrations of pollutants in the synthetic runoff.
| Pollutant | Mean Inflow Concentration (mg/L) | Source |
|---|---|---|
| COD | 120 | Glucose (C6H12O6) |
| TP | 1.0 | Monopotassium phosphate |
| TN | 8.0 | Alanine |
| NH4+-N | 4.0 | Ammonium chloride |
| NO3−-N | 2.0 | Potassium nitrate |
Table 3.
Mean removal efficiency of pollutants for each bioretention system.
| Unit | Recurrence Interval (Years) | Mean Removal Efficiency (%) | |||||
|---|---|---|---|---|---|---|---|
| SS | CODMn | TP | NH4+-N | NO3−-N | TN | ||
| A | 2 | 52.4 | 51.4 | 65.8 | 82.9 | 32.1 | 68.1 |
| 5 | 73.5 | 60.3 | 30.4 | 77.6 | 38.2 | 59.3 | |
| 10 | 66.7 | 78.7 | 51.0 | 68.3 | 50.5 | 62.4 | |
| 15 | 66.7 | 69.2 | 75.8 | 66.6 | 42.9 | 57.1 | |
| 30 | 55.2 | 47.5 | 84.5 | 51.7 | 23.5 | 48.3 | |
| B | 2 | 71.3 | 12.7 | 51.4 | 74.4 | 47.9 | 63.6 |
| 5 | 68.5 | 38.5 | 17.0 | 68.1 | 49.5 | 57.1 | |
| 10 | 62.2 | 63.4 | 54.4 | 70.1 | 67.3 | 71.4 | |
| 15 | 57.1 | 83.4 | 71.9 | 61.7 | 58.3 | 68.3 | |
| 30 | 62.1 | 79.9 | 65.0 | 68.4 | 42.3 | 56.2 | |
| C | 2 | 49.9 | 30.4 | 30.1 | 55.4 | 23.1 | 41.1 |
| 5 | 68.2 | 54.2 | 24.7 | 48.6 | 27.8 | 37.4 | |
| 10 | 57.7 | 67.8 | 30.7 | 50.8 | 37.4 | 43.9 | |
| 15 | 48.2 | 58.7 | 35.1 | 39.3 | 28.6 | 32.6 | |
| 30 | 41.7 | 50.4 | 31.2 | 28.0 | 25.2 | 25.1 | |
© 2019 by the authors. Licensee MDPI, Basel, Switzerland. This article is an open access article distributed under the terms and conditions of the Creative Commons Attribution (CC BY) license (http://creativecommons.org/licenses/by/4.0/).
Share and Cite
MDPI and ACS Style
Singh, R.P.; Zhao, F.; Ji, Q.; Saravanan, J.; Fu, D. Design and Performance Characterization of Roadside Bioretention Systems. Sustainability 2019, 11, 2040. https://doi.org/10.3390/su11072040
AMA Style
Singh RP, Zhao F, Ji Q, Saravanan J, Fu D. Design and Performance Characterization of Roadside Bioretention Systems. Sustainability. 2019; 11(7):2040. https://doi.org/10.3390/su11072040
Chicago/Turabian StyleSingh, Rajendra Prasad, Fei Zhao, Qian Ji, Jothivel Saravanan, and Dafang Fu. 2019. "Design and Performance Characterization of Roadside Bioretention Systems" Sustainability 11, no. 7: 2040. https://doi.org/10.3390/su11072040
Note that from the first issue of 2016, this journal uses article numbers instead of page numbers. See further details here.