Article

Spatial Patterns and Driving Forces of Conflicts among the Three Land Management Red Lines in China: A Case Study of the Wuhan Urban Development Area

1
School of Resource and Environmental Sciences, Wuhan University, Wuhan 430079, China
2
College of Resources and Environmental Sciences, Henan Agricultural University, Zhengzhou 450002, China
3
Key Laboratory of Geographic Information System, Ministry of Education, Wuhan University, Wuhan 430079, China
4
Collaborative Innovation Center for Geospatial Information Technology, Wuhan 430079, China
*
Authors to whom correspondence should be addressed.
Sustainability 2019, 11(7), 2025; https://doi.org/10.3390/su11072025
Submission received: 12 March 2019 / Revised: 29 March 2019 / Accepted: 31 March 2019 / Published: 5 April 2019
(This article belongs to the Special Issue Urban Sprawl and Sustainability)

Abstract

:
The delimitation of three land management red lines (LMRLs), which refers to urban growth boundaries (UGBs), ecological protection redlines (EPRs), and basic farmland protection zones (BFPZs), has been regarded as a control method for promoting sustainable urban development in China. However, in many Chinese cities, conflicts extensively exist among the three LMRLs in terms of spatial partitioning. This study clarifies the connotation of conflicts among the three LMRLs. Moreover, a red line conflict index (RLCI) is established to characterize the intensity of conflicts among the three LMRLs. The Wuhan Urban Development Area (WUDA) is used for a case study, in which the spatial patterns of the three types of conflicts among the three LMRLs (i.e., conflicts between EPRs and BFPZs, EPRs and UGBs, and UGBs and BFPZs) are analyzed through numerous spatial statistical analysis methods (including spatial autocorrelation, urban-rural gradient, and landscape pattern analyses). In addition, the driving forces of these conflicts are identified from the perspectives of natural physics, socioeconomic development, neighborhood, policy and planning using three binary logistic regression models. Results show that the conflicts between EPRs and BFPZs, EPRs and UGBs, and UGBs and BFPZs are mainly distributed on the edge of the WUDA, inside Wuhan’s third circulation line, and at the urban–rural transition zone, respectively. The patch of conflict between BFPZs and UGBs has the lowest aggregation degree, the highest fragmentation degree, and the most complex shape. Logistic regression results show that the combination and relative importance of driving factors vary in the three types of conflicts among the three LMRLs. In the conflict between EPRs and BFPZs, the distance to city centers is the most important influencing factor, followed by the proportion of ecological land and elevation. In the conflict between UGBs and EPRs, the proportion of construction land, the distance to city centers, and whether the land unit is within the scope of a restricted development zone are the three most important factors. The proportion of construction land, the distances to the Yangtze and Han Rivers, and the proportion of cultivated land significantly influence the conflict between UGBs and BFPZs. This study aids in our understanding of the causes and mechanisms of conflicts among the three LMRLs, and provides important information for the “integration of multi-planning” and land management in Wuhan and similar cities.

1. Introduction

Urbanization is a profound change in human society in the 21st century. Over half of the world’s population currently lives in towns and cities, and the projected urban population will swell to 5 billion by 2030 [1]. Population growth and industrial agglomeration associated with urbanization leads to the rapid growth of urban lands [2,3,4]. Meanwhile, large-scale cultivated land and natural areas are occupied, which will cause damage to food supplies and ecological security [5,6,7]. Hence, coordinating relations among construction land, cultivated land, and ecological land is pivotal for sustainable urban development [8,9]. Protecting sufficient amounts of cultivated land and natural areas has become essential, and a matter of worldwide concern with regard to urban land policies in recent years [10,11].
The delimitation of land management red lines (LMRLs) is generally regarded as a basic control method for coordinating regional land use while promoting a sustainable urban development [12]. A common LMRL is urban growth boundaries (UGBs), which are set to define the spatial scopes of cities to stimulate intensive urban development [13]. UGBs have been widely used in many countries and regions, such as London’s Metropolitan Green Belt, Holland’s Green Heart, and Melbourne’s UGBs [14,15,16]. In addition to UGBs, several LMRLs have been developed to restrain the conversion of farmland and ecological lands, such as exclusive agriculture zones in Oregon, ecological protection redlines (EPRs), and basic farmland protection zones (BFPZs) in China [9,17,18].
China has been undergoing rapid urbanization and unprecedented economic growth since its reform and opening-up policy in 1978. Simultaneously, the accelerated expansion of urban built-up land has been observed in many cities of China [19,20]. An explosion in urban expansion has resulted in an extensive loss of agricultural land and natural habitat [2,21,22], thereby posing challenges to China’s food security and eco-environmental protection [23]. Therefore, the three LMRLs (i.e., UGBs, EPRs, and BFPZs) were established to designate the three basic spaces (production, life, and ecological spaces), and then to ensure economic and social development, and ecological and food security. Among them, UGBs are used to guide smart urban growth, thus constraining urban construction lands to a fixed area, and promoting compact developments within a city [8]. EPRs, which contain areas with vulnerable ecosystems or important ecological functions, are the baselines and barriers of urban ecological security, thereby maintaining urban ecosystem services [9,24]. BFPZs are delimited for protecting basic farmland from the threats of construction, thus ensuring food security [25,26]. However, in many Chinese cities, the three LMRLs are delimited by different government sectors under their respective professional expertise, to ensure professional depth. This non-uniform delimitation can cause severe dislocations in spatial partitioning, and produce conflicts among the three LMRLs [27]. Thus, the Chinese government has pointed out that local governments must implement the “integration of multi-planning”, and reinforce national land utilization control.
Currently, many relevant studies are conducted to introduce techniques for delimiting UGBs [28,29,30,31], EPRs [32,33,34], and BFPZs [18,35]. These new techniques rely on a range of evaluation models and the geographic information system, and they enrich the tactical methods of the three LMRLs’ demarcations. Cause analyses for the conflicts among the three LMRLs has received significant attention in recent years, especially the cause analysis that was based on the perspective of policy and institution [36,37,38,39]. The delimitation through different goals and principles, and the insufficient overall consideration of every possible perspective are considered the main reasons for the conflicts among the three LMRLs [40]. However, the existing research has several shortcomings. First, the existing literature focuses on the single red line, and it neglects to study the three LMRLs as a red line system. Second, the spatial patterns of conflicts among the three LMRLs are crucial for planning adjustment, but these are ignored. Finally, few studies have investigated the driving forces of conflicts among the three LMRLs using multivariate modeling.
Wuhan City, a typical city in China, has been undergoing unprecedented changes in land use pattern over the past few years. Simultaneously, much ecological and cultivated land has been converted to construction land. Wuhan Metropolitan Area was approved by the National Development and Reform Commission as the national pilot zone for constructing a “resource-saving and environment-friendly” society, thereby exploring spatial solutions for regional sustainable development. In this context, the spatial patterns and the driving mechanisms of conflicts among the three LMRLs in Wuhan City are worthy of investigation. Specifically, this study aims (1) to define the notion and the measurement indicators of conflicts among the three LMRLs, (2) to investigate the spatial characteristics of conflicts among the three LMRLs of Wuhan city, and (3) to quantify the human–natural driving forces that are related to the conflicts among the three LMRLs from different perspectives.

2. Data and Methodology
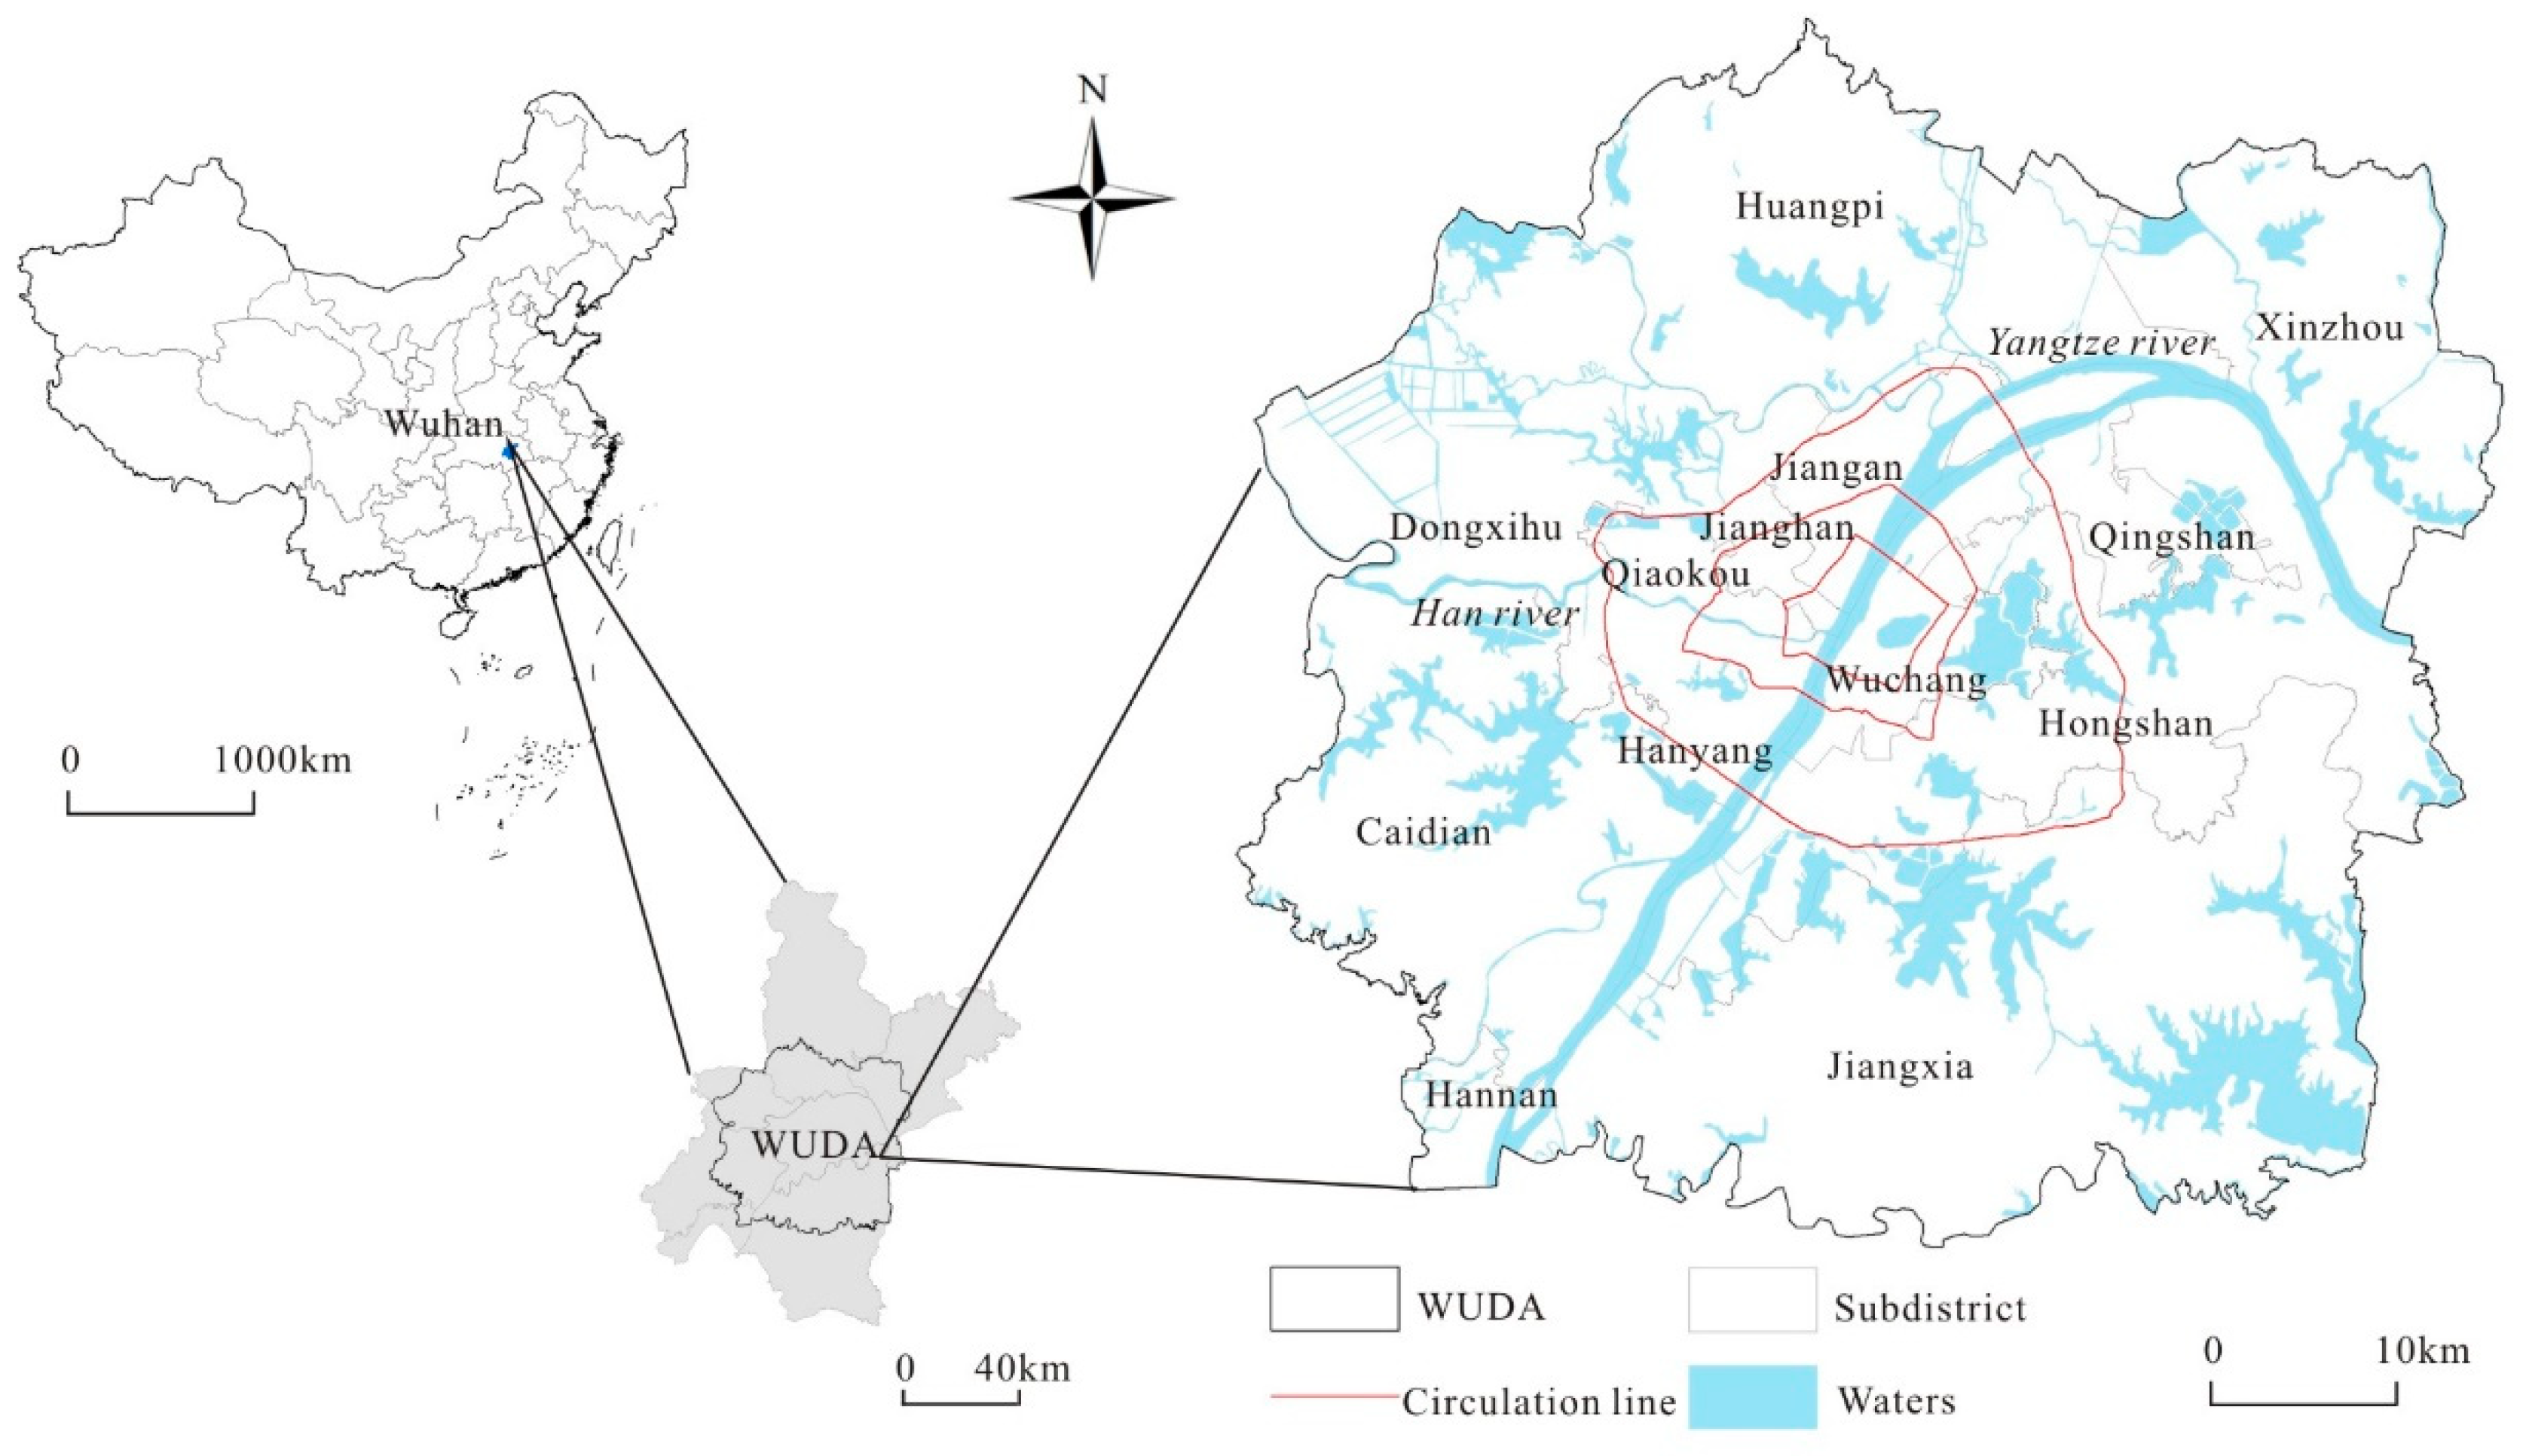
2.1. Study Area

Wuhan is the provincial capital of Hubei, China. It lies between the latitudes 29°58′ N–31°22′ N and longitudes 113°41′ E–115°05′ E, covering 8494.41 km2. The Wuhan metropolis administers 13 districts, including seven central districts and six suburban counties. Wuhan features mostly plains and low hills, with elevations between 20 and 50 m. Most specifically, it is in the juncture of the Yangtze and Han Rivers, and it has 166 lakes, with abundant special natural resources.
As the focal city in central China, Wuhan is an important political, economic, cultural, and education center. This area has undergone a rapid population growth, given the rapid rate of urbanization in the past decades. By 2016, the urbanization rate of Wuhan reached 79.77%. Furthermore, Wuhan has experienced huge changes in land use status (i.e., the rapid conversion of cultivated lands, forest land, and water areas into urban areas). According to the China City Statistical Yearbook, the percentage of the built-up area increased to 29.11% in 2016. Considering the violent contradiction among various types of land, the conflicts among the three LMRLs in Wuhan are worth studying.
We select the Wuhan Urban Development Area (WUDA) as the study area. It covers an area of approximately 3261 km2 (Figure 1). The area was designated as the concentration area of urban development and planning control in the 2010–2020 Wuhan masterplan. The WUDA consists of all central districts and several suburban areas, and accommodates more than five million people.

2.2. Data Sources and Processing

The data used in this study concern spatial planning, basic geographic information, land use, transportation, natural eco-environment, and socioeconomic information. These data are as follows: (1) Spatial distribution data of the three LMRLs. UGBs are acquired by merging permitted zones for constructive expansion and conditionally permitted zones of constructive expansion in the overall planning for Wuhan land use (2006–2020); EPRs are obtained by extracting the ecological protection bottom line from the ecological baseline delineation planning of the WUDA in a 1:2000 scale. BFPZs originate from the Wuhan Planning and Design Institute, which demarcates the BFPZs of Wuhan city. (2) Land use data from 2010 in the WUDA, obtained from the Wuhan Land Resource and Planning Bureau. (3) Basic geographic information data, including waterway, administrative zoning, and road network status maps. (4) A digital evaluation model (DEM) with a 30 m resolution, downloaded from the geospatial data cloud platform (http://www.gscloud.cn/). (5) The population and gross domestic product (GDP) density raster dataset (with a 1 km × 1 km resolution) obtained from the Data Center for Resources and Environmental Sciences, Chinese Academy of Sciences (http://www.resdc.cn/). (6) Other data, including the spatial distribution data of four types of function zones of Wuhan City and 2015 Garden Show Park, are derived from the map of major function-oriented zonings of Wuhan City, and the planning map of the 2015 Garden Show Park. To facilitate data processing, all the data are uniformly transformed to WGS84 coordinates.

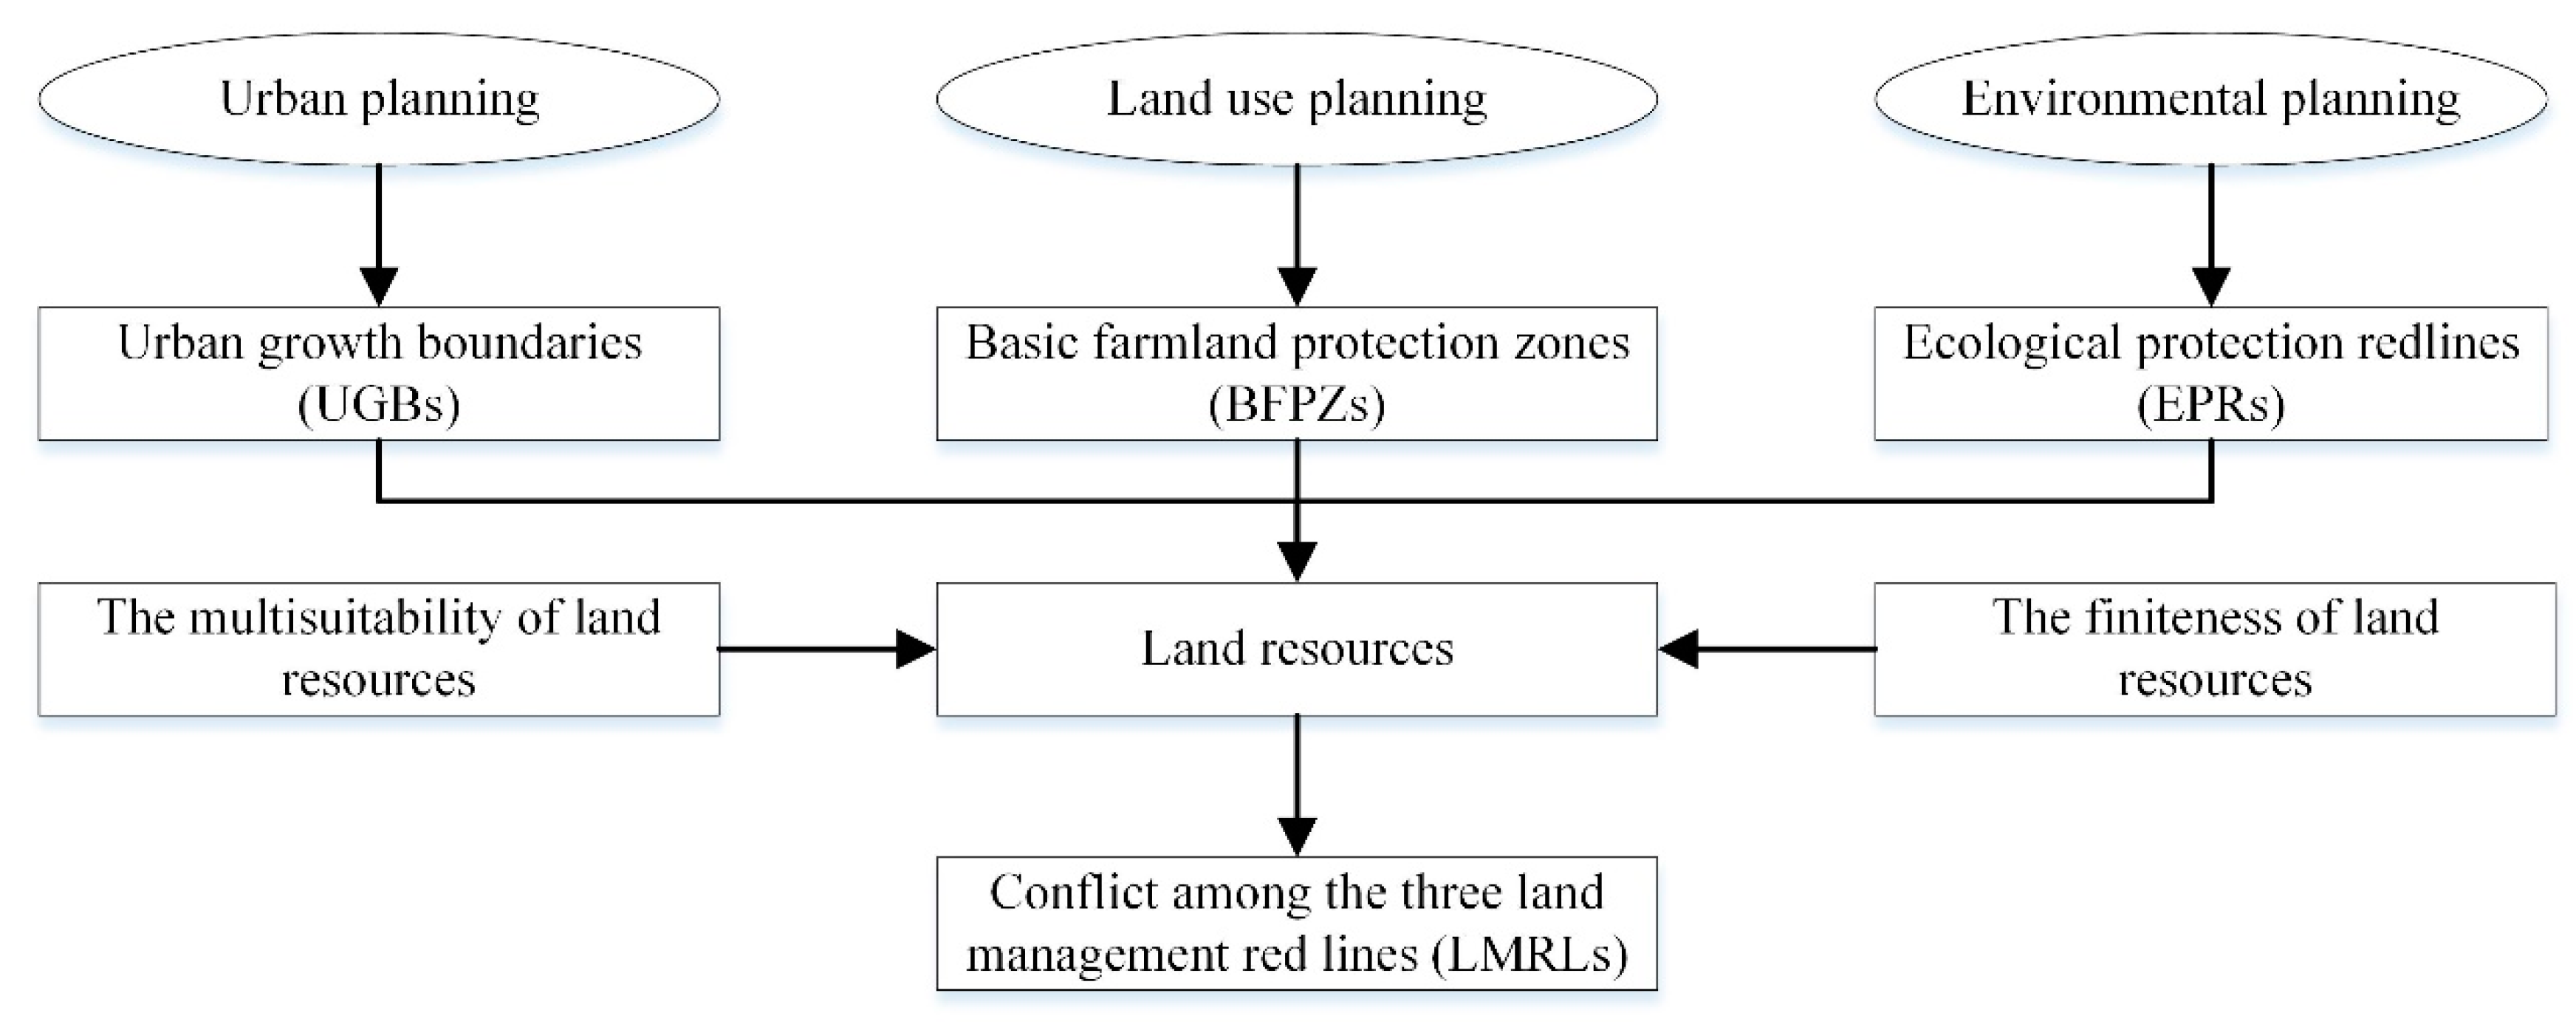
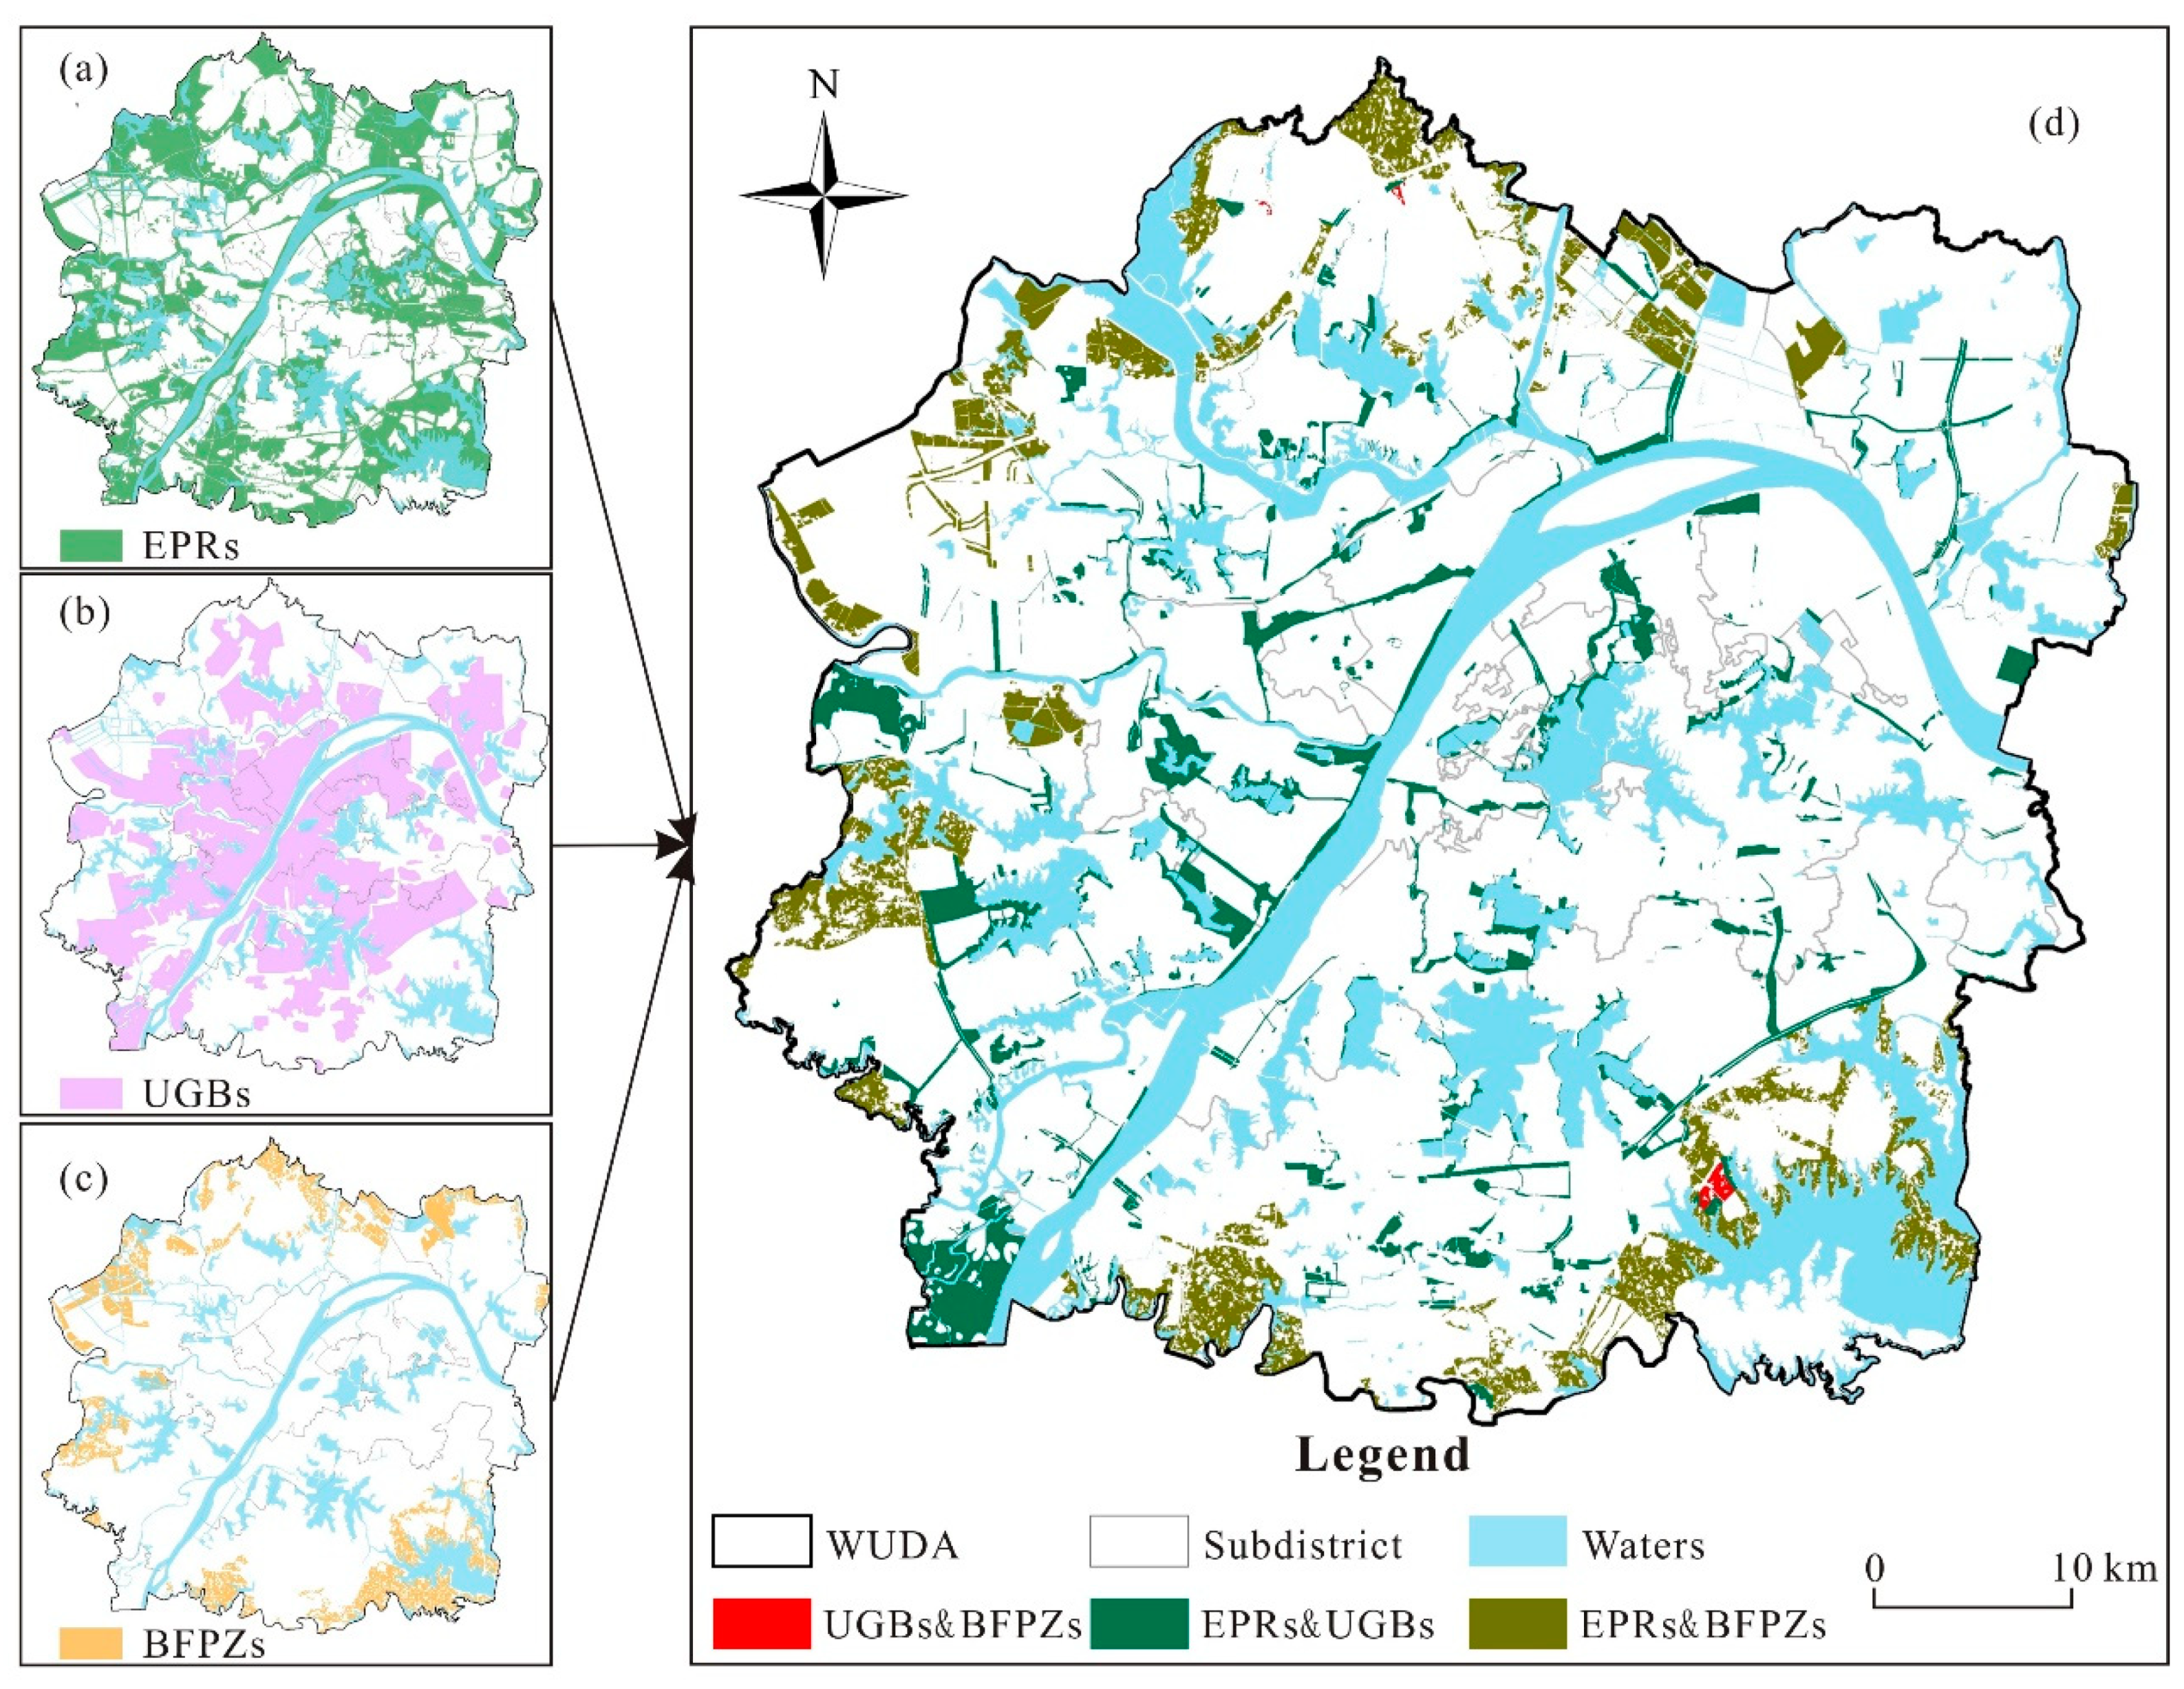
2.3. Defining Conflicts among the Three LMRLs and the Measurement Indicator

“Conflict” which refers to “inconformity” is introduced here to study the relationships of the three LMRLs. The term “conflict” describes the situation where two or more social units are incompatible or mutually exclusive in their goals, thereby producing psychological or behavioral contradictions. With the worsening global energy and environmental problems, “conflict” is introduced into resource and environmental management [41]. Confronted with the striking shortage of land resources since the 21st century, “land conflict” or “land use conflict” is a huge concern in China.
Broadly defined, conflicts among the three LMRLs can be identified as the non-conformities of the planning layouts of ecological, cultivated, and construction lands. These non-conformities involve many aspects, including amounts, use patterns, and distribution. On the basis of the achievements of conflict theory and land use conflict theory [42,43], we define the conflicts among the three LMRLs in a narrow scope, that is, a spatial overlap of incompatible LMRLs. The fundamental cause of conflicts among three LMRLs are the multi-suitability and finiteness of land resources. In China, the separate departments within the present planning system, and the lack of platforms and mechanisms for planning coordination will inevitably produce conflicts among the three LMRLs (Figure 2). Figure 3 show the spatial distributions of the three LMRLs, and conflicts among the three LMRLs.
UGBs, EPRs, and BFPZs are the three main subjects involved in conflict. Thus, three types of conflicts exist between every two LMRLs; that is, conflicts between EPRs and BFPZs, between EPRs and UGBs, and between UGBs and BFPZs. To characterize the intensity of conflicts among the three LMRLs in a region, we establish a “red line conflict index (RLCI),” which is defined as follows:
RLCI = S/Stotal
where S is the area of a patch of each type of conflicts among the three LMRLs. Stotal is the total area of the region.

2.4. Quantifying Spatial Patterns of Conflicts among the Three LMRLs

2.4.1. Spatial Autocorrelation Analysis

In the present study, we use two indicators (Global Moran’s I and Local Getis–Ord Gi*) to describe the degree of spatial dependence of conflicts among the three LMRLs. Global Moran’s I is used to evaluate whether spatial agglomeration exists globally [44,45]. The range of Global Moran’s I values is −1 to +1, and a positive value represents a positive spatial autocorrelation [46]. In addition, the local Getis-Ord Gi* is used to identify hotspots of conflicts among the three LMRLs [47]. The obtained Z-score and p-value show the spatially clustered zones of high or low values. When the p-value is significant and the Z-score is positive, a larger z-score indicates an intense hotspot. However, when the Z-score is negative, a small z-score denotes an intense cold spot. The two indicators of conflicts among the three LMRLs in the WUDA are calculated at an urban agglomeration scale (1 km resolution) through the Spatial Statistics Module in ArcGIS 10.2.

2.4.2. Urban–Rural Gradient Analysis

The urban-rural gradient analysis approach has been a prevalent approach to urbanization-related research, because it effectively depicts the decreasing urbanization level from the urban center to the suburbs [48]. The assessment of the conflicts among the three LMRLs from the perspective of the urban–rural gradient analysis approach can reveal changes in patches of conflicts among the three LMRLs along a gradient of increasing urbanization. Given that the built-up district is similar to the third circulation line of Wuhan city in terms of morphology, we select the third circulation line as the buffer object. In addition, two kilometers is an appropriate buffer distance for the magnitude of the WUDA to uncover the distribution regularities of the three types of conflicts among the three LMRLs along the urban-rural gradient. We build 15 gradient zones (R1–R15) from the city center to the suburbs through the buffer area analysis tool of ArcGIS 10.2. For each buffer ring, the RLCI of each type of conflicts among the three LMRLs is calculated.

2.4.3. Landscape Pattern Analysis

Four landscape pattern indices, namely, patch density (PD), mean patch size (MPS), aggregation index (AI), and perimeter-area fractal dimension (PAFRAC) are selected to characterize the spatial layout of these conflict patches. These metrics are all at a landscape level, and the level of correlation among them is rather low. PD, the number of patches per 100 ha, is used to evaluate the degree of landscape fragmentation. MPS is the average area of patches per 100 ha and reflects the size of patches. AI is used to refer to the level of aggregation between patches. PAFRAC is used to reflect the complexity of perimeters, which describe the shape of the patches. These indices have been widely applied to represent ecological meanings [49,50]. In the analysis, three types of conflicts among the three LMRLs maps are divided into 1 km × 1 km grids, and the four indices, namely, AI, PAFRAC, MPS, and PD, are calculated using FRAGSTATS version 4.2 [51].

2.5. Identifying the Driving Factors of Conflicts among the Three LMRLs

2.5.1. Potential Driving Factors

In China, UGBs, EPRs, and BFPZs are delineated on the basis of different principles, thereby leading to conflicts among the three LMRLs. To designate the UGBs, the major concerns are economic and social developments, traffic conditions, and geological and topographical conditions [22,29]. The demarcation of EPRs is typically based on ecological sensitivity and the importance of the ecological service function. These delineations can be assessed by several factors, including neighborhood factors and topographical conditions [9]. For designating BFPZs, including land location, the soil quality, agricultural infrastructure, and topographical conditions are must be considered [18,25,35]. These factors, which contribute to designating UGBs, EPRs, and BFPZs, may cause conflicts among the three LMRLs. Therefore, the driving factors of conflicts among the three LMRLs can be summarized into four aspects as follows: natural physical, socioeconomic, neighborhood, and policy and planning factors. Considering the actual instance of the WUDA and data availability, 15 factors are selected for analysis.
Natural physical factors: Natural physical factors (e.g., topography, climate, and natural resources) are the primary determinant of conflicts among the three LMRLs. For example, topography is an important factor that affects the location of UGBs and BFPZs, because urban development and agricultural production are generally avoided in areas with ragged topography. In addition, the urban patterns of the study area are along the Yangtze and Han Rivers; thus, the distances to the Yangtze and Han Rivers are also important factors for the spatial distribution of the three LMRLs. Therefore, three indicators (i.e., slope, elevation, and the distances to the Yangtze and Han Rivers) are selected. Elevation and slope are derived from the DEM. The distances to the Yangtze and Han Rivers are calculated by distance analysis in ArcGIS 10.2.
Socioeconomic factors: Urban expansion depends largely on socioeconomic development at various scales [52,53]. Socioeconomic variables (e.g., population and GDP densities) must be considered when determining the scale of the feasibility of UGBs, EPRs, and BFPZs. In the present study, we select population and GDP densities to represent socioeconomic factors.
Neighborhood factors: Neighborhood factors (including the distances to railways, major roads, city centers, and the proportions of cultivated, construction, and ecological lands) also significantly affect conflicts among the three LMRLs. Among these factors, road network and city center accessibility profoundly affect the demarcations of UGBs. Moreover, the proportions of cultivated, construction, and ecological lands also play important roles in demarcating UGBs, EPRs, and BFPZs, because the land units surrounded by certain types of land are likely to be demarcated into relevant types of LMRLs. The distances to major roads, railways, and city centers are calculated in the same way as the distances to the Yangtze and Han Rivers. The proportions of cultivated, construction, and ecological lands within a 1 km × 1 km grid are calculated through Creating Fishnet and Spatial Analyst in ArcGIS 10.2.
Policy and planning factors: Several policies and planning, such as land control policies and urban master planning, and certain historical events, can significantly affect the demarcations of UGBs, EPRs, and BFPZs. Wuhan has set up the major function zoning since 2014, in which the restricted, key, and optimizing development zones are divided. Therefore, whether the land unit is within the scope of the three types of function zones is selected as potential factors. Moreover, as a mega-event in China, the 10th China International Garden Exposition, held in Wuhan in 2015, may have affected the land use and layout. Therefore, whether the land unit is within the scope of the Wuhan garden expo is also selected as a factor.

2.5.2. Binary Logistic Regression

Three binary logistic regression models are built to estimate the probabilities of the three types of conflicts between each pair of LMRLs. Binary logistic regression is widely adopted in land use studies, because it is a nonlinear statistical model that can be applied to analyze binary dependent variables [54,55,56,57]. The binary logistic regression model is expressed as follows:
( Y = 1 | x 1 ,   x 2 , ,   x m )     e x p ( w 0 + w i x i ) / ( 1 + e x p ( w 0 + w i x i ) )
P ( Y = 0 | x 1 ,   x 2 , ,   x m )     1 / ( 1 + e x p ( w 0 + w i x i ) )
where P is the probability of event Y (Y { 0 ,   1 } ), w i is the regression coefficients of the driving factors, and w 0 is a constant.
In the present study, conflicts among the three LMRLs are binary dependent variables (i.e., when conflicts among the three LMRLs exist, Y = 1; otherwise, Y = 0). The 15 factors introduced in Section 2.5.1 are the independent variables (Table 1). We divide the study area into 2149 km × 1 km grids and use the center of every grid as the sampling site. Furthermore, a correlation analysis is conducted between the dependent and explanatory variables. The results indicate that the explanatory variables have a significant linear correlation with the dependent variables, except for Opt_development_zone, which is excluded in the subsequent regression analysis. Ultimately, 14 independent variables are used for the proposed logistic models, and three binary logistic models are computed by the logistic procedure in SPSS 19.0 to predict the probability of conflicts among the three LMRLs.
We use the percentage of correct predictions and the percentage of correctly predicted area under the curve to evaluate the performances of the three binary logistic regression models [58,59]. If the values of percent correct predictions and area under the curve are approximately 1, then the performance of the model is favorable. Nagelkerke’s R2, which represents the proportion of explained variation, is calculated to evaluate the validation of the model [60]. In addition, we use Wald X2 statistics to evaluate the contribution of each variable. A high Wald X2 value indicates a high relative weight of the variable.

3. Results

3.1. Spatial Patterns of Conflicts among the Three LMRLs

The preliminary results show that conflicts between EPRs and BFPZs, and between EPRs and UGBs are the main types of conflicts among the three LMRLs (corresponding to 6.57% and 5.77% of the regional areas), and the conflicts between UGBs and BFPZs are relatively few (representing 0.16% of the regional areas).

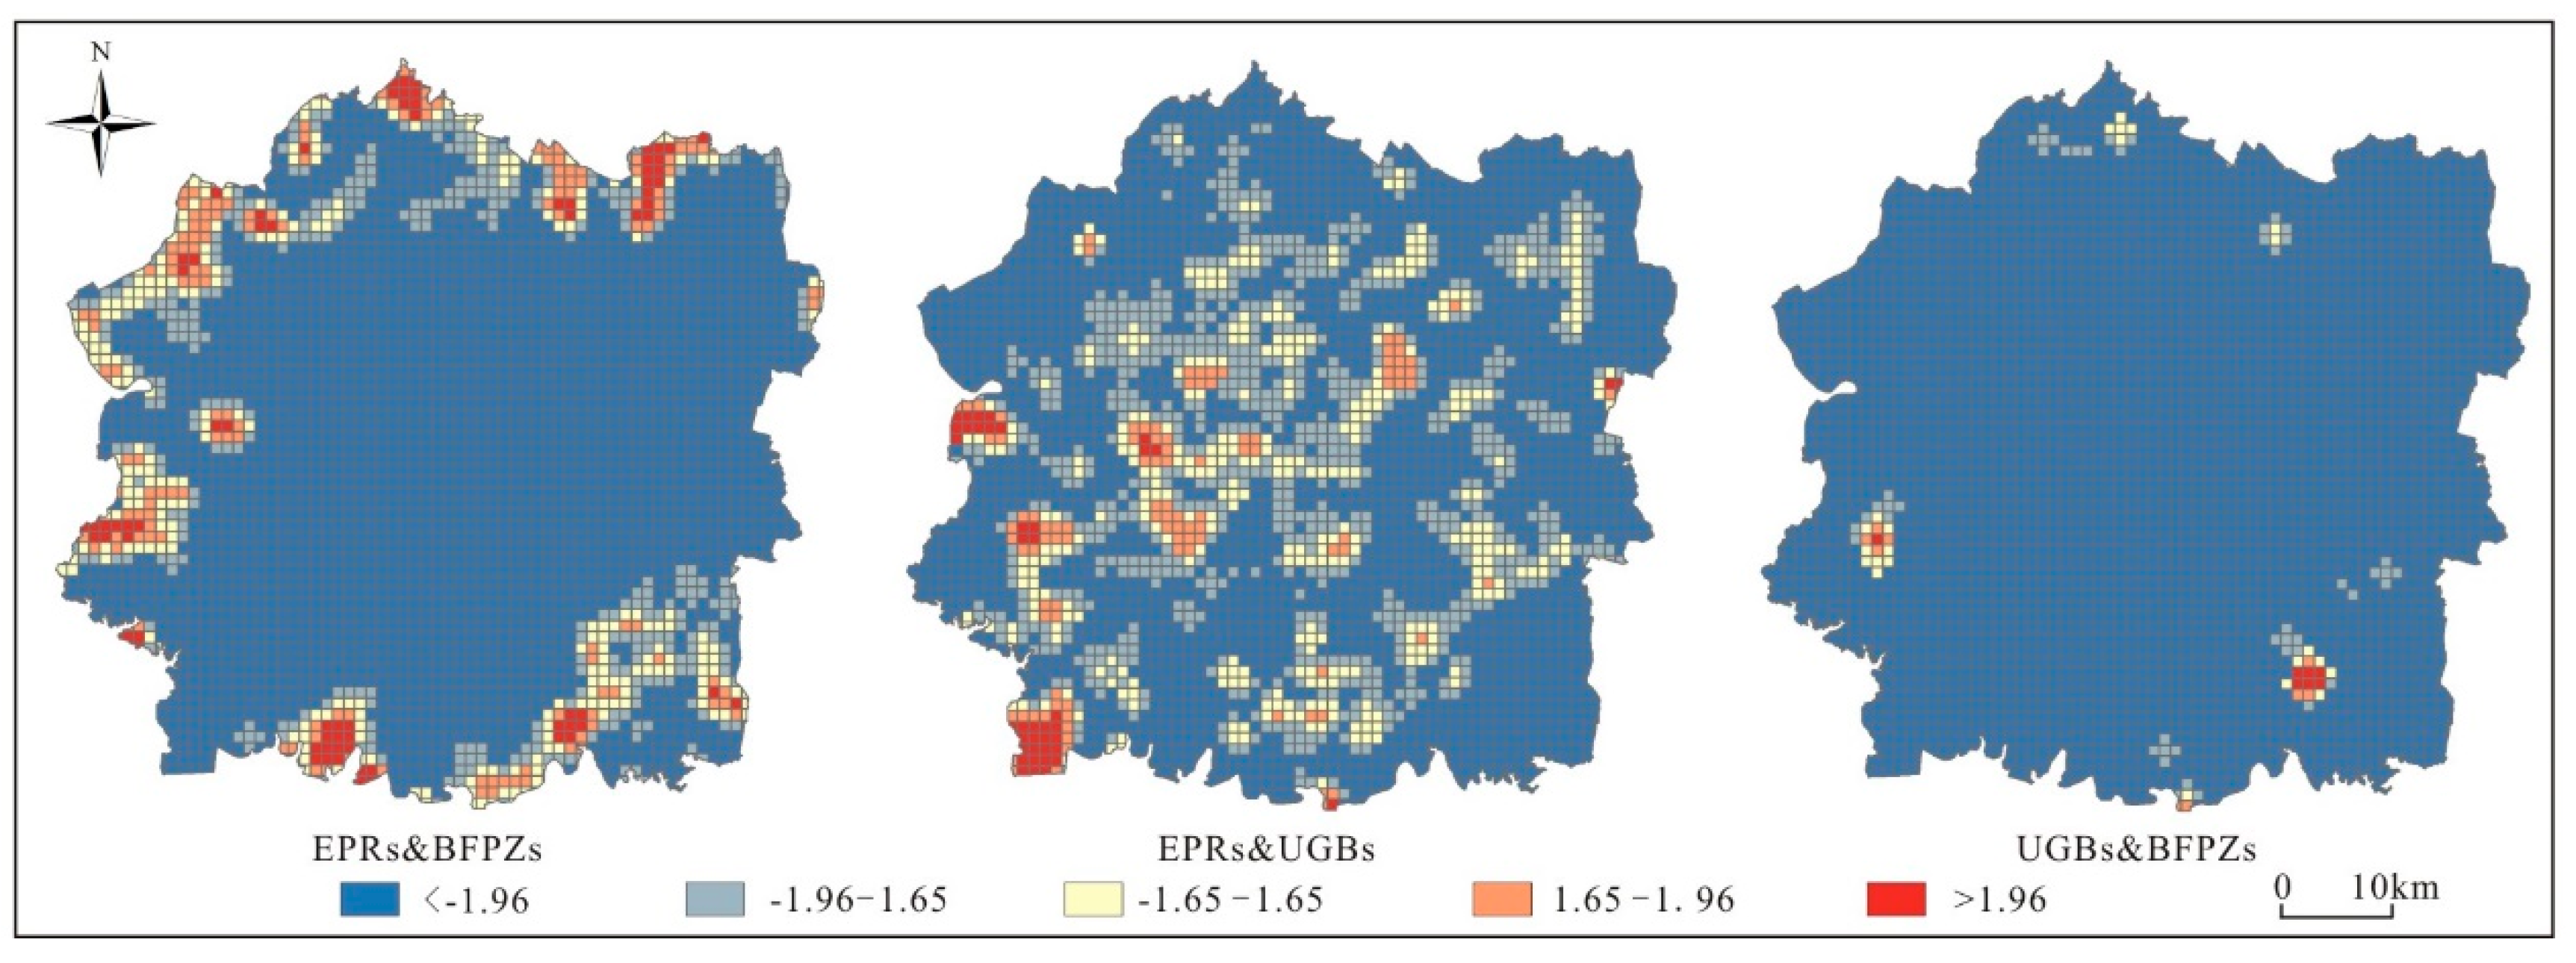
3.1.1. Spatial Dependence of Conflicts among the Three LMRLs

The Moran’s I on a 1 km × 1 km grid level for the RLCIs of the conflict between EPRs and BFPZs, between EPRs and UGBs, and between UGBs and BFPZs are 0.6842, 0.5924, and 0.4705, respectively. Therefore, a moderately positive spatial autocorrelation is observed among the three types of conflicts between every two LMRLs. This results quantitatively imply that the conflicts among the three LMRLs are located in a geographically close region. Among these conflicts, those between EPRs and BFPZs have the highest positive spatial autocorrelations, followed by the conflicts between EPRs and UGBs, and lastly, the conflicts between UGBs and BFPZs.
Figure 4 illustrates the results of hotspot analysis. It reveals a detailed pattern of the spatial inequity of conflicts among the three LMRLs. In this study, Z-scores greater than 1.96 are highlighted as hotspots. The hotspots of conflict between EPRs and BFPZs are mainly concentrated on the edge of the WUDA. In addition, the hotspots of conflict between EPRs and UGBs blend harmoniously into the core areas of the WUDA, whereas the hotspots of conflict between UGBs and BFPZs are scattered in the urban–rural transition zone.

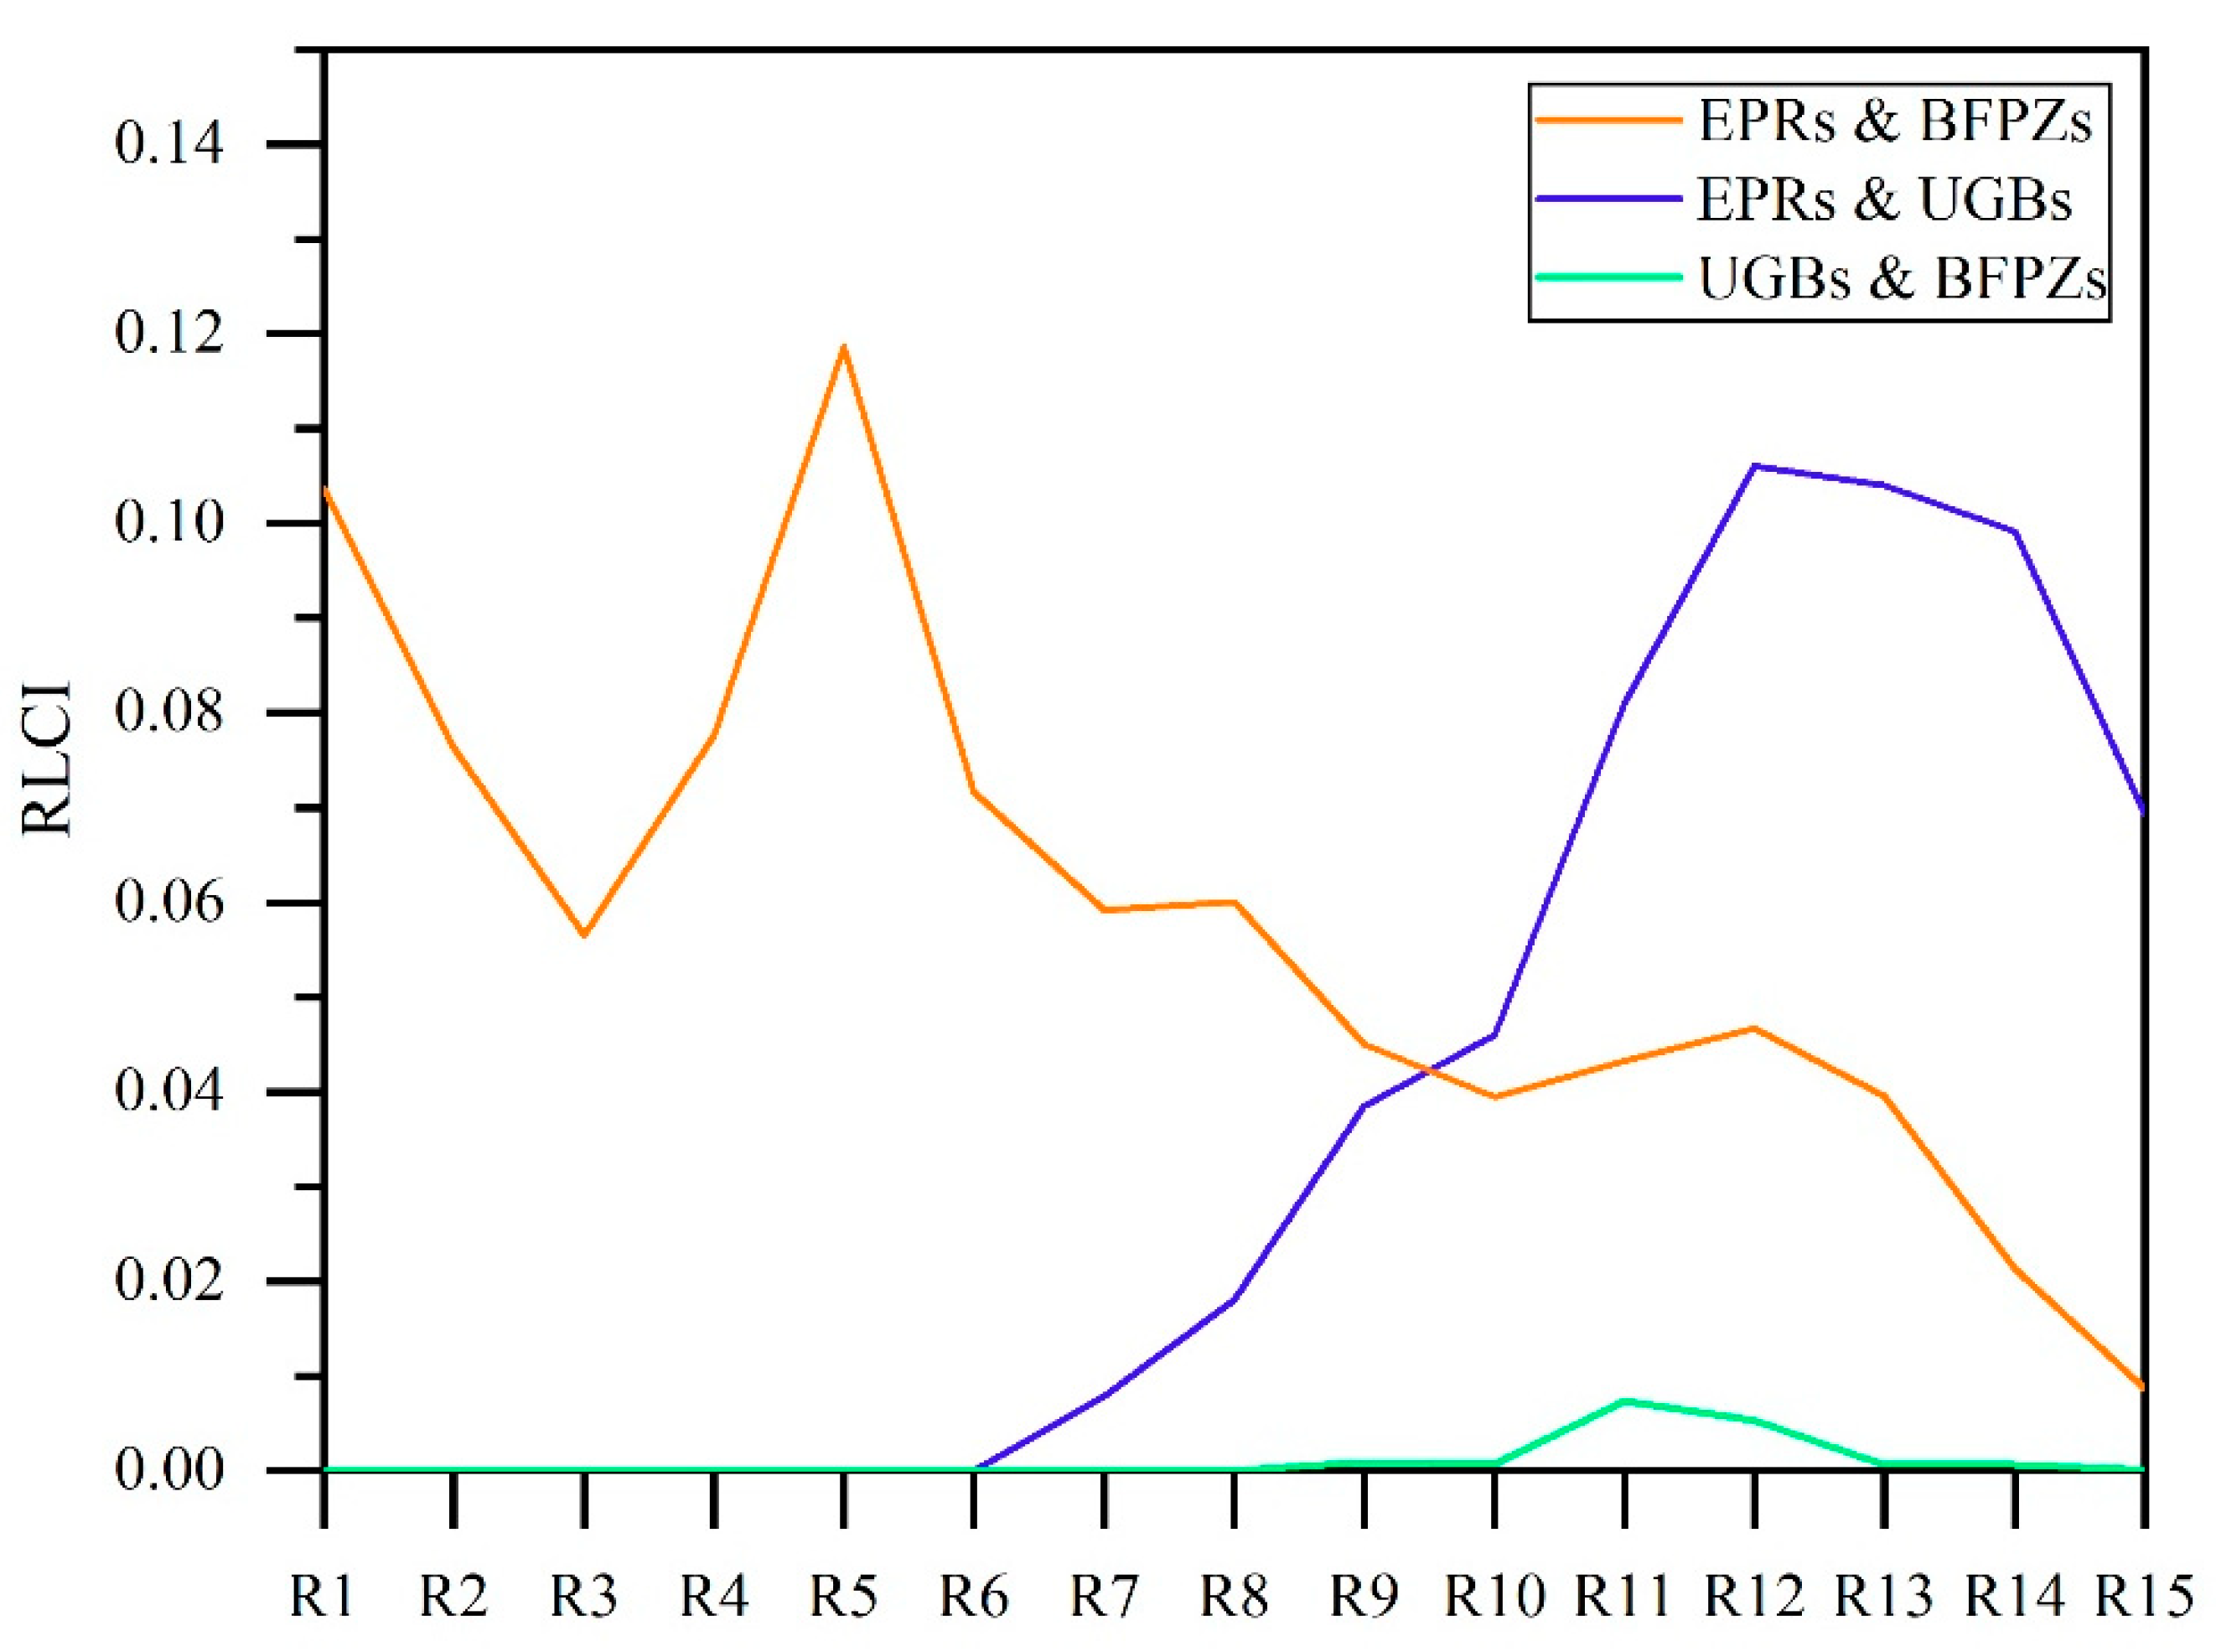
3.1.2. Distribution Regularities of Conflicts among the Three LMRLs along the Urban–Rural Gradient

From the urban center to the suburbs (R1–R15), the RLCIs of the three types of conflicts between every two LMRLs vary (Figure 5). For the conflict between EPRs and UGBs, the RLCI decreases first, then increases, and finally decreases sharply. However, the RLCIs of the conflict between EPRs and BFPZs and between BFPZs and UGBs increase first, and then decrease. For the conflict between the EPRs and UGBs, the RLCI changes sharply in R3–R6 (next to the third circulation line). For the conflicts between EPRs and BFPZs and between BFPZs and UGBs, the intensity fluctuates wildly in R10–R13 (urban–rural transition zones).

3.1.3. Landscape Patterns of Conflicts among the Three LMRLs

Table 2 summarizes the four landscape pattern indices of the patches of conflicts among the three LMRLs. The values of MPS are 0.07, 0.09, and 0.05 for the conflicts between EPRs and BFPZs, between EPRs and UGBs, and between BFPZs and UGBs, correspondingly. The values of PD are 14.71, 11.33, and 21.78 for the conflicts between EPRs and BFPZs, between EPRs and UGBs, and between BFPZs and UGBs, respectively. The conflict between BFPZs and UGBs demonstrates the smallest mean patch and the largest patch density, thus implying that the fragmentation is higher in the conflict between BFPZs and UGBs than in the conflicts between EPRs and BFPZs and between EPRs and UGBs. The values of PAFRAC are 0.05, 0.05, and 0.04 for the conflicts between EPRs and BFPZs, between EPRs and UGBs, and between BFPZs and UGBs, correspondingly, thereby denoting that the shapes of conflicts between BFPZs and UGBs are complex. The AI values in the present study are 57.79, 59.07, and 50.21 for the conflicts between EPRs and BFPZs, between EPRs and UGBs, and between BFPZs and UGBs, respectively. These results suggest that the conflicts between BFPZs and UGBs have the lowest aggregation degree.

3.2. Results of the Three Binary Logistic Regression Models

3.2.1. Robustness of the Models

Table 3 lists the identified driving factors of the three types of conflicts among the three LMRLs. The values of the percentage correct predictions of each model range between 71.4% and 72.3%; the area under the curve values reach 0.74–0.85, and Nagelkerke’s R2 values are all greater than 0.23. These statistics indicate that the three binary logistic regression models can properly explain the processes of all three types of conflicts among the three LMRLs. The explained variance of the probability of conflict between EPRs and UGBs is the highest (53%); this variance is significantly higher than those of the conflicts between EPRs and BFPZs (24%) and between BFPZs and UGBs (23%).

3.2.2. Driving Factors of the Conflicts among the Three LMRLs

The variables of natural physical, socioeconomic, neighborhood, and policy and planning together, significantly affect the conflicts among the three LMRLs. However, the factors and their impacts vary with the types of conflicts among the three LMRLs.
Natural physical factors: Not all the natural physical factors are exploratory variables for the three types of conflicts among the three LMRLs. In general, elevation negatively affects the conflict between EPRs and BFPZs, and slope negatively affects the conflict between BFPZs and UGBs. For the conflict between EPRs and UGBs, elevation and slope are not the driving factors. However, Driver demonstrates consistently negative effects on the three types of conflicts among the LMRLs.
Socioeconomic factors: The socioeconomic factors also show significant influences on the conflicts among the three LMRLs, but their effects vary over the different types of conflicts among the three LMRLs. GDPdensity represents the negative effects for the conflicts between BFPZs and UGBs, and it is uncorrelated with the two other types of conflicts among the LMRLs. In addition, Popdensity is positively exploratory for the conflicts between EPRs and BFPZs and between BFPZs and UGBs, but it is uncorrelated with the conflict between EPRs and UGBs.
Neighborhood factors: Dcicenter shows consistently negative relationships with the conflicts among the three LMRLs, whereas Draway has different impacts on the three types of conflicts among the three LMRLs. Draway negatively affects the conflict between EPRs and UGBs, but it positively affects the conflicts between EPRs and BFPZs. Except for the conflict between EPRs and BFPZs, Dmaway is insignificantly correlated with the conflicts among the three LMRLs. In addition, adjacent land use typologies are important influencing factors in the conflicts among the three LMRLs. Pculland negatively affects the conflict between EPRs and UGBs while positively affects the two other types of conflicts among the three LMRLs. Pconland denotes the negative effects on the conflict between EPRs and BFPZs, and the positive effects on the conflicts between BFPZs and UGBs and between EPRs and UGBs. Pecoland indicates the positive effects for the conflicts between EPRs and BFPZs, and between EPRs and UGBs, but it is uncorrelated with the conflict between UGBs and BFPZs.
Policy and planning factors: Relevant policies and planning are crucial to the progress of conflicts among the three LMRLs. Restricted development zones in the major function zoning are high prevalence areas of conflict between EPRs and BFPZs, and the key development zones are high-prevalence areas for the three types of conflicts among the three LMRLs. In addition, the conflict between BFPZs and UGBs is prone to occur in Wuhan Garden Show Park.
Table 4 summarizes the relative importances of the identified driving factors of the three types of conflicts among the three LMRLs, which are ranked by the Wald X2 statistics (Table 3). The combination of the driving factors and the relative importance of common and special factors vary with the three types of conflicts among the three LMRLs. In general, Driver, Dcicenter, Pculland, Pconland, and Key_development_zone are common factors in the three types of conflicts among the three LMRLs. However, the relative importances of these factors vary. For example, Dcicenter is more important than the other factors in the conflict between EPRs and BFPZs; this condition is the opposite in the conflict between UGBs and BFPZs. For the conflict between EPRs and BFPZs, Dcicenter is the most important influencing factor, followed by Pecoland and Elevation. Elevation, Popdensity, Pecoland, Draway, and Res_development_zone are special factors. For the conflict between UGBs and EPRs, Pconland, Dcicenter, and Key_development_zone are the most important factors, and Draway and Pecoland are special factors. Pecoland, Driver, and Pculland significantly influence the conflict between UGBs and BFPZs. Slope, GDPdensity, Popdensity, and His_event_zone are special factors in the conflict between UGBs and BFPZs.

4. Discussion

4.1. Comparison of the Three Types of Conflicts among the Three LMRLs

Conflicts between EPRs and BFPZs: The hotspots of conflict between EPRs and BFPZs are mainly concentrated on the edge of the WUDA. This condition is obviously due to EPRs and BFPZs being distributed mainly outside Wuhan’s third circulation line. From R6 to R12, the RLCI of the conflict between EPRs and BFPZs is increasing to the peak, but it will steadily fall by R15. This result is consistent with the hotspot analysis of the conflict between EPRs and BFPZs. The values of PD, MPS, PAFRAC, and AI are at the mid-level for the conflicts between EPRs and BFPZs, and they are especially relative to the conflicts between UGBs and BFPZs and between EPRs and UGBs. All the factors, other than Slope and His_event_zone, have effects on the conflict between EPRs and BFPZs. This finding may be due to the change tendency of EPRs and BFPZs vary with the change in Slope and His_event_zone. In general, for example, EPRs are increasingly distributed with the slope degree increase. However, BFPZs are distributed decreasingly because the sloped farmland, with slopes up to 25° must not be designated as BFPZs. Pecoland, Pculland, Draway, Dmaway, and Key_development_zone positively affect the conflict between EPRs and BFPZs. These indicate that the conflict between EPRs and BFPZs is more likely to occur, where the transport facilities are poor, the non-construction lands are concentrated, or where the key development zones are delimited. In addition, the negative effects of Driver, Popdensity, Dcicenter, and Res_development_zone are observed, because EPRs or BFPZs are less well-distributed in areas far from rivers and city centers, densely inhabited districts, and restricted development zones.
Conflict between EPRs and UGBs: The hotspots of the conflicts between EPRs and UGBs blend harmoniously into the core areas of the WUDA, because UGBs and EPRs are widely distributed in the WUDA. The conflicts between EPRs and UGBs are distributed in all gradients, and the RLCI sharply changes in R1–R6 (inside the third circulation line). This condition is due to its landscape mosaic in mountains and rivers in the WUDA, particularly the impact of the East Lake (near the third circulation road). The aggregation degree is clearly higher in the conflict between EPRs and UGBs than in the two other types of conflicts among the three LMRLs, because EPRs and UGBs are frequently distributed over a large expanse. Pculland, Driver, Dcicenter, and Draway negatively affect the conflict between EPRs and UGBs. This finding explains the likely occurrence of conflict between EPRs and UGBs at the banks of rivers, in city centers and railway neighborhoods, and in areas with small farmlands. Pecoland, Pconland, and Key_development_zone positively affect the conflict between EPRs and UGBs, thus indicating that conflicts between EPRs and UGBs may occur where the proportion of construction or ecological lands are high, or where key development zone are delimited.
Conflict between BFPZs and UGBs: The hotspots of the conflict between UGBs and BFPZs are scattered in the urban–rural transition zone, because BFPZs are only distributed outside Wuhan’s circulation ring road. The conflicts between UGBs and BFPZs are relatively few, and thus the RLCI is lower in the conflict between UGBs and BFPZs than in the two other types of conflicts among the three LMRLs in all gradients. The intensity fluctuates wildly in R10–R13 (urban-rural transition zone), which is consistent with the hotspot analysis. Slope, Driver, GDPdensity, Popdensity, and Dcicenter negatively affect the conflict between UGBs and BFPZs. These findings indicate that conflicts between UGBs and BFPZs rarely occur in the core areas of urban economic and social activities, areas with a high slope, and areas far from the Yangtze and Han Rivers. However, Pculland, Pecoland, and Key_development_zone positively affect the conflict between UGBs and BFPZs. This result indicates that conflicts between UGBs and BFPZs may occur where the proportion of construction or cultivated lands are high, or where key development zones are delimited.

4.2. Implications for the “Integration of Multi-Planning”

Although many land control policies have been drawn in several planning policies or regularities, they are difficult to implement in China, because of inconsistent management zones that are divided by different departments. Therefore, the “integration of multi-planning” research has become a popular topic in China. The basic purpose of the “integration of multi-planning” is to achieve departmental coordination, and a “multi-planning” link through technical connection. Thus, the mechanisms of conflict among multiple planning policies must be thoroughly understood.
The conflicts among the three LMRLs are the core concern of multi-planning conflict. The recognition of the driving factors of conflicts among the three LMRLs is valuable in implementing the “integration of multi-planning”, and seeking the optimal trade-off in the current predicament of socioeconomic development, eco-environmental protection, and food security. This study reveals the spatial distribution patterns and the characteristics of landscape patterns of the three types of conflicts among the three LMRLs and identifies the driving forces of conflicts among the three LMRLs, thus providing important decision-making information for the “integration of multi-planning”. First, the spatial distribution information of the three types of conflicts among the three LMRLs can be immediately adopted for allocating land use, assisting managers and planners’ decision-making, and facilitating sustainable and efficient land use. For example, when analyzing the location of new large-scale projects, the decision-makers must be aware of whether conflicts among the three LMRLs previously exist. Managers and planners may avoid controversial land use arrangements in conflict zones through the spatial distribution information of the three types of conflicts among the three LMRLs and implement various plans smoothly. Second, studies on the spatial patterns of conflicts among the three LMRLs in the WUDA provides a reference for optimizing the spatial distribution of the three LMRLs. On the basis of geographic information system (GIS) and optimization algorithms, the spatial patterns of conflicts among the three LMRLs can contribute to optimizing the spatial distributions of the three LMRLs. Third, the revealed driving mechanism of conflicts among the three LMRLs helps in avoiding similar situations in the future. For example, the policies are government behaviors, which play an important role in conflicts among the three LMRLs. However, three types of conflicts among the three LMRLs may occur in key development zones of major function-oriented zoning. Therefore, decision-makers must prudently reconsider the rationality of relevant planning and policies.

4.3. Contributions and Limitations of the Present Study

In this study, we innovatively introduce conflict theory to exploring LMRLs and first propose the concept of “conflicts among the three LMRLs.” We summarize the definition and classification of conflicts among the three LMRLs, thereby facilitating the spatial analysis of the conflicts at a fine scale (e.g., 1 km × 1 km grid). On this basis, we adopt the WUDA as the case study, and apply a series of spatial statistical methods (i.e., spatial autocorrelation, gradient, and landscape pattern analyses) to explore the spatial patterns of conflicts among the three LRMLs. We further conduct binary logistic regression to analyze the driving mechanism of the three types of conflicts among the three LMRLs.
This study still has several limitations. First, Moran’s I only reveals the non-randomness of the patterns of conflicts among the three LMRLs from a single scale. Second, considering the data acquisition ability, 1 km × 1 km grids are utilized. However, the output from the logistic regression model may vary in different analysis scales [61]. Additionally, we do not examine the spatial non-stationarity of the identified driving factors, which can be used to analyze the spatial variations in the effect of each determinant [62]. Therefore, future work on the sensitivity impacts of grid scales on the driving factors in conflicts among the three LMRLs can be conducted, and logistic geographically weighted regression is worth applying. In addition, the presented method mainly applies to the conflicts among the “three LMRLs “problem of Chinese cities. Moreover, for cities of different sizes and local conditions, the specific spatial statistical analysis methods and potential driving factors should be selected differently and individually.

5. Conclusions

On the basis of the spatial pattern analysis and logistic regression model analysis, we quantitatively recognize the spatial patterns and driving forces of the three types of conflicts among the three LMRLs. This study can provide a systematic framework for analyzing conflicts among the three LRMLs, and our results can provide guidance for landscape planning, to avoid the conflict of multiple spatial plans.
The results of the spatial pattern analysis show a moderately positive spatial autocorrelation among the three types of conflicts between every two LMRLs. The hotspots of conflicts between EPRs and BFPZs, between EPRs and UGBs, and between UGBs and BFPZs, are mainly concentrated on the edge of the WUDA, the core areas of the WUDA, and the urban–rural transition zone, thereby presenting corresponding gradient differentiation patterns. The fragmentation and shape complexities are higher within the conflict between BFPZs and UGBs than in the conflicts between EPRs and BFPZs and between EPRs and UGBs. However, the conflicts between EPRs and BFPZs and between EPRs and UGBs are more easily connected than the conflict between BFPZs and UGBs.
The logistic regression results show that the combinations and relative importance of the driving factors vary with the three types of conflicts among the three LMRLs. Driver, Dcicenter, Pculland, Pconland, and Key_development_zone are constantly the dominant drivers. In particular, Driver and Dcicenter negatively affect and Key_development_zone positively affects the three types of conflicts among the three LMRLs; however, Pculland and Pconland have different effects on the three types of conflicts among the three LMRLs. In addition, for the conflict between EPRs and BFPZs, Dcicenter is the most important influencing factor, followed by Pecoland and Elevation. Elevation, Popdensity, Pecoland, Draway, and Res_development_zone are the special factors of the conflict between EPRs and BFPZs. For the conflict between UGBs and EPRs, Pconland, Dcicenter, and Key_development_zone are the three most important factors, and Draway and Pecoland are the special factors. Pecoland, Driver, and Pculland significantly influence the conflict between UGBs and BFPZs. Slope, GDPdensity, Popdensity, and His_event_zone are the special factors of the conflict between UGBs and BFPZs.
To ensure a sustainable urbanization, the spatial patterns and driver factors of conflicts between the three LMRLs must be explored to demarcate the three basic spaces, and to implement the “integration of multi-planning”. This study extends our understanding of the multiple-planning conflict in China and thus is meaningful to policy-making and other related research. On the basis of the findings in this study, we suggest that the government reconsiders the rationality of the relevant planning and policies, and builds a unified planning platform for demarcating the three LMRLs.

Author Contributions

Conceptualization, Y.Z. (Yang Zhang), E.C. and Y.L. (Yaolin Liu); Data curation, Y.L. (Yanfang Liu) and Z.W.; Formal analysis, Y.Z. (Yang Zhang) and Y.Z. (Yan Zhang); Investigation, Z.W.; Methodology, Y.L. (Yanfang Liu) and L.Z.; Project administration, Y.L. (Yaolin Liu); Resources, Y.L. (Yaolin Liu); Supervision, X.K. and Y.L. (Yaolin Liu); Visualization, L.Z. and Y.L. (Yi Liu); Writing—original draft, Y.Z. (Yang Zhang); Writing—review & editing, Y.Z. (Yan Zhang), X.K., Y.J. and E.C.

Funding

This research was funded by the National Natural Science Foundation of China [41771432]. And the APC was funded by the special fund for young talents in Henan Agricultural University [30500426].

Conflicts of Interest

The authors declare no conflict of interest.

References

  1. UNFPA. State of World Population 2007; United Nations Population Fund: New York, NY, USA, 2008. [Google Scholar]
  2. Huang, Z.; Wei, Y.D.; He, C.; Li, H. Urban land expansion under economic transition in China: A multi-level modeling analysis. Habitat Int. 2015, 47, 69–82. [Google Scholar] [CrossRef]
  3. Bren, C.D.A.; Reitsma, F.; Baiocchi, G.; Barthel, S.; Güneralp, B.; Erb, K.H.; Haberl, H.; Creutzig, F.; Seto, K.C. Future urban land expansion and implications for global croplands. Proc. Natl. Acad. Sci. USA 2017, 114, 8939. [Google Scholar] [CrossRef] [PubMed]
  4. Wu, Y.; Zhang, X.; Shen, L. The impact of urbanization policy on land use change: A scenario analysis. Cities 2011, 28, 147–159. [Google Scholar] [CrossRef]
  5. He, C.; Liu, Z.; Tian, J.; Ma, Q. Urban expansion dynamics and natural habitat loss in China: A multiscale landscape perspective. Glob. Chang. Biol. 2014, 20, 2886. [Google Scholar] [CrossRef] [PubMed]
  6. Chen, Z.; Wang, Q.; Chen, Y.; Huang, X. Is illegal farmland conversion ineffective in China? Study on the impact of illegal farmland conversion on economic growth. Habitat Int. 2015, 49, 294–302. [Google Scholar] [CrossRef]
  7. Liu, J.; Zhang, G.; Zhuang, Z.; Cheng, Q.; Gao, Y.; Chen, T.; Huang, Q.; Xu, L.; Chen, D. A new perspective for urban development boundary delineation based on sleuth-invest model. Habitat Int. 2017, 70, 13–23. [Google Scholar] [CrossRef]
  8. Jiang, P.; Cheng, Q.; Gong, Y.; Wang, L.; Zhang, Y.; Cheng, L.; Li, M.; Lu, J.; Duan, Y.; Huang, Q. Using urban development boundaries to constrain uncontrolled urban sprawl in China. Ann. Am. Assoc. Geogr. 2016, 106, 1321–1343. [Google Scholar] [CrossRef]
  9. Wang, Y.; Gao, J.; Zou, C.; Xu, D.; Wang, L.; Jin, Y.; Wu, D.; Lin, N.; Xu, M. Identifying ecologically valuable and sensitive areas—A case study analysis from China. J. Nat. Conserv. 2017, 40, 49–63. [Google Scholar] [CrossRef]
  10. Wei, S. Decoupling cultivated land loss by construction occupation from economic growth in Beijing. Habitat Int. 2014, 43, 198–205. [Google Scholar]
  11. Liang, C.; Jiang, P.; Wei, C.; Li, M.; Wang, L.; Yuan, G.; Yuzhe, P.; Nan, X.; Duan, Y.; Huang, Q. Farmland protection policies and rapid urbanization in China: A case study for Changzhou City. Land Use Policy 2015, 48, 552–566. [Google Scholar] [CrossRef]
  12. Ma, S.; Li, X.; Cai, Y. Delimiting the urban growth boundaries with a modified ant colony optimization model. Comput. Environ. Urban Syst. 2017, 62, 146–155. [Google Scholar] [CrossRef]
  13. Bhatta, B. Modelling of urban growth boundary using geoinformatics. Int. J. Digit. Earth 2009, 2, 359–381. [Google Scholar] [CrossRef]
  14. Boussauw, K.; Allaert, G.; Witlox, F. Colouring inside what lines? Interference of the urban growth boundary and the political-administrative border of Brussels. Eur. Plan. Stud. 2013, 21, 1509–1527. [Google Scholar] [CrossRef]
  15. Carlson, T.; Dierwechter, Y. Effects of urban growth boundaries on residential development in Pierce County, Washington. Prof. Geogr. 2007, 59, 209–220. [Google Scholar]
  16. Taylor, E.J. Urban growth boundaries and betterment: Rent-seeking by landowners on Melbourne’s expanding urban fringe. Growth Chang. 2016, 47, 259–275. [Google Scholar] [CrossRef]
  17. Coughlin, R.E. Formulating and evaluating agricultural zoning programs. J. Am. Plan. Assoc. 1991, 57, 183–192. [Google Scholar] [CrossRef]
  18. Cheng, Q.W.; Jiang, P.H.; Cai, L.Y.; Shan, J.X.; Zhang, Y.Q.; Wang, L.Y.; Li, M.C.; Li, F.X.; Zhu, A.X.; Chen, D. Delineation of a permanent basic farmland protection area around a city centre: Case study of Changzhou City, China. Land Use Policy 2017, 60, 73–89. [Google Scholar]
  19. Wang, K.; Wei, Q.I. Space-time relationship between urban municipal district adjustment and built-up area expansion in China. Chin. Geogr. Sci. 2017, 27, 165–175. [Google Scholar] [CrossRef]
  20. Wei, S.; Pijanowski, B.C. The effects of China’s cultivated land balance program on potential land productivity at a national scale. Appl. Geogr. 2014, 46, 158–170. [Google Scholar]
  21. Chen, J. Rapid urbanization in China: A real challenge to soil protection and food security. Catena 2007, 69, 1–15. [Google Scholar] [CrossRef]
  22. Zheng, X.-Q.; Lv, L.-N. A woe method for urban growth boundary delineation and its applications to land use planning. Int. J. Geogr. Inf. Sci. 2016, 30, 691–707. [Google Scholar] [CrossRef]
  23. Liu, Y.; Fang, F.; Li, Y. Key issues of land use in China and implications for policy making. Land Use Policy 2014, 40, 6–12. [Google Scholar] [CrossRef]
  24. Bai, Y.; Jiang, B.; Wang, M.; Li, H.; Alatalo, J.M.; Huang, S. New ecological redline policy (erp) to secure ecosystem services in China. Land Use Policy 2016, 55, 348–351. [Google Scholar] [CrossRef]
  25. He, J.; Guan, X. Modeling approach for farmland preservation zoning considering spatial heterogeneity: A case study of E-Zhou City, China. Sustainability 2016, 8, 1052. [Google Scholar] [CrossRef]
  26. Liu, X.; Zhao, C.; Song, W. Review of the evolution of cultivated land protection policies in the period following China’s reform and liberalization. Land Use Policy 2017, 67, 660–669. [Google Scholar] [CrossRef]
  27. Zhou, X.; Lu, X.; Lian, H.; Chen, Y.; Wu, Y. Construction of a spatial planning system at city-level: Case study of “integration of multi-planning” in Yulin City, China. Habitat Int. 2017, 65, 32–48. [Google Scholar] [CrossRef]
  28. He, Q.; Tan, R.; Gao, Y.; Zhang, M.; Xie, P.; Liu, Y. Modeling urban growth boundary based on the evaluation of the extension potential: A case study of Wuhan City in China. Habitat Int. 2016, 72, 57–65. [Google Scholar] [CrossRef]
  29. Long, Y.; Han, H.; Lai, S.-K.; Mao, Q. Urban growth boundaries of the Beijing Metropolitan Area: Comparison of simulation and artwork. Cities 2013, 31, 337–348. [Google Scholar] [CrossRef]
  30. Han, H.; Ma, Q.; Li, Y. Urban growth boundaries of the Hangzhou Metropolitan Area based on ecosystem service. Int. Rev. Spat. Plan. Sustain. Dev. 2017, 5, 4–16. [Google Scholar] [CrossRef]
  31. Tayyebi, A.; Pijanowski, B.C.; Tayyebi, A.H. An urban growth boundary model using neural networks, gis and radial parameterization: An application to Tehran, Iran. Landsc. Urban Plan. 2011, 100, 35–44. [Google Scholar] [CrossRef]
  32. Liu, X.H.; Liu, L.; Peng, Y. Ecological zoning for regional sustainable development using an integrated modeling approach in the Bohai Rim, China. Ecol. Model. 2017, 353, 158–166. [Google Scholar] [CrossRef]
  33. Wang, C.S.; Sun, G.Y.; Dang, L.J. Identifying ecological red lines: A case study of the coast in Liaoning Province. Sustainability 2015, 7, 9461–9477. [Google Scholar] [CrossRef]
  34. Su, Y.X.; Chen, X.Z.; Liao, J.S.; Zhang, H.O.; Wang, C.J.; Ye, Y.Y.; Wang, Y. Modeling the optimal ecological security pattern for guiding the urban constructed land expansions. Urban For. Urban Green. 2016, 19, 35–46. [Google Scholar] [CrossRef]
  35. Zhang, R.; Li, J.; Du, Q.; Ren, F. Basic farmland zoning and protection under spatial constraints with a particle swarm optimisation multiobjective decision model: A case study of Yicheng, China. Environ. Plan. B Plan. Des. 2015, 42, 1098–1123. [Google Scholar] [CrossRef]
  36. Wang, L.; Shen, J. The challenge of spatial plan coordination in urban China: The case of Suzhou City. Urban Policy Res. 2017, 35, 180–198. [Google Scholar] [CrossRef]
  37. Chaolin, G.U. On the separation of China’s spatial plans and their evolution and integration. Geogr. Res. 2015, 34, 601–613. [Google Scholar]
  38. Zhang, Y.; Fang, C. A review on spatial planning coordination and China’s coordinated planning. Urban Plan. Forum 2016, 2, 78–87. [Google Scholar]
  39. Zhang, Y.X.; Feng, G.J. Study on the mechanism of “multiple plans conflicts” and “multiple plans integration” based on the spatiotemporal cone theory. China Land Sci. 2017, 5, 3–11. [Google Scholar]
  40. Meng, P.; Feng, G.; Wu, D. Causes of the multiple-planning conflict and principle of multiple-planning integration: Reviews of the workshop “land use conflicts and multiple planning integration”. China Land Sci. 2015, 8, 3–10. [Google Scholar]
  41. Adams, W.M.; Brockington, D.; Dyson, J.; Vira, B. Managing tragedies: Understanding conflict over common pool resources. Science 2003, 302, 1915–1916. [Google Scholar] [CrossRef]
  42. Brown, G.; Raymond, C.M. Methods for identifying land use conflict potential using participatory mapping. Landsc. Urban Plan. 2014, 122, 196–208. [Google Scholar] [CrossRef]
  43. Dunk, A.V.D.; Grêt-Regamey, A.; Dalang, T.; Hersperger, A.M. Defining a typology of peri-urban land-use conflicts—A case study from Switzerland. Landsc. Urban Plan. 2011, 101, 149–156. [Google Scholar] [CrossRef]
  44. Moran, P.A. Notes on continuous stochastic phenomena. Biometrika 1950, 37, 17. [Google Scholar] [CrossRef] [PubMed]
  45. Lin, Z.; Chao, L.; Wu, C.; Hong, W.; Hong, T.; Hu, X. Spatial analysis of carbon storage density of mid-subtropical forests using geostatistics: A case study in Jiangle County, southeast China. Acta Geochimica 2017, 37, 90–101. [Google Scholar] [CrossRef]
  46. Anselin, L. Local indicators of spatial association—LISA. Geogr. Anal. 1995, 27, 93–115. [Google Scholar] [CrossRef]
  47. Ord, J.K.; Getis, A. Local spatial autocorrelation statistics: Distributional issues and an application. Geogr. Anal. 1995, 27, 286–306. [Google Scholar] [CrossRef]
  48. Mckinney, M.L. Urbanization, biodiversity, and conservation. Bioscience 2002, 52, 883–890. [Google Scholar]
  49. Li, H.; Peng, J.; Liu, Y.; Hu, Y.N. Urbanization impact on landscape patterns in Beijing City, China: A spatial heterogeneity perspective. Ecol. Indic. 2017, 82, 50–60. [Google Scholar] [CrossRef]
  50. Fan, Q.; Ding, S. Landscape pattern changes at a county scale: A case study in Fengqiu, Henan Province, China from 1990 to 2013. Catena 2016, 137, 152–160. [Google Scholar] [CrossRef]
  51. Mcgarigal, K.; Cushman, S.A.; Neel, M.C.; Ene, E. Fragstats v4: Spatial Pattern Analysis Program for Categorical and Continuous Maps; Computer software program produced by the authors at the University of Massachusetts. Amherst, MA, USA. Available online: http://www.umass.edu/landeco/research/fragstats/fragstats.html (accessed on 5 Feburary 2019).
  52. Wu, K.Y.; Zhang, H. Land use dynamics, built-up land expansion patterns, and driving forces analysis of the fast-growing Hangzhou Metropolitan Area, eastern China (1978–2008). Appl. Geogr. 2012, 34, 137–145. [Google Scholar] [CrossRef]
  53. Seto, K.C.; Michail, F.; Burak, G.; Reilly, M.K. A meta-analysis of global urban land expansion. PLoS ONE 2011, 6, e23777. [Google Scholar] [CrossRef] [PubMed]
  54. Menard, S.W. Applied Logistic Regression Analysis; Sage: Thousand Oaks, CA, USA, 2002; Volume 106. [Google Scholar]
  55. Shu, B.; Zhang, H.; Li, Y.; Qu, Y.; Chen, L. Spatiotemporal variation analysis of driving forces of urban land spatial expansion using logistic regression: A case study of port towns in Taicang City, China. Habitat Int. 2014, 43, 181–190. [Google Scholar] [CrossRef]
  56. Braimoh, A.K.; Onishi, T. Spatial determinants of urban land use change in Lagos, Nigeria. Land Use Policy 2007, 24, 502–515. [Google Scholar] [CrossRef]
  57. Verburg, P.H.; Berkel, D.B.V.; Doorn, A.M.V.; Eupen, M.V.; Heiligenberg, H.A.R.M.v.d.; Houet, T.; Verburg, P.H.; Loveland, T.R. Trajectories of land use change in Europe: A model-based exploration of rural futures. Landsc. Ecol. 2010, 25, 217–232. [Google Scholar] [CrossRef]
  58. Li, X.; Zhou, W.; Ouyang, Z. Forty years of urban expansion in Beijing: What is the relative importance of hysical, socioeconomic, and neighborhood factors? Appl. Geogr. 2013, 38, 1–10. [Google Scholar] [CrossRef]
  59. Crk, T.; Uriarte, M.; Corsi, F.; Dan, F. Forest recovery in a tropical landscape: What is the relative importance of biophysical, socioeconomic, and landscape variables? Landsc. Ecol. 2009, 24, 629–642. [Google Scholar] [CrossRef]
  60. Betts, M.G.; Diamond, A.W.; Forbes, G.J.; Villard, M.A.; Gunn, J.S. The importance of spatial autocorrelation, extent and resolution in predicting forest bird occurrence. Ecol. Model. 2006, 191, 197–224. [Google Scholar] [CrossRef] [Green Version]
  61. Olaniyi, A.O.; Abdullah, A.M.; Ramli, M.F.; Alias, M.S. Assessment of drivers of coastal land use change in Malaysia. Ocean Coast. Manag. 2012, 67, 113–123. [Google Scholar] [CrossRef]
  62. Luo, J.; Wei, Y.H.D. Modeling spatial variations of urban growth patterns in Chinese cities: The case of Nanjing. Landsc. Urban Plan. 2009, 91, 51–64. [Google Scholar] [CrossRef]
Figure 1. Location of the Wuhan urban development area (WUDA).
Sustainability 11 02025 g001
Figure 2. Occurrence mechanism of conflicts among the three land management red lines (LMRLs).
Sustainability 11 02025 g002
Figure 3. (a) Distribution of ecological protection redlines (EPRs) in the WUDA. (b) Distribution of urban growth boundaries (UGBs) of the WUDA. (c) Distribution of basic farmland protection zones (BFPZs) of the WUDA. (d) Distribution of conflicts among the three LMRLs of the WUDA. (UGBs & BFPZs: conflict between UGBs and BFPZs; EPRs & UGBs: conflict between UGBs and BFPZs; EPRs & BFPZs: conflict between UGBs and BFPZs).
Sustainability 11 02025 g003
Figure 4. Distribution figure of the Z-scores of conflicts among the three LMRLs at the WUDA.
Sustainability 11 02025 g004
Figure 5. RLCIs of each gradient partition at the WUDA.
Sustainability 11 02025 g005
Table 1. Variables used in the three logistic regression models.
GroupVariable NameDescription
Dependent variableUGBs_EPRsIf site located in conflict between UGBs and EPRs zones, value = 1, otherwise value = 0
UGBs_BFPZsIf site located in conflict between UGBs and BFPZs zones, value = 1, otherwise value = 0
BFPZs_EPRsIf site located in conflict between BFPZs and EPRs zones, value = 1, otherwise value = 0
Natural physical factorsSlopeSite average slope
ElevationSite average elevation
DriverDistance to the Yangtze River and Han River
Socioeconomic factorsGDPdensityGross domestic product within a 1 km × 1 km grid
PopdensityDensity of population within a 1 km × 1 km grid
Neighborhood factorsDcicenterDistance to city centers
DrawayDistance to railways
DmawayDistance to major ways
PcullandProportion of cultivated land
PconlandProportion of construction land
PecolandProportion of ecological land
Policy and planning factorsRes_development_zoneIf site located in restricted development zones, value = 1, otherwise value = 0
Key_development_zoneIf site located in key development zones, value = 1, otherwise value = 0
Opt_development_zoneIf site located in optimizing development zones, value = 1, otherwise value = 0
His_event_zoneIf site located in historic events zones, value = 1, otherwise value = 0
Table 2. Correlation landscape pattern index of conflicts among the three LMRLs of the WUDA.
Types of Conflict among LMRLsMPSPAFRACPDAI
Conflict between EPRs and BFPZs0.071.2914.7157.79
Conflict between EPRs and UGBs0.091.2411.3359.07
Conflict between BFPZs and UGBs0.051.3021.7850.21
Table 3. Summary of the logistic regression models.
VariablesConflict between EPRs and BFPZsConflict between EPRs and UGBsConflict between BFPZs and UGBs
βWald X2βWald X2βWald X2
Constant2.775 **70.1940.4620.839−1.235 *8.916
Elevation−13.465 **56.138−6.1093.469−2.2380.803
Slope0.3240.292−0.7491.129−1.583 *5.097
Driver−1.241 **15.162−2.715 **32.535−2.419 **39.106
GDPdensity−0.5520.195−1.3610.654−2.394 *4.111
Popdensity−5.485 **12.410−0.9100.287−10.143 *37.384
Dcicenter−3.014 **91.796−3.854 **54.678−1.623 **21.230
Draway0.796 **3.801−1.485 **9.8210.1410.119
Dmaway1.482 **12.1541.0022.648−0.5161.312
Pculland0.783 **8.262−1.148 **12.3211.889 **37.663
Pconland−1.276 **12.0064.641 **77.9635.503 **131.897
Pecoland5.761 **86.6201.383 *5.2780.9433.049
Res_development_zone0.445 **0.2590.4700.351−2.0823.247
Key_development_zone0.319 *5.2321.159 **38.6100.730 **25.175
His_event_zone1.6002.5180.3000.0653.309 **7.266
N2149 2149 2149
Percent correct predictions78.4 85.1 77.5
Area under the curve0.77 0.91 0.81
Nagelkerke R20.263 0.531 0.309
* Indicates significance at 0.05 level. ** Indicates significance at 0.01 level.
Table 4. Rank order of the relative influences of the factors according to different logistic models.
VariablesEPRs & BFPZsUGBs & EPRsUGBs & BFPZs
Elevation3----
Slope----8
Driver442
GDPdensity----9
Popdensity5--4
Dcicenter126
Draway106--
Dmaway6----
Pculland853
Pconland711
Pecoland27--
Res_development_zone11----
Key_development_zone935
His_event_zone----7
The factors written in bold indicate common factors.

