Consumer Needs for Hand-Touch Product Designs Based on the Experience Economy

Graduate School of Design, National Yunlin University of Science and Technology, Douliu, Yunlin 64002, Taiwan
*
Author to whom correspondence should be addressed.
Sustainability 2019, 11(7), 2064; https://doi.org/10.3390/su11072064
Submission received: 21 February 2019
/
Revised: 27 March 2019
/
Accepted: 1 April 2019
/
Published: 7 April 2019
(This article belongs to the Special Issue Selected Papers from 2nd Eurasian Conference on Educational Innovation 2019)
Abstract
:Hand-touch products are products that emphasize tactile sensations. These products can generate sensory stimulation and create memorable experiences for consumers, thereby driving purchase decisions. The economic value of hand-touch products is undoubtedly associated with the experience economy. Consumers generally focus on how much experience value is created by the hand-touch product itself. This study adopted the experience economy perspective to investigate the development of hand-touch products. To gain further insight into consumers’ product needs and place the focus of product development on the most important aspects, this study primarily adopted a questionnaire survey and Kano’s two-dimensional model to classify quality factors. In addition, the relative majority method was used to classify quality factors into five major categories: Attractive quality, One-dimensional quality, Must-be quality, Indifferent quality, Reverse quality. The study results showed that: (1) Consumers valued the sense marketing of hand-touch products. (2) Timely use of other marketing approaches enables a product to effectively meet customers’ needs. (3) Use of Cross Analysis to Identify Top-Priority Factors. This study’s findings on the true needs of consumers for hand-touch products can enhance and improve product life cycle, thereby achieving the sustainable development of products.
1. Introduction
1.1. Research Background
A wide variety of creative products that emphasize the tactile senses have been developed since the beginning of the twenty-first century. Hand-touch products differ from those that are machine-made and quickly mass-produced at a low cost, making hand-touch designs a new marketing element in the market [1]. The most distinct feature of hand-touch products is the use of design concepts incorporating emotion, warmth, tactile sensation, and other elements derived from the hand [2]. A good hand-touch product can create unforgettable experiences for consumers through the sensory stimulation of the product, and can subsequently drive purchase decisions. Hence, the economic value of hand-touch products is undoubtedly associated with the experience economy.
Amidst a rising economy in Taiwan, people are slowly able to fulfill their food and housing needs. Once survival and physiological needs are met, people progress on to meet emotional and self-fulfillment needs. As consumers gradually place emphasis on emotional resonance and service personalization, experience becomes increasingly more important. The academic and practical sectors have expressed a growing interest in the experiential marketing of psychological perception in recent years. An experiential marketer purports to create an environment that engages customers in visual, stimulated, interactive, and tactile experiences, thereby encouraging consumers to adopt consumption behavior actively and willingly [3]. Hence, consumers generally focus on how much experience value is created by a product itself. This study adopted the experience economy perspective to investigate the development of hand-touch products. A questionnaire survey and Kano’s two-dimensional model were used to analyze consumers’ true inner thoughts, and subsequently identify the factors of consumer needs for hand-touch product designs. The findings can assist product designers in departing from a marketing approach that uses product appearance as the selling point, and instead develop products that augment the experiences and identification of consumers, thereby delivering positive experiences. Thus, hand-touch products are sustainable in the experience economy and create greater added value.
1.2. Research Purpose
- To investigate the experience needs and preferences of consumers regarding hand-touch products.
- To propose feasible marketing strategies based on quality indicators.
- To analyze quality factors through a questionnaire survey and provide reference for marketing operators.
1.3. Research Importance
A product featuring design sense appeals to consumers through visual effects. By contrast, hand-touch products are characterized by not only visual elements but also tactile senses. People often gain pleasant sensory experiences from the sensation given when touching or feeling a product. With this product feature, hand-touch products can be promoted in an experience economy, leading to the development of innovation capacity.
When the design of a product is based on creative ideas, consumer purchase behavior becomes associated with passive choices. When a hand-touch product is introduced into an experience industry, how this product satisfies consumers’ needs for experiences becomes the focus of the industry. Therefore, this study adopted the experience economy perspective to understand the different types of experiences from consumers’ points of view and to redefine and contemplate design methods.
2. Literature Review
2.1. Experience Economy
2.1.1. The Characteristics of the Experience Economy
The economic pattern of a society varies with peoples’ lifestyles. It has evolved from the earliest agrarian economy and industrial economy into the most recent service economy. The most prominent characteristic of the service economy is building consumer rapport by selling products that meet consumers’ needs for personalization. However, the widespread development of the service economy has curbed peoples’ desires for personalized consumption, which prompted a shift in consumption to providing new commercial services, subsequently leading to the emergence of the next economy pattern—the experience economy. Any businesses in pursuit of sustainable development must commit to organizing special events that are worth remembering or cherishing for customers. These memories or feelings form the core product characteristic in the minds of customers, thus leading to the rise of experience economy [3].
The experience economy focuses on creating touching, surprising, and unforgettable sensations for consumers, and therefore, experience becomes the most essential element of this economic pattern. A literature review shows that scholars have proposed different views and definitions for the term “experience”, as summarized in Table 1:
Table 1 shows that experience is not a specific product but a process that creates feelings and memories for consumers. The value of an experience stems from the products and services offered and is the diversified product of the economy. Therefore, businesses must identify the types of experiences that consumers need in order to maximize the effects of the experience economy.
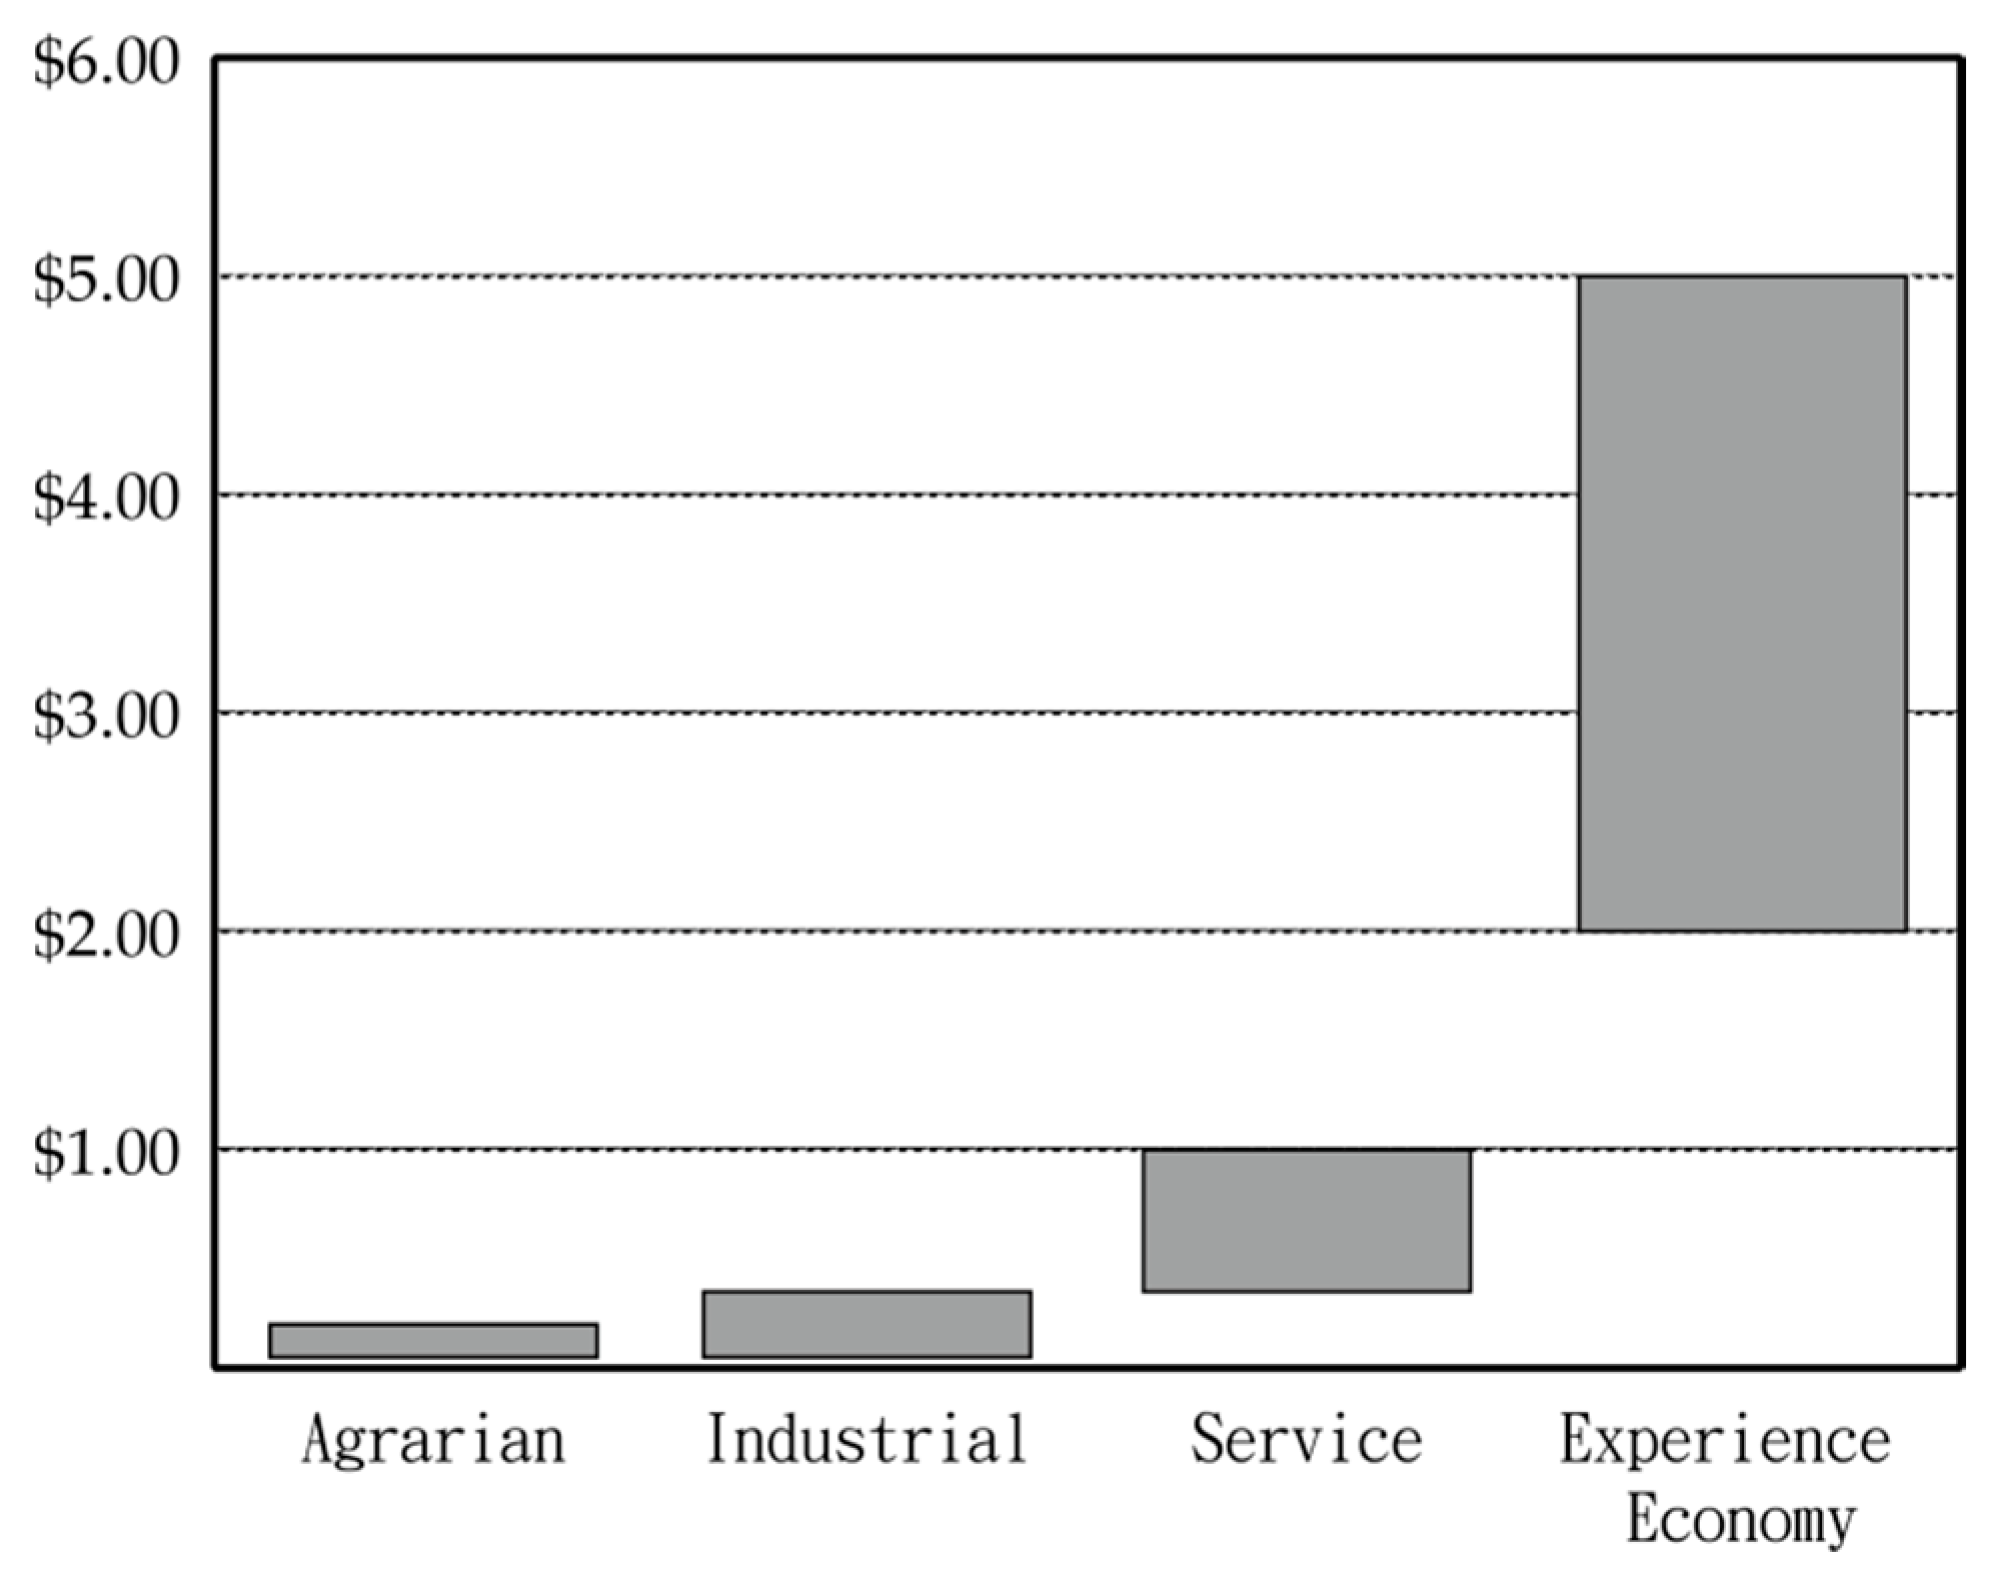
In the experience economy, Pine and Gilmore (1999) described the different types of economy [10]. For example, the early agrarian economy specialized mainly in primary goods and was followed by the industrial economy, which focused on commodities as the product of the economy. The era of service economy emphasized services, and the experience economy ensued, selling not only products and services but also “feelings”, which have greater added value. According to the progression of economic value (Figure 1) proposed by Pine and Gilmore (1999), customers generally pay only a small amount of money at the primary goods stage, but as they progress on to the experience level, consumers are willing to spend more money on purchases. This phenomenon also indicates that the benefits of experiences are evidently greater than those of the first three levels. Therefore, businesses can create greater value for their industry if they can orchestrate memorable experiences for consumers.
2.1.2. The Characteristics of Experiential Marketing
Experience economy is formed when an industry uses experiences to satisfy consumers’ needs and create economic value. The concept of experiential marketing is derived to facilitate the further development of the experience economy. Schmitt (1999) proposed the concept of experiential marketing, defining it as a process in which individual consumers observe or take part in an event where they are motivated to identify with an idea or engage in consumption behavior, and realize that a complete process of development is inevitably required to strengthen product value and create experiences for consumers.
Schmitt (1999) distinguished five methods of experiential marketing in his book, Experiential Marketing [11]. These are detailed in Table 2:
Table 2 shows that experiential marketing focuses on consumers’ product-purchasing process and their feelings after a purchase. It appeals to purchase decisions by using feelings so that people can interact with the products instead of merely buying a single product.
Hand-touch products attract people’s attention with their unique features and various tactile sensations. This method of appeal is a form of sense marketing in terms of experiential marketing. To achieve the overall experience effect, the other four modules of experiential marketing could be incorporated when necessary and combined with different marketing objectives to create more sales opportunities.
2.2. Hand-Touch Design
Humans have five basic senses: touch, sight, hearing, smell, and taste, of which touch is the most crucial sense in the sensory experience. Touch is most broadly distributed in the body and is the most complex sensory system, containing the greatest amount of information. The “hand” is most sensitive to touch, and the feeling experienced when touching something by hand becomes humans’ general perception as their way of thinking, life experiences, and knowledge accumulate [12]. Psychologically, elements specific to tactile sensory designs can also elicit feelings of having a life in consumers. These designs can reinforce memories and deepen experiences. A literature review reveals that scholars have different views and definitions of “hand-touch designs”, which are detailed in Table 3:
Table 3 indicates that hand-touch designs differ from other designs in that hand-touch products can create any form of experience and can interact with consumers to satisfy their emotional and physical needs. The details and textures of hand-touch products are also distinctively different to those of machine-made products. Hence, hand-touch products can be made to appeal to consumers by incorporating various design elements. The types of products integrating hand-touch designs are continuously increasing, which has also turned hand-touch designs into a marketing element. The experiences created by hand-touch products can create value that is unparalleled to other products, particularly in today’s experience society.
2.3. Kano Two-Dimensional Model
Determining consumers’ true product needs is often difficult. Even if the performance of a product is significantly improved, it can only contribute to sales. Take mobile phones as an example. Consumers do not feel more satisfied with a mobile phone if the phone has a text input function. By contrast, consumers tend to feel dissatisfied when they cannot type texts in their mobile phone. Hence, the relationship between consumer needs and product performance is no longer a traditionally recognized one-dimensional model but a two-dimensional model.
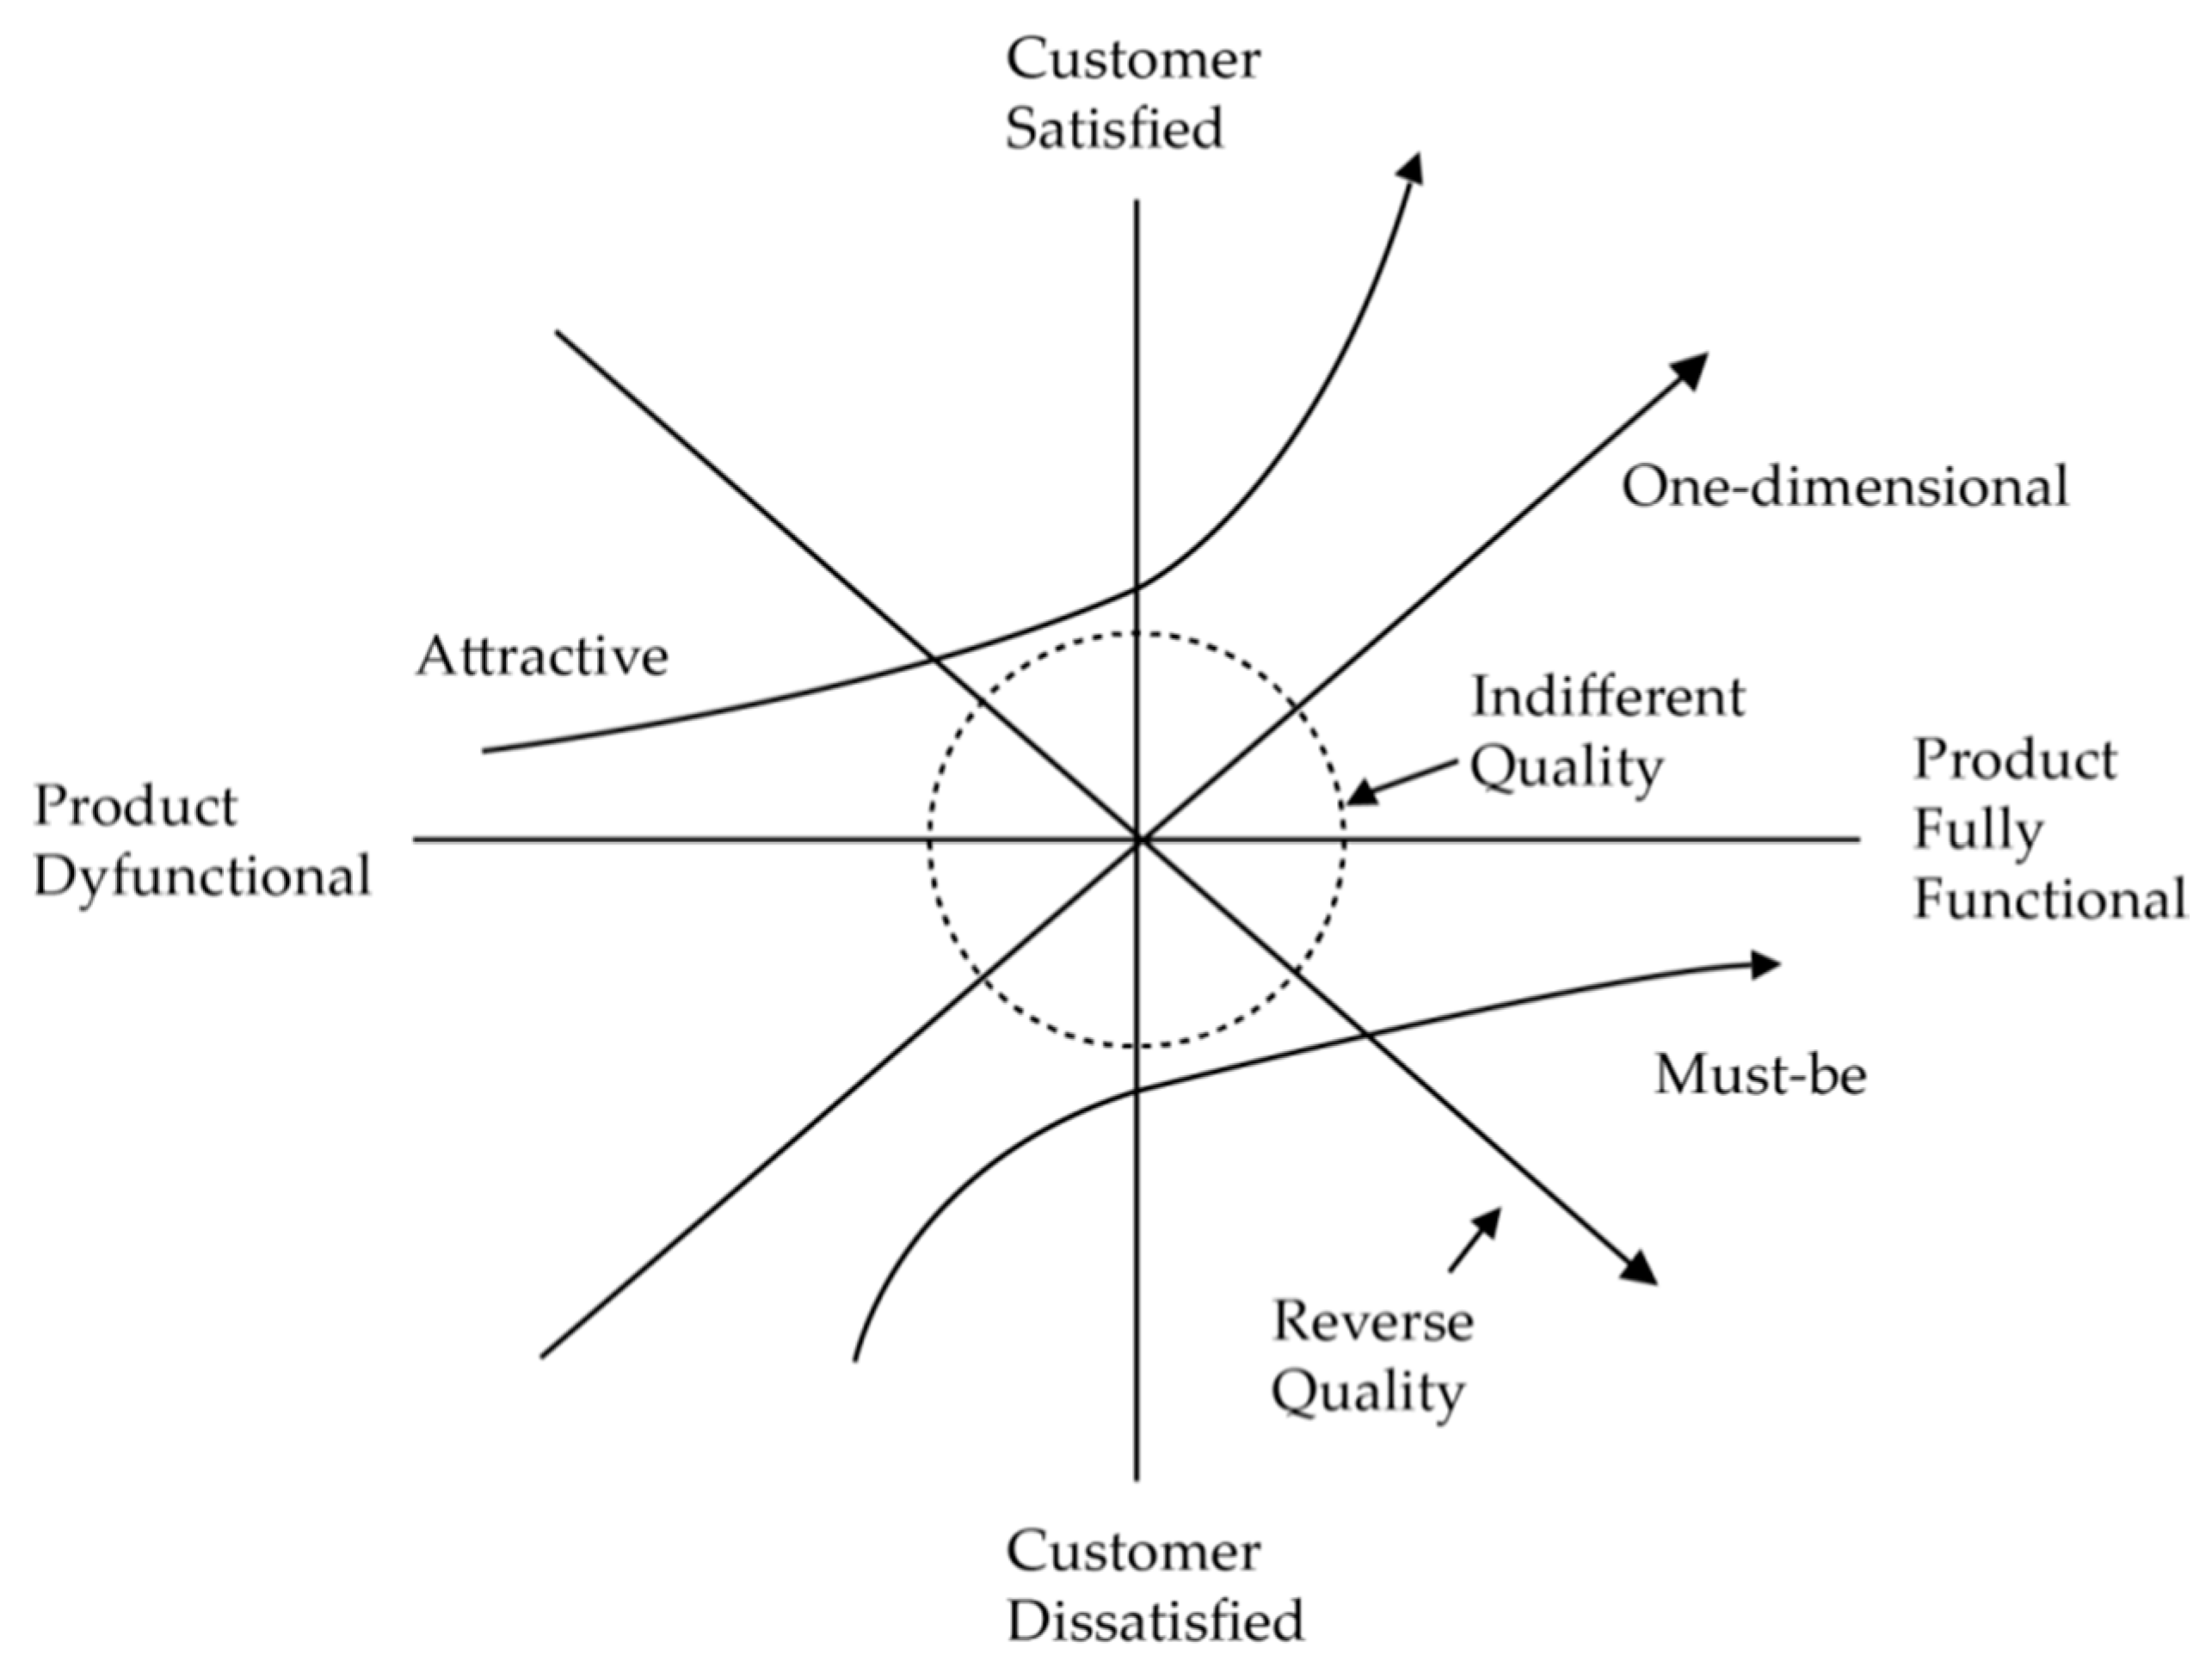
The two-dimensional model was proposed by the Japanese Scholar Noriaki Kano, who asserted that quality factors should be adequately categorized. In Kano’s two-dimensional model, the horizontal axis indicates the amount of quality factor. The right side of the horizontal axis represents a sufficiently high amount of quality factor, whereas the left side denotes an insufficient amount of quality factor. The vertical axis represents customer satisfaction; the upper axis denotes high satisfaction and the lower axis denotes low satisfaction (Figure 2).
Further analysis based on Figure 2 shows that consumers regard the must-be quality as the basic characteristic of a product or service. Irrespective of the amount of must-be quality factor, the curve does not cross the vertical axis; however, insufficient supply results in high customer dissatisfaction. One-dimensional quality reveals a linear relationship between consumer satisfaction and the supply of quality factor. The “higher” (lower) is the amount of one-dimensional quality, the “greater” is customer satisfaction (dissatisfaction). The upper curve in Figure 1 represents the attractive quality factor. The presence of attractive quality factor, even in minor amounts, can result in significantly improved customer satisfaction. Attractive quality factor must unexpectedly delight customers. Hence, attractive quality must be developed by suppliers themselves.
Overall, the level of consumer satisfaction with each factor can be measured on a linear scale of very satisfied to very dissatisfied. The assumption of this linear relationship can occasionally impede the identification of a quality factor that is truly important. Kano proposed not only a theoretical model but also methods for practice. Unlike general theories that mostly investigate customer preference, Kano’s model is focused on exploring the expectancy of consumers and factors influencing customer satisfaction [17]. When businesses have a better understanding of the quality factors that consumers value the most, they can then focus their development projects on these factors, thereby satisfying consumers’ true needs.
2.4. Summary
The rise of the experience economy has not only prompted businesses to produce products but also provided a platform on which consumers can gain unforgettable experiences. The primary characteristic of a hand-touch product is creating memorable experiences for consumers by allowing consumers to touch and feel the product. The experiences brought by hand-touch products lead to the formation of an experience economy for hand-touch products, which facilitates the promotion and sale of these products. This study adopted Kano’s two-dimensional model with the goal of identifying consumer needs for hand-touch product designs when conducting experiential marketing. The results can serve as the basis for expanding the content of experience relating to hand-touch products.
3. Research Method
3.1. Research Process and Methods
Jing (2006) asserted that that the scope of hand-touch products includes craftsmanship, DIY works, designer products, which are small in quantity and high in diversity, and industrial products characterized by tactile sensory elements. Event decorations, figurines, sundries, and pottery figurines are referred to as hand-touch products because of their tactile properties. The present study was conducted in the hope of contributing value-added effects to the design industry and increasing the value of hand-touch products. Hence, the research target of this study was sophisticated hand-touch products that are available in small quantities and wide varieties.
This study was conducted in two phases. The first phase involved finding pictures of hand-touch products and identifying representative works through data collection and expert discussion. The pictures obtained were used as reference images for the questionnaire survey. The procedures are detailed as follows:
- (1)
- First, websites of relevant businesses, works relating to hand-touch designs, newspaper reports and magazines, or Internet news were employed to collect pictures of a diverse range of exquisite hand-touch products, which are available in small quantities.
- (2)
- Subsequently, pictures with poor resolution and those taken at incorrect angles were eliminated. Ten works featuring tactile sensory characteristics were selected through expert group discussion. Three experts participated in the group discussion. Two of the experts are specialists of hand-touch designs and product designs. A media advertising expert was also invited given that the skills and scenarios in which these pictures were taken are important, because the selected pictures were used in the questionnaire survey. Table 4 show the experts’ basic information and selection criteria.
The second phase of the study entailed a quantitative analysis through a questionnaire survey to identify the factors influencing consumer needs for hand-touch product designs. The implementation procedures are described below. An online questionnaire was administered. More than 30 valid pretest questionnaires are expected, and more than 300 valid formal questionnaires are anticipated. Statistical software SPSS 22 was used for questionnaire analysis. Reliability analysis was performed first to test the reliability of the questionnaires. Next, descriptive statistics was performed, classifying quality factors into “attractive quality”, “one-dimensional quality”, “must-be quality”, “indifferent quality”, and “reverse quality”. Personal data of the respondents were also analyzed. Finally, a chi-square independence test was performed to ascertain the correlation between two eigenvalues when an element contained two characteristics.
3.2. Questionnaire Design
The first part of the questionnaire was the respondents’ personal information, including gender, age, education level, and experience in purchasing hand-touch products. The second part of the questionnaire was based on the Kano model. Item dimensions followed Schmitt’s (1999) experiential marketing framework, and several test questions were designed. Pictures selected in the first phase of the study were provided in the questionnaire for respondents’ reference. Table 5 presents the dimensions and items of the questionnaire.
In addition, the study conducted tests using a translated scale. Because of cultural differences, factors adopted overseas are not necessarily the same as those used in Taiwan; therefore, The criteria of EFA are based on the suggestions of Irvine and Carroll (1980) [21]:
- (1)
- The number of factors extracted from the original version and translated version is the same.
- (2)
- The items composed in each factor are the same.
- (3)
- The total variance of each factor is the same.
- (4)
- The intercorrelation among factors does not differ significantly.
In accordance with the two-dimensional concept, we designed the questionnaire to contain a set of positively and negatively worded questions, which can reveal respondents’ responses at the time. Below is a sample of the questionnaire; each theme contains a set of questions, each of which was given five response options: I like it; It must be that way; I am neutral; I don’t mind; I dislike it.

Because the research target of this study was sophisticated hand-touch products that are available in small quantities and wide varieties, the targets of the questionnaire survey were financially capable people aged 20 years or older. The questionnaire test targeted people who have a basic understanding of hand-touch products. Those who have never seen hand-touch products were excluded from the questionnaire test. Figure 3 shows the research framework of this study.
4. Research Results and Analysis
4.1. Questionnaire Results
4.1.1. Draft Questionnaire Pretest
The pretest questionnaire was administered online, with the objective of testing the feasibility of the questionnaire. In total, 32 questionnaires were retrieved, 30 of which were valid and 2 were invalid. Subsequently, the valid questionnaires were subjected to reliability analysis using SPSS 22.0 software. Questionnaire reliability was based on Cronbach’s α. According to Nunnally (1978) [22] and DeVellis (1991) [23], the reliability of a scale is tested by using Cronbach’s α, which is determined by the following criteria:
- (1)
- Cronbach’s α is calculated for all questionnaire items.
- (2)
- Each item is individually inspected.
- (3)
- Cronbach’s α is calculated for the questionnaire items of each factor dimension.
- (4)
- Cronbach’s α represents the reliability of a scale (as shown in Table 6).
Generally, the total reliability of a scale should be 0.7 or higher. The internal consistency of each factor should be at least higher than 0.6 for further analysis [24]. The questionnaire distributed in this study contained 34 items, and 30 questionnaires were retrieved. Reliability analysis showed that the Cronbach’s α was 0.829, suggesting that the questionnaire was valid, as shown in Table 7.
4.1.2. Formal Test Results
In total, 310 formal questionnaires were retrieved, 10 of which were invalid, yielding 300 valid questionnaires for subsequent analysis. The first part of the formal questionnaire was respondents’ personal information, which was statistically analyzed using frequency and percentage. The second part was the Kano model-based items; mean scores were used to analyze how the respondents classified the attributes of each item. Subsequently, the chi-square independence test was performed to compare the personal information against the questionnaire items and elucidate the differences in respondents’ views regarding the items.
4.2. Questionnaire Content Analysis
4.2.1. Statistical Structural Analysis of Personal Information
The results of the respondents’ personal information were analyzed using descriptive statistics. Regarding gender, 96 out of the 300 respondents were men (32%) and 204 were women (68%). Most of the respondents were aged between 20 and 39 years (n = 150; 50%), followed by those aged between 30 and 39 years (n = 70; 23.3%), 40 and 49 years (n = 59; 19.7%), 50 and 59 years (n = 16; 5.3%), and 60 years or older (n = 5; 1.7%). The majority of the respondents have graduated from university or college (n = 179; 60%), followed by graduate school or higher (n = 100; 33%), and high school or vocational school (n = 21; 7%). In addition, 182 (60.7) respondents have purchased hand-touch products, and 118 (39.3%) respondents did not.
4.2.2. Kano Two-Dimensional Factor Analysis
This section involved conducting a two-dimensional quality analysis on the retrieved questionnaires to identify the quality categories to which each item belonged. Yang (2004) classified the quality factors into five attributes [25]:
- (1)
- Attractive quality: If a quality requirement is not fulfilled, the consumer is not dissatisfied, but if it is fulfilled, the consumer is satisfied.
- (2)
- One-dimensional quality: Consumer satisfaction depends on the extent to which a quality requirement is fulfilled; the higher the fulfillment, the higher the consumer satisfaction, and vice versa.
- (3)
- Must-be quality: If a quality requirement is not fulfilled, the consumer is dissatisfied, but if it is fulfilled, the consumer takes it for granted and does not feel more satisfied.
- (4)
- Indifferent quality: Irrespective of whether a quality requirement is fulfilled, neither consumer satisfaction or dissatisfaction results.
- (5)
- Reverse quality: When a quality requirement is fulfilled, the consumer is dissatisfied, but if it is not fulfilled, the consumer is satisfied.
If the respondents’ answer is contradictory, the quality factor is deemed as questionable quality. Table 7 details the content of the data. This study employed the two-dimensional quality factor classification table (Table 8) as the statistical basis. Because each set of questions was positively and negatively worded, if the respondents answered “I like it” to positively worded questions and “I dislike it” to negatively worded questions, then the item can be interpreted as a one-dimensional factor. Each item was categorized using Kano’s factor classification approach. The results are shown in Table 9.
After the factors were categorized, we identified nine attractive quality attributes, three one-dimensional qualities attributes, five indifferent qualities attributes, and no must-be quality or reverse quality attributes.
4.2.3. Chi-Square Independence Test
The chi-square independence test was performed to examine whether the respondents with different demographic variables held significantly different views about the questionnaire items. A significant difference was indicated by a p-value < 0.05. The analysis results showed significant differences regarding gender and education level. In other words, men and women have held significantly different views regarding the items “the name of the product is creative and can relate to the product itself”, and “the advertising slogan of the product is creative and can relate to the product itself.” Table 10 and Table 11 provide details of the results.
4.3. Quality Improvement Indicators
Quality improvement indicators were proposed by Matzler and Hinterhuber (1998), as follows:
A: Attractive quality. O: One-dimensional quality. M: Must-be quality. I: Indifferent quality.
Indicator of increased satisfaction = (A + O)/(A + O + M + I)
Indicator of decreased dissatisfaction = (O + M)/(A + O + M + I)
These indicators can be used for further analysis. When a quality factor is improved, satisfaction can be increased or dissatisfaction can be decreased, thereby providing information on which quality aspects of hand-touch products require improvement in the future. When an indicator of increased satisfaction approaches 1, it means that the factor strongly influences consumer satisfaction; similarly, when an indicator of decreased dissatisfaction approaches 1, it means that the factor strongly influences consumer dissatisfaction. Table 12 presents the results.
Table 12 reveals that except for the following items, “the product incorporates sound (which appeals to sense of hearing)”, “images and detailed introduction of the product are provided”, “the product is endorsed by a spokesperson”, “the company launches peripherals related to the product”, and “the company introduces product-related trademarks”, the remaining factors can be considered for adoption, even if their indicator of decreased dissatisfaction is low, but if adopted they can greatly increase consumer satisfaction.
5. Conclusions and Suggestions
The rise of consumer awareness has increased the diversity of people’s product needs, thereby giving birth to the experience economy. The experiential marketing perspective and Kano’s two-dimensional factor analysis were employed in this study to identify consumers’ needs for hand-touch products when the strategy of experience economy is used. Identifying the true needs of consumers for hand-touch products can effectively enhance and improve product life cycle, and in turn develop sustainable products. Because this study did not infringe on the privacy of the study participants, proof of research ethics review was not required. It needs to be emphasized that if personal privacy related issues are involved in further studies, academic ethics and rules should be strictly obeyed and followed. In summary, the following research conclusion was drawn on the basis of the above indicator data.
5.1. Consumers Valued the Sense Marketing of Hand-Touch Products
According to the two-dimensional quality diagram (Figure 2), the attractive quality curve presented an upward trend, indicating that the existence of attractive quality factors generally results in greater customer satisfaction. According to the attribute categories in Table 13, nine of the factors investigated in this study and three factors in the sense marketing dimension belonged to the attractive quality category. This result shows that consumers valued the sensory aspect of hand-touch products. Hence, businesses could develop products with more color and size options and incorporate elements that appeal to the sense of smell to attract consumers’ attention.
5.2. Timely Use of Other Marketing Approaches Enables a Product to Effectively Meet Customers’ Needs
The growing number of experience-based products has increased the possibility of experiential marketing development for many industries. However, different industry characteristics create different types of experiences. Big-box stores provide a comfortable space to create pleasant shopping experiences for consumers. The tourism industry offers unique travel itineraries to orchestrate memorable experiences for tourists. Products are properly packaged or integrated with designs for all five senses to stimulate the sensory experiences of consumers. This study compiled a summary of recent experience-related studies and conducted further analyses corresponding to the five types of experiential marketing methods. Table 14 shows the summary of the experience-related studies.
Table 14 shows that product size directly influences the number of experiential marketing methods adopted. For example, private lodging operators and sports match organizers adopt all five experiential marketing methods to engage customers. Sense marketing and feel marketing strategies are used to promote Franz-porcelains, which are small products, to drive consumer purchase. Because hand-touch products are characteristically similar to Franz-porcelains, and consumers place a high value on sense marketing according to previous study results, sense marketing can be used as the main experiential marketing strategy. However, the other marketing methods mentioned in this study can still be used as a reference for the development of hand-touch products. For instance, two items in the think marketing module are attractive quality elements, and products designed with these two items can more closely meet the needs of customers.
5.3. Use of Cross Analysis to Identify Top-Priority Factors
In the two-dimensional model (Figure 2), the vertical axis represents customer satisfaction; the upper axis denotes high satisfaction, and the presence of the quality elements in the upper axis results in increased consumer satisfaction. From vendors’ perspectives, improvement in attractive quality elements and one-dimensional quality elements generates greater influence on consumer satisfaction compared to other quality elements. However, these elements must be implemented in a certain order of priority. The quality improvement indicator of increased satisfaction in this study is achieved when a certain element is improved. Therefore, a cross analysis of attractive quality elements, one-dimensional quality elements, and quality improvement indicators can identify the factors that must be implemented first in order to improve consumer satisfaction. Table 15 shows the detailed contents and data.
According to Table 15, the indicators of increased satisfaction were the highest for the following attractive quality elements: “The product incorporates elements that appeal to smell”, “The name of the product is creative and can relate to the product itself”, and “The advertising slogan of the product is creative and can relate to the product itself.” The one-dimensional quality element, “The product can be touched before purchase”, had the highest indicator of increased satisfaction (0.82). These elements are implemented using more active marketing methods. Therefore, business owners could focus on these elements to increase consumer satisfaction exponentially with half the effort.
Founding
This research was funded Ministry of Science and Technology number: 107-2410-H-224-033.
Author Contributions
C.-H.Y. designed and drafted the paper; C.-H.Y. collected and analyzed the data; J.-C.T. The article guides and provides valuable advice.
Acknowledgments
The authors would like to thank the support of the Ministry of Science and Technology (Project No.: 107-2410-H-224-033), who facilitated the successful completion of this research.
Conflicts of Interest
The authors declare no conflict of interest.
References
- Chen, S.H. The Exploration and Creation of Hand-Touch Design Style. Master’s Thesis, National Taiwan Normal University, Taipei, Taiwan, 2011. [Google Scholar]
- Jing, Y.M.; Liu, W.G.; Wu, Z.Y. Hand-Touch Economy: The Fashion of Feelings; CommonWealth Magazine: Taipei, Taiwan, 2006; pp. 3, 5, 12. [Google Scholar]
- Chiou, C.T. The Strategies of Creative Living Industry in Taoyuan under the Trend of Experience Economy. J. State Soc. 2015, 17. [Google Scholar]
- Pine, B.J., II; Gilmore, J.H. The Experience Economy: Work as Theater and Every Business a Stage; Harvard Business School Press: Boston, MA, USA, 1999. [Google Scholar]
- Schmitt, B.H. Experiential Marketing: How to Get Consumer to Sense, Feel, Think, Act, and Relate to Your Company and Brands; Free Press: New York, NY, USA, 1999. [Google Scholar]
- Esgate, P. Pine and Gilmore Stages A Fourth Think about Experience. Strategy Leadersh. 2002, 30, 47. [Google Scholar] [CrossRef]
- Shen, C.C.; Yang, W.C. A Study of the Relationship among Consumer’s Experience, Experiential Value and Brand Equity of Resort Hotel—A Case Study of Janfusun Prince Hotel. Tour. Manag. Res. 2007, 7, 55–81. [Google Scholar]
- Huang, J.H. A Study on Experiential Marketing of Road Running-2014 CONQUER TAIWAN. J. Both Sides Taiwan Strait Phys. Educ. Sports 2015, 9, 71–81. [Google Scholar]
- Yeh, T.M.; Wu, H.Y. The Relationships among Visitor Experiential Marketing, Service Quality, Consumer Satisfation and Loyalty of Tourism Factories. J. SME Dev. 2015, 31, 101–132. [Google Scholar]
- Pine, B.J., II; Gilmore, J.H. The Experience Economy; Hsia, Y.L.; Lu, W., Translators; Cite Publishing: Taipei, Taiwan, 2003. [Google Scholar]
- Schmitt, B.H. Experiential Marketing; Wang, Y.Y.; Liang, H.Y., Translators; Classic Communication Publishing: Taipei, Taiwan, 2000. [Google Scholar]
- Chou, H.Y. Contemporary Trend of Emotive Experiential Design—A Case Study of Handicrafts. Master’s Thesis, National Taichung Institute of Technology, Taichung, Taiwan, 2010. [Google Scholar]
- Chi, Y.C. Los Artesanos de Espana; Locus Publishing: Taipei, Taiwan, 2007. [Google Scholar]
- Huang, S.C.; Lai, C.S. The Analysis on Benefit Evaluation and Value of Hand-touch Products. J. Natl. United Univ. 2008, 5, 159–180. [Google Scholar]
- Murata, C. Touch of Design; My House Publishing: Taipei, Taiwan, 2008. [Google Scholar]
- Chuang, P.H. Hand-Touch Craftsmanship: A Proposal for a Beautiful Life; My House Publishing: Taipei, Taiwan, 2017. [Google Scholar]
- Jane, A.C.; Dominguez, S.M. Citizens’ Role in Health Services: Satisfaction Behavior: Kano’s Model, Part1. Qual. Manag. Health Care 2003, 12, 64–71. [Google Scholar] [CrossRef]
- Lee, J.; Nguyen, M.J. Product attributes and preference for foreign brands among Vietnamese consumers. J. Retail. Consum. Serv. 2017, 35, 76–83. [Google Scholar] [CrossRef]
- Tynan, C.; McKechnie, S. Experience Marketing: A review and reassessment. J. Mark. Manag. 2009, 25, 501–517. [Google Scholar] [CrossRef]
- Brakus, J.J.; Schmitt, B.H.; Zarantonello, L. Brand Experience: What is it? How is it Measured? Does it Affect Loyalty? J. Mark. 2009, 73, 52–68. [Google Scholar] [CrossRef]
- Irvine, S.H.; Carroll, W.I. Testing and assessment across cultures: Issues in methodology and theory. In Handbook of Cross-Cultural Psychology; Triandis, H.C., Berry, J.W., Eds.; Allyn and Bacon: Boston, MA, USA, 1980; Volume 2. [Google Scholar]
- Nunnally, J.C. Psychometric Theory; McGraw-Hill: New York, NY, USA, 1978. [Google Scholar]
- Devellis, R.F. Scale Development: Theory and Applications; SAGE: Newbury Park, CA, USA, 1991. [Google Scholar]
- Yang, S.Y. SPSS 22 Statistical Analysis; GOTOP Information: Taipei, Taiwan, 2014. [Google Scholar]
- Yang, J.Z. Quality Management for the Service Sector; Chinese Society for Quality: Taipei, Taiwan, 2004. [Google Scholar]
- Chen, C.Y. The Effectiveness of Experiential Marketing for New Products in Existent Channels. J. Cust. Satisf. 2012, 8, 1–29. [Google Scholar]
- Theilgaard, K. The Growth of the National Basketball Association Explained by the Experience Economy and Sport Empire Theory; Roskilde University: Roskilde, Denmark, 2012. [Google Scholar]
- Hsiao, Y.C. The Exploration of Cultural and Creative Product Design of Shetou Hosiery Industry in the Way of Experiencing Economy. Master’s Thesis, Chaoyang University of Technology, Taichung, Taiwan, 2013. [Google Scholar]
- Tao, S.P. Experience, Personality, Creative Cognition and Loyalty on Creative Products: A Case Study of Franz. Mark. Rev. 2013, 10, 1–17. [Google Scholar]
- Sadachar, A. Indian Consumers’ Patronage Intention toward Shopping Malls: Application of An Experience Economy Perspective. Doctor’s Dissertation, Iowa State University, Ames, IA, USA, 2014. [Google Scholar]
- Liao, H.C. Applying Experiential Marketing Strategy on Attracting Customers into the Brick-and-Mortar Stores. Master’s Thesis, Chinese Culture University, Taipei, Taiwan, 2016. [Google Scholar]
- Hung, S.C. The Experiential Marketing Strategies of Homestay in Taiwan—A Case Study of Coffeeshen. Master’s Thesis, Southern Taiwan University of Science and Technology, Tainan, Taiwan, 2018. [Google Scholar]
Figure 1.
Progression of economic value.

Figure 2.
Diagram of Kano Two-Dimensional Model.

Figure 3.
Research framework.


Table 1.
Views and Definition of Experience.
| Literature Autor | Content |
|---|---|
| Pine and Gilmore (1999) [4] | Experience is the positive feeling generated from the perfect balance formed consciously when an individual has been engaged on an emotional, physical, intellectual, or even spiritual level. No two people can have the same experience, because each experience is derived from the interaction between the individual’s state of mind and the staged event. |
| Schmitt (1999) [5] | Experience is a response to a stimulus that is generally induced and not spontaneously generated. Experience is considered a type of response to a certain stimulus, and the process of an experience includes the essence of one’s entire lifestyle. Such a response is the result of direct observation or participation in an event, irrespective of whether the event is real, a fantasy, or a virtual reality. |
| Esgate (2002) [6] | Experience makes up the core of a transaction. |
| Shen, C.C; Yang, W.C. (2007) [7] | “Experience” is a subjective psychological feeling that is unforgettable in the mind of consumers, created through the interaction between the individual’s state of mind and the environment during the participation in an activity. |
| Huang, J.H. (2015) [8] | Feel and think modules are most profound in experiential marketing. Participants’ feelings of an experience positively influence their level of identification with an activity, and in turn inspire more people to partake in this activity. |
| Yeh, T.M.; Wu, H.Y. (2015) [9] | Experiential marketing is not focused on the product itself; it offers cognitive, perceptive, emotional, and behavioral scenarios that enable interactions between consumers and the product. In other words, it is not only a thing that consumers want to buy; they also want to buy a story, a feeling, and even a sense of identification. |
Table 2.
Methods of Experiential Marketing.
| Marketing Method | Content |
|---|---|
| Sense | Sense marketing creates five sensory experiences for consumers, with the objective of creating sensory experiences through sight, sound, touch, taste, and smell. This method can be used to differentiate companies and products, to motivate consumers, and to add value to products. |
| Feel | When consumers relate to a product through positive emotional experiences, they develop a stronger sense of enjoyment toward the product. These emotions generally develop during the consumption period. |
| Think | Think marketing encourages consumers to think creatively, prompting them to reevaluate the brand and product. Consumers are guided through procedures to think about the product or brand, thereby realizing the uniqueness and distinctiveness of the business and its brand. |
| Act | Act marketing targets the physical experiences, lifestyles, and interactions with which to influence or change the lifestyles or practices and lives of consumers. Changes in consumers can be directly triggered through external marketing, or the outside world could induce consumers to change spontaneously. |
| Relate | Relate marketing contains aspects of sense, feel, think, and act marketing. It appeals to an individual’s desire for self-improvement. They appeal to the need to be perceived positively by other individuals and relate the person to a broader social system, thus leading to a personal preference for a certain brand, and simultaneously enabling brand users to form a community. |
Source: Compiled by this study.
Table 3.
Views and Definitions of Hand-Touch Designs.
| Literature Autor | Content |
|---|---|
| Jing, Y.M. (2006) [2] | Hand-touch products include craftsmanship, DIY works, designer products, which are small in quantity and high in diversity, and industrial products that appeal to inner emotions and tactile sensations. |
| Liu, W.G. (2007) [2] | Tactile sensation is a physical feeling. Every feeling created in an era governed by experience consumption gives birth to a market niche. Because of their originality and aesthetic value (i.e., a high level of authenticity), hand-touch products are a powerful catalyst, guiding consumers into a world where experiences cannot be created by general consumer goods. |
| Chi, Y.C. (2007) [13] | In European countries, handcrafting is not only a new trend but also a way of living that focuses on feeling the joy in making craftworks by hand. Handcrafting can be considered a healthy art that energizes people both physiologically and psychologically. |
| Huang, S.H.; Lai, C.S. (2008) [14] | Hand-touch products enable consumers to feel cheerful, satisfied, proud, accomplished, pragmatic, enjoy life, sweet, valuable, confident, and different from others, and also to recall memories. |
| Chiaki Murata (2008) [15] | Tactile sensation is not only the sensation given by something when touched but also the tactile feeling that is perceived from visual images. |
| Chuang, P.H. (2017) [16] | Hand-touch designs involve understanding the aesthetics of art through practice and are not associated with any profound principles. For most artwork, anyone, including artists, users, or appreciators, can easily understand the aesthetics of these artworks by touching them. Even if they cannot touch these works, they could still visually perceive the quality, texture, and weight and obtain any tactile information from these artworks. |
Table 4.
Experts’ basic information and selection criteria.
| No. | Area of Expertise | Job Title | Selection Criteria |
|---|---|---|---|
| 01 | Media advertising and network publishing design | Professor |
|
| 02 | Cultural and creative product design and ceramic art design | Product designer |
|
| 03 | Metal craft and silver accessory design | Design Director |
|
Table 5.
The Dimensions and items of the questionnaire.
| Dimension | Item | Reference Scale |
|---|---|---|
| Sense | The outer appearance of the product is available in different colors. | Lee, Nguyen (2017) [18] |
| The product is available in different sizes. | ||
| The product incorporates elements that appeal to smell. | ||
| The product incorporates sound (which appeals to sense of hearing). | ||
| Images and detailed introduction of the product are provided. | ||
| Feel | A complete set of design concepts for sample products is provided. | Tynan and McKechnie (2009) [19] |
| The product incorporates effects that induce all types of emotional responses in people. | ||
| The product can be purchased through multiple channels. | ||
| Think | The name of the product is creative and can relate to the product itself. | Tynan and McKechnie (2009) [19] |
| The advertising slogan of the product is creative and can relate to the product itself. | ||
| More product details are provided (e.g., material, raw material used, etc.) | ||
| Act | The product can be touched before purchase. | Brakus, Schmitt, and Zarantonello (2009) [20] |
| The company organizes an exhibition event for the product. | ||
| The product is endorsed by a spokesperson. | ||
| Relate | The company launches peripherals related to the product. | Brakus, Schmitt, and Zarantonello (2009) [20] |
| The company introduces product-related trademarks. | ||
| The company asks for after-sale feedback from consumers. |
Table 6.
Meaning of Cronbach’s α in terms of reliability.
| Reliability | Cronbach’s α |
|---|---|
| Excellent reliability | 0.80 < α ≤ 0.90 |
| Favorable reliability | 0.70 < α ≤ 0.80 |
| Minimally acceptable reliability | 0.65 < α ≤ 0.70 |
| Insufficient reliability | 0.60 < α ≤ 0.65 |
Table 7.
Reliability analysis of the pretest questionnaire.
| Reliability Statistics | ||
|---|---|---|
| Cronbach’s Alpha | Number of questionnaire items | Number of respondents |
| 0.829 | 34 | 30 |
Table 8.
Two-dimensional quality factor classification.
| Negatively | I Like It | It Must Be That Way | I Am Neutral | I Don’t Mind | I Dislike It | |
|---|---|---|---|---|---|---|
| Positively | ||||||
| I like it | Questionable quality | Attractive quality | Attractive quality | Attractive quality | One-dimensional quality | |
| It must be that way | Reverse quality | Indifferent quality | Indifferent quality | Indifferent quality | Must-be quality | |
| I am neutral | Reverse quality | Indifferent quality | Indifferent quality | Indifferent quality | Must-be quality | |
| I don’t mind | Reverse quality | Indifferent quality | Indifferent quality | Indifferent quality | Must-be quality | |
| I dislike it | Reverse quality | Reverse quality | Reverse quality | Reverse quality | Questionable quality | |
Table 9.
Questionnaire item attributes.
| Category | Items | M | O | A | I | R | Q | Kano Quality Attributes |
|---|---|---|---|---|---|---|---|---|
| Sense | The outer appearance of the product is available in different colors. | 2% | 5% | 37.5% | 32% | 17.5% | 6% | A |
| The product is available in different sizes. | 3% | 10% | 50.6% | 28% | 2% | 6.4% | A | |
| The product incorporates elements that appeal to smell. | 1% | 4% | 42.5% | 3.3% | 24.6% | 3.3% | A | |
| The product incorporates sound (which appeals to sense of hearing). | 0% | 1.6% | 27% | 44.4% | 23.7% | 3.3% | I | |
| Images and detailed introduction of the product are provided. | 10.4% | 22% | 30.3% | 31.6% | 2% | 3.7% | I | |
| Feel | A complete set of design concepts for sample products is provided. | 5.7% | 24.6% | 40.2% | 26.5% | 0% | 3% | A |
| The product incorporates effects that induce all types of emotional responses in people. | 0.3% | 14% | 56% | 23% | 2.7% | 4% | A | |
| The product can be purchased from multiple channels. | 6.3% | 35.3% | 28.9% | 24.5% | 2% | 3% | O | |
| Think | The name of the product is creative and can relate to the product itself. | 3.7% | 20.6% | 55.4% | 17% | 0% | 3.3% | A |
| The advertising slogan of the product is creative and can relate to the product itself. | 2.2% | 22.6% | 52.7% | 18.2% | 0% | 4.3% | A | |
| More product details are provided (e.g., material, raw material used, etc.) | 13.4% | 36.6% | 25% | 21% | 1% | 3% | O | |
| Act | The product can be touched before purchase. | 3.7% | 42.7% | 35.2% | 13.7% | 1% | 3.7% | O |
| The company organizes exhibition event for the product. | 1.8% | 10.4% | 48% | 36.1% | 1% | 2.7% | A | |
| The product is endorsed by a spokesperson. | 0% | 3.3% | 33% | 58.4% | 3.3% | 2% | I | |
| Relate | The company launches peripherals related to the product. | 1% | 5.7% | 43.5% | 44.2% | 2.3% | 3.3% | I |
| The company introduces product-related trademarks. | 5% | 10% | 31.4% | 49.6% | 1% | 3% | I | |
| The company asks for after-sale feedback from consumers. | 9.2% | 22% | 33.4% | 29.7% | 1% | 4.7% | A |
M: Must-be quality. O: One-dimensional quality. A: Attractive quality. I: Indifferent quality. R: Reverse quality. Q: Questionable quality.
Table 10.
Gender and chi-square independence test.
| Items | Gender | Chi-Square Value | p-Value | |
|---|---|---|---|---|
| The name of the product is creative and can relate to the product itself. | male | female | 13.298 | 0.004 * |
| The advertising slogan of the product is creative and can relate to the product itself. | male | female | 22.088 | 0.000 *** |
Note: ** p ≤ 0.05; ** p ≤ 0.01; *** p ≤ 0.001.
Table 11.
Education level and chi-square independence test.
| Items | Educational | Chi-Square Value | p-Value | ||
|---|---|---|---|---|---|
| The product incorporates elements that appeal to smell. | High school or vocational school | University or college | graduate school or higher | 35.782 | 0.000 *** |
| The product can be purchased from multiple channels. | High school or vocational school | University or college | graduate school or higher | 77.524 | 0.000 *** |
| The advertising slogan of the product is creative and can relate to the product itself. | High school or vocational school | University or college | graduate school or higher | 49.346 | 0.000 *** |
Note: * p ≤ 0.05; ** p ≤ 0.01; *** p ≤ 0.001.
Table 12.
Quality improvement indicators of each factor.
| Category | Items | Indicator of Increased Satisfaction | Indicator of Decreased Dissatisfaction |
|---|---|---|---|
| Sense | The outer appearance of the product is available in different colors. | 0.56 | 0.09 |
| The product is available in different sizes. | 0.66 | 0.14 | |
| The product incorporates elements that appeal to smell. | 0.92 | 0.1 | |
| The product incorporates sound (which appeals to sense of hearing). | 0.39 | 0.02 | |
| Images and detailed introduction of the product are provided. | 0.54 | 0.34 | |
| Feel | A complete set of design concepts for sample products is provided. | 0.67 | 0.31 |
| The product incorporates effects that induce all types of emotional response in people. | 0.75 | 0.15 | |
| The product can be purchased from multiple channels. | 0.68 | 0.48 | |
| Think | The name of the product is creative and can relate to the product itself. | 0.79 | 0.25 |
| The advertising slogan of the product is creative and can relate to the product itself. | 0.79 | 0.26 | |
| More product details are provided (e.g., material, raw material used, etc.) | 0.64 | 0.52 | |
| Act | The product can be touched before purchase. | 0.82 | 0.49 |
| The company organizes exhibition events for the product. | 0.61 | 0.13 | |
| The product is endorsed by a spokesperson. | 0.38 | 0.03 | |
| Relate | The company launches peripherals related to the product. | 0.52 | 0.07 |
| The company introduces product-related trademarks. | 0.43 | 0.15 | |
| The company asks for after-sale feedback from consumers. | 0.59 | 0.33 |
Table 13.
Item attribute categories.
| Quality | Items | Marketing Method |
|---|---|---|
| Attractive quality | The outer appearance of the product is available in different colors. | Sense |
| The product is available in different sizes. | Sense | |
| The product incorporates elements that appeal to smell. | Sense | |
| A complete set of design concepts for sample products is provided. | Feel | |
| The product incorporates effects that induce all types of emotional responses in people. | Feel | |
| The name of the product is creative and can relate to the product itself. | Think | |
| The advertising slogan of the product is creative and can relate to the product itself. | Think | |
| The company organizes exhibition event for the product. | Act | |
| The company asks for after-sale feedback from consumers. | Relate | |
| One-dimensional quality | The product can be purchased from multiple channels. | Feel |
| More product details are provided (e.g., Material, raw material used, etc.) | Think | |
| The product can be touched before purchase. | Act | |
| Must-be quality | None | None |
| Indifferent quality | The product incorporates sound (which appeals to sense of hearing). | Sense |
| Images and detailed introduction of the product are provided. | Sense | |
| The product is endorsed by a spokesperson. | Act | |
| The company launches peripherals related to the product. | Relate | |
| The company introduces product-related trademarks. | Relate | |
| Reverse quality | None | None |
Table 14.
Studies on different patterns of experience economy.
| Literature Autor | Research Topics | Product Type | Marketing Method |
|---|---|---|---|
| Chen, C.Y. (2012) [26] | The Effectiveness of Experiential Marketing for New Products in Existent Channels | New Products | Sense, Feel |
| Kasper Theilgaard (2012) [27] | The Growth of the National Basketball Association Explained by the Experience Economy and Sport Empire Theory | Professional game | Sense, Feel, Think, Act, Relate |
| Hsiao, Y.C. (2013) [28] | The exploration of cultural and creative product design of Shetou hosiery industry in the way of experiencing economy | Experience activity | Sense, Feel, Relate |
| Tao, S.P. (2013) [29] | Experience, Personality, Creative Cognition, and Loyalty on Creative Products: A Case Study of Franz | Franz | Sense, Feel |
| Amrut Sadachar (2014) [30] | Indian consumers’ patronage intention toward shopping malls: Application of an experience economy perspective | Retail stores and shopping malls | Sense, Act, Relate |
| Liao, H.C. (2016) [31] | Applying Experiential Marketing Strategy to Attracting Customers into Brick-and-Mortar Stores | Big-box store | Sense, Act, Relate |
| Hung, S.C. (2018) [32] | The Experiential Marketing Strategies of a Homestay in Taiwan—A Case Study of Coffeeshen | private lodging operators | Sense, Feel, Think, Act, Relate |
Table 15.
Cross analysis of attractive quality elements, one-dimensional quality elements, and quality improvement indicators.
Table 15.
Cross analysis of attractive quality elements, one-dimensional quality elements, and quality improvement indicators.
| Quality | Items | Indicator of Increased Satisfaction |
|---|---|---|
| Attractive quality | The outer appearance of the product is available in different colors. | 0.56 |
| The product is available in different sizes. | 0.66 | |
| The product incorporates elements that appeal to smell. | 0.92 | |
| A complete set of design concepts for sample products is provided. | 0.67 | |
| The product incorporates effects that induce all types of emotional response in people. | 0.75 | |
| The name of the product is creative and can relate to the product itself. | 0.79 | |
| The advertising slogan of the product is creative and can relate to the product itself. | 0.79 | |
| The company organizes exhibition events for the product. | 0.61 | |
| The company asks for after-sale feedback from consumers. | 0.59 | |
| One-dimensional quality | The product can be purchased from multiple channels. | 0.68 |
| More product details are provided (e.g., Material, raw material used, etc.) | 0.64 | |
| The product can be touched before purchase. | 0.82 |
© 2019 by the authors. Licensee MDPI, Basel, Switzerland. This article is an open access article distributed under the terms and conditions of the Creative Commons Attribution (CC BY) license (http://creativecommons.org/licenses/by/4.0/).
Share and Cite
MDPI and ACS Style
Tu, J.-C.; Yang, C.-H. Consumer Needs for Hand-Touch Product Designs Based on the Experience Economy. Sustainability 2019, 11, 2064. https://doi.org/10.3390/su11072064
AMA Style
Tu J-C, Yang C-H. Consumer Needs for Hand-Touch Product Designs Based on the Experience Economy. Sustainability. 2019; 11(7):2064. https://doi.org/10.3390/su11072064
Chicago/Turabian StyleTu, Jui-Che, and Cheng-Hsueh Yang. 2019. "Consumer Needs for Hand-Touch Product Designs Based on the Experience Economy" Sustainability 11, no. 7: 2064. https://doi.org/10.3390/su11072064
Note that from the first issue of 2016, this journal uses article numbers instead of page numbers. See further details here.